C.P. No. 1120 MINISTRY OF TECHNOLOGY AERONAUTKAL RESEARCH COUNCIL CURRENT PAPERS Vertical Acceleration in the Cockpit of .a Subsonic Transport Aircraft during Take-off Measured during Airline Operation by C. G. 6. Mitchell Structures Dept., R.A.E., Fornborough LONDON: HER MAJESTY’S STATIONERY OFFICE 1970 PRICE 9s Od [45p] NET
Transcript
C.P. No. 1120
MINISTRY OF TECHNOLOGY
AERONAUTKAL RESEARCH COUNCIL
CURRENT PAPERS
Vertical Acceleration in the Cockpit of .a Subsonic Transport Aircraft during
Take-off Measured during Airline Operation
by C. G. 6. Mitchell
Structures Dept., R.A.E., Fornborough
LONDON: HER MAJESTY’S STATIONERY OFFICE
1970
PRICE 9s Od [45p] NET
U.D.C. 531.773 : t29.73.081 : 534.13 : 629.137.1
C.P. No. 1120' October 1969
VERTICAL ACCELERATION IN THZ COCKPIT OF A SUBSONIC TRANSPORT AIRCRAFT DURING TAKE-OFF MEASURED DURING AIRLINE OPERATION
by
C. G. B. Mitchell Structures Department, R.A.E., Farnborough
SUMMARY
Vertical acceleration in the cockpit of a Boeing 707-436 during take-off has been measured for 94 take-offs from 31 airports during airline operations. The vertical acceleration near the centre of gravity was measured during 33
take-offs. The maximum cockpit incremental acceleration was 0.75 g, and this acceleration exceeded 0.53 g for 10% of the take-offs. At a given airport the cockpit acceleration at a weight of 140 000 kg was about twice that at 90000 kg but the cg acceleration did not vary with weight. The amplitude of the cockpit acceleration varied between airports by a factor of about two at 115 000 kg. The cockplt/cg acceleration ratio was between 0.9 and 2.3, but for more than 80% of take-offs was between 7.0 and 1.5. The vibration levels experienced had no detectable effect on errors of rotation speed at take-off.
Some 01‘ the largest accelerations experienced by transport aircraft occur while they are taxying before take-off and after landing. These accelerations are significant in themselves, because they cause crew and passenger discomfort, and they are also significant as an indication of structural loading, at least
in the vicinity of the undercarriage units and on the fuselage. There is,
however, relatively little information on the vibration levels experienced in the cockpits of jet transport aircraft during taxying.
Morris' has measured the response of a Boeing 720 taxying on three runways at two North American international airports. The response quantities measured were the cockpit normal and lateral a&elerations, and the centre of gravity normal acceleration. Power spectra of the responses were calculated, and from these transfer functions for the response of the linearised model of the air- craft could be calculated, as the runway profiles had been measured and the power spectra of the runway roughness calculated. These measurements showed that the rms normal acceleration in the cockpit exceeded that at the centre of gravity by between 45% and 110%. On the roughest runway, the maximum normal accelerations were about 0.28gnear the centre of gravity and 0.50 g in the cockpit. During take-off, the lateral acceleration in the cockpit was approxi- mately half the normal acceleratior while, during landing, the lateral
acceleration was about three quarters the normal. The power spectra of the normal accelerations during taxying showed peaks due to pitching of the aircraft at : Hz (c/s), heaving of the aircraft at 1s Hz, snd structural modes at frequencies of 4 Hz, 5s Hz, and higher frequencies.
h
Hall6 has measured vibration levels m a VC 10 during take-off from
runway 06124 at Boscombe Down. Again, the quantities measured were the cockpit normal and lateral accelerations, and the centre of gravity normal acceleration. Power spectra of the measured responses were calculated and
showed similar response modes to those of the Boeing 720. Hall showed that the level of vibration increased as the aircraft speed increased. The largest acceleration level in the cockpIt was 0.46 g and the largest near the centre of gravity was 0.17 g. For both the Boeing 720 and the VC 70 the maximum acceleration that occurred during a take-off run was approximately four times the ram acceleration for that run.
As part of the Civil Aircraft Axvorthiness Data Recording Progrsnmm (CAADRP)3, a Boeing 707-456 four jet transport aircraft has been fitted with a
4 215
number of instruments to enable the normal accelerations at the cockpit and centre of gravity to be measured, together with the air speed, altitude, control positions and a number of other parsmeters. This Report analyses the accelerations measured during 94 take-offs made by this aircraft during commercial operations in December 1965 and January and February 1966. Buring
this time, records were made at thirty-one airports. It is complementary to Ref.4, which contains a description of the characteristics of the cockpit normal acceleration during twenty-five take-offs and twenty-five landings on the same au-craft.
^ hf.EA.smNT PRO-
2.7 Aircraft and instrumentation
The aircraft was a Boeing 707-436 four jet passenger transport operated by a Brl"i-3 airline " i)l . Buring the period considered, the marimum weight at which a take-off was made was 141 080 kg snd the minimnm take-off weight was 79950 kg. The average weight for all 94 take-offs was 120 540 kg.
The nxsasurements that were of interest to this particular investigation were those of cockpit vertical acceleration, cg vertical acceleration, air speed and elevator position; these and other parameters were recorded on photographic paper 9 cm wide, using a SFIM" ~26'1 recorder. This recorder runs at a nominal paper speed of 37.5 mm/min during the take-off and landing of the aircraft.
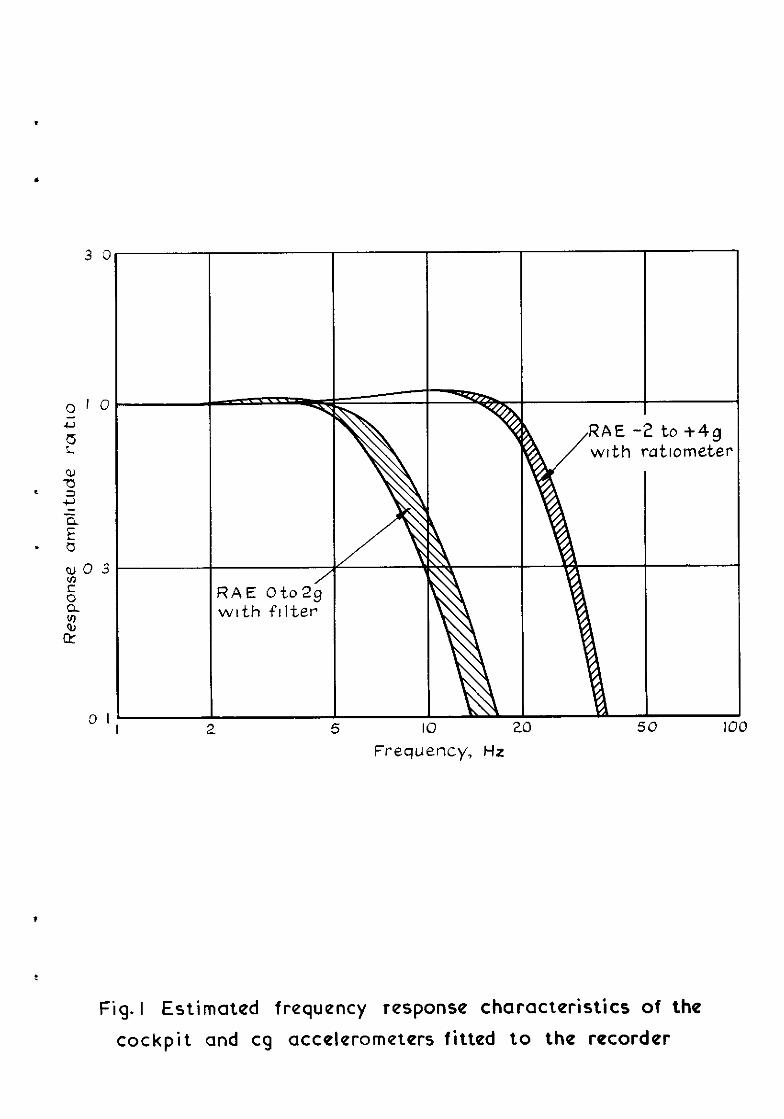
The air speed measurement was derived from a pressure capsule, mounted in the recorder, and connected to the Yst officer's pitot-static system. The elevator angle was not measured directly. A potentiometer was used to measure the control column movement, end the actual control surface movement is primarily a function of this control column displacement and the aircraft speed. The vertical acceleration near the cg was measured by an R.A.E. -2 g to +4 g accelerometer of the variable inductance, eddy current damped, type, which directly drove a ratiometer mounted in the recorder. The vertical acceleration in the cockpit was measured by an R.A.E. 0 g to +2 g accelerometer, the output from which was filtered electrically, mounted on a floor beam 3 ft (0.9 m) behind the Captain's seat. This accelerometer, without the electrical filter, 1s described m Ref.5, and the -2 g to +4 g accelerometer is a modification of the same design. The frequency response characteristics of both the accelero- meter systems connected to the recorder are shown in F1g.l.
* Societe' de Fabrication de*Inst-nts de Mesure.
.
2’15 5
2.2 AirpOrtS
Jjuring the period considerei, take-offs were mads from thirty-one air- ports; these are identified by numbers in this Report and were located in Australia, Burma, Canada, Islands in the Caribbean, Germany, Hong Kong, India, Iran, Israel, Italy, Japan, Lebanon, Malaysia, New Zealand, Islands in the Pacific, Switzerland, Thailand, United Kingdom and the U.S.A. The airports are believed to be representative of the operator's routes as all take-offs that were recorded were analysed. However, the recorder was replenished at the operator's main base and ran out of paper at some point on the route. This may have slightly biased the sample of airports at which take-offs were recorded. The paper supply for the recorder was sufficient to cover more than one trip from the main base along the route and back. The runwsy used and the wind conditions are only known for twenty-five of the ninety-four take-offs.
2.3 Analysis of the records
A typical record is shown in Fig.2. The cockpit vibration can be seen to occur at $Hz, which is due to pitching of the aircraft, l*Rz due to heaving and at higher frequencies due to structural vibration. Because of the low paper speed through the recorder it has not been possible to determine the frequency of the vibration if this was greater than about 2 Hz. It can also be seen that interference occurs between the speed trace and the two accelera- tion traces.
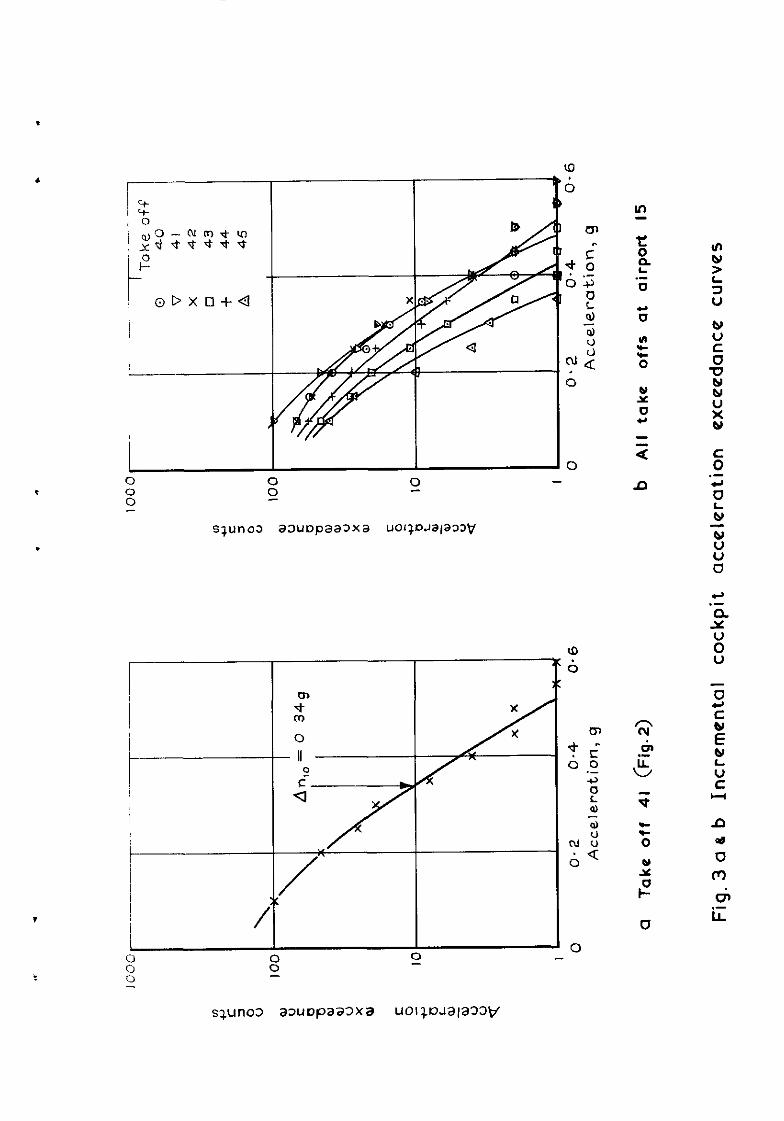
Records were analysed visually by marking tha original record with lines to represent levels at 0.1 g increments. The number of peaks exceeding each level was counted, only one peak being counted for each crossing of the 1.0 g datum. In addition, the number of peaks above intermediate levels (0.15 g, 0.25 g, etc.) were counted. The acceleration exceedences were found, keeping positive and negatiw exceedences separate, and then these two sums totalled to give the number of acceleration amplitude exceedence counts. These counts were plotted against the acceleration amplitude and examples of this are shown in Fig.3. A smooth curve was fitted through counts at the various acceleration levels and the severity of the vibration for that particular take-off defined as the acceleration level which occurs at the 70 count level on the smooth curve. This quantity is called An,o. The largest acceleration that occurs during a single take-off is given the symbol An,. Both An,, and An, are incremental accelerations about the 1.0 g datum.
6 275
Analysis of unpublished calculated and measured take-off acceleration histories for a subsonisz and a supersonic trsnsport aircraft shows that 821 approximate relationship exists between &IO and the rms acceleration for the
complete take-off run. For both aircraft the cockpit vertical acceleration
%O was about three times the rms acceleration. For the subsonic air- craft the cg vertical acceleration AnlO was twice the rms acceleration, and for the supersonic aircraft cg acceleration this ratio was about one and a half. Such a relationship can, of course, be deduced if the probability distribution and number of zero crossings for the acceleration are known.
In addition to measuring the cockpit acceleration exceedences for the 94 take-offs described above, similar measurements of the cg vertical acceleration exceedences have been made for 33 of the 94 take-offs.
3 RESULTS
3.7 Quantitative results
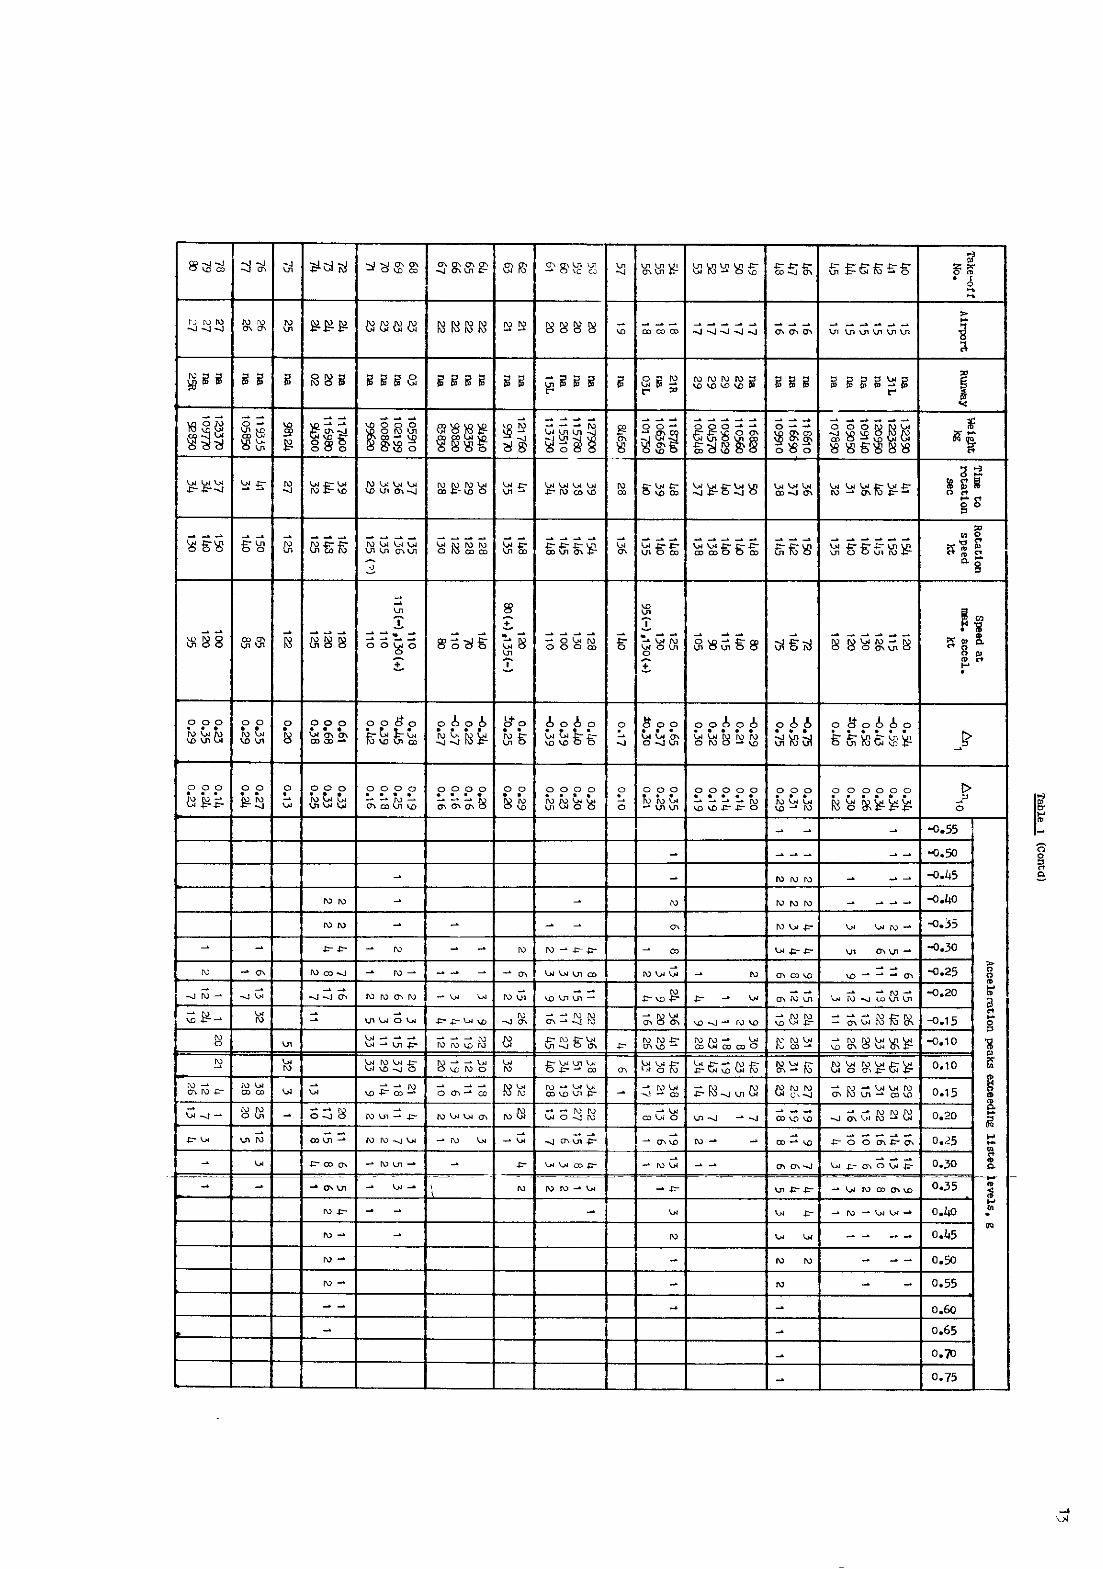
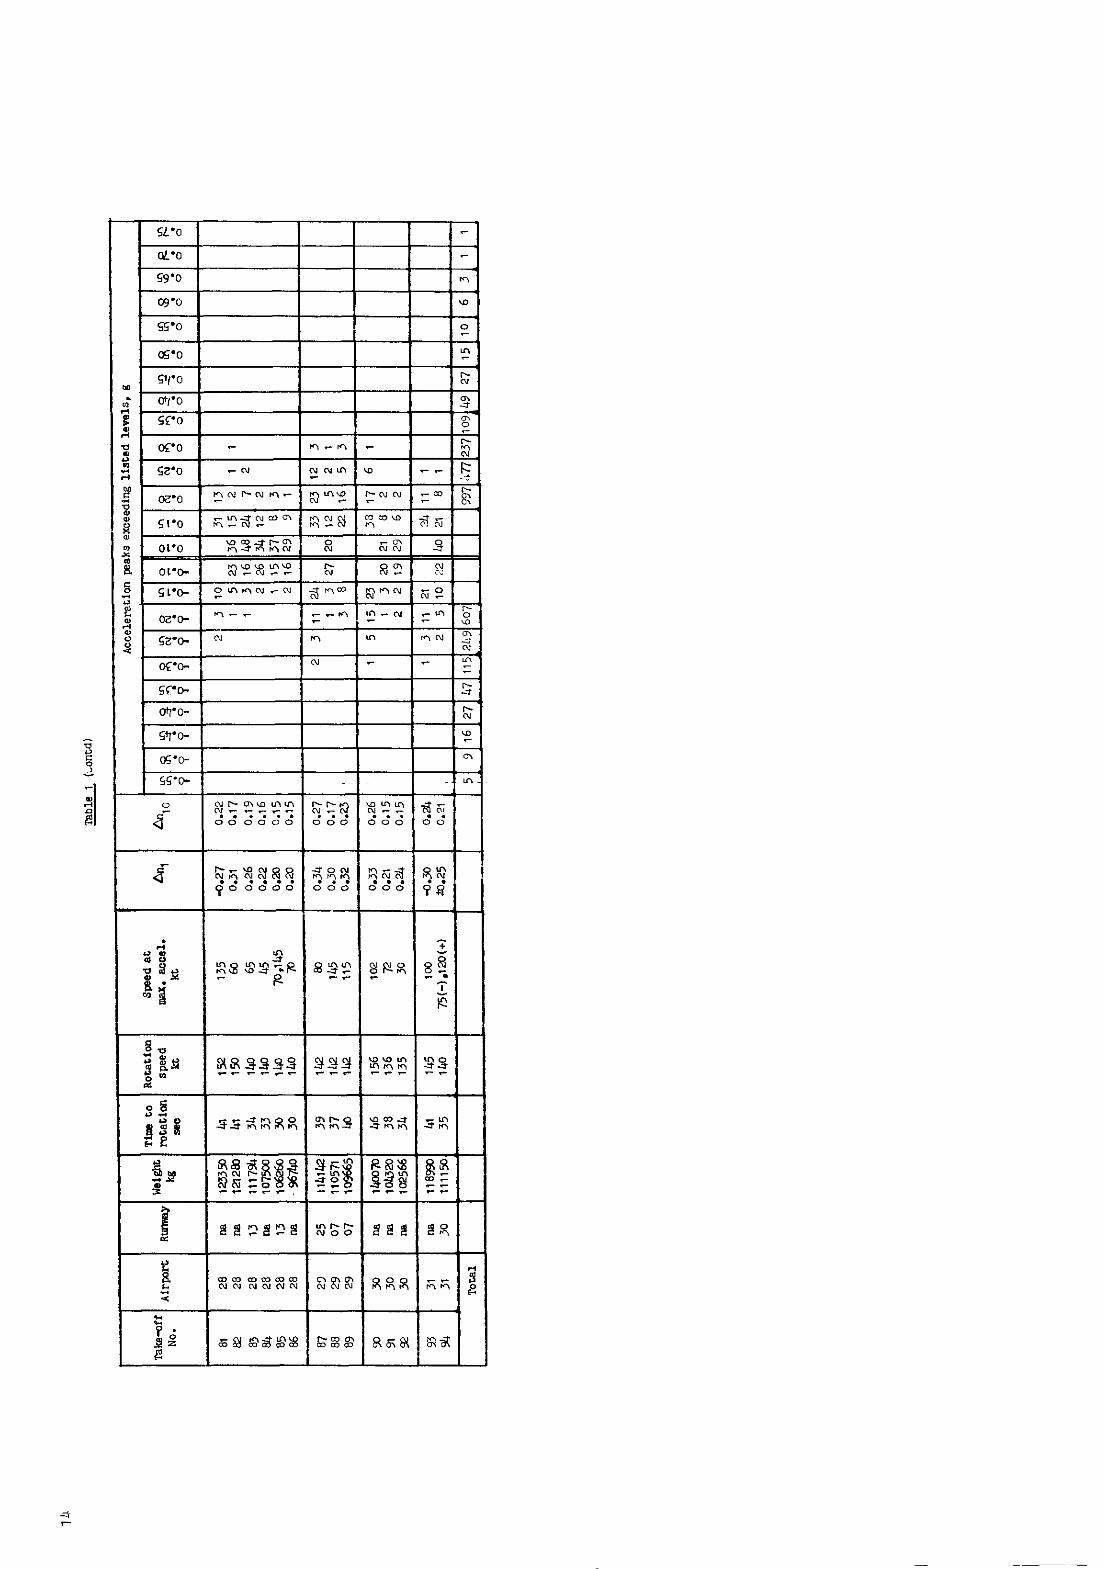
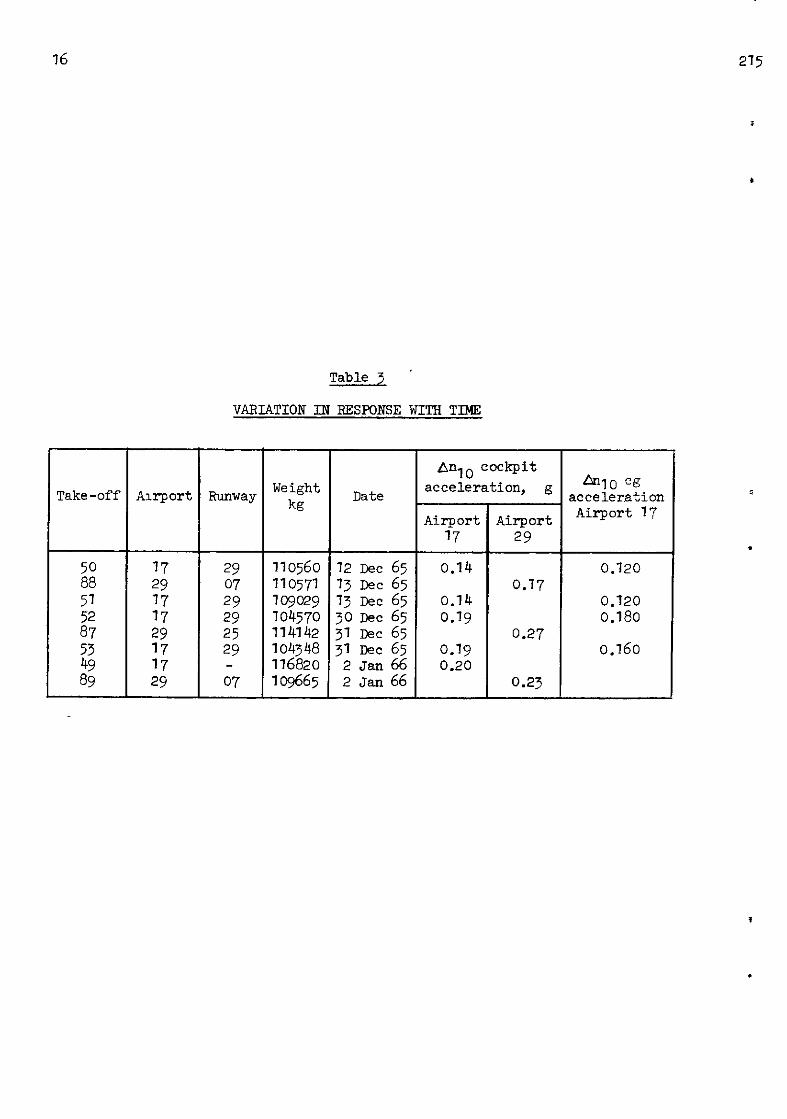
The numerical results of the analysis of the cockpit acceleration records for the 94 take-offs are listed in Table 1. The results are given airport by airport, and the runway used is shown, where this is known. Also shown are the aircraft weight during the take-off run, the time of the take-off run to rotation and the air speed at rotation. The time of the take-off ?.vn is only an approximate measure as it is often difficult to define the instant at which the take-off run starts. Also shown in Table 1 are the positive and negative acceleration exceedence counts for each take-off, the measured value of An, and the deduced value of An,O. It will be seen that the majority of maximum accelerations occurin the positive direction. The speed at which the maximum acceleration An, occurs is also recorded. Where the same maximum acceleration occurs more than once during a take-off run the speed of each occurrence is recorded with an indication of whether the speed corresponds to a positive or negative acceleration, if positive and negative accelerations of equal magnitude occurred. Table 2 lists the values of An, and cpI,O for the cockpit and cg accelerations for the 33 take-offs, for which cg accelerations were measured. Also shown is the ratio of the cockpit/cg acceleration at the An, and Anhn10 levels for the 33 take-offs. Table 3 lists the values of AnlO that occurred on two runways during landings on two trips. These data show that the responses during the trip of 30 December to 2 January were some 35% larger than had occurred during the previous trip. Within each trip the responses are repeatable and consistent. The difference was not the result of differences of elevator usage on the two trips.
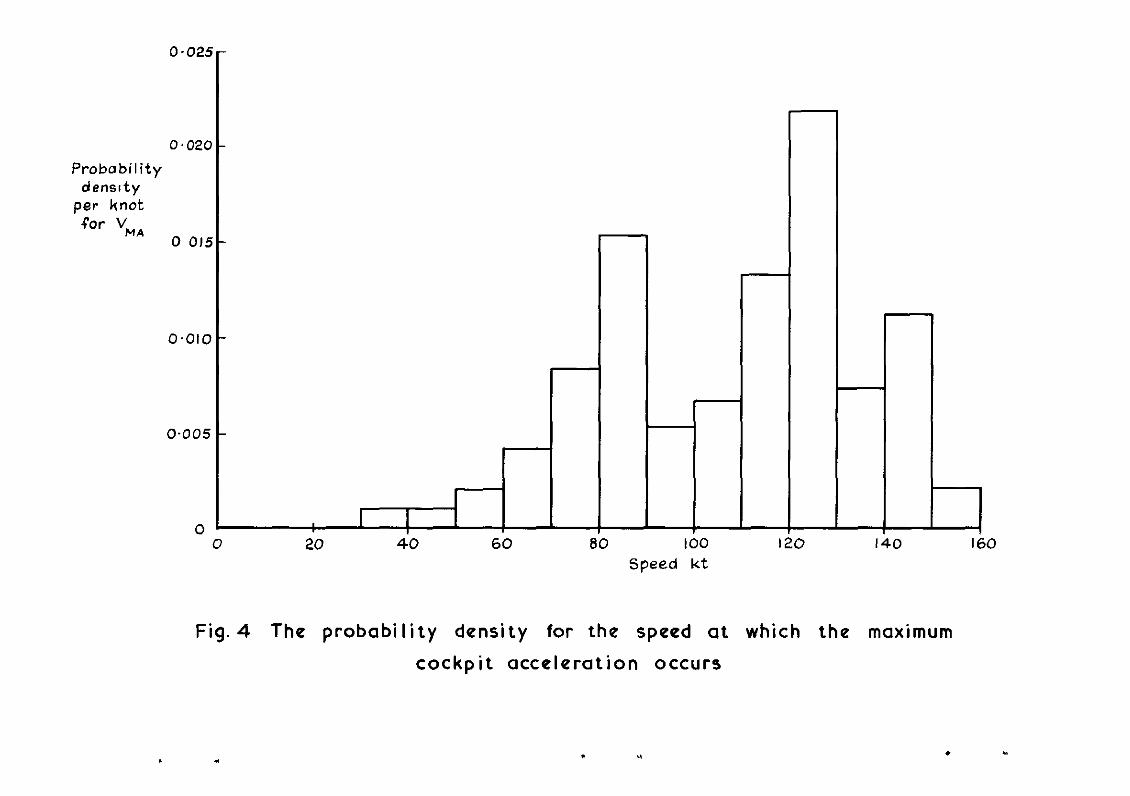
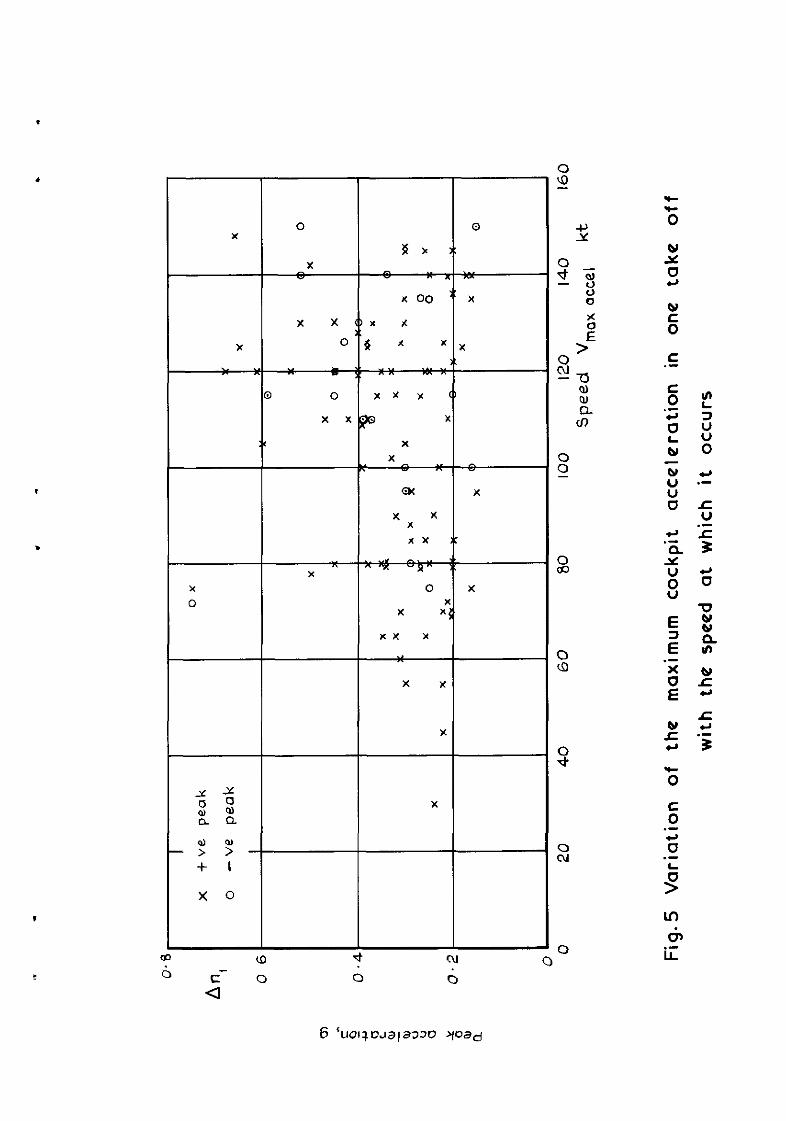
Fig.4 shows a probability density diagram for the speed at which the maximum acceleration occurs during a take-off run; this quantity is given the symbol Vma. The data are grouped into speed bends 10 knots wide and presented in histogram form. It will be seen that the maximum acceleration during a take-off is likely to occur either at approximately 80 knots or at about 720 knots. Less than lO$ of all the maximnm accelerations occur at speeds less than 70 knots. Fig.5 shows how the value of Cn,, the maximum acceleration during a take-off run, varies with the speed at which it occurs. It will be seen that for most take-offs An, for cockpit vertical acceleration exceeds 0.2 g on good runways and that on bad runways An, increases almost linearly with speed from 0.2 g at 35 knots to 0.7 g at 130 knots. The exceptionsto this are two counts of 6.75 g at between 70 and 75 knots, both of which occurred at Airport 16.
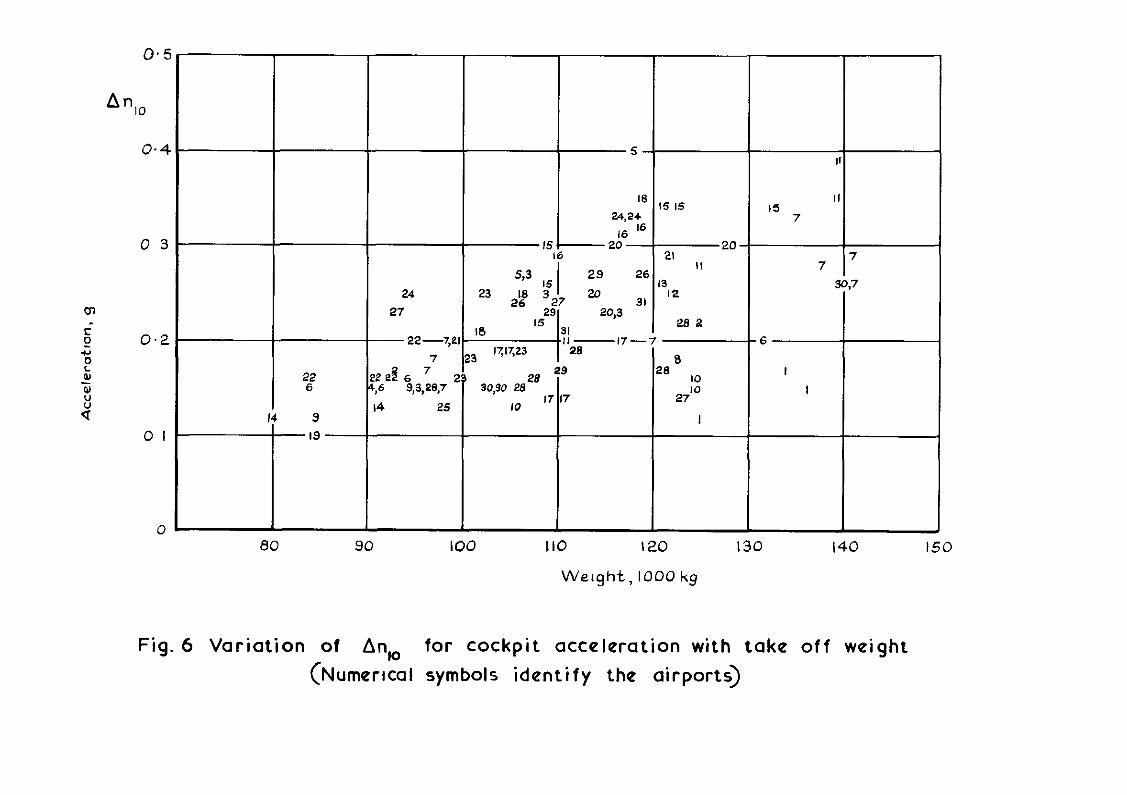
Fig.6 shows the variation of Ant0 for cockpit acceleration with air- craft weight. It can be seen that An,o increases linearly with weight and that it also varies from airport to airport. For smooth runways Anlo varies from about 0.1 g at 80000 kg to about 0.16 g at I40 000 kg and for rough air- ports the variation is from 0.14 g at 80000 kg to 0.40 g at 130 000 kg. No airport appears to be outstandingly good or outstandingly bad on a basis of
%O measurements.
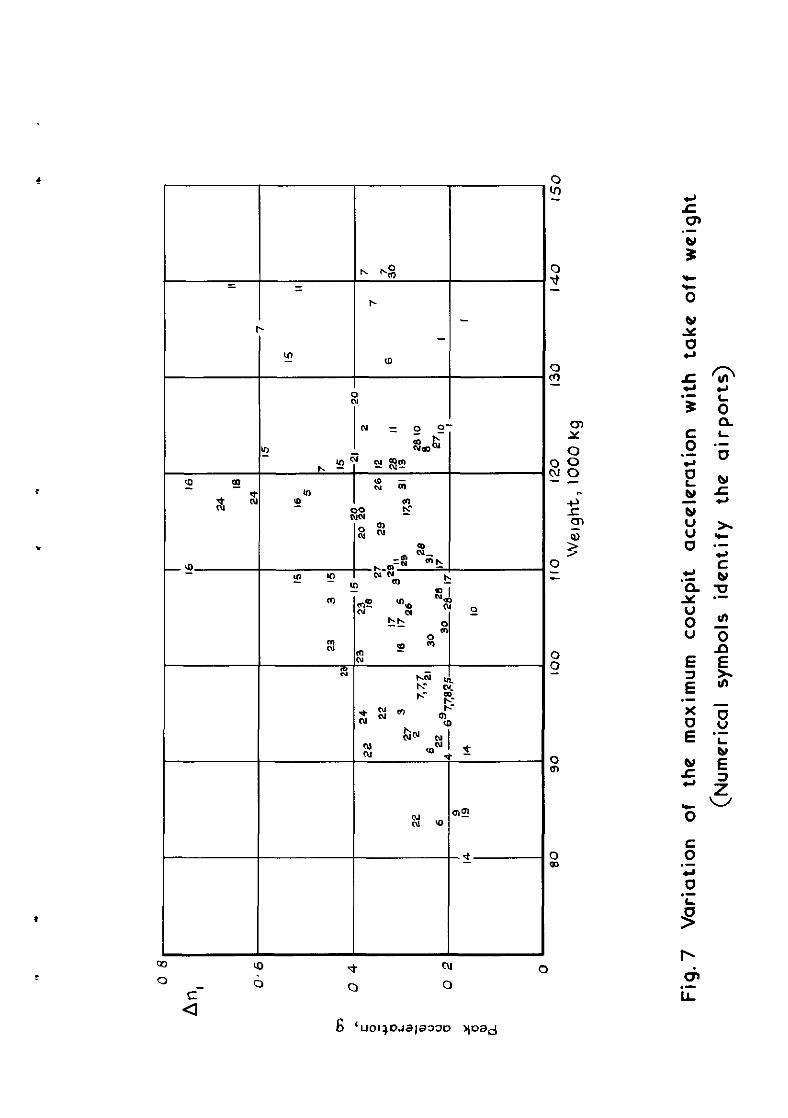
Fig.7 shows the variation of dn, for cockpit acceleration with aircraft weight. Again, the increase of An, with weight is clear, but there is naturally more scatter in Fig.7 than Fig.6. Airport 16 produced appreciably larger peak accelerations than any other. In Fig.8 the distribution of values of An, snd An,0 for cockpit acceleration are plotted on logarithmic/ probability scales. It can be seen that between the 0.95 and 0.01 probability levels both distributions are straight lines, indicating that the accelerations have a logarithmic normal probability distribution.
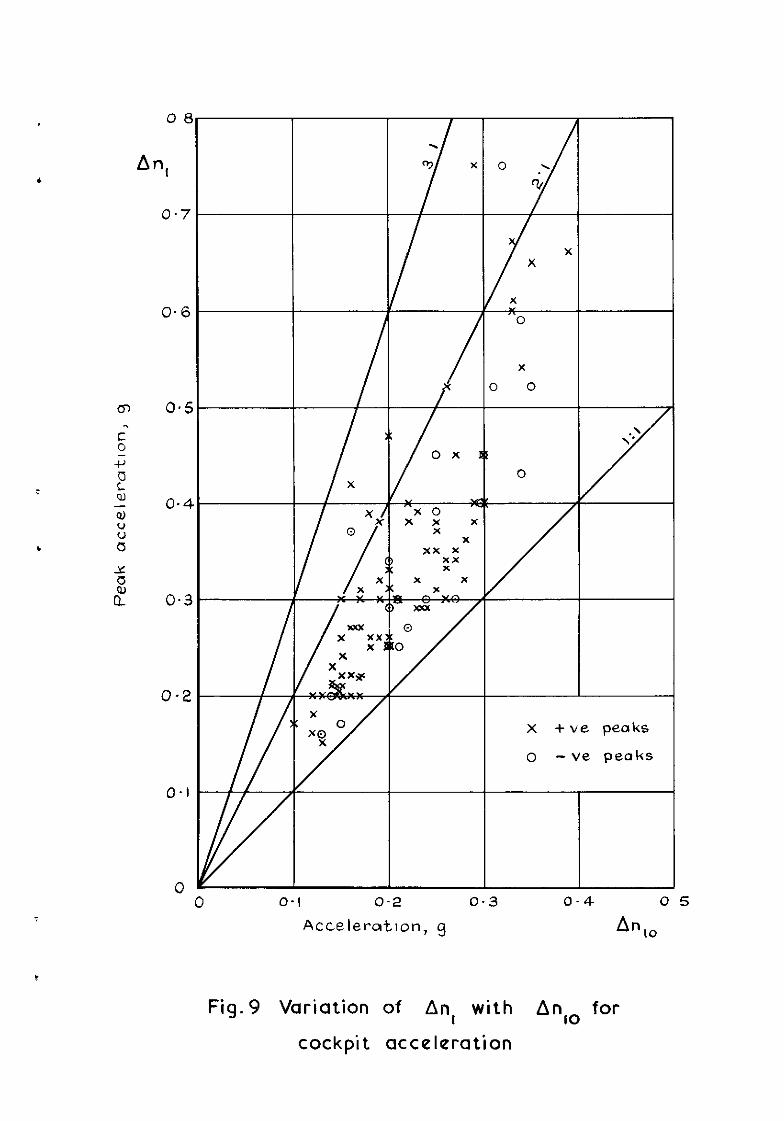
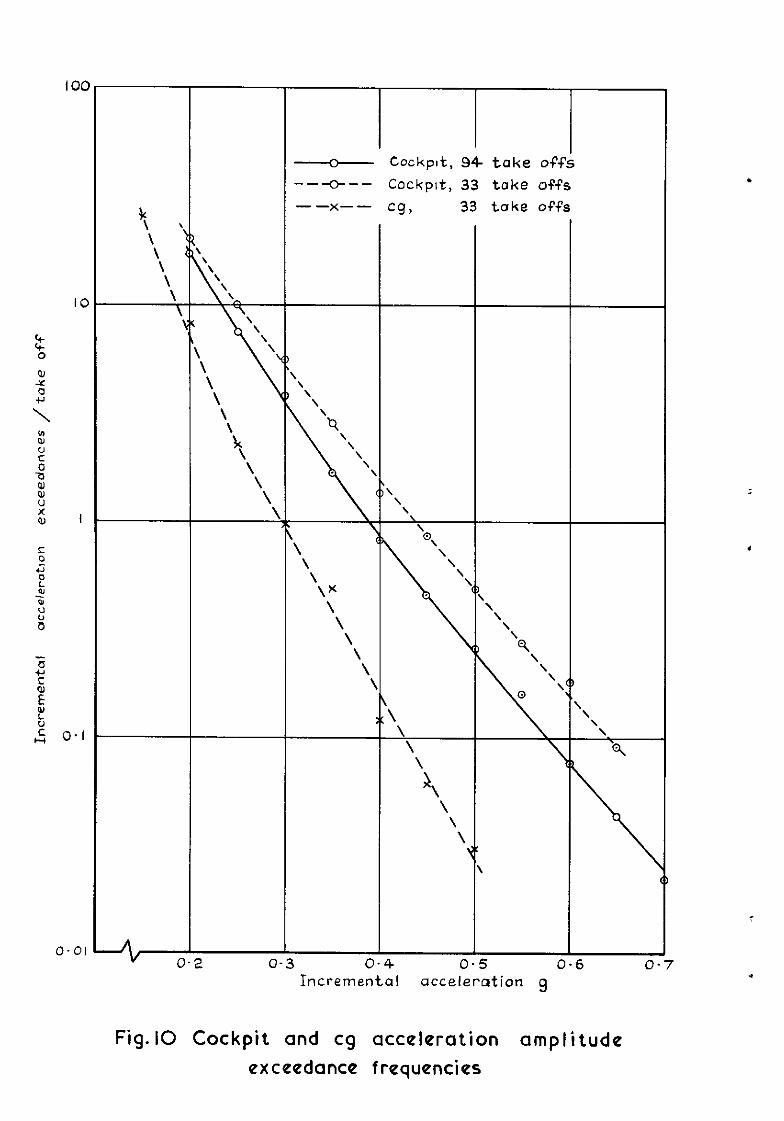
In Fig.9 An, is plotted against &I,~ for cockpit acceleration. This shows that as the severity of the vibration during a take-off increases the ratio An,/&,, increases from about 1.5 to about 2.0. The ratio does not vary with aircraft weight, and there is no difference between positive and negative peak accelerations. The variation that does occur may be due to the non-linear stiffnesses of the undercarriages, or perhaps to differences of the roughness distributions between relatively smooth and rough runways. Fig.10 shows the average distribution of cockpit incremental acceleration exceedences per take-off, for the 94 take-offs analysed, and of cockpit and cg acceleration exceedances of the 33 take-offs for which the cg acceleration was available.
8 215
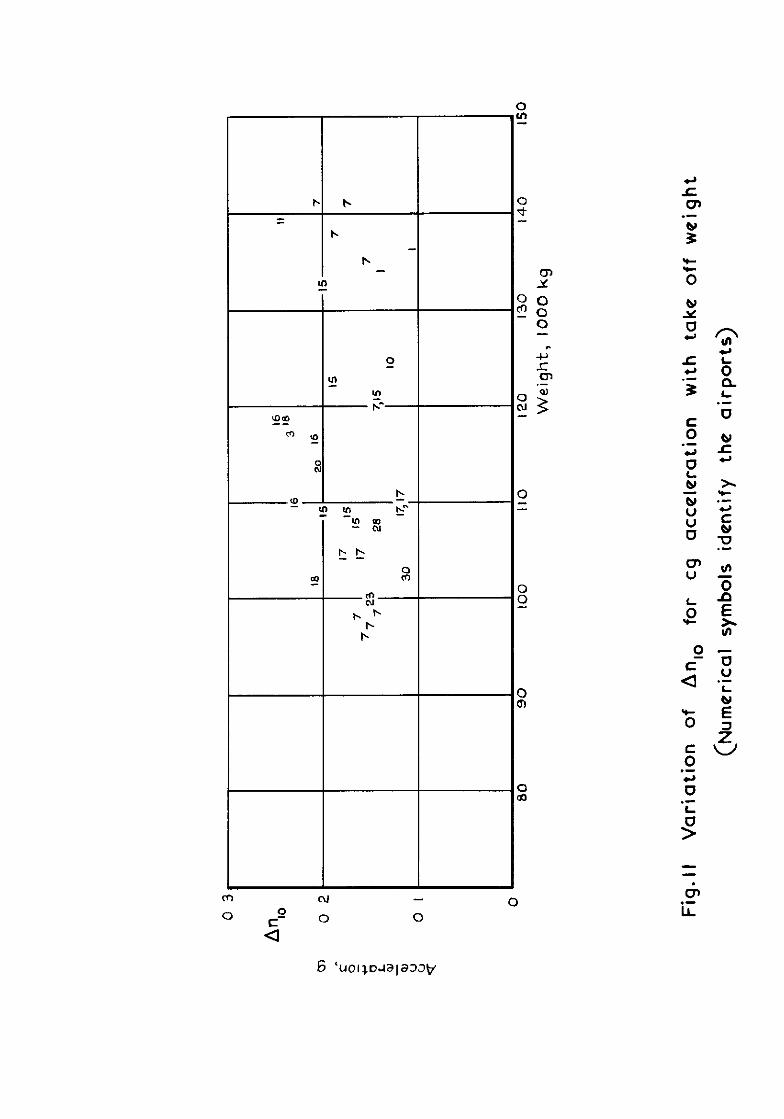
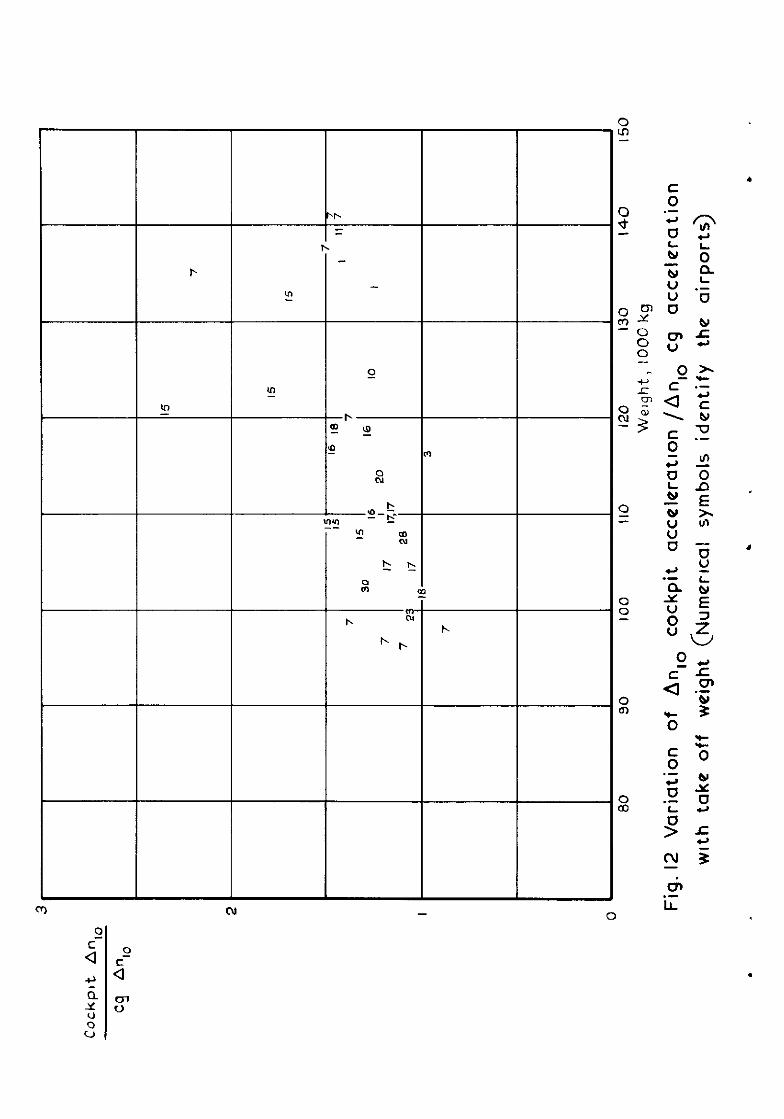
Fig.11 shows the variation of ~5-1~0 for the cg vertical acceleration
with aircraft weight for 33 take-offs. It can be seen that the variation with
weight is very slight. Fig.12 shows the variation of the ratio cockpit
%I&- %o with aircraft weight. Variation with weight is quite marked,
and, with the exception of one point at each of Airports 7 and 15, the scatter between airports is less than for the accelerations separately.
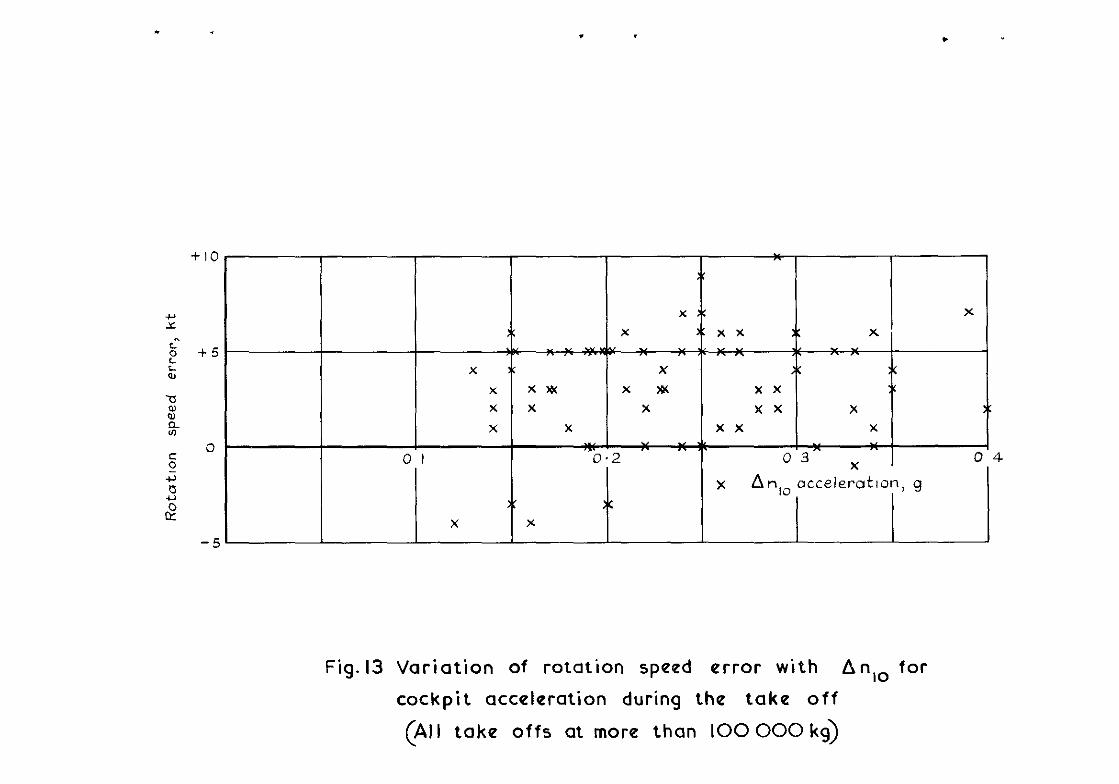
Finally, the effect of the vibration environment on the accuracy with which the aircraft is rotated for take-off is shown in Fig.13, where the error in rotation speed is plotted against An,0 for the take-off. No effect can be detected.
3 2 qualitative results
Some aspects of the records cannot easily be described quantitatively and these will be briefly described qualitatively in this section.
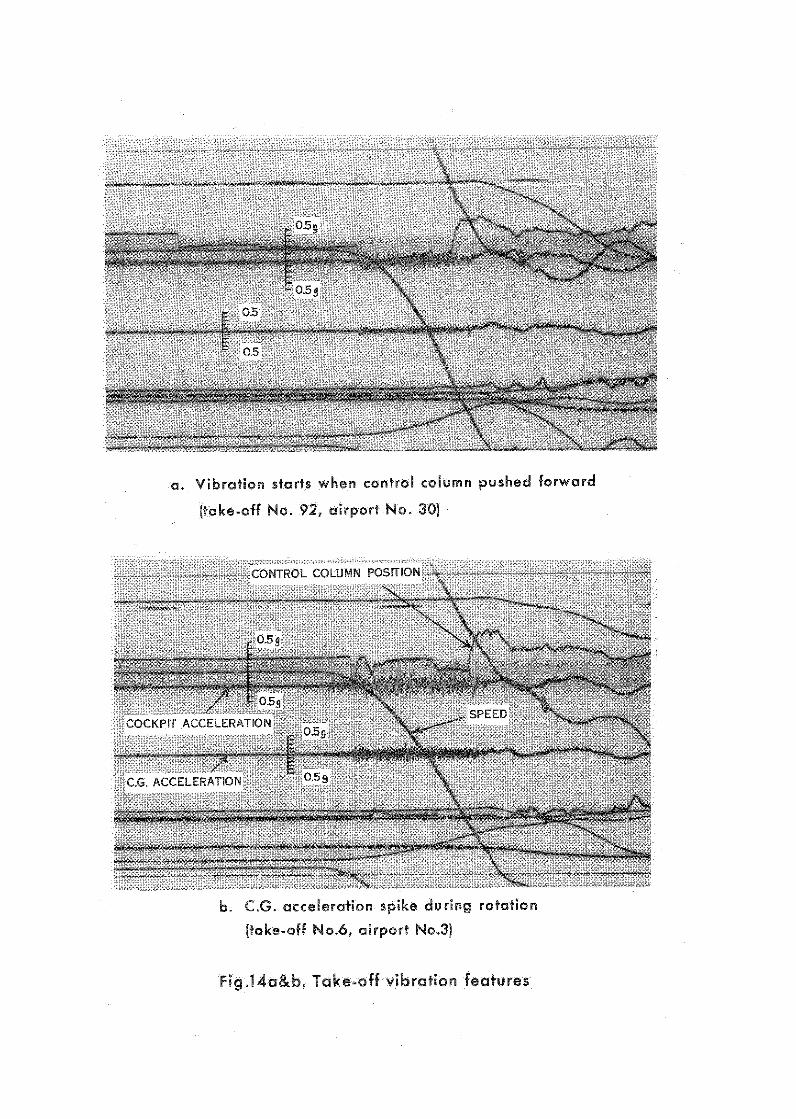
During a number of take-offs the control column was not moved forward until after speed had increased beyond 40 knots; this forward movement of the control column usually coincided with the start of vibration at both the cockpit and the cg. An example of this is shown in Fig.f4a. The reason for this is that forward movement of the control column increases the mean vertical reaction in the nose undercarriage which increases the stiffness of the nose undercarriage oleo strut. At the higher stiffness the forces transmitted to the aircraft, as a result of passing over rough points on the runway, are greater.
On the cg acceleration traces there is very frequently a large accelera- tion spike of very short duration after rotation. An example of this is shown in Fig.14b. The spike appears to be the result of excitation of a fairly high frequency elastic mode; the possible causes of such an acceleration just after rotation are discussed in the next section.
On many of the records the aircraft can be seen to be pitching heavily at about 0.7 to 0.9 Hz. This is shown in Fig.l4c and can also be seen in the typical record shown in Fig.2.
4 DISCDSSION
The amplitude of the vibration in the cockpit during the landing roll is greater than that during the take-off4. However, during the take-off the crew work-load 1s considerably higher than during the landing roll and the probability of needing to make decisions in the event of emergencies is greater. For this reason the take-off appears the more critical case from the point of view of crew
r
9 215
. environment, while it is likely that landing causes greater structural loads, particularly on the fuselage and near the undercarriage units.
The aircraft of this study is very similar to the Boeing 720 used in
Ref.1. Runways A and B of Ref.1 are at Airport 15 of this study. Although the characteristics of the accelerometers used in Ref.1 differ appreciably from the characteristics of the accelerometers used in this study, the cockpit/ cg acceleration ratio during take-off on Runways A and B was measured at between 1.5 and 2.1 in Ref.1, and was between 1.3 and 2.5 at Airport 15 in this study. At most other airports the cockpit/cg acceleration ratio from this study was between 1.0 and 1.5. The maximum cockpit acceleration during take-off on Runway A and taxying on Runway B (0.49 g and 0.27 g) are appreciably larger than would be predicted from Fig.7 for Airport 15 end a weight of 70000 kg.
The spikes after rotation on the cg acceleration record must be due to the excitation of a structural mode, possibly at quite a high frequency. However, they are reflected by similar but smaller spikes on the cockpit acceleration trace so they do represent a real vibration of the complete
aircraft. A possible explanation of the spikes is that they are caused by the undercarriage extending fully and hitting its stops as the aircraft leaves the ground, but this should be considered to be speculative.
It is clear from the records that pushing the control column forward during the take-off role increases the vibration level at both the cockpit and the cg; there are indeed occasions when the control column has been moved aft
during a particularly severe patch of vibration,probably in an attempt to reduce the vibration level or the loads on the nose undercarriage. Sensitivity of the response to the control column position makes it more difficult to compare different take-offs at the same airport.
When the aircraft has reached a speed of 80 knots it has travelled about 1500 ft along the runway and is crossing the part of the runway on which air- craft normally touch down. It is possible that the high accelerations at 80 knots, which usually occur as a result of pitching motion, are caused by long
wavelength roughness of the runway in the touchdown area.
When allowance is made for control usage, and the fact that not all the runways are identified, there is fair agreement between the measured vibration histories during different take-offs at the same airport. However, there is evidence that on some occasions the aircraft did not behave in a repeatable manner. The best example of this is shown by two series of flights calling at Airports 17 and 29; these happened to be made under extremely consistent conditions. Details of the take-offs are given in Table 3, from which it can
10
be seen that take-off 50, 88 and 51 were made on the I2 and 73 December 1965 and take-offs 52, 87, 53, 49 and 89 were made between the 30 December 1965 and the 2 January 1966. Examination of Table 3 will show that between 13 and the 30 December 1965 something appears to have happened to the aircraft that increases its response to rough runways by approximately 35%. This conclusion is even more striking if take-offs 87 and 49 are omitted from the table; these two take-offs are non-typical in that the weight is higher and different run- ways were used.
Throughout this Report the measured cockpit vibration levels are high. However, there is no evidence from the records that the pilot's performsnce was in any way degraded by the vibration. When the acceleration exceeds about 0.3 g the control column can be seen to be being moved in sympathy with the acceleratxon, positive accelerations causing the column to be pushed forward. There 1s no record of any crew complaints, although Ref.6 quotes today's air- liners as being only marginally acceptable with regard to cockpit vibration during take-off.
5 c0IBxus10NB
The cockpit vertical acceleration for a Boeing 707-436 has been measured during 94 take-offs from 31 airports during routine flying by a British airline. During 33 of these take-offs the centre of gravity vertical acceleration was also measured. The maximum cockpit incremental acceleration measured was 0.75 g and for 10% of the take-offs the maximum cockpit acceleration exceeded 0.53 g. For 10% of the take-offs more than 10 occurrences/take-off of accelerations greater than 0.32 g occurred. _-
The amplitude of the cockpit accelerations varied from airport to airport and with aircraft weight. The variation between airports was by about a factor of two at a weight of 115 000 kg. At a given airport, the response at a weight of 140 000 kg was about twice that at 90000 kg. The level of acceleration at the centre of gravity did not vary with aircraft weight. The cockpit/cg acceleration ratio increased with increasing weight; this ratio was between 0.9 and 2.3, but for more than 80% of the take-offs the ratio was between 1.0 and 7.5. E'rom a repeated loading viewpoint, no airport was outstandingly bad; however, one airport caused peak accelerations appreciably larger than any other.
The level of vibration, both in the cockpit and at the centre of gravity, is significantly increased by forward movement of the control column. There is some evidence that part-way through the measurement progrssme the aircraft
VERTICAL ACCEl&RATION IN THE CIXWIT W A SUBSONIC TRMWORT AIRCRAFT aJRIirC TAK+WF IGG”RED WIN: AIRLIhE OPERPTION
531.113 : 6iY.13.001 : 534.13 : 629.137.1
Vertical acceleration In the cockpit of a Boeing p7-436 d”rIllg Cake-off has vertical acoeleratlon In the cockpit of a BOei”!Z 707436 &HI@ take-off has been measured for s take-offs frcm 31 alr~rts durIn& airline oreratlcns. been measured for 9?, take-offs fmm 31 aIr?X*s during airline OpW’atiOnS. The vxtical acceleration near the centre of ~ravlty vas measured during 33 TW vertical acceleration near the centre of gravity yeas measured during 33 take-offs. The rix,Xlnum cockpit incremental acceleration W.S 0.75 R, and this takearfs. The maxlmm cockpit incremental acceleration vas 0.75 B, end this accelemCion eXceeded 0.53 ‘& for 10% oi the take-offs. At a &@VW airport aocelelation exEe&d 0.53 g IOr 10% Of th8 ta&-Offs. At a given apOrt the cockpit acceleration at a Wight of 140 000 kg was am"t twice tkd. at the cw.kpIt acceleration at a Wight of 140 Ooo Q ya5 about tlrlce that at MOO0 @ but the cg e.~ele~atl~~l did not nnry with weight. Th? anplILtie of $rXXO 1(9 but th? cg acceleration did rut Vary wlt& wfsht. Th? amPlitUde Of the cockpit acceleration varied between airports by a factor of about trm at tb? ccdplr acceleration varied between airports by B factor of about tWO at 115 O(x) ly. Tb? cockpitlcg acceleration ratio yp.s betwen 0.9 and 2.3, Wt The cockpit/CR acceleration ratio YWS betneen 0.9 and 2.3. but for mope than 00% or take-olfs ws between 1.0 and 1.5. The vlbm.tiM levels
ii5 000 kg. for mole than So:: or take-offs nss betwen 1.0 and 1.5. Ihe vibration levels
experienced bad no detectable effect on errors of rotation speed at take-off. experienced had no detectable effect on errUI’S of mtation speed at take-off.
9
C.P. No. I I20
0 Crown copyright 1970
Published by
To be purchased from 49 H~gb Holborn, London w C 1
138 Castle Street, Edmburgh EH 2 3AR 109 St Mary Street, Card~ffc~l 11W
Brazennose Street, Manchester 2 50 Fanfax Street, Bnstol BSl 3DE