74
MINNESOTA COMMUNITY CORRECTIONS ACT EVALUATION Minnesota J 0 ( of Corrections CRImE conTROL PLAnnInG BOARD If you have issues viewing or accessing this file contact us at NCJRS.gov.

MINNESOTA
COMMUNITY CORRECTIONS
ACT EVALUATION
Minnesota J 0 ( Departme~t of
Corrections
CRImE conTROL PLAnnInG BOARD
If you have issues viewing or accessing this file contact us at NCJRS.gov.

t
U.S. Department of Justice National Institute of Justice
This document has been reproduced exactly as received from the person or organization originating it. Points of view or opinions stated in this document are those of the authors and do not necessarily represent the official position or pOlicies of the National Institute of Justice.
Perr-i'lsion to reproduce this Q8pyligllted material has been grr,. ·d by
Minnesota Department of corrections
to the National Criminal Justice Reference Service (NCJRS).
FUrther reproduction outside of the NCJRS system requires permission of the co~wner.
TECHNICAL REPORT:
RETAINING OFFENDERS IN THE COMMUNITY
January, 1981
This research was supported in part by Grant #80 IJ CX 0001 awarded from the Office of Program Evaluation, National Institute, Law Enforcement Assistance Administration, United States Department of Justice. The research contained herein does not represent the official position of the funding agency.

J
PROJECT STAFF
GERALD J. STRATHMAN Project Director Director
VICTORIA B. COLAIUTA
GENE LARIMORE
MARGUERITE BITI'NER
MELINDA F. DAVIS
MARY B. WELFLING
MARJORIE C. GRITZKE
TIM BLANK LANCE GROTH YOUSSEF HADDAD MARIE JUNTERMAN LUANN PADDEN TERRI RUNGE
- - PRINCIPAL ANALYSTS --
Planning and Administration
Local Correctional Programming
Retaining Offenders in the Community
Appropriateness of Sanctions
Public Protection Social Justice
Economy Efficiency
- - SUPPORT STAFF --
Research and Information Systems Department of Corrections
Senior Research Analyst Crime Control Planning Board
Senior Research Analyst Department of Corrections
Senior Research Analyst Departm ent of Corrections
Research Analyst II Department of Corrections
Senior Research Analyst Department of Corrections
Activity Manager Research and Evaluation Unit Crime Control Planning Board
SCOTT KEGLER Data Management
ROBIN ROONEY-RONGITSCH Cost Analysis
Data Collection Data Collection Data Collection Data Collection Secretarial Secretarial
STEVE RUNNING PHYLLIS SOLAND BONNIE TURRENTINE SCOTT VAILLANCOURT CLAUDIA WASSERMAN GREGORY WHITCOMB
Data Collection Secretarial Data Collection Data Collection Data Collection Data Collection

I
ACKNOWLEDGEMENTS
The research staff for this evaluation is grateful to a variety of people whose cooperation and assistance has contributed to the success of this evaluation. A large number of people in the Community Corrections A.ct (CCA) areas have contributed to the evaluation by responding to questions from the research staff, and in many cases, assisting the staff in the collection and verification of data. A number of people throughout the country have also made contributions by reviewing and commenting on several preliminary documents. Special thanks are also due the Technical Assistance Resource Center (TARC) at the University of Wisconsin - Milwaukee. TARC made funds available in December, 1979 that allowed research staff to consult with Professor John L. Sullivan of the University of Minnesota on sampling and design issues and Don Thalheimer of the Institute for Economic and Policy Studies on issues related to economy and efficiency.
Finally, special appreciation is expressed to the Advisory Group established for this evaluation. Members of this group were appointed by Commissioner Young and have contributed to the evaluation in several ways. That group assisted the research staff in the development of the conceptual framework, in establishing important deCision rules for interpreting the data and by providing thoughtful criticism of the evaluation in its various stages. The Advisory Group, of course, is not responsible for the conduct or the findings of the evaluation.
L _____ .. _ ... _ ......... ___ . .. _ ............ .

t I
TABLE OF CONTENTS
LIST OF TABLES . . . . . . . . . . . . LIST OF GRAPHS . . . . . . . . . ., . . . . . . . A. Introduction . . . . . . . . . . . B. Issues . . . .
1. Assumptions of the CCA 2. Research Issues . . • . .
. . . . .
C. Data Sources. . .
D. Research Design . 1. Multiple Time-Series Design. . . . . . .
a. Court Disposition Analysis b. Commitment Rate Data . .
2. Forecasting Techniques. • . . . . . . . . . . . . ., . . . . . .
a. Forecasting Court Dispositions b. Forecasting Commitment Rate .
. . . .
. . . . . . . . . .
ii
1
1 1 2
3
4 4 5 6 6 7 8
E. Findings. . . . . . . . . . . . . . . ., . . . . . . . 9 1. Retaining Juveniles in the Community . . . • . . . . . 9
a. Commitment Rate Analysis. . . • . . . . . 9 b. Impact on Juvenile Institution Population. . . . . . . 10
2. Retaining Adults in the Community. . . . . . 10 a. Introduction . . • . . . . . . . . .. .... . 10 b. Commitment Rate Analysis. . . . . . 15 c. Court Disposition Analysis . . . • . 15
F. Conclusions • • • • • • • • • II • • • 19
References . . . 66 . . . . . . . . .

LIST OF TABLES
TABLE 1: Expected and Actual Juvenile Commitments by County Areas and Percent Retained. . .
TABLE 2: Mean Juvenile Commitment Rates per 1,000 Juvenile (age 13-17). . . . . . . . . . .
TABLE 3: Juvenile Commitments Retained and Reduction in Institutional Population . . . . . . •
TABLE 4: Actual and Expected Adult Commitments after CCA Entry . . . . • . . . • . . . . . . . . . . . . .
TABLE 5: Expected and Actual Adult Commitments by County Areas and Percent Retained. .
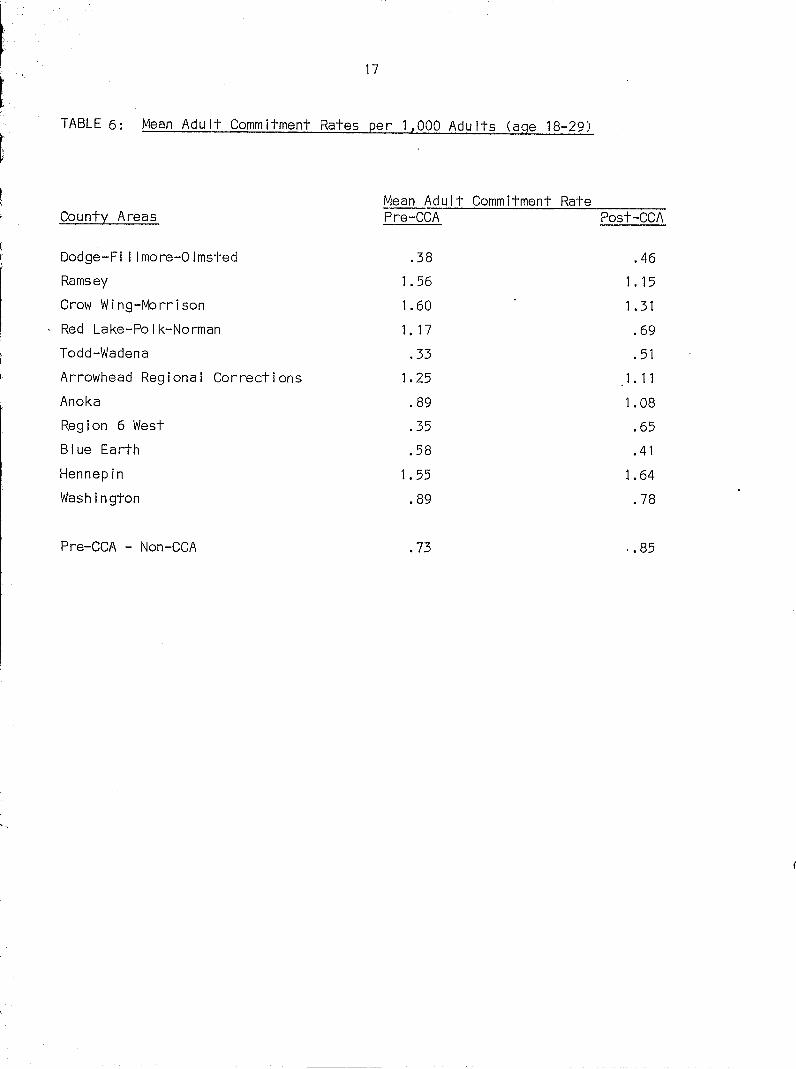
TABLE 6: Mean Adult Commitment Rates per 1,000 Adults (age 18-29). . . . . • . . . • .
TABLE 7: Actual and Expected Adult Commitments and Number of Offenders Retained • . . .
TABLE 8: Adult Offenders Retained and Reduction in Institutional Population . . . . . . . . .
TABLE 9: Comparison of Proportion of Chargeables Committed by Time Period and County Area
.
TABLE 10: Comparison of Proportion of Non-Chargeables Committed by Time Period and County Area.
TABLE 11: County Areas in Which the Proportion of
· ·
· ·
· ·
Offenders Retained Increased as a Result of CCA •
· · · · · · ·
· · · · · · ·
· · · · · · ·
· · · · · · ·
11
12
13
14
16
17
18
20
21
22 l 24

l ~ ii
( LIST OF GRAPHS
~ GRAPH 1: Juvenile Commitments . . . . . · · . · · · · 25
GRAPH 2: Commitment Rate Comparisons - CCA Counties · · · · · · · · 26
GRAPH 3: Juvenile Commitments D-F-O- Counties. · 27
f GRAPH 4: Juvenile Commitments - Ramsey County 28
GRAPH 5: Juvenile Commitments - Crow Wing/Morrison Counties 29 · · · · · r
GRAPH 6: Juvenile Commitments - Polk/Red Lake/Norman Counties. 30
GRAPH 7: Juvenile Commitments - Todd-Wadena Counties 31
GRAPH 8: Juvenile Commitments - Region 3 · · 32
\ GRAPH 9: Juvenile Commitments - Anoka County . · · · · · 33
r GRAPH 10: Juvenile Commitments - Region 6W 34 · · · · · ~. GRAPH 11: Juvenile Commitments - Blue Earth County · · · 35
I GRAPH 12: Juvenile Commitments - Hennepin County. · · · · · 36
f' GRAPH 13: Juvenile Commitments - Washington County. · 37
I GRAPH 14: Commitment Rate Comparisons - CCA Counties 38
t GRAPH 15: Adult Commitments - D-F-O- Counties • 39 · · •
t GRAPH 16: Adult Commitments - Ramsey County 40
GRAPH 17: Adult Commitments - Crow Wing/Morrison · · · · 41
r GRAPH 18: Adult Commitments - Polk/Red Lake/Norman Counties. 42
~ GRAPH 19: Adult Commitments - Todd/Wadena Counties · · · · · 43
GRAPH 20: Adult Commitments - Region 3 44 . · · · · · r GRAPH 21: Adult Commitments - Anoka County · · · · · 45
GRAPH 22: Adult Commitments - Region 6W . · · · · · 46
J GRAPH 23: Adult Commitments - Blue Earth County · · · · 47
f GRAPH 24: Adult Commitments - Hennepin County. · · 48
GRAPH 25: Adult Commitments - Washington County. · · · · · 49
J i
f I I
-~-~

iii
GRAPH 26: Court Dispositions Pre-CCA/Post-CCA Chargeable Commitments. 50
GRAPH 27: Court Dispositions Pre-CCA/Post-CCA Non-Chargeable Com mitments 51
GRAPH 28: Court Dispostions Hennepin/Ramsey Chargeable Commitments. 52
GRAPH 29: Court Dispositions Hennepin/Ramsey Non-Chargeable Commitments 53
GRAPH 30: Court Dispositions Pre-CCA/D-F-O- Chargeable Commitments. 54
GRAPH 31: Court Dispositions Pre-CCA/Crow Wing/Morrison Chargeable Commitments · · · · 55
GRAPH 32: Court Dispositions Pre-CCA/Todd-Wadena Chargeable Commitments · · · · · · · 56
GRAPH 33: Court Dispositions Pre-CCA/Region 6W Chargeable Commitments · · · · · · · · 57
GRAPH 34: Court Dispositions Pre-CCA/Polk-Red Lake-Norman Chargeable Commitments. 58
GRAPH 35: Court Dispositions Pre-CCA/Blue Earth Chargeable Commitments · · · · 59
GRAPH 36: Court Dispositions Pre-CCA/Region 3 Chargeable Commitments . · · · · 60
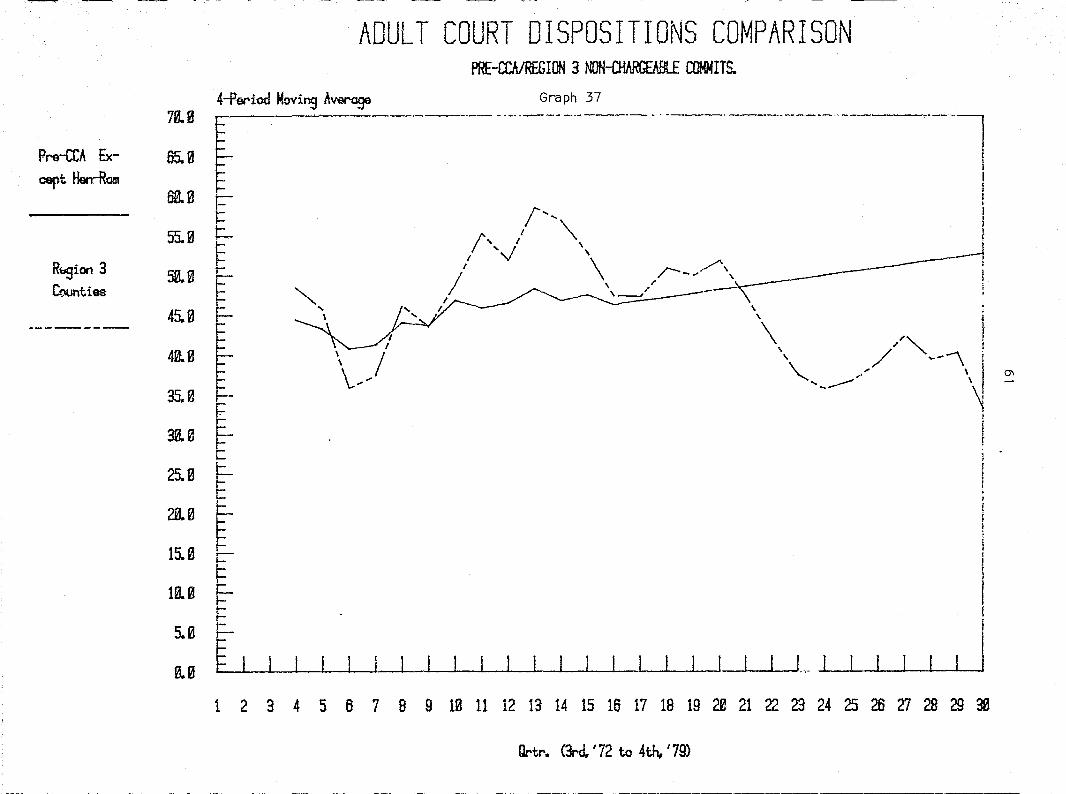
GRAPH 37: Court Dispositions Pre-CCA/Region 3 Non-Chargeable Commitments · · · · · · · 61
GRAPH 38: Court Dispositions Pre-CCA/ Anoka Chargeable Commitments 62
GRAPH 39: Court Dispositions Pre-CCA/ Anoka Non-Chargeable Commitments . 63
GRAPH 40: Court Dispositions Pre-CCA/Washington Chargeable Commitments • . 64
GRAPH 41: Court Dispositions Pre-CCA/Washington Non-Chargeable Commitments 65

f
r
f ,
~
A. Introduction
During the summer, 1979, the Minnesota Department of Corrections in cooperation with the Minnesota Crime Control Planning Board (CCPB) launched a comprehensive evaluation of the Minnesota Community Corrections Act (CCA). The evaluation represents a response to inquiries from Minnesotans and from other states on the effectiveness of this community corrections legislation.
The first phase of the evaluation entailed efforts to reconstruct the logic implicit in the CCA legislation. Research staff analyzed the legislation and conferred with key state and county personnel. The result of these efforts was a conceptual framework for the evaluation that identifies objectives, goals and outcomes of the Act.
Each of these objectives, goals and outcomes is analyzed and evaluated and the results reported in a series of eight technical reports. This report presents the evaluation of the third objective: to retain offenders in the community.
B. Issues
1. Assumptions of the CCA
The CCA contains provisions which provide counties with incentives to retain offenders in the community by imposing a per diem charge for juveniles and certain non-serious adult offenders who are committed to state institutions and by providing a subsidy to help create correctional alternatives and programs for all offenders. Retaining offenders is seen as a major objective of the CCA which contributes to the goals of the CCA by promoting public protection, economy and/or appropriateness of sanctions. Thus, if the logic of the conceptual framework is sound, results which indicate retention of offenders is a prerequisite to achieving other goals and outcomes of the CCA. A positive finding in each of the objectives, goals and outcomes for all CCA areas would lead to the conclusion that the CCA is effective correctional policy and that the assumptions of the CCA are valid. If positive findings are found in some CCA areas but not in others, the conclusion can be drawn that the CCA can be an effective correctional policy. -
The same type of approach is used in this portion of the evaluation. The questions to be answered are:
1. Can the CCA increase the proportion of adult and juvenile offenders retained in the local community? (Has this happened in at least one county area?)
2. Has the CCA since its inception increased the proportion of adult and juvenile offenders retained in the local community? (In aggregate, has the proportion of offenders retained increased substantially?)
If the results indicate that counties can achieve the objective of retaining offenders, it can be inferred that the incentives offered by the CCA are sufficient to bring about the desired change. If results indicate that the objective has not been achieved, it can be inferred that the incentives offered by the CCA are not sufficient to bring about the desired change.
FUrther analysis must be done, however, if results indicate that the objective was achieved in some counties but not in others. If evaluation results are to be useful to

" .t...
policy recommendations, the reasons why some counties retain offenders and others do not must be probed.
2. Research Issues
A critical issue in the evaluation of the impact of the incentives offered by the CCA in retaining offenders in the community is whether or not the same results would have occcurred without CCA legislation. Even if fewer offenders are retained, after CCA entry, if it can be demonstrated that without CCA the results would be even worse, then it can be concluded that the CCA was instrumental in retaining offenders. The basic aim of this portion of the evaluation is to estimate net effects of the CCA. In order to do this, however, it is necessary to eliminate or at least minimize contaminating influences. These confounding factors while present in most evaluations or impact assessments, seem particularly strong in a long term policy assessment. Certain general processes occur simultaneously and may 1 compete with or obscure the effects being measured. Several of these factors are particularly relevant to this evaluation. These processes are:
secular drift: a relatively long term trend that may strengthen or obscure the effects of a program. For example, a program designed to retain offenders in the community may appear to have no effects if it occurs at a time when community attitudes toward crime and criminals are becoming more punitive.
maturation: growth or time related changes not related to intervention (CCA). For example, a large increase in population in the most crime prone age-range could affect outcome measures if it occurs at the same time as the intervention.
data reliability: the data itself may be unreliable or manipulation of data may diminish reliability. In this case, the raw data used may have been inconsistently collected or the court records themselves be inaccurate. Population estimates may be sufficiently biased to obscure the real effects of the CCA.
In an experimental design these confounding effects can be eliminated, but evaluation of the CCA does not lend itself to such a design. A multiple time-series design appears to be more appropriate for the historical data available. The .multiple timeseries design is a relatively strong design for use with a series of data points. The weakness of this design in this evaluation lies in the lack of adequate control. Counties are either too different and, thus, not comparable or they enter at different times and may then be at different maturation levels or at a different stage of a secular trend. Different entry dates also have a positive aspect, however; the!y allow early participating counties to be used as comparison counties for other CCA counties. How this is done is explained more fully in the research design (Minnesota Community Corrections Act Evaluation: Research Design).
Another problem that may affect all portions of the CCA evaluation but particularly those portions using arrest, court dispositions or commitment data is the variableness of the data. It is evident that wide differences in crime rates and commitment rates exist among counties. "The existence of such a wide range of crime rates in Minnesota suggests that significant qualitative differences exist between the high and low crime areas in the social factors that co~tribute to crime and in the effects of the crime rate on the social environment." If these differences in rates are more than quantitative, then the CCA program could not be expected to have the same effe~t in areas with widely varying rates. This variability reduces the immediate measureable impact of the program.
j
] J

r t
f I
r
------------------------
3
There are other issues that may impact on the outcome for individual counties, too. One of these is that of "pre-level"; that is, a county with a high proportion of convictions resulting in commitment before entry into CCA may find it easier to reduce this pl'oportion than the county that has a relatively low proportion of commitments prior to entry into the CCA. Stability of effect may also have some bearing on whether or not a county shows a substantial reduction in proportion of commitments. There is some evidence that the early period after CCA entry shows a greater rate of decrease in commitments than later periods. Another phenomenon occurs which may affect the conclusions drawn. Other stud~s have shown that crime rates and commitments often show a good deal of variability and while an attempt to control for this variability was made by using moving averages, as discussed in the methods section, it is likely that the late joining counties may be more affected by this phenomenon than those that began participation earlier. In early CCA areas the longer follow-up period tends to give less weight to atypical years than is the case in the more recent CCA areas.
A final issue relates to the research design. Donald campbell4 suggests that gradually introduced changes are usually impossible to detect by a time-series design. In the case of the CCA not only were counties phased into the Act over a period of years but the Act itself was simply a cUlmination of a period of years of active interest in and support of correctional programs. The state of Minnesota had much earlier adopted policies and legislation that impinged on the whole correctional process. Minnesota enacted legislation in the late 1960's which allowed appropriations of state monies and disbursement of federal monies to help counties provide a variety of correctional services to offenders. For example:
· The Community Corrections Centt:!r Act was passed by the 1969 legislature which authorized cities or counties to establish and operate community corrections centers. In 1971 appropriations were provided to the Commissioner of Corrections enabling the DOC to disburse grants to such programs. In fiscal year 1975 the DOC provided over $350,000 for such centers.
· A group homes subsidy program was established which provided for reimbursement to the counties for one-half the cost of operating group homes for adjudi(!ated delinquents. In 1974 and 1975 a half million dollars was appropriated for county and state group homes.
· The DOC began to provide funds for C'ommunity residentlal programs and to sponsor grants for the operation of contractual residential programs.
Thus, the passage of the CCA may not produce sufficient impact to be measured in those counties where community corrections activities were already established.
C. Data Sources
There were three major data sets used in the analysis of the impact of CCA on the retention of offenders in the community. These were quarterly district court disposition data for CCA counties from July, 1972 through December, 1979; juvenile and adult commitments to state institutions from 1970 through 1979; and county population estimates from the Minnesota State Planning Agency.
The court disposition data was collected as part of a Systems Rate Study 5 which compares sentencing patterns in CCA areas with comparison counties. Data were collected from district court criminal registers. Only felony and gross misdemeanor

4
cases in which a disposition was made were coded. These data are available for all CCA areas an a quarterly basis. The data set includes name and date of birth of the offender, the county in which the disposition was made, the offense for which the offender was convicted, the daLe of the disposition, the type of sentence received, the length of the probation or incarceration period and the sentencing judge. The chargeable/non-chargeable variable was created by coding all statutes vvith maximum sentences of five ~lears or less as chargeable and all statutes with a maximum sentence over five years as non-chargeable.
Another major source of data is the Department of Corrections computerized information system. Both adult and juvenile comn,itments to correctional institutions from 1970 through 1979 were obtained from this.source. Although there were some discrepancies between DOC commitment data and the : JUrt disposition data, those discrepancies could largely be accounted for by revocations which were included in commitment figures but which were not included in the court disposition data. The final set of data used are the population estimates of the Minnesota State Planning Agency. ~ 1979 the State Planning Agency released revised 1975 estimates of population. These revised estimates were b8.'3ed on symptomatic data series. "A symptomatic series is any data s~ries which may serve as an indicator of population magnitude or change, such as school enrollment records, birth and death s~tistics, income tax files, automobile registratiqrs and building permit records." The difference between the original estimates and the revised estimates were calculated for the 18-29 year age group and this difference used to modify the earlier 1980 estimates. Population-at-risk for the years between the 1970 census and the 1975 and 1980 revised estimates are simply interpolated. For juveniles, no adjustment is made because it is felt that the revised 1975 age §roup estimate is too broad (5-17 years) to be usable. Instead, the originally published estimates of age groups (10-14) and (15-19) are used. The juvenile population-at-risk as used in this evaluation is the age group 13-17. These figures are calculated from the estimates above. This procedure assumes an equal distribution of ages throughout the age range.
D. Research Design
There are two basic designs employed in this section of the evaluation. These methods were chosen to achieve as much control as possible over non-CCA variables and confounding elements.
1. Multiple Time-Series Design
One of the strongest designs that can be used with the historical data available is a multiple time-series design. Observations are plotted for a series of periods before and after CCA entry. If a change occurs and is maintained after CCA entry, one can infer that the change is due to the CCA and not to a general trend that has been occurring or to a deviant year before or after entry.
Unless one has a comparison or control group, however, there remain several possibilities that could explain the change other than the CCA. One rival explanation is that some other event occurrring at the same time causes changes in the series rather than the CCA itself (history). Another possibility is that changes would have occurred anyway in normal development at the county level. (maturation). Also, one might argue that it is characteristics of the counties that join CCA or characteristics in interaction with the CCA that causes changes that have been observed (:,election and selection-maturation). If one can incorporate a control or comparison group, these
J
1
r

5
rival explanations can be controlled and the inferences on the effects of the CCA, therefore, would be stronger.
Two strategies are employed to incorporate comparison county data. First, for some issues on which data are available for all counties (e.g. commitment rates) each CCA county is compared to pooled non-CCA counties to control for the effects of non-CCA variables. An alternative would be match each CCA area to a similar non-CCA county{ies) to assess whether changes occurring in the CCA area are also occurring in the matched areas. A matching process, however, assumes that the variablbs that require contI 01 can be identified.
Because there is likely to be error in identifying these variables as well as imperfections in the matching, it was decided that pooled nOTi-CCA data would provide a better reference point for judging what is happening state-wide without the CCA. Pooling the data does, of course, wash out the effects of extreme or deviant counties. In general, this effect is desirable.
Sixty counties have not joined the CCA as of 1979. Data on these sixty counties are pooled and plotted and serve as a reference point to judge trends occurring in a CCA area. The time series of CCA area A is compared to the time series of all non-CCA areas. If a change occurs after CCA entry in CCA area A but not in the non-CCA counties, one would infer that the CCA has caused the challg-e. Similarly, for CCA area B one looks for changes after CCA entry. If this change does not occur at the same time in non-CCA counties, it can be inferred that the CCA has caused this change. These comparisons are done for each CCA area except Ramsey and Hennepin for which non-CCA counties are entirely non-comparable. Ramsey ar.~ "fennepin are compared to each other following the second strategy discussed below.
The pre-entry series of the recent entrant (Hennepin) serves as a control county for the early entrant (Ramsey). If Ramsey's time series changes with CCA entry but no comparable change occurs for Hennepin, then one can infer that CCA entry stimulated the change. Similarly, the post-entry observations of Ramsey serve as controls for assessing the impact of CCA entry on Hennepin.
A final point related to the use of the multiple time-series design concerns the use of statistical tests to infer whether changes occurring after CCA entry are "significant", i.e. likely to have occurred by chance. In general, there are too few observations before and after entry to support tests of significance. A visual inspection of the time series, however, remains a powerful tool to detect changes brought about by the CCA.
The multiple time-series design is used to plot observations (court dispositions and commitment rates) over a period of time before and after CCA entry. Each eCA area is plotted and compared with pooled pre-CCA and/or non-CCA expected proportions or rates. The series of graphs depicting this data can be found in the appendix.
a. Court Disposition Analysis
Court disposition data includes quarterly dispositions and commitments from July 1, 1972 through December 31, 1979 for charegeable and non-chargeable offenses for all counties participating in CCA. Pre-CCA figures are obtained by pooling data from all county areas and dropping out counties as they enter the Act. The result of this action is to provide sixteen pooled quarters of pre-CCA court activity for chargeable and non-chargeable offenses. The proportion of commitments for each type of offense is calculated and a moving average applied to minimize the seasonal variation. The slope

"
6
of this series of proportions is calculated and used as a comparison for each CCA county. If the slope were +.02 the proportion of com mitments prior to eCA entry (base rate) for a particular county would be expected to increase by .02 for each unit of time if the county had not entered the CCA. The choice of the base rate to be used involves a certain amount of judgment in those cases in which the figures immediately prior to entry appear to be atypical. In such cases the court disposition projected outcomes are compared to the outcome obtained from the commitment rate projections. Where there is a real discrepancy a pre-rate more in line with the commitment data set is chosen.
This type of analysis is based on the assumption that counties would be expected to change the direction and volume of commitments in the same manner that pre-CCA proportions change. Thus, the data for each county is plotted in comparison with expected proportions. These plots provide a visual comparison of the difference between expected and actual proportions of commitments.
b. Commitment Rate Data
Commitment'rates are treated in the same manner although these rates are calculated on an annual basis. Commitments are available for all 87 counties from 1970 through 1979. Thus, instead of using only pre-CCA figures it was possible to pool both nonCCA and pre-CCA county data to serve as a basis for determining the slope of expected commitments if CCA legislation had not been enacted. These data are plotted in the same way as court disposition data - comparing actual with expected rates post-CCA. Similar graphical representations are plotted for both juvenile and' adult commitments. These graphs can be found in the appendix.
2. Forecasting Techniques
The multiple time-series design described above is used to plot observations (court dispositions and commitment rates) over a period of time before and after CCA entry. If a change occurs after CCA entry, we can infer that this change is due to the CCA, particularly if such changes do not occur at the same time in other counties. However, this type of analysis does not provide sufficient information for cost analysis or to compare the extent to which county areas achieved the objective of retaining offenders. An estimate of the number of offenders retained as a result of the CCA is needed. These figures are estimated using a variety of techniques.
Three basic types of forecasting techniques exist - qualitative techniques, time series analysis and projection and causal models. Qualitative techniques may be used when data are scarce or when judgmental factors or rating methods are appropriate. Time series analysis and projection are used when historical data is available and when trends and relationships are known and relatively stable. This technique is based on the assumption that existing patterns will continue into the future. Although the various methods of time series analysis prove relatively accurate in the short run, problems may arise when forecasts are made far into the future. Time series analysis cannot generally predict turning points or points at which a trend will change significantly.
The third major type of technique is causal modeling. These models are the most sophisticated type of forecasting and take into account relevant causal relationships and known dynamics of the system and related events. Causal models require a wide variety of historical data and are generally best for predicting turning points and for long term forecasts. This technique is generally costly and time consuming to develop

7
and its reliability depends on the strength of known relationships and assumptions. In the case of early CCA areas, the forecast period is relatively long and causal modeling may be more appropriate. However, for these counties sufficient historical data to construct a model is not available. For recent CCA areas there is sufficient historical data but in such cases time series analysis is equally accurate and certainly less costly.
The actual methods used are detailed in the sections that follow.
a. Forecasting Court Dispositions
The original plan had been to forecast expected commitments for individual counties testing various forecasting methods for fit by dividing data points into two parts and using the first series of points to forecast expected events in the second series. The forecast then would be compared with actual events and the method that best represented the data chosen to estimate the number of offenders retained. This method workr . well enough on a few counties but results obtained for many counties appeared to bt:: questionable because the data was not linear or because the number of observations was too small or unstable. By forecasting expected commitments from the individual county's previous history, too much weight may be given to a few deviant periods. It was decided, then, that a different forecasting method would be more appropriate.
Since sentencing patterns over the period covered do indicate the existence of a statewide trend, in spite of deviant periods or random differences; it is assumed that all counties will tend to follow this overall trend. Under this assumption an aggregate trend line seemed appropriate to project expected commitments after CCA entry. The methods used to calculate this trend line are described below.
The court disposition data set is divided into chargeable and non-chargeable offenses. For each quarter the proportion of offenders receiving a state commitment is calculated. A proportion is used to eliminate the impact of increased court activity and the accompanying increase in commitments. Because of the strong seasonal character of court dispositions, a four-period moving average is also calculated for all data points. This moving average tends to smooth out seasonal variation and also reduce the effect of random or atypical court activity.
A moving average is also calculated for all pre-CCA court disposition data. This results in sixteen quarters of usable data. From this pooled pre-CCA data a slope is calculated for both chargeable and non-chargeable dispositions. This slope is used to estimate expected commitments had the CCA not been enacted. In both cases Hennepin and Ramsey are excluded because it is felt that non-metro CCA counties are not comparable to Hennepin and Ramsey and that the large volume of cases in these metropolitan counties tends to distort any changes occurring in the smaller county areas. Hennepin and Ramsey are compared with each other using the differing entry dates as discussed above.
This method assumes that without enactment of CCA the general trend of commitments as a proportion of court dispositions would have continued into the futUre. Intuitively this makes sense because random variation in single counties tends to be smoothed and the overall trend becomes more apparent. ThUS, this method was used for both chargeable and non-chargeable offenders. The possible outcomes and conclusions are presented below.

Possible Outcomes
Reduction in number of chargeable offenders committed to the state
No reduction in number of chargeable offenders committed to the state
Reduction in number of nonchargeable offenders committed to the state
No reduction in number of nonchargeable offenders committed to the state
b. Forecasting Commitment Rate
8
Conclusions
Disincentives offered by CCA are sufficient to change sentencing patterns
Disincentives offered by CCA are not sufficient to change sentencing patterns
Increased community alternatives are sufficient to change sentencing patterns
Increased community alternatives are not sufficient to change sentencing patterns
Because of differing time periods and the lack of adequately matched counties and because court dispositions do not take into account probation revocations, the court disposition data alone could not answer the questions posed by this evaluation. Thus, some other means of estimating the number of offenders retained in the community who would h~ve been committed had the CCA not been enacted will serve to corroborate the findings. The data set used for this analysis is the number of adult commitments to the DOC.
The first step in the analysis was to develop a measure of commitment rate that would provide a more realistic estimate of the CCA's impact for those counties that were experiencing a rapid rate of growth in population-at-risk. The population-at-risk for adults includes all persons from the ages of 18 through 29. This age group encompasses approximately seventy-five percent of commitments to state institutions. While expanding the upper age limits to 39 would result in the inclusion of ninety-five percent of adult commitments, it would at the same time mask the year-to-year changes and make the rate analysis less sensitive to change.
Age estimates were based on recent estimates by the Minnesota State Planning Agency and used to revise previous estimates of expected county population in 1980. Projected population for other years is simply interpolated using three points in time: the 1970 census, the 1975 estimated population and the corrected 1980 projections.
To add credence to the analysis of court dispositions the same type of analysis was done using the commitment rates. A trend line was projected and the slope was applied to provide an estimate of expected changes in rate of commitment. These figures are compared with similar calculations using adult court disposition data. Differences are reconciled where possible. Where these two sets of figures are compatible, the confidence placed in the original trend is enhanced.
The same kind of rationale used for estimating the impact of CCA on adult state commitments applies to juvenile commitments. The CCA requires that counties participating in the Act pay a per diem charge for every juvenile committed to a state institution (except those participating in the DOC Serious Juvenile Offender Program). In the case of juveniles, an expected commitment rate is calculated in a similar manner to that used for calculating expected adult commitments. For juveniles, however, the results of such an analysis is less clear because of concurrent trends and

q
policy changes as a result of the Juvenile Justice and Delinquency Act of 1974. This Act requires that states receiving federal grants must comply with the provision " ... that juveniles who are charged with or who have committed offenses that would not be crimin~l if com mitted by an adult, shall not be placed in juvenile detention or correctional facilities ... " How this issue is handled is explained more fully in the findings.
E. Findings
1. Retaining Juveniles in the Community
a. Commitment Rate Analysis
The 1973 CCA legislation required that counties under the Act pay a daily charge for juveniles committed to a state institution. This provision was later changed to exclude a small number of juveniles committed for serious offenses and who were assigned to the Department of Corrections Serious Juvenile Offender Program.
Although state-wide juvenile population has been decreasing since 1975 resulting in a . drop in state commitments, there were at the same time other factors in addition to the CCA that may have played a part in this reduction. One of these was the nationwide movement to deinstitutionalize juvenile status offenders. In 1974 the Juvenile Justice and Delinquency Prevention Act was enacted by Congress. This Act provides direction for the handling of status offenders and appropriates money to states for that purpose. Compliance with the provisions of the Act was required within two years after submission of a plan for handling status offenders. This plan was submitted by the Governor's Commission on Crime Prevention and Control in 1975 with a compliance date of 1977. In 1976 the Minnesota Legislature enacted legislation relating to the detention of juvenile status offenders. While compliance with the provisions of the Act was not effective until late 1977, the DOC administration did take steps to limit the commitment and detention of status offenders in state institutions prior to that time. Thus, the number of juvenile status offenders in DOC institutions decreased from ninety-six in 1975 to fifteen in 1978. The proportion of status offenders committed to state institutions decreased from around thirty-three percent in 1970 to virtually none in 1979. Not all of this reduction was reflected in commitments.
Graph 1 shows the commitment rate for all non-CCA - pre-CCA counties and the postentry commitment rate for all CCA counties. There appears to be only slight evidence that the status offender legislation reduced the rate of commitment for either groups of counties. Non-CCA counties have experienced a mean increase in the rate of juvenile commitments since 1974; CCA counties excluding Hennepin and Ramsey have experienced a decrease in the rate of juvenile commitments. Graph 2 presents this data from a different perspective. The commitment rate is plotted for pooled "early participants", those county areas that entered CCA in 1974; "middle participants": those county areas that entered CCA in 1976 or 1977; and "recent participants": those county areas that entered the CCA in 1978. Although not so clear for early participants, this graph clearly shows that a drop in commitment rate did occur beginning in 1974 for all counties as a result of status offender legislation. While this legislation appears to have had an impact on juvenile commitments, the effect is separated from that of the CCA by using the slope of non-CCA counties to project rate changes expected in CCA county areas. If status offender legislation had the same impact in non-CCA counties then the net effect of the difference between expected and actual commitment rates will reflect the impact of CCA participation.

10
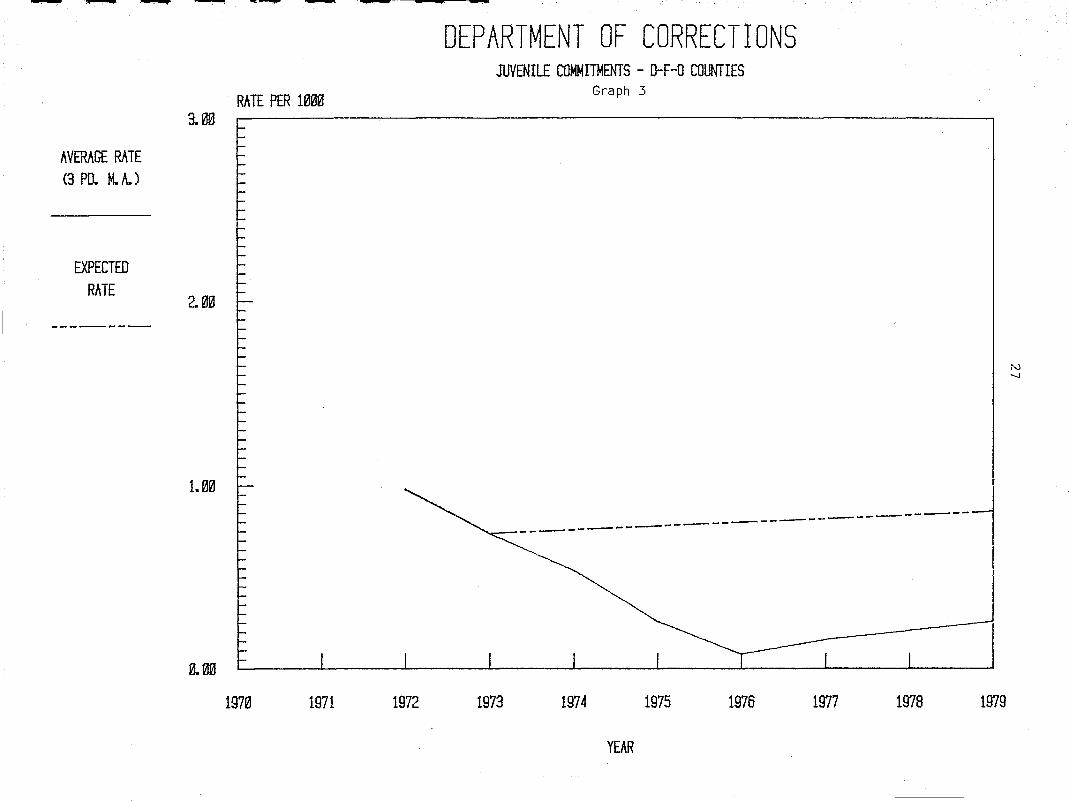
Graphs 3 through 13 show the commitment rate by county area. The actual commitment rate is plotted using a three period moving average and the expected commitments based on pooled non-CCA experience are plotted after the county entered the Act. The difference between the actual and expected provides a visual portrayal of the degree of decrease in commitments due to the CCA. Because these figures are rates and not raw numbers a wide variance between actual and expected in a small county may result in only a few juvP'liles being retained and a small variance in a large county would result in C1 ltU 5~ number of juveniles being retained. To make this distinction more clear, Table 1 gives the rank order of county areas by the percent of expected commitments that were retained in the community and the average per year for each county area.
The percent of expected juvenile commitments retained ranged from seventy-six percent in Dodge-Fillmore-Olmsted Counties to an increase in commitments in Hennepin and Blue Earth Counties. If average pre-CCA and post-CCA commitment rates are examined (Table 2), the same type of distribution is observed. That is, Hennepin and Blue Earth Counties show an increase in commitment rate while other CCA county areas show a decrease. Pre-CCA and non-CCA county areas also experienced an increase in post-CCA commitment rates. .
b. Impact on Juvenile Institution Population
In order to assess the impact of reduced commitments on institutional population, it was necessary to determine hoW many juveniles were retained in each year following CCA enactment. Table 3 shows the number of juveniles retained each year and the resulting institutional population reduction.
Despite an overall commitment reduction of almost thirty percent in CCA counties, the impact on state correctional institutions seems less dramatic; less than a one percent (3) reduction in 1974 to a nineteen percent (35) reduction in 1978. During the six year period since the first county entered the CCA, the average reduction in juvenile institution population attributable to the CCA is five percent.
2. Retaining Adults in the Community
a. Introduction
Two different data sets are used to determine the number of adults retained as a result of CCA. These two data sets are the Department of Corrections annual commitment data and the quarterly court disposition data. There are several reasons, as outlined in the Research Design section, for using both sets of data but the major one is to provide some corroboration of the findings. Where the outcome is similar, confidence in the results in enhanced. In those instances where the outcomes are very dissimilar, judgmental decisions are made to reconcile the data.
This portion of the evaluation is divided into two sections. One is devoted to results based on commitment rates; the second is devoted to results based on court disposition data. A comparison of expected commitments using both data sets can be found in Table 4.
The methodology used is spelled out in the Research Design; here only results are reported.

.# --
TABLE 1: Expected and Actual Juveni Ie Commitments by County Areas and Percent Retained
Expected Actua I Number Percent Average County Area Commitments Comm itments Retained Reta i ned Per Year
Oodge-Fi I Imore-Olmsted 55 13 42 76.4 8
Wash i ngton 21 7 14 66.7 9
Region 6 West 17 6 11 64.7 5
Crow Wing-Morrison 67 32 35 52.2 7
Red Lake-Polk-Norman 16 8 8 50.0 2
Arrowhead Regional Corrections 183 117 66 36. 1 19
Ramsey 299 199 100 33.4 18
Anoka 21 15 6 28.6 2
Todd-Wadena 5 4 I 20.0
Hennepin 226 234 (8) (3.5) (4)
BI ue Earth 16 18 (2) (12.5) (1)
Total 926 653 273 29.5 65

12
TABLE 2: Mean Juveni Ie Commitment Rates per 1,000 Juveni les Cage 13-17)
Mean Juveni Ie Commitment Rate
County Area Pre-CCA Post-CCA
Dodge-F i I I mo re-O I msted .89 . 17
Ramsey 1. 39 .74
Crow Wing-Morrison 1. 80 .77
Red Lake-Polk-Norman .95 .41
Todd-Wadena .29 .27
Arrowhead Regional Correct ions 1. 67 1.04
Anoka .62 .17
Region 6 West 1. 12 .40
BI ue Ea rth 1. 05 1. 71
Hennepin 1.27 1. 37
Washington 1. 41 .29
Pre-CCA - Non-CCA 1. 31 1.38

13
TABLE 3: Juveni Ie Commitments Retained and Reduction in Institutional Population*
Actual Expeded Number Year Commitments Commitments Reta i ned
1974 58 68 10
1975 29 70 41
1976 102 127 25
1977 99 132 33
1978 158 263 105
1979 207 266 59
Total 653 926 273
*Based on Estimated Four Month Length of Stay.
Redudion in Institution Popu I at ion
3
14
8
1 1
35
20

..
TABLE 4: Actual and Expected Adult Commitments after CCA Entry
Tota! Exoected Actual Commitments Number Retained COC Cour. COC Court COC TOTal Court Non-Comm I tments Dispositions Commitments Disoositions Commitments Dispositions Cha rOclab I e Charceabie
Dodge-FiI I Foore-OI msted 47 54 64 41 ( 17) 13 10 3 Ra;:;sey 992 997 769 757 223 240 171 69 Crow 'Iii ng-/.brri son 116 142 100 82 16 60 64 ( . ,
.."
Red Lake-Polk-Norman 55 52 25 20 ;;0 32 19 13 Todd-'dadena 7 13 12 11 ( 5) 2 (3 ) 5 Arrm:head Regiona I Corrections 289 214 256 205 33 9 (2) 11
.j:::. Anoka 18' 195 205 297 (24) ( 12) ( 15) 3 RE:g ion 6 \~est 14 9 15 8 ( 1 ) (3) 4
BlUE: Earth 14 26 12 17 2 9 7 2
Hennepin 652 499 729 588 (77) (89) (21 ) (68)
Wash ington 43 41 38 40 5 4 (3)
2,410 2,242 2,225 1,946 185 266 231 35
• G "--_ -----"---__________ ~~ __ _

15
b. Commitment Rate Analysis
Table 5 shows the rank order of county areas by the percent of the expected adult commitments retained in the community.
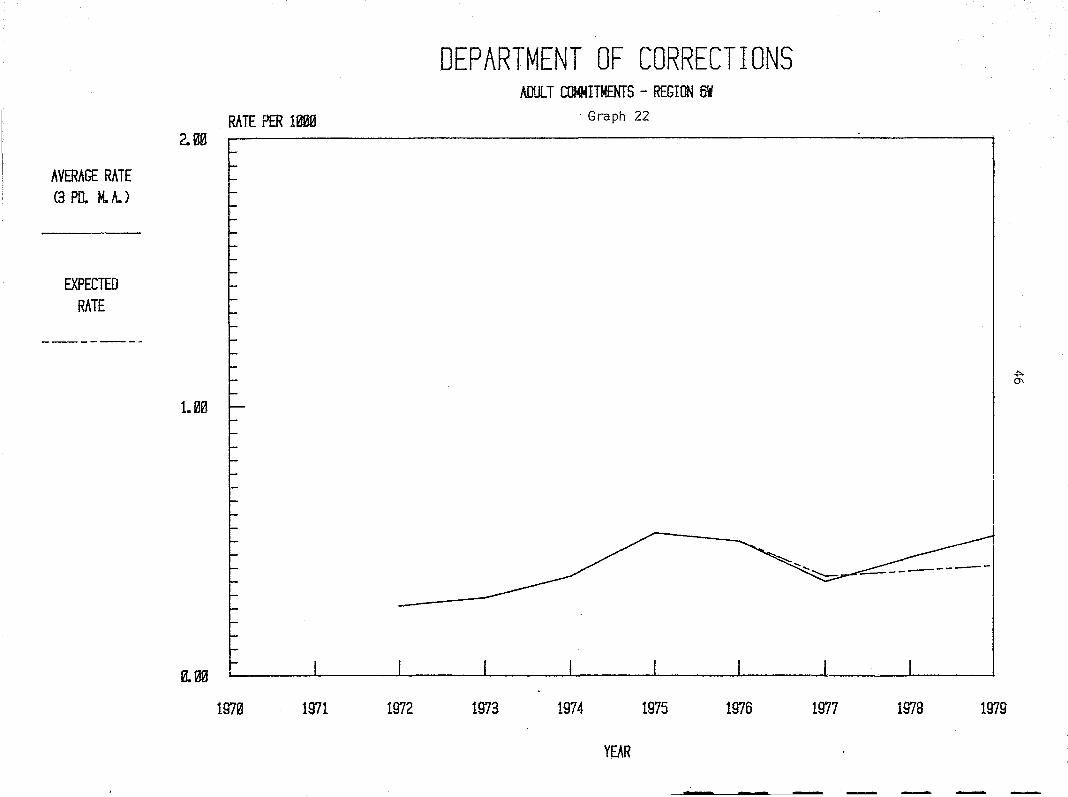
The percent of adults retained in the community ranged from fifty-four percent of e'.(pected commitments in the Polk-Red Lake-Norman county area to eleven percent in the Arrowhead Regional Corrections area. There were five county areas in which the commitments were greater than expected. Overall the percentage of offenders retained is less than eight percent. For the Dodge-Fillmore-Olmsted county area and the Todd-Wadena area the number of actual commitments was substantially higher than expected. Because the court disposition data (Table 4) indicates more offender·s retained in the community for Dodge-Fillmore-Olmsted, the discrepancy between the two data sets may be due to a high rate of violation or failure in the community. This issue is discussed in the public protection technical report. Table 6 presents the mean adult commitment rates pre-CCA and post-CCA for each of the county areas as well as the rate for pre-CCA/non-CCA counties. The post-CCA commitment rate increased for five out of the eleven CCA participating areas. The rate also increased for the pooled non-CCA/pre-CCA county areas. There is a great deal of variation in commitment rates. Urban counties generally have a higher rate than rural counties. The exception is Crow Wing-Morrison counties which had a higher rate pre-CCA than did any of the other county areas. The reasons for such variation are unclear, but generally the commitment rate is not related to the crime rate in the county areas but rather to other factors. These may include social factors, availability of resources, number of cases on the court calendar and the attitude of the judge or probation officer.
The graphs in the appendix allow visual inspection of the difference between actual and expected commitment rates for all county areas. The dotted line represents expected commitments post-CCA entry. Graph 14 plots commitment rates for early participating counties, middle participants and recent participating counties. Only the early participants show no distinct drop after CCA entry. Graph 15 through 25 plot commitment rate data for each CCA county.
c. Court Disposition Analyses
As described above, forecasting was done using court disposition data for both chargeable and non-chargeable offenses. The difference between expected and actual commitments was then calculated for each county area. This data is presented in Table 7. The total retained during the entire period of CCA participation is 266. This represents a twelve percent reduction in the number of commitments expected based on court dispositions. In five county areas the proportion of chargeables retained actually decreased; these were Todd-Wadena, Arrowhead Regional Corrections, Anoka, Region 6 West and Hennepin. The proportion of non-chargeables retained in the community decreased in three county areas: Crow Wing-Morrison, Hennepin and Washington.
Court dispositions of chargeable offenses are plotted for all county areas. Because of the very small volume of cases in some counties, non-chargeable offense data is plotted only for the larger counties. The proportion of dispositions resulting in commitment is plotted for each quarter against a trend line composed of sixteen quarters of actual pre-CCA data and the extrapolated trend. Graph 26 compares pooled pre-CCA and extrapolated trends with actual post-CCA dispositions for chargeable offenses. Graph 27 portrays the same pooled data for non-chargeable offenses. Graphs 28 and 29 make similar comparisons between Hennepin and Ramsey Counties.

r
16
TABLE 5: Expected and Ac.tual Adult Commitments by County Areas and Percent Retained*
Expected Actual Number County Area Commitments Commitments Reta i ned
Red Lake-Polk-Norman 55 25 30
Ramsey 992 769 223
Blue Earth 14 12 2
Crow Wi ng-tvb rr i son 116 100 16
Washington 43 38 5
Arrowhead Regional Co rrect ions 289 256 33
Region 6 West 14 15 (1)
Hennepin 652 729 (77)
Anoka 181 205 (24)
Dodge-Fi I I more-Olmsted 47 64 ( 17)
Todd-Wadena 7 12 ( 5)
Total 2,410 2,225 185
*Based on Commitment Rate Data
Percent Retained
54.5
22.5
14.3
13.8
11.6
11.4
(7. 1)
(11.8)
( 13.3)
(36.2)
(11.6)
7.7
17
TABLE 6: Mean Adult Commitment Rates per 1,000 Adults (age 18-29)
Mean Adult Commitment Rate County Areas Pre-CCA Post-CCA
Dodge-Fi Ilmore-Olmsted
Ramsey
Crow Wing-Morrison
Red Lake-Po I k-Norman
Todd-Wadena
Arrowhead Regional Corrections
Anoka
Reg ion 6 West
Blue Earth
Hennepin
Wash i ngton
Pre-CCA - Non-CCA
.38
1. 56
1.60
1.17
.33
1.25
.89
.35
.58
1. 55
.89
.73
.46
1. 15
1. 31
.69
.51
1. 11
1. 08
.65
.41
1.64
.78
·.85

..
TABLE 7: Actual and Expected Adult Commitments and Nu~ber of Offenders Retained*
Total Actual Number Retained County Area Expected Comm itments Total Chargeab Ie Non-Cha rgeab Ie
Cbdge··Fi I I more-Ol msted 54 41 13 10 3
Ramsey 997 757 240 171 69
Crow Wi ng-Morri son 142 82 60 64 (4)
Red Lake-Polk-Norman 52 20 32 19 13
To dd-W;::.den a 13 11 2 (3) 5
Arrowhead Regional Corrections 214 205 9 (2) 11 (;::)
Anoka 195 207 ( 12) ( 15) 3
Region 6 West 9 8 (3) 4
Blue Earth 26 17 9 7 2
Hennepin 499 588 (89) ( 21) (68)
Washington 41 40 4 (3)
Total 2,242 1,976 266 231 35
*Based on Court Disposition Data
19
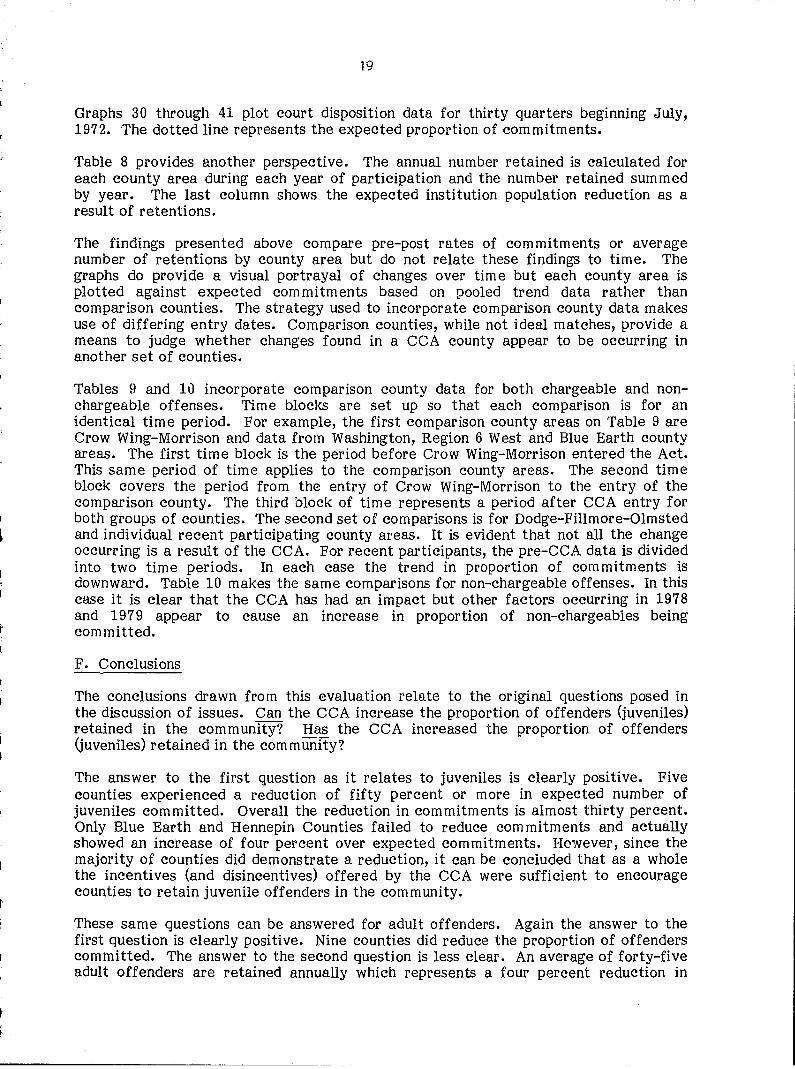
Graphs 30 through 41 plot court disposition data for thirty quarters beginning July, 1972. The dotted line represents the expected proportion of commitments.
Table 8 provides another perspective. The annual number retained is calculated for each county area during each year of participation and the number retained summed by year. The last column shows the expected institution population reduction as a result of retentions.
The findings presented above compare pre-post rates of commitments or average number of retentions by county area but do not relate these findings to time. The graphs do provide a visual portrayal of changes over time but each county area is plotted against expected commitments based on pooled trend data rather than comparison counties. The strategy used to incorporate comparison county data makes use of differing entry dates. Comparison counties, while not ideal matches, provide a means to judge whether changes found in a CCA county appear to be occurring in another set of counties.
Tables 9 and 1tl incorporate comparison county data for both chargeable and nonchargeable offenses. Time blocks are set up so that each comparison is for an identical time period. For example, the first comparison county areas on Table 9 are Crow Wing-Morrison and data from Washington, Region 6 West and Blue Earth county areas. The first time block is the period before Crow Wing-Morrison entered the Act. This same period of time applies to the comparison county areas. The second time block covers the period from the entry of Crow Wing-Morrison to the entry of the comparison county. The third block of time represents a period after CCA entry for both groups of counties. The second set of comparisons is for Dodge-Fillmore-Olmsted and individual recent participating county areas. It is evident that not all the change occurring is a result of the CCA. For recent participants, thE' pre-CCA data is divided into two time periods. In each case the trend in proportion of commitments is downward. Table 10 makes the same comparisons for non-chargeable offenses. In this case it is clear that the CCA has had an impact but other factors occurring in 1978 and 1979 appear to cause an increase in proportion of non-chargeables being committed.
F. Conclusions
The conclusions drawn from this evaluation relate to the original questions posed in the discussion of issues. Can the CCA increase the proportion of offenders (juveniles) retained in the community? Has the CCA increased the proportion of offenders (juveniles) retained in the communITy?
The answer to the first question as it relates to juveniles is clearly positive. Five counties experienced a reduction of fifty percent or more in expected number of juveniles committed. Overall the reduction in commitments is almost thirty percent. Only Blue Earth and Hennepin Counties failed to reduce commitments and actually showed an increase of four percent over expected commitments. However, since the majority of counties did demonstrate a reduction, it can be concluded that as a whole the incentives (and disincentives) offered by the CCA were sufficient to encourage counties to retain juvenile offenders in the community.
These same questions can be answered for adult offenders. Again the answer to the first question is clearly positive. Nine counties did reduce the proportion of offenders committed. The answer to the second question is less clear. An average of forty-five adult offenders are retained annually which represents a four percent reduction in

20
TAGLE B: Adult Offenders Retained and Reduction in Institutional Population*
Actual Year Commitments Expected Number Retained
1974 168 187.8 19.8
1975 152 190.0 38.0
1976 250 313. 1 63.1
1977 280 327.4 47.4
1978 685 691.8 6.8
1979 690 701.2 11.2
*Based on Estimated Eighteen Month Length of Stay.
Reduction in Population
20
48
82
79
31
15

r I
21
TABLE 9: Comparison of Proportion of Chargeables Committed by Time Period and County Areas
Crow Wing-Morrison 29.8 X 12.9 BI ue Earth 19.3 9.7 X
Crow Wing-Morrison 29.8 X 11.6 Wash ington 36.6 12.9 X
Crow Wi ng-Morr i son 29.8 X 12.4 Region 6 West 9.6 5.8 X
Dodge-Fi I lmore-Olmsted 6.9 X 5.0 Blue Earth 20.0 10. 1 X
Dodge-Fi I Imore-Olmsted 6.9 X 5.8 Washington 38.4 13.7 X
Dodge-Fi I Imore-Olmsted 6.9 X 5.2 Region 6 West 6.3 5.8 X
x = CCA Entry
7.6 5.8
8.3 8.9
9.9 9.3
4.7 5.8
4.9 8.9
4.2 9.3

22
TAGLE 10: Compari son of Proport ion of Non-Chargeab I es Comm itted by Time Period and County Areas
Crow Wing-Morrison 37.5 X 34.7 48.9 Blue Earth 50.0 45.8 X 41. 7
Crow Wing-Morrison 37.5 X 40.0 44.4 Washington 27.3 45.5 X 58.5
Crow ~I/ing-Morrison 37.5 X 32.5 49.0 Region 6 West 50.0 50.0 X 20.0
Dodge-Fi Ilmore-Olmsted 23.8 X 16.0 26.7 Blue Earth 55.5 42.3 X 41.7
Dodge-Fi I Imore-Olmsted 23.8 X 20.3 22.5 Washington 25.0 45.6 X 58.5
Dodge-Fi I lmore-Olmsted 23.8 X 16.0 26.7 Region 6 West 50.0 50.0 X 20.0
x = CCA Entry
1
1

r
23
total commitments to adult correctional institutions. This represents an average annual reduction in institution population of approximately sixty-seven offenders. These figures are based on court disposition data and thus do not include revocations. If actual commitment data were used the reduction in commitments would be around three percent which would result in an average institutional population reduction of approximately fifty-one offenders. Six county areas increased the proportion of chargeable offenders retained and seven county areas increased the proportion of nonchargeable offenders retained. Because the majority of the county areas did increase the proportion of offenders retained, it must be concluded that the CCA incentives (disincentives) are sufficient to change sentencing patterns in the majority of CCA county areas. It must be remembered, however, that the actual numbers retained are relatively small. Whether or not the number of offenders retained is sufficiently great for some counties to achieve other goals will be discussed in the overview of this report.
It had been hypothesized that the per diem charge for committing non-serious offenders would be sufficient disincentive to induce counties to retain these offenders in the community. In some county areas this was clearly the case; in other county areas no difference is noted. The Act does not require that county areas retain offenders but rather that CCA monies be used for correctional programs of some kind. Sending an offender to a state institution and paying the daily charge is clearly a viable option for some county areas.
Further, it had been hypothesized that the subsidy granted under the CCA would be sufficient incentive for counties to develop alternatives to incarceration for nonchargeable offenders and thus, retain more of these offenders in the community. This did not occur to any great extent in any county with the exception of several small county areas, Region 6 West, Red Lake-Polk-Norman and Todd-Wadena. These county areas had a fifty percent or more reduction in the proportion of non-chargeables ~ committed. Overall, the apparent impact of the CCA was to decrease the proportion of both chargeable and non-chargeable offenders com mitted which in tUrn reduced the wide disparity in sentencing practices among participating counties.
The table below summarizes the findings.

"
24
TABLE 11: County Areas in Which the Proportion of Offenders Retained Increased as a Result of CCA
Adults CCA Area Juven i I es Chargeable
Dodge-Fi I Imore-Olmsted X X
Ramsey X X
Crow Wing-Morrison X X
Red Lake-Polk-Norman X X
Todd-Wadena X
Arrowhead Regional Corrections X
Anoka X
Region 6 West X
Blue Earth X
Hennepin
Wash i ngton X X
Non-Chargeable
X
X
X
X
X
X
X

.,.............
PRE& NON-CCA COUNTY AREAS
POST-CCA COUNTY AREAS
3.00
2.00
1.00
a00
RATE PER 1000
~ t:
1970 1971 1972
DEPARTMENT OF CORRECTIONS JUVENILE COMMITMENTS
Graph 1
l t I
I I I I
! .
j~ / ~ I I
!
"'" ,___ J '" / ----- /' ",." ----......
'",-//
1973 1974 1975 1976 1977 1978 1979
YEAR

EARLY JOINERS
MIDDLE JOINERS
LATE JOINERS
DEPARTMENT OF CORRECTIONS COMMITMENT RATE COMPARISONS - CCA CO's.
RATE PER 1000 (JUVENILES) Graph 2
3.00 ~ -----~--.~--
~.
2.00
1.00
1/""'-/ ""'-,
r" /' ''-----------.\\ .\, \ ! ,-, \ i
"'" ,I /A............. .~.~.\ I .'-..." -~' / ....................... .----- \ '. -----! ,-~'" / .----.....------ '--\---- I
/ \ . ' ~\ ! ' ~ \ I // "'-", /' \ . .---4
1
. /' \----. ~ ~ ( 'I _I 1:-0.00
1970 1971 1972 1973 1974 1975 1976 1977 1978 1979
YEAR
. ~
N CI
'"1\
~~~ ~----- --
AVERAGE RATE (3 PO. M. A.)
EXPECTED RATE
3.00
2.00
1.00
0.00
RATE PER 1000
1970 1971 1972
DEPARTMENT OF CORRECTIONS JUVENILE COMMITMENTS - o-F-O COUNTIES
Graph 3
-----------------------------------------------
1973 1974 1975 1976 1977 1978
YEAR
1979
N -....J

"VERAGE P.A TE (3 PO. Meld
EXPECTED RATE
3.90
2.00
1.00
a.oe
RATE PER 1BmJ
1970 1971
DEP-ARTMENT OF CORRECTIONS JUVENILE aJ4MITMENTS - RAMSEY COltITY
Graph 4
---------------------------
1972 1973 1974 1975 1976 1977 1978
YEAR
____ ~ .... L_ __ ~ .... ~ __ ~ ...... ____ ~ ..... ~ __ , ________ ~ ... rl ___ __ __ _
1979
N co

AVERAGE RATE (3 Po. M./d
EXPECTED RATE
aoo
2.00
1.00
0.00
RATE PER 1000
1970 1971 1972
~~ .. ---------------~ DEPARTMENT OF CORRECTIONS
JUVENILE COMMITMENTS - C-W/MORRISON CO'S Graph 5
-----------------------------------------------
1973 1974 1975 1976 1977 1978
YEAR
1979
f'J \0

AVERAGE RATE (3 Po. M. A.)
EXPECTED RATE
---
3.00
2.00
1.00
0.00
RATE PER 1300
1970 1971 1972
DEPARTMENT OF CORRECTIONS JUVENILE COMMITMENTS - P-RL -N CO's.
Graph 6
--------------------
1973 1974 1975 1976 1977 1978
YEAR
VI o
1979

AVERAGE RATE (3 PO. M. A.)
EXPECTED RATE
3.00
2.00
1.00
0.00
RATE PER 1000
1970 1971 1972
DEPARTMENT OF CORRECTIONS JUVENILE COMMITMENTS - TOOOI'WADENA CO/s.
Graph 7
Vi
1973 1974 1975 1976 1977 1978 1979
YEAR

AVERAGE RATE (3 PO. M. It.)
EXPECTED RATE
3.00
2.00
1.00
0.00
RATE PER 1mi3
197~ 1971 1972
DEPARTMENT OF CORRECTIONS JlNENILE COMMITMENTS - REGION 3
Graph 8
~-------------------------
1973 1974 1975 1976 1977 1978
YEAR
1979
VJ N

AVERAGE RATE (3 PO. M. A.)
EXPECTED RATE
-----,,- wq ~ ~ ----------
RATE PER 1000 3.00
2.00
1.00
0.00
1970 1971 1972
DEPARTMENT OF CORRECTIONS JUVENILE COMMITMENTS - ANOKA COUNTY
Graph 9
------------------------------
1973 1974 1975 1976 1977 1978
YEAR
1979
VJ VJ

II VERAGE RATE (3 PO. M./d
EXPECTED RATE
•
3.00
2.00
1.00
aoo
RATE PER 1009
1970 1971 1972
-
DEPARTMENT OF CORRECTIONS JUVENILE COMMITMENTS - REGION 6V
Graph 10
1973 1974 1975 1976
YEAR
1977 1978 1979
VI ..,.
-:;;;

AVERAGE RATE (3 PO. M. A.)
EXPECTED RATE
3.03
2.00
1.00
0.00
RATE PER 1030
1970 1971 1972
DEPARTMENT OF CORRECTIONS JUVENILE COMMITMENTS - BlUE EARTH COUNTY
Graph 11
1973 1974 1975 1976
YEAR
---- -
1977 1978 1979
:..N \J1

AVERAGE RATE (3 PO. M.A.)
EXPECTED RATE
RATE PER 1000
aoo ~
§
~ 2.00 f
~
~ 1.00
DEPARTMENT OF CORRECTIONS JUVENILE COMMITMENTS - HENNEPIN COUNTY
Graph 12
, I
VI (J)
a.30~ '-----:-~~~~~~~_I 79 I
1970 1971 1974 1979 ·1975 1976 1977 1978 1972 1973
YEAR

AVERAGE RATE (3 PO. M..A..)
EXPECTED RATE
3.00
2.00
1.00
0.00
RATE PER 1000
1970 1971 1972
DEPARTMENT OF CORRECTIONS JUVENILE COMMITMENTS - ~ASHINGTON COUNTY
Graph 13
1973 1974 1975 1976
YEAR
------
1977 1978 1979
Lo.J -...J

EltRLy JOINERS
MIDDLE JOINERS
LATE JOINERS
DEPARTMENT OF CORRECTIONS COMMITMENT RATE COMPARISONS - CCA CO's.
RATE PER 19 OOUL TS) Graph 14
~~ ~ 1 I
1.00
,/A.
---~" //" '"~" . __ .---- '- / "'.''- --.------.~ '-,/ '-'_-'- ""'-. ~ / ' , / ~
~\\ \\ \
//"'-...., / '
,,'-- // " ,/ .-
'- / /' . "'./ / ' . /'
/ , /
, / "'-..../
. / , ,
'" '- / , / \, ~------- " / , /
I I
I I ! I
V \, /
'v ~ I
a~ ~ I
I I
1970 1971 . 1972 1973 1974 1975 1976 1977 1978 1979
YEAR
VI co

AVERAGE RATE (3 Po. M. A.)
EXPECTED RATE
RATE PER 1000
~oo t
1. 00
0. 00
1970 1971 1972
DEPARTMENT OF CORRECTIONS ADULT COMMITMENTS - D. F. 0. COUNTIES
Graph 15
l
I _ ;--i
--------------------------------------------- I
1973 1974 1975 1976
YEAR
1977 1978
I I
1979
\A \.::l
<I

AVERAGE RATE (3 PO.. M. It. )
EXPECTED RATE
2.00
1.00
aoo
RATE PER 1003
1970 1971 1972
DEPARTMENT OF CORRECTIONS ADlJL T CGtMITMENTS - RAMSEY COUNTY
Graph 16
-------------------------------------
1973 1974 1975 1976 1977 1978
YEAR
~
1979
- ----

AVERAGE RATE (3 Po. M. A.)
EXPECTED RATE
2.00
1.00
aoo
RATE PER 1000
1973 1971 1972
DEPARTMENT OF CORRECTIONS AOUL T COMMITMOOS - CROW WINGIMORRlSON
Graph 17
----------------___ ....l_--
::1
1973 1974 1975 197t1 1977 1978 1979
YEAR

AVERAGE RATE (3 PO. M. It.)
EXPECTED RATE
2.mJ
1.00
0.00
RATE PER 1008
1970 1971 1972
DEPARTMENT OF CORRECTIONS MlUlT COttfITHENTS - POlKIRED LAKEINORMAN
Graph 18
--------------------------------
L _____ ~~ __ L~ ___ J ____ ._ __1 __ ... _
1973 1974 1975 1976 1977 1978
YEAR
1979
..,. N

AVERAGE RATE (3 PO. M. A.)
EXPECTED RATE
PJtTE PER 1008
~oo ~
E
~
1.00
0.00
1970 1971 1972
DEPARTMENT OF CORRECTIONS ADULT COMMITMENTS - TODD/WADENA COUNTIES
Graph 19
1973 1974 1975 1976
YEAR
1977
I I I
___ --------1
1978 1979
.t:> ,,-I

AVERAGE RATE (3 PO. V", A.)
EXPECTED RATE
2.00
1.00
8.00
RATE PER 1003
1970 1971 1972
DEPARTMENT OF CORRECTIONS ADUlT COMMITMENTS - REGION 3
Graph 20
--------------------~~------------------------------------~~==::~~~::~::~::::~~~: -
1973 1974 1975 1976 1977 1978
YEAR
1979
..,. ..,.

AVERAGE RATE (3 Po. M. A.)
EXPECTED RATE
"
. 2.00
1.00
0.00
RATE PER 1000
[: ~
1970 1971 1972
DEPARTMENT OF CORRECTIONS ADULT COMMITMENTS - ANOKA COUNTY
Graph 21
-
------------------------------
1973 1974 1975 1976 1977 1978 1979
YEAR
.;>. v.
A VERAGE RATE (3 PO. M. A.)
EXPECTED RATE
2.03
1.00
0..03
RATE PER 1003
1970 1971 1972
DEPARTMENT OF CORRECTIONS
1973
ADULT COMMITMENTS - REGION 6W Graph 22
1974 1975
YEAR
1976 1977 1978 1979
.j:>. 0'1

AVERAGE RATE (3 PD. M. A.)
EXPECTED RATE
ItUE PER 100B 2.00
1.00 >-
a. 00
1970 1971 1972
DEPARTMENT OF CORRECTIONS ADUlT COMMITMENTS - BlUE EARTH COUNTY
Graph 23
1973 1974 1975 1976
YEAR
~------.---
1977 1978 1979
..:::. -.J

AVERAGE RATE (3 Po. M. A.)
EXPECTED RATE
RATE PER 1000
2.00 E ~
I
F 1.00
0.00
1970 1971 1972
DEPARTMENT OF CORRECTIONS ADUlT COMMITMENTS - HENNEPIN COUNTY
Graph 24
---~-I
1973 1974 1975 1976 1977
YEAR
1978
------j
I !~ leo I
I I
1979

AVERAGE RATE (3 Po. Mold
EXPECTED RATE
2.00
1.~0
0..00
RATE PER 1300
~
~ 1970 1971 1972
------~- ---~~--~---------------~---------------------
DEPARTMENT OF CORRECTIONS ADUlT COMMITMENTS - WASHINGTON COUNTY
Graph 25
1973 1974 1975 1976
YEAR
1977 1978 1979
.:::. '.0

Actual Commi tmants
55..0
58.0
45.0
Expected 40. 0 Commi tmants
35.0
30.B
25.0
2~U"
15.0
10.0
5.0
0.0
ADULT COURT DISPOSITIONS COMPARISON PRE-CCA/POST -ceA CHARGEABlE aM4ITMENTS
4-Period Moving Averoge Graph 26
---
1 2 3 4 5 6 7 8 9 10 11 12 13 14 15 16 17 18 19 2S 21 22 23 24 25 26 Zl 28 29 30
Crtr-. (3rd. '72 to 4th. '79)
v: o

Actual Commi tments
55.~
sa~
45.~
Expected 4a ~ Commitments
35.0
3300
25.0
2110
15.0
la0
5.0
a0
--
ADULT COURT DISPOSITIONS COMPARISON ' .. \
PRE-CCAIPOST -CCA NtlN-CHARGEABlE COMMITS.
4-Period Moving Average Graph 27
----------------------
U1
1 2 3 4 5 6 7 8 9 10 11 12 13 14 15 16 17 18 19 20 21 22 23 24 25 26 27 2B 29 30
Qrtr. (3rd. '72 to 4th. '79)

Ramsey County
Hennepin County
ADULT COURT DISPOSTIONS COMPARISON ~INIRAMSEY CHARGEABlE C£Mo4ITHENTS
4-Period Moving Average Graph 28 73.0 -r-65.0 t
---------------- _._'------
•
60.~ l=-E L
55.0 ~ l-t:
50..0 g-45.0 f:
40..0
35.0 r--
3a0 E..
25.3 ~ ~ t: ~ __
20.0 ~ ---...
[
".... I .......... .... _........... (
15.0 "----_ / ... ~ .... --...... / 0..,.,.-----------:]-E -------------
lU r ! 5.0 I I Uri I I I I J I. JI I I I _ L_ I I J. L _ L I L_ L _L J . J I_I I JJ
1 2 3 4 5 6 7 8 9 10 11 12 13 14 15 16 17 18 19 2B 21 22 23 24 25 26 27 28 29 30
Qrtr. (3rt!. 172 to 4th, 179)
U1 N

Ramsey County
Hennepin County
ADULT COURT DISPOSTIONS COMPARISON I-ENNEPINIRItNSEY NON-CHARGEABlE COMMITS.
Graph 29 4-Period Moving_ Average
78.0 E - ~
~B f ~ '~~ -------------.----- -----------l
I I
68.0 t:- ~ /~, ~Br V 50.
tJ
ll- ...------" -----~',~-" ~ --45.0
4a. 0 f-r
35.0 S-"-
31t0 E-~ ~
25.8 ~ 2a0 §
F 15.0 t laB ~
~ 5.0 E-
' - ~-- , , , , - ''V' "v
I
I I i I
..---1
---->~ ! '1 ~
I
F I a0 L I 1 _~I---L...-----'-----!---I
1 2 3 4 5 6 7 8 9 10 11 12 13 14 15 16 17 18 19 23 21 22 23 24 25 26 27 28 29 30
Qrtr. (3rd. '72 to 4th, '19)

Pre-CCA Except Hen-Rom
Dodge-F i 11-IIOt"6-Oll'll8ted
ADULT COURT DISPOSITIONS COMPARISON PRE-CCAID-F-o CHARbEABlE OlO4ITMENTS
Graph 30 4-Period Moving Average 70.8 [ -=-----.----
6S. B r-
60.0 ~ ~8 ~ 50.0 f 45.0 '
4L8 F 35.8 f 30.0 ~
! 25.0 !=-
~
I ! I i
I ! !
2Uf ~ 15.9 f !
UtB t::- /~, ---~l c --... ___ ......... r- :
5.3 ~ '-.... /// ""-,----//--------'\ // -""-"'/' -----\ )1 F I I i I I j I I I I I I 1 I (' l I I I I I I I I I 't::1 RoB -
1 2 3 .{ 5 6 7 8 9 10 11 12 13 14 15 16 17 18 19 20 21 22 23 24 25 26 27 28 29 30
Qrtr. (3rt!. '72 to 4~ '79)
VI .j:>.

Pre-CCA Except Hen-Ram
Crow Wino-y
Morrison
ADULT COURT DISPOSITIONS COMPARISON PRE-CCA/CROW-MOHR. CHARGEABlE COMMITS.
4-Period Moving Average ___ . ___________ . _ _ ___ ._ _ __ ... __ r----.. -- -.-- --------. 70.fl Graph 31
--l 65.0
60.0
l l 1= l-
ss. a r-!= c
5&.0 r j-.-L--
t 45.0
40.0 ~ 35.0 ~
l ..... 3aB
~ ~
l-25.0 t
20.0 ~ i=
15.0 ~ r
13.B ~ ..,/
r .... ,'-I " ... I \
/ \ I \
I \
I "\ I '\ I \
/ \
/ '\ I~, \
I "-.', r--___.,
/ "------,,--- ~ " ',,- ------ --> \ .-
\ ".
~0 r 0.B c I _L-LJ
'\ --- ~----.; '''-''--/ I,~
I -L_L 'I L I I _L-L __ _.
1 2 3 4 5 6 7 8 9 1£1 11 12 13 14 15 16 17 18 19 ~ 21 22 23 24 25 26 27 28 29 30
Crtr. (3rt!, 172 to 4th, 179)
Vi Vi

Pre-CCA Except Hen-Ram
Todd-Wadena Counties
._-----
7a.B
65.B
6a.B
55..0
5a.B
45.0
4a0
35.0
30.0
25.0
~0
15.0
U1.0
5.0
0.0
ADULT COURT DISPOSITIONS COMPARISON PRE-CClJTODO-'iMJENA CHARGEABLE ClU4MITS.
4-Period Moving !w~ Graph 32
rt rt=I:
~ l ~ l
-----_ .. _------- -----, I ! I . I I i i
~ r', i c , ", ~ , , i=- / ; t , i ;... , i r~ ~ /"", , ",," " j
" '" , ! . , ---- "" / I t- , 'l . 1:- / I ! I ',j .....l.-.--L.-~ ~ I V I I _ I L I..L
1 2 3 4 5 6 7 8 9 10 11 12 13 14 15 16 17 18 19 20 21 22 23 24 25 26 27 28 29 33
Crtr. (3rd, '72 to 4th, '79)
..... , ................ ~--~ .... ~ .......... ----...... ----~ .... ~----...... --............ ~ ...... ----...... --------------~----------------~---------
\Jl C'I

Prs-CCA Except Hen-Ram
----_._--
Region6W
ADULT COURT DI£POSITIONS COMPARISON
4-Period Movins Average
PRE-ccAlREGION-6Y CHARGENli COMMITMENTS Graph 33 :: [--------
E 6a~ ~
E 55.~ t-
------ .---- ---_ .. _-_ ... _ .. ------------, 1
I-
sa0 ~ 45.~ ~ 40.0 l
t-
35.0 l r: 30.0 E-25.~ l
~
20.0 ~ r-~ i-
15. 0 l=e
10.0 f' 5.0 l=-
t-
8.0 LJ
/\ ~ I \ "" ! \\ ~""
I \ '----., ,. "'" ...... , ,. '-I_./" ' /' ,
! --- \ / \ I \ " \ i / \_- I /.
-- . , ~ / ~i
/' "'"'\ /' -------- \/--, ".-- / ',/
lIl_-L.-.l---.l __ L_L_l_L.L _ I l _ \L1/_<L..L-.l. __ .Lj:=l_L __ L.L_L I ! i
1 2 3 4 5 6 7 8 9 10 11 12 13 14 15 16 17 18 19 20 21 22 23 24 25 26 27 28 29 30
Crtr. (3rd, '72 to 4th- 179)
\.,"1 -....!

ADULT COURT DISPOSITIONS COMPARISON
4-Period Moving Average 7a.B
PRE-CCAIP-RL -N CHARGEABlE C£OO.iITMENTS
Graph 34
Pre-ccA Ex- 65. 0 capt Hen-RCII!
Polk-Red Lake-NortIICin
aa.o .... I-
55.0 r ;...
50.8 r ~8 t 4f~0
35.0 ~ ~
30.0 E-
aa r 20.0
15.0
laO
5.8
3.0
/\ I \
~\ /{ ~
/1 ~ .... ____ \ ~;' \ /~ ! \1 ~ ,
" J \ / ",--_, '- " "
1 2 3 4 5 6 7 8 9 10 11 12 13 14 15 16 17 18 19 23 21 22 23 24 25 26 27 28 29 30
e,"k. (3rd. '72 to 4th. '79)
V1 OJ

Pre-CCA Except Hen-Ram
Blue Earth County
ADULT COURT DISPOSITIONS COMPARISON PRE-CCAlll.UE EARTH CHARGEABlE COMMITS.
7a0 Graph 35 ______ ~ ______ .. _____ ._"'.~ 4-Period Moving Av~__ --- -- ---_ -- --.-- . -- ----. _ I
----- I
F : ~ I I--65-0 • ~ r-<--
55.8 E 60..3
~ r
5ll.8 ~ 45.0
~ ~ E
4a0 t 35.0 ~ 3a.0 t 25.0 E-
l-
f ""'- -~" 15. ~ t- -->:./--~" '-~ D t - ---. "- - ... .----.... "
, ~" j- " ~ i t:! t:! r ,,-... ~ DoD ~ ... _~ ~ __ _
'-- "--. ,- '\.. ----- ;
5. 0 t=- '--------------.-"'---., .....--' ......- -../'/ . 0. 0 U-L I l--.L_l __ ~_._J.. __ LJ __ J__L_Li--J-_L_L_ I I l 1 L I I. - I I I
2a0
1 2 3 4 5 6 7 8 9 10 11 12 13 14 15 16 17 18 19 2a 21 22 23 24 25 26 27 28 29 30
Crt!". (3rd, '72 to 4th, '79)
V1 ~

Pre-CCA Except Hen-RCIII
Region 3
ADULT COURT DISPOSITIONS COMPARISON PRE-CCVREGION-3 GfARGEABlE COMMITMENTS
4-Period Moving Average Graph 36
78.3
65..B
6O.R
r------.-----.---:' -·--·-.. ---~-----~----------l c ! • I ~ , r ; ~ I ~ .
f 55.0
se.o
~ ! r '
45.g r 49.B f J5.0 E-
l-
f r 3a.B
25.8
r
E/, 15. B E- /' ---===-- __ ---.. ~~''-
F 1/ -- ' .. ---', ----..""""" laB E- I '-_ ... ------ ...... - ... "'------
5. 8 ~ I ----~--- -::-:: ... ::--==-=--==-:-:--::-:::::::~ ... ::-,-,-----... -~-~
B.B lLLL 1 L_Ll L1 ~'l_---L~l I I I 1. j I I I I I
2B.E
1 2 3 4 5 6 7 8 9 10 11 12 13 14 15 16 17 18 19 2iJ 21 22 23 24 25 25 27 28 29 33
Qrtr.(3rd, 172 to 4th. '?J)
0'1 o
Pre-ccA Excapt- Hen-Ram
RbSion 3 c"l'\Unties
ADULT COURT DISPOSITIONS COMPARISON
4-Period Moving Average
:: f BaO r.=-
j:
55.0 t... t. I-
50.0 t::.-
45.0 ~ 410 E-35.0 ~
~ 3a.0 .-~
25.0 §-2a0 t 15.0 C-
Ht0 ~ I-
PRE-CCh/REGION 3 NON-cHItW.BLE COMHIT5.
Graph 37
j .... I "', I , I, ~\
'..,j \ r-.,· \ I , 1\,
/ \---J ~ --
-----l I I i I i I I
I ! I
!
\ I '\ //"'---\ 'I 0\
\ , \ '-. __ ...---,. ~
5.0 f a.0 I . I I I I I
~ L--.j~_ 1.-.--J---l.--J_...L..-..L.-.I--IL...-.-.J.---L._--L.~---l--J---...L.-.....L---.1_-1--,,----,L ..L..I -J..---J.--'---'---'----J
1 2 3 4 5 6 7 B 9 10 11 12 13 14 15 16 17 18 19 2e 21 22 23 24 25 26 27 28 29 38
Crtr. (3rd, '72 to 4th, '79)

Pre-ccA Except Hen-ROlII
Anoka County
ADULT COURT DISPOSITIONS COMPARISON
4-Period Moving Averose 78.9 ~ -
65.B l E
BaB !-
§ 55.9 [
50.B t 45.~ t-40.B ~
L
35.B ~ ~ ,"-.....-
30. B I=- / -,\ ~ I \
PRE-ccAI AN(l(A 0fARGEABlE CtlitITMENTS
Graph 38 ----------1
~ / \ /, ... 25.0 F ' "'- ... _/ '~" .,,-- ........
~ / ", / "'-" 23.3 l ~/ .... , / "" ,
......... I .... I g - "--' ---------; 15. 0 F "---_ ' ~
llU t- -; ~ ; ~
5.0 r I I I _ I 8.0! I I l_L.-L I L_J I
1 2 3 4 5 6 7 a 9 10 11 12 13 14 15 16 17 18 19 20 21 22 23 24 25 26 27 28 29 311
Qrtr. (3r-d. '72 to 4th, '79)
0\ N

Pre-CCA Except. Hen-ROIr
Anoka County
ADULT COURT DISPOSITIONS COMPARISON PRf-CCM ANOKA co. NON-CHARGEMU COMMITS.
4-Period Moving Average 70. 0 1=
r 65.0 ~
lt-
mB ~ ,.... ~
55.0 tt
5a0 r 45.0
40.0 .. >-
35.0
30.0 1= t-
25.tj
2a0
15.0 F
10.0 r
/''\, I ,
I \ __ J , / /1--/.\" ~r-/ v" \~//
Graph 39
"
:: [I .. ILl L.1.. 1_.L.L1 I I. L . .J 1_-'
1\
1\ I ,
I ,
/ \ ,-
/' /" ....
\ " ' ....
'\ " V' \ /
, I
'-.I'
[ L I I I
1 2 3 4 5 6 7 8 9 10 11 12 13 14 15 16 17 18 19 ~ 21 22 23 24 25 26 27 28 29 33
Crtr. (3rd, 172 to 4th. '79)
-----------------------------------------------------------------------------------------------------------------------------
0\ I.JJ
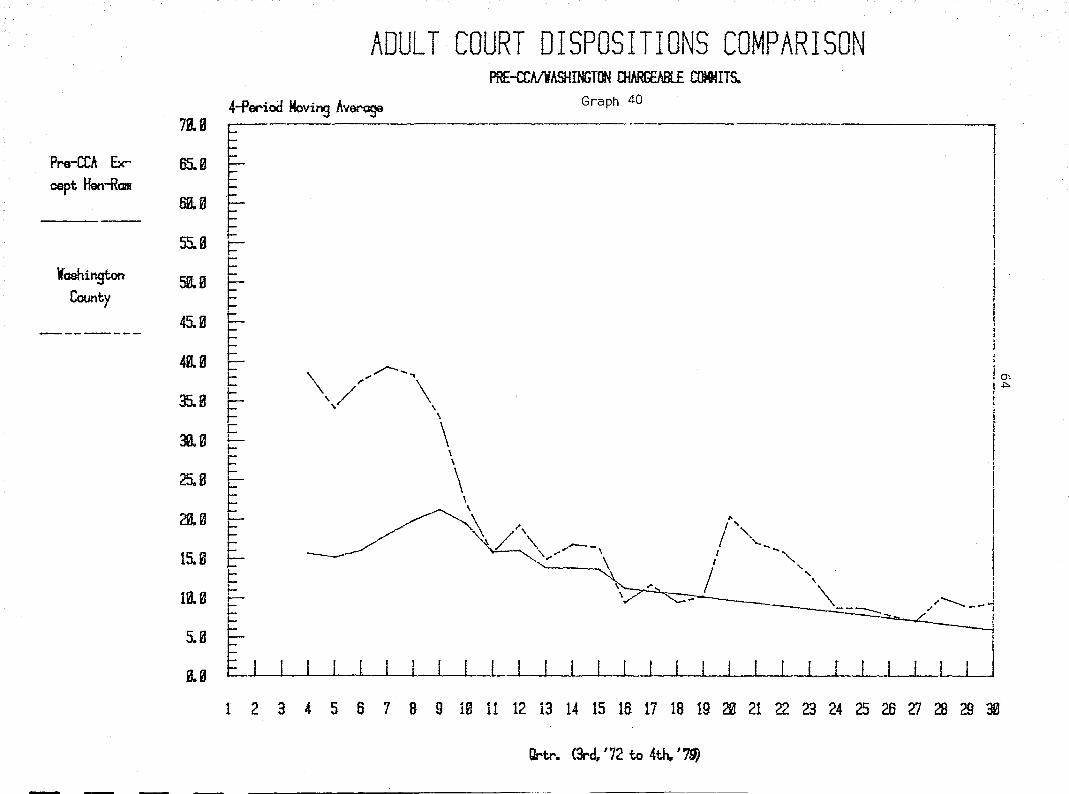
Pre-ccA Except Hen-ROIlI
Washington County
ADULT COURT DISPOSITIONS COMPARISON PRE-CWVASHINGTIJ1 CHARWa.E COMMITS.
4-Period Moving Average Graph 40
78.8 r-6S.B .~ 68.0 ~ 55.0 E-
E sa8
45.0
4B.0 ~ t:
35.8 r c
3a.0 lr F
25.8 f 2B.B r
..... 15.0 t:-
t::
~" ... \ / \ '/ \ , \
\ , \
\ \
/~ ?,
~ ~,/~~\
I i
I I c I
! I , I I I I I
! ; ,
I i·~... I
1:: I:.~I~-L-L-L~~~_ ". i I" I
/ '\ /~--i ~~~~~---- -------.~
1 I I I I I I -L-1-..L.-JI....--...._. I I I I 1~1 I
1 2 3 4 5 6 7 8 9 HI 11 12 13 14 15 16 17 18 19 2B 21 22 23 24 25 26 27 28 29 39
Qrtr. (3rd, '72 to 4th. '71)
'" ..,.

7a.~
Pre-CCA Ex- 65.0 capt Hen-Ram
60.0
55.~
Washington 50.0 County
45.0 -----_.
48.0
35.0
30.0
25.0
2R.~
15.0
18.~
5.~
B.,0
ADULT COURT DISPOSITIONS COMPARISON
4-Period Moving Average
r-
, I I
, I F- I \ ;' I
~ / \/ l-
I t
F- / I
I
r /
1 2 3 4 5 6 7 8
/ /
/
9
PRE-CCIJWASH. co. NON-cHARGEltBLE COMMITs..
t I I \
/ \ I I I \
Graph 41
!I : \ / \ / \
,-__ ....J I
I I
I / I I \ /
\ / \ /
\ /~" /' \ / " \I
/'-.......
,I , /" ... -../
,,"
1~ 11 12 13 14 15 16 17 18 19 20 21 22 23 24 25 26 27 28 29 30
Crtr. (3rd. '72 to 4th, '79)
0\ U1

66
REFERENCES
1. Rossi, P. H., Freeman, H. E., Wright, S. R. (1979) Evaluation: A Systematic Approach, Sage Publications, Inc., Beverly Hills.
2. Minnesota Governor's Commission on Crime Prevention and Ct;, ltrol (1976), An Analysis of Minnesota's Criminal Justice System, St. Paul, Mn.
3. Ibid.
4. Campbell, D. T. (1975), "Assessing the Impact of Planned Social Change" in Social Research and Public Policies, University Press of New England.
5. Minnesota Department of Corrections (1977), Impact of the Community Corrections Act on Sentencing Patterns, St. Paul, Mn.
6. Office of the State Demographer, Minnesota Planning Agency (1979), Age Estimates for Minnesota Counties, 1975.
7. Ibid.
8. Office of the State Demographer, Minnesota State Planning Agency (1975), Minnesota Population Projections: 1970-2000.
9. Ibid.
10. Minnesota Department of Corrections and Crime Control Planning Board (1980), Minnesota Community Corrections Act Evaluation.


