Western Minnesota Regional Freight Study i Minnesota Department of Transportation Western Minnesota Regional Freight Study Final Report September, 2009 Prepared by Wilbur Smith Associates, in Partnership with SRF Consulting Group, Inc., C.J. Petersen and Associates, and The University of Toledo
Transcript
Western Minnesota Regional Freight Study i
Minnesota Department of Transportation
Western Minnesota Regional Freight Study
Final Report
September, 2009
Prepared by Wilbur Smith Associates, in Partnership with SRF Consulting Group, Inc.,
C.J. Petersen and Associates, and The University of Toledo
Key Findings and Recommendations......................................................................................2 1. Explore Opportunities to Expand Intermodal Services in Dilworth, MN............................2 2. Establish A Regional Freight Advisory Committee...........................................................3 3. Designate a Tiered Truck Network ..................................................................................4 4. Identify Commercial Commodity Corridors .....................................................................6 5. Freight Safety and Information Strategies ......................................................................9 6. Designate Super-Haul Corridors for Permit Operations...................................................9 7. Consider Policies to Improve Regional Truck Size & Weight Uniformity .......................12 8. Undertake a number of Quick Start Projects (less than $50,000): ................................13
Introduction..........................................................................................................................................1 Background.............................................................................................................................1 The Study Region ...................................................................................................................2
Freight Trends and Issues ................................................................................................................3 Structural Changes to the U.S. Economy................................................................................4
Economic Changes in the Study Region .............................................................................4 The Growth in Global Trade....................................................................................................6 Key Trade Flows and Markets for the Study Region ...............................................................9 Commodity Flows For Mn/DOT District 2 ................................................................................9 Commodity Flows For Mn/DOT District 4 ..............................................................................10 Commodity Flows For Mn/DOT District 8 ..............................................................................11 The Logistics Revolution .......................................................................................................12 Regional Supply Chain Examples .........................................................................................13
Program Analysis and Recommendations .................................................................................. 40 1. Dilworth Railroad Intermodal Service Expansion...............................................................41
Competitive Situation of the Dilworth Terminal ..................................................................43 Potential Measures to Restore Rail Service to Dilworth / Improve Rates...........................50
Recommendations for Expanding Intermodal Service at Dilworth .........................................55 2. Establish Regional Freight Advisory Committee................................................................55 Recommendations for Establishing a District or Regional FAC .............................................56 3. Designate A Tiered Truck Network....................................................................................57 Recommendations for a Tiered Truck Network .....................................................................61 4. Identify Commercial Corridors for Priority Investment.......................................................62
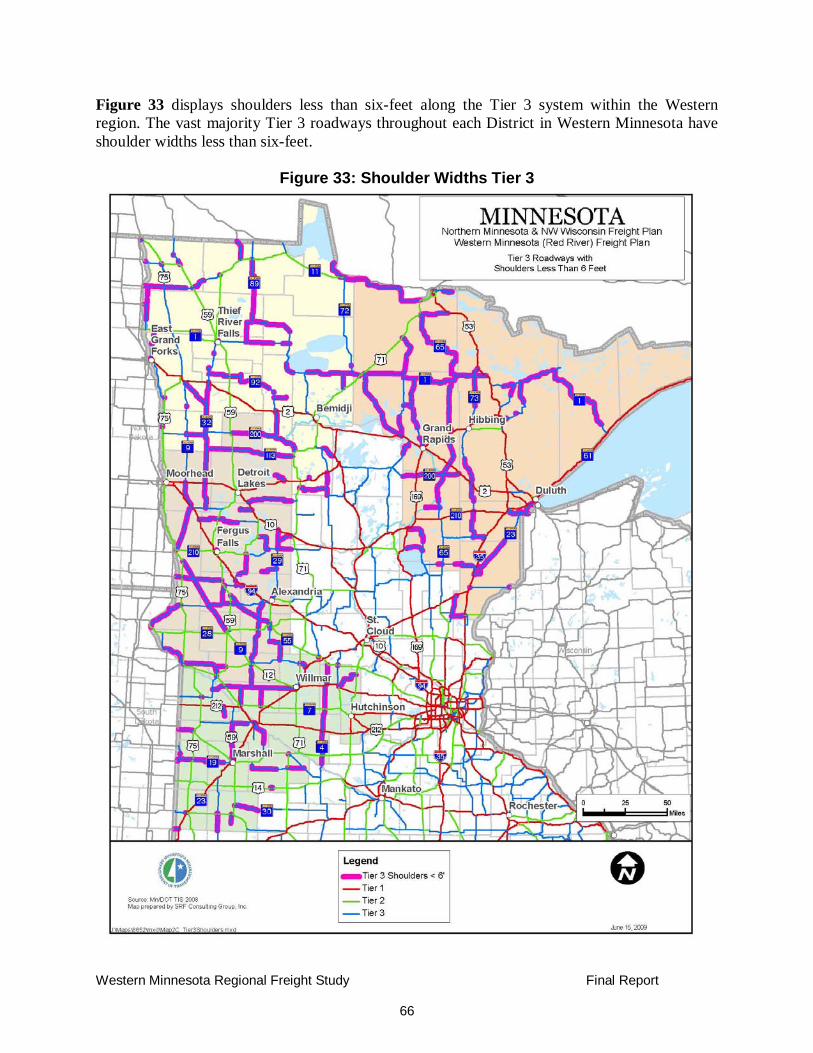
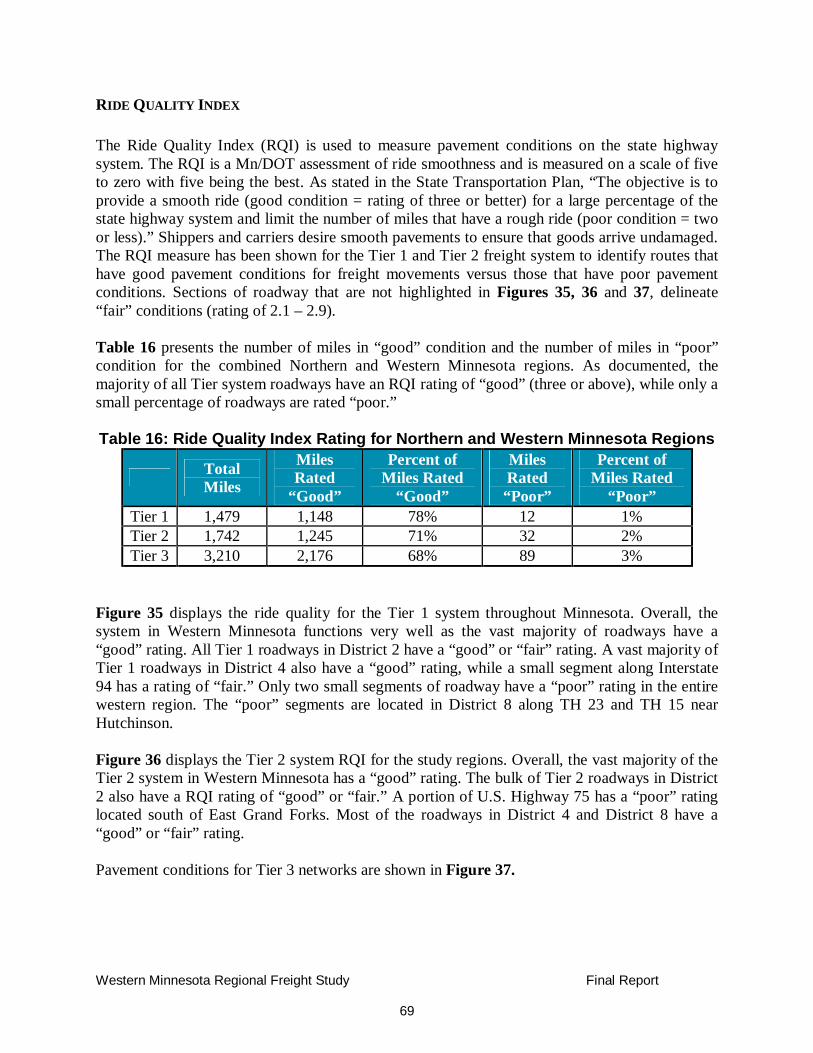
Roadways with Shoulders Less Than 6 Feet.....................................................................62 Roadways with AADT Over 11,200 ...................................................................................67 Ride Quality Index.............................................................................................................69 Proximity of Freight Generators to Tier 1 Corridors ...........................................................73 Heavy Commercial Truck Volumes ...................................................................................75
Recommendations for Commercial Commerce Corridors .....................................................77
Western Minnesota Regional Freight Study iii
5. Freight Safety and Information Strategies .........................................................................77 511 Enhancements ...........................................................................................................78 Rest Area Parking Availability ...........................................................................................79 Intersection/Entry Warning Systems..................................................................................83 Wildlife Warning ................................................................................................................84 Alternate Routing Plan ......................................................................................................85 Dynamic/Changeable Message Signs (DMS/CMS)...........................................................87 511....................................................................................................................................87 Truck Priority at Signalized Intersections...........................................................................88
Recommendations for Freight Safety and Information Strategies..........................................89 6. Super Haul Truck Corridors...............................................................................................91 Recommendations for Super-Haul Truck Permit Corridors....................................................94 7. Consider Policies to Improve Regional Truck Size & Weight Uniformity............................94
Background: General Network Limitations ........................................................................94 Recommendations to Improve Regional Truck Size & Weight Uniformity............................105 8. Undertake a number of Quick Start Projects (less than $50,000): ...................................106
Background.....................................................................................................................106 Recommendations for Quick Start Projects.........................................................................106
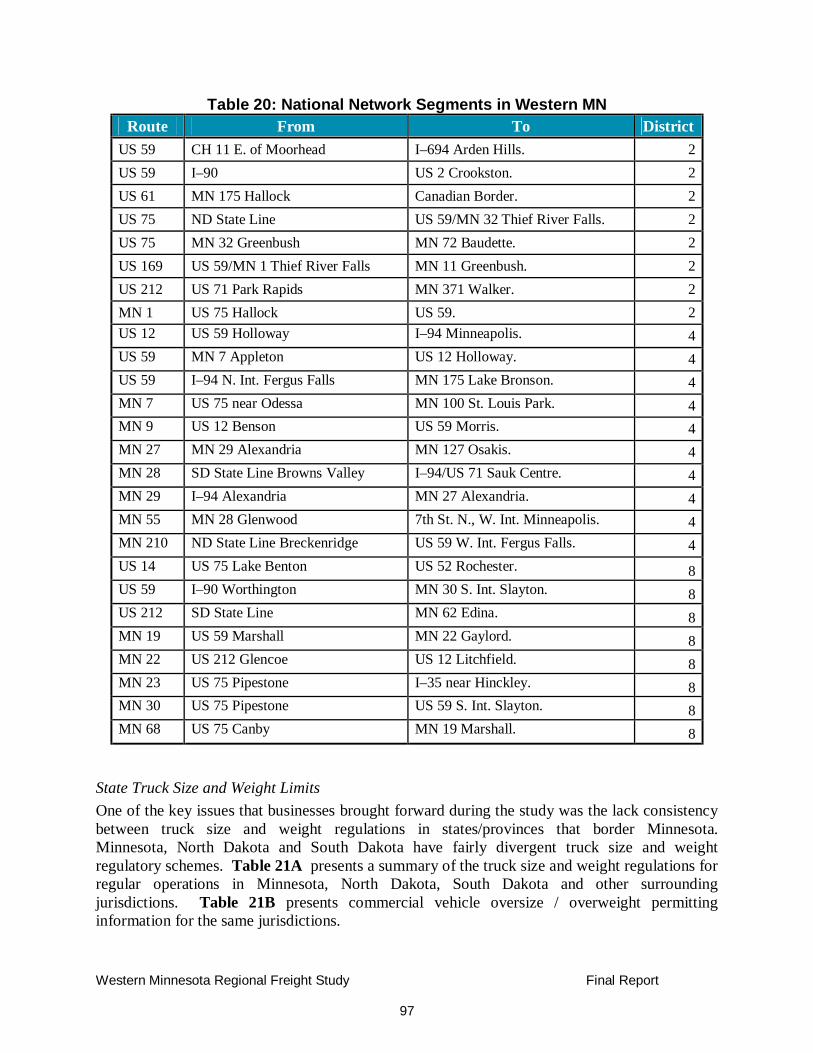
Table 1: Average Weekly Wage by Industry...................................................................6 Table 2: Growth in Trade – U.S. and Minnesota (Millions of $) ......................................8 Table 3: Key Export Commodities District 2, 2007..........................................................9 Table 4: Key Import Commodities District 2, 2007.........................................................10 Table 5: Key Export Commodities District 4, 2007........................................................10 Table 6: Key Import Commodities District 4, 2007.........................................................11 Table 7: Key Export Commodities District 8, 2007........................................................11 Table 8: Key Import Commodities District 8, 2007.........................................................11 Table 9: Intermodal Terminals in Western MN .............................................................24 Table 10: NHS and STRAHNET System Miles..............................................................28 Table 11: NN and Twin Trailer Network System Miles..................................................28 Table 12: Railroad Miles in Western MN .......................................................................34 Table 13: Comparison of Rates for 20 Ft Container Dilworth vs. St. Paul Terminal ......43 Table 14: Shoulder Widths Less Than Six-Feet, Northern and Western Minnesota.....63 Table 15: Two-Lane Roadway Miles with less than 11,200 Vehicles per Day...............67 Table 16: Ride Quality Index Rating for Northern and Western Minnesota Regions .....69 Table 17: Freight Generator Locations along the Tier 1 System ...................................73 Table 18: Average HCADT along the Tier Freight System ............................................75 Table 19: National Network Commercial Vehicle Size Standards .................................96 Table 20: National Network Segments in Western MN..................................................97 Table 21A: Regional Regulations for Truck Size and Weight – Regular Operations .....98 Table 21B: Regional Regulations for Truck Size and Weight – Permit Operations .......99
Western Minnesota Regional Freight Study iv
List of Figures Figure ES-1: Freight Generator Proximity to the Proposed Teir-1 Truck Network ...............ES-7 Figure ES-2: Super-Haul Truck Permit Corridors ...............................................................ES-11 Figure 1: Western Minnesota Freight Study Region...................................................................3 Figure 2: Western Minnesota Employment by Industry ...............................................................5 Figure 3: World Merchandise Trade by Major Product Group .....................................................7 Figure 4: Illustrative Supply Chain Network...............................................................................12 Figure 5: County Elevator Supply Chain for Grain.....................................................................15 Figure 6: Shuttle Train Supply Chain Model for Grain ...............................................................17 Figure 7: Supply Chain for Containerized Grain and Value-added Products .............................18 Figure 8: Illustrative Supply Chain for ATV/Snowmobile Manufacturer......................................20 Figure 9: Wind Energy Resource Map for the United States ....................................................21 Figure 10: Illustrative Supply Chain for Wind Turbines..............................................................22 Figure 11: Intermodal Terminals in Minnesota and Wisconsin ..................................................24 Figure 12: Tiered Roadway Network for Northern MN/WI and Western MN.............................27 Figure 13: Minnesota Interregional Corridor (IRC) System.......................................................29 Figure 14: Ten-Ton Roadways in Minnesota............................................................................31 Figure 15: Tiered Roadways in Minnesota ................................................................................33 Figure 16: Freight Railroads in Minnesota and Wisconsin.........................................................35 Figure 17: Minnesota Air Cargo Airports ...................................................................................37 Figure 18: Pipelines in Minnesota ............................................................................................39 Figure 19: Existing BNSF Intermodal Hubs and Market Areas .................................................44 Figure 20: BNSF Consumer Product Flows ..............................................................................46 Figure 21: Containerized Grain Exports from the U.S. to Asia...................................................48 Figure 22: USDA Containerized Grain Statistics (Jan. 2008 to Feb. 2009)................................48 Figure 23: USDA Long-Term U.S. Export Forecasts - Bulk Commodities .................................49 Figure 24: Comparison of Ocean Rates per Short Ton: ............................................................50 Figure 25: North Star Rail Transload Equipment.......................................................................51 Figure 26: Red River Valley & Western System Map ................................................................53 Figure 27: Assembling a RailRunner Train................................................................................54 Figure 28: Tiered Truck Network for Mn/DOT District 2............................................................58 Figure 29: Tiered Truck Network for Mn/DOT District 4............................................................59 Figure 30: Tiered Truck Network for Mn/DOT District 8............................................................60 Figure 31: Shoulder Widths Tier-1 Roadways...........................................................................64 Figure 32: Shoulder Widths Tier 2.............................................................................................65 Figure 33: Shoulder Widths Tier 3.............................................................................................66 Figure 34: Tier 1 AADT.............................................................................................................68 Figure 35: Pavement Condition Tier 1.......................................................................................70 Figure 36: Pavement Condition Tier 2.......................................................................................71 Figure 37: Pavement Condition Tier 3.......................................................................................72 Figure 38: Freight Generator Proximity to Tier 1 Truck Routes .................................................74 Figure 39: Heavy Commercial Annual Average Daily Traffic (HCAADT) ...................................76 Figure 40: Safety Rest Areas with Parking...............................................................................80 Figure 41: Proposed Schematic for Rest Area Parking Notification..........................................82 Figure 42: Schematic of Wildlife Warning System....................................................................85 Figure 43: Schematic of Truck Priority Signalization ................................................................89 Figure 44: Proposed Super-Haul Corridors in Minnesota .........................................................93 Figure 45: MnDOT District 2 Non-National Network Route Segments....................................102 Figure 46: MnDOT District 4 Non-National Network Route Segments....................................103 Figure 47: MnDOT District 8 Non National Network Routes Segments ..................................104
Western Minnesota Regional Freight Study ES-1
EXECUTIVE SUMMARY The Western Minnesota Freight Study is a multimodal transportation planning effort that includes highway (commercial vehicle operations), rail, air cargo, and intermodal transportation. The study is sponsored by the Minnesota Department of Transportation (Mn/DOT). This freight planning effort builds upon prior planning activities by Fargo-Moorehead Metropolitan Planning Organization, North West Regional Development Commission, Area Transportation Partnerships (ATPs), Mn/DOT Districts 2, 4, and 8, and Mn/DOT’s Office of Freight and Commercial Vehicle Operations (OFCVO). The purpose of the study is to provide a better understanding of the demands from freight being placed on the regional transportation infrastructure and provide a framework that addresses the following goals: Examine regional and local issues not captured in previous freight transportation study/planning attempts, including freight issues specific to the region. The primary focus will include but is not limited to agriculture, energy, bulk commodities, minerals, timber, manufacturing, global gateways including intermodal and oversize/overweight cargo movements (e.g., super routes), interregional truck routes, and last mile connections. Document the existing freight transportation system in Northern Minnesota & Wisconsin, and Western Minnesota, including facilities, service levels and current and projected commodity flows. Identify significant existing and projected needs, bottlenecks, infrastructure and regulatory issues, and other constraints in the region’s freight transportation and their implications; Identify industry- and region-specific issues and trends as they relate to freight transportation and their solutions; Plan for improvements to freight movements specific to the regions, through a combination of operating and program efficiencies, infrastructure upgrades and investments, public/private initiatives and innovative funding, regulatory initiatives, and communications; and Strengthen freight considerations in public project planning and investment decision-making. Prior to this Final Report the project sponsors worked with the consulting team to produce two working papers and two technical memorandums: Working Paper #1: Regional Freight System Inventory: This working paper describes the freight transportation networks in the region. The working paper provides a descriptive narrative supported by tables, graphs, and maps of the physical supply, condition and high-level performance of freight networks for the relevant modes in the region. Working Paper #2: Regional Freight System Analysis: This working paper describes the nature and characteristics of trade in the region by analyzing commodity flows by mode to, from, through and within the region. The profiles also describe the economic basis of the region, workforce characteristics and discuss those industries in the regional that are highly dependent on transportation, as well as which of those industries likely to grow in the future. The "freight profiles" contained in the working papers are high-level descriptions of the following attributes in the region:
Western Minnesota Regional Freight Study ES-2
• Major commodity origin/source markets by mode, weight, and value in each region. • Key destination nodes within each region by mode, weight, and value. • Predicted high-growth industries/commodities • A description of the key economic linkages between: • the Northern MN/WI Region and the rest of North America, and; • Maps showing key commodity flow attributes in relation to the primary freight
transportation network Technical Memorandum #1 summarized the key findings from the two Working Papers, and complemented the economic and commodity data with extensive stakeholder outreach. Through the data analysis and stakeholder outreach key issues surrounding freight infrastructure needs or operational improvements were identified in the study region. These issues and opportunities were then summarized in several ways:
• "Quick Start Projects" - relatively low cost (less than $50,000) infrastructure, operational and/or institutional improvements that can benefit freight mobility, reliability or security;
• Transportation Improvement Program Projects - possible projects suitable for inclusion in the next MPO TIP or District STIP.
• Policy or institution issues that require additional research or planning will be presented in the form of problem statements.
Technical Memorandum #2 addresses the study goals of analyzing improvements to freight movements specific to the regions by examining an array of operating and program efficiencies, infrastructure upgrades and investments, regulatory initiatives, and public/private initiatives. Tech memo #2 also makes recommendations for strengthening freight considerations in public project planning and investment decision-making.
KEY FINDINGS AND RECOMMENDATIONS Using the analyses presented in Technical Memorandums 1 and 2, along with the information gathered during the freight stakeholder interviews and meetings the consultant team developed a series of draft recommendations that were then vetted through the Technical Committee and further refined. The following is a summary of the recommendations developed for the Western Minnesota Freight Study:
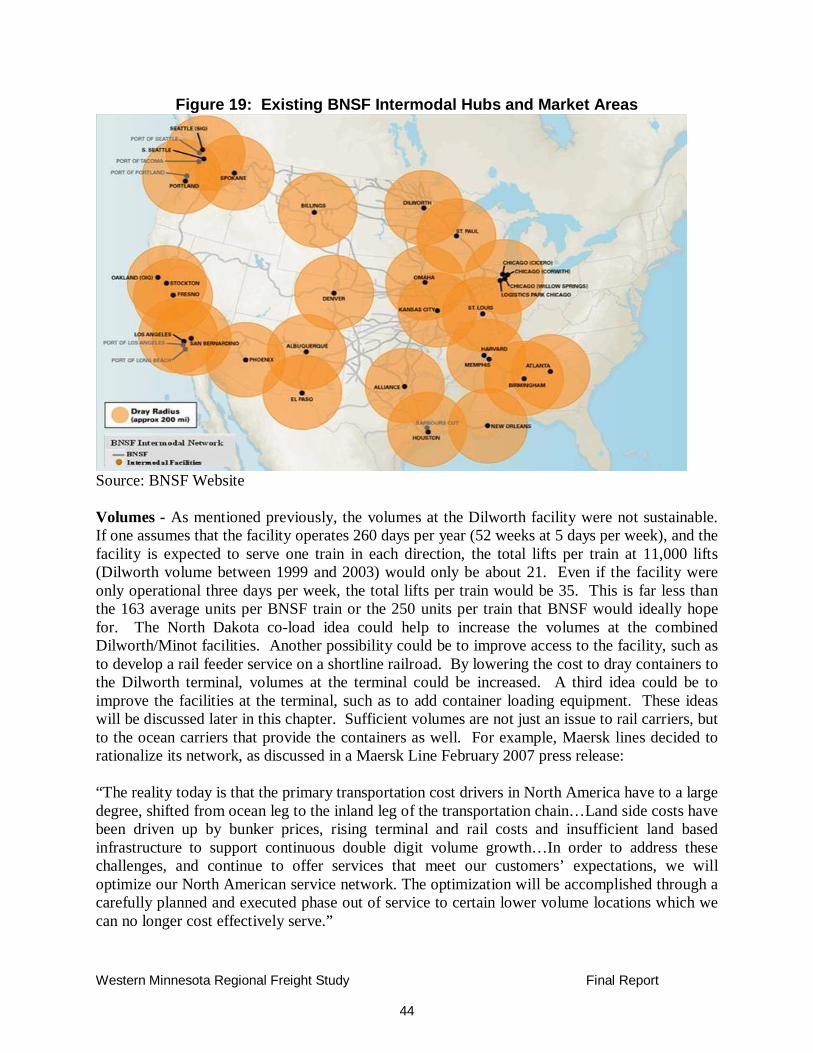
1. EXPLORE OPPORTUNITIES TO EXPAND INTERMODAL SERVICES IN DILWORTH, MN The Burlington Northern Santa Fe Railway (BNSF) Dilworth, MN intermodal terminal occupies about seven acres. When it was operating as an active intermodal terminal, it included one side loader to lift containers onto or off of trains and one hostler to move equipment around the yard. It has 1,700 feet of loading/unloading tracks, 100 parking spots, and 20 loading/unloading car spots. Local shippers have expressed concerns about the lack of a container pool at the facility, the cost of repositioning empty containers to Dilworth, and the generally constrained footprint of the facility. The terminal is currently a “paper ramp.” BNSF markets the facility as an
Western Minnesota Regional Freight Study ES-3
intermodal hub, but is actually no longer rail-served. Instead, all containers are trucked to the BNSF terminal in the St. Paul, and the containers are loaded onto BNSF intermodal trains in the St. Paul. This adds costs to shippers who use Dilworth as containers are drayed twice: once to the Dilworth terminal and a second time to the BNSF terminal in St. Paul. BNSF only quotes rates outbound from Dilworth to Seattle, WA, so all containers must be drayed 241 miles eastward, so that the same containers can later pass through Dilworth on intermodal trains bound for Seattle, WA. Historically, consistent volumes and inbound-outbound lane balance have been the greatest challenges to improving service at the Dilworth yard. In 2008, BNSF responded to pressure from North Dakota by extending rates for outbound containers that match the rate charged to load a container at its Midway Yard in St. Paul. Steps to improve service conditions at the BNSF Dilworth Intermodal Ramp could include coordination activities with the North Dakota Department of Transportation, and regional entities such as the Greater Fargo/Moorhead Economic Development Corporation and the Fargo Moorhead Council of Governments. The study analysis suggests that the Dilworth terminal’s greatest weakness is an imbalance between inbound freight and outbound agricultural traffic. For this reason, it may make sense to involve non-agricultural stakeholders in the process of trying to restore direct rail service to the Dilworth terminal. Investigate potential large generators of inbound freight. For example, large employers in Red River Valley include Case New Holland (CNH), Bobcat Company, Polaris Industries and Arctic Cat Inc. Equipment and recreational vehicle manufacturers often maintain worldwide supply chains. The inbound container traffic of companies such as these could help to balance outbound agricultural traffic at Dilworth. Other companies that may generate large volumes of inbound containerized freight may locate in the Fargo area. With a better balance of traffic, Dilworth could be a more viable intermodal terminal. Studies of the Dilworth facility to date have not fully considered the volume and balance of freight across state borders, nor have discussions with BNSF taken place on a bi-state level.
2. ESTABLISH A REGIONAL FREIGHT ADVISORY COMMITTEE MnDOT District 8 has expressed an interest in forming a regional freight advisory group for the purpose of gaining private sector input to the District’s planning process. One goal of establishing a regional advisory committee is to create a bi-state advisory committee with public representatives from a variety of transportation planning authorities and private sector representatives from a variety of industries and modes, with the common goal of improving regional freight mobility. To facilitate greater participation in state and metropolitan transportation planning, federal legislation encourages States and Metropolitan Planning Organizations (MPOs) to provide opportunities for various interested parties to provide input into the development of transportation plans and programs. For example, the Safe, Accountable, Flexible, Efficient Transportation Equity Act: A Legacy for Users (SAFETEA LU) stipulates that MPOs and States
Western Minnesota Regional Freight Study ES-4
shall provide freight shippers and providers of freight transportation services with reasonable opportunities to comment on transportation plans and programs. The Western Minnesota Freight Plan demonstrated that many of the issues affecting the freight community extend across borders, and some times are caused by state and/or municipal boundaries. Forming a regional Freight Advisory Committee (FAC) is likely to provide a good platform for pursuing many of the other recommendations that follow in this report. Mn/DOT Districts 4 and 8 should spearhead the formation of a Regional Freight Advisory Committee. The purpose of a Regional FAC would be to facilitate strategic information exchange and coordination among regional business leaders and other diverse freight stakeholders regarding freight needs and potential solutions to help build a better transportation system and quality of life in the region. A number of other recommendations resulting from this study may also provide an initial work plan for the group. For instance: Regional Truck Size and Weight Harmonization: Differences in cross-border truck size and weight issues, was repeatedly raised by stakeholders that were engaged for this study. The formation of a Regional FAC could provide a platform for actions to address regional differences.
• Serve as a forum for discussions about freight movement in the regional and for providing advice to District leadership about freight issues – Some freight stakeholders felt that the FAC should start on an informal basis by serving as a discussion forum to provide MnDOT with input regarding freight issues and to educate the public and private sectors about their respective needs.
• Set criteria for selecting projects –While Mn/DOT has not involved the MFAC in this role to date, several other states and MPO’s involve freight stakeholders in setting criteria for selecting projects. An FAC would not necessarily prioritize projects, but would help determine criteria to consider when evaluating projects.
• Prioritize projects – Currently Minnesota has several non-highway programs for making loans for rail or waterway improvements. Historically, bonded loan programs in the state have been structured on a “first-come, first-served” basis. However, without a prioritization structure these resources are not likely being allocated as efficiently or as effectively as they might be. Starting at a regional level, Mn/DOT could seek guidance from freight stakeholders to identify those projects most important for improving regional freight mobility.
A district-level FAC could also be closely coordinated with Minnesota’s statewide MFAC and the Arrowhead Regional Development Commissions – Regional Transportation Advisory Committee, through cross membership. Many of the stakeholders contacted through the course of the Regional Freight Study were eager to share comments and ideas, and would provide a ready opportunity for an initial contact list.
3. DESIGNATE A TIERED TRUCK NETWORK For the Minnesota Regional Freight Study project, the project team developed a three tiered roadway network. The tiered roadway network highlights the roadways that are most important
Western Minnesota Regional Freight Study ES-5
to truck traffic. When existing designated highway systems were combined together, the resulting system was too large to provide any investment guidance. As a result, the tiered truck network approach used truck traffic and roadway design characteristics to identify the roadways essential to the efficient movement of freight. Heavy commercial annual average daily traffic (HCAADT) was used to validate the existence of elevated levels of HCAADT on the existing systems. HCAADT is an estimate of the total number of vehicles with at least two axles and six tires, using a specific segment of roadway on any given day of the year. Heavy commercial vehicles include trucks only. Based on observed statewide data, tiers were classified based on breaks of 650 and 300, resulting in the following tiers: Tier 1: Roads on the network with HCAADT greater than 650 Tier 2: Roads on the network with HCAADT between 301 and 650 Tier 3: Roads on the network with HCAADT less than 300 The three tiers together form the designated truck network, with top two tiers suggesting the highest priorities for future investment. Heavy commercial vehicle characteristics were used to verify appropriate design criteria for each tier and to identify network deficiencies. Multi-lane segments of roadways provide a safe route for a vehicle envelope of 14’ tall, 14’wide and 67’long. Almost all segments of multi-lane roadways are on the Tier 1 network. Roadway shoulders of at least 10’ in width provide a similar safety benefit. Mn/DOT and the Districts may wish to adopt the tiered network metrics as a means to identify, consider and/or integrate commercially advantageous freight-related improvements into the project prioritization process. Projects on the Tier 1 network in particular could be prioritized into their ATP/STIP process as an element of highway investment that directly impacts the competitiveness and access for local businesses that are significant freight generators. Districts should focus on Tier routes due to their higher freight volumes and higher cost effectiveness for identified freight improvements. Tier 2 and 3 routes also may exert some influence in project prioritization to a much lesser degree, with the logical exception of short segments that may be directly influenced by the activities of specific industrial site. A list of freight related evaluation criteria examined in Tech Memo #2 (Program Analysis) is provided below: Heavy Commercial Average Daily Traffic for the Tier 1 freight network Proximity of key freight generators to the Tier 1 freight network Pavement conditions on key Tier 1 freight routes Roadways with shoulders less than 10 feet Two lane rural roadways with daily volumes over 11,200 For the analysis and mapping elements, roadways with shoulders less than 6-feet were analyzed to comply with the Statewide Transportation Policy Plan 2009-2028. However, for Tier 1 roadways, Districts should strive to incorporate shoulder improvements on Tier 1 routes that have shoulders less than 10-feet, which will improve safety and increase efficiency along these routes, as Tier 1 roadways generally provide the greatest benefit to shippers when moving freight.
Western Minnesota Regional Freight Study ES-6
As part of the Tiered Truck Network, 10-ton roadways provide important connections between intermodal freight facilities, major freight generators and other key freight destinations throughout the state. These roadways generally include city and county routes that receive state aid funding, as well as trunk highways, interstates and some local roads. Year-round,10-ton roadways also provide a predictable freight roadway network, whereas all other roadways are subject to axle load limitations, including seasonal load restrictions.
4. IDENTIFY COMMERCIAL COMMODITY CORRIDORS The consultant team noted that there are specific routes from significant freight generators to transload facilities, production destinations, or border crossings onto higher capacity freight routes in neighboring jurisdictions that would directly benefit the competitiveness and market viability of specific Minnesota businesses and employment sites. The prototype for this class of freight routes dubbed ‘Commercial Commodity Corridors’ is the Blandin Paper permitted overweight route from their Grand Rapids paper mill to Lake Superior Warehousing in the Port of Duluth. At Lake Superior Warehousing, Blandin products have access to local storage and distribution services, water transport services on the Great Lakes for regional and international marine shipments, and transloading to all four Class I railroads serving Duluth. The varied transport options serve to help insure low-cost competitive shipping rates. This corridor was accomplished through a combination of Mn/DOT overweight permitting, a custom-designed fleet of six-axle trucks, and local cooperation in determining a specified routing on Highway 2 and local streets that could accommodate the traffic without damage or constraints. The result is a per-truck payload improvement of over 25%, which translates directly to lower transportation costs per ton and better cost-effective access to markets. Designation of such roads could allow for special permitting to increase efficiency and competiveness. The analysis presented in Tech Memo #2 documents the characteristics of Minnesota’s trunk highways using a number of different factors which were presented thematically in different maps including:
• Access to non-National Network • Roadways with shoulder widths less than six-feet* • Two-lane rural roadways with daily volumes over 11,200 • Pavement conditions on Tier 1, 2 and 3 freight networks • Proximity of key freight generators to the Tier 1 freight network • Heavy Commercial Average Daily Traffic for the Tier 1 freight network
The map in Figure ES-1 shows the results of mapping freight generator proximity to the proposed Tier 1 truck network. Based on limited interviews and the regional freight forums the consultant team took initial steps to outline several key industry supply chains in the region. In addition, as noted the consultant team mapped
* The analysis of truck corridors used a minimum shoulder width of six-feet. However, a future goal for a tier-1 truck network may wish to consider a minimum shoulder width of 10 feet for enhanced safety.
Western Minnesota Regional Freight Study ES-7
the trunk highway system by design characteristics and other factors that can assist in deciding what routes might be considered under a commerce corridor designation. As a next step, possibly working through a regional freight advisory committee, MnDOT should map commodity-specific origin to destination routes that could benefit from routinely permitted loads for greater productivity without any liability to the overall highway network condition or any change in wear factors. Figure ES-1: Freight Generator Proximity to the Proposed Teir-1 Truck Network
Western Minnesota Regional Freight Study ES-8
Western Minnesota Regional Freight Study ES-9
5. FREIGHT SAFETY AND INFORMATION STRATEGIES Discuss ITS strategies that can address freight safety and information needs, as expressed by key stakeholders. A sketch-level description of each application and an implementation plan will be provided for:
• Expanded 511 • Advanced parking stall availability at rest areas • Truck priority at signal lights • Alternate route planning • Wildlife collision avoidance • Advanced warning signalization for intersections and truck entry areas.
6. DESIGNATE SUPER-HAUL CORRIDORS FOR PERMIT OPERATIONS Mn/DOT provides permitting of over-sized, over-weight loads on Trunk Highways (TH’s) throughout the state. Its permit office reviews and evaluates permits for thousands of loads each year. As an example, significant movement of wind mill equipment (both blades and tower sections) are moved frequently, many from the Duluth ports. Mn/DOT’s commercial vehicle section processes these permits (i.e., finds the most appropriate route based on the size and weight of the load). Providing some ability to move these oversized and over-weight loads north-south and east-west through the state and connect to the Duluth ports encourages continued economic activity of the port as well as provides ability for manufactures and/or businesses within the state to ship large equipment. The purpose of identifying Super Corridor Routes is to acknowledge that certain routes are currently being used to move oversized and over-weight loads from the Duluth Port to other areas of the state, and these moving routes should be a primary consideration when planning improvements to the route (i.e., improvements should not limit continued use of this route as a moving route for these types of loads). When permitting oversized and over-weight loads there are four main parameters that must be addressed. These are: Weight Width Length Height Permits dealing with any two of these parameters are relatively easy to accommodate in terms of available routes. However, permitting loads across routes that involve with three or more of these parameters can be more difficult as weight and height parameters are often limited by bridges. In developing Super-Haul Corridor Routes, Mn/DOT identified key characteristics for these routes. The criteria for designating a Super-Haul Corridor includes roadways that can generally accommodate a loaded vehicle with a 16-foot height limit, a 16-foot width limit with an 8-foot
Western Minnesota Regional Freight Study ES-10
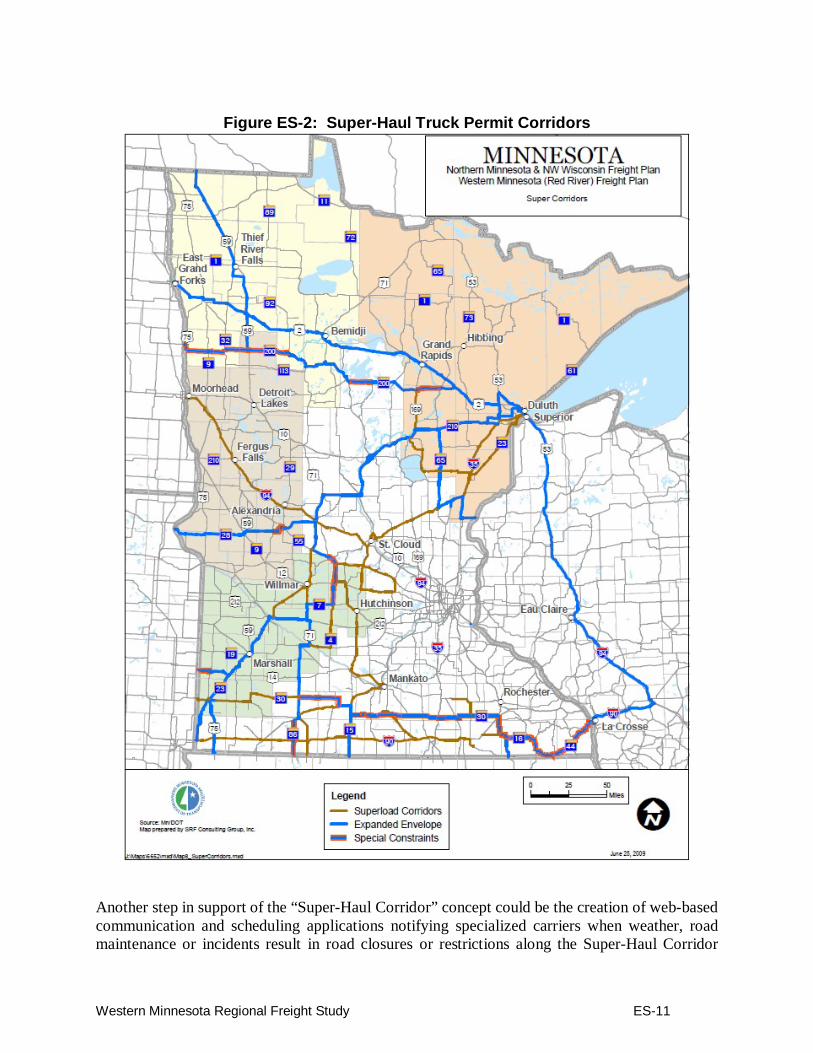
wide axle, a 130-foot length limit and a 235,000 lbs weight limit. The selected routes should contain diamond interchanges which allow for easier movements for over-size loads when transferring from one roadway to another. In addition, whenever possible, no roundabouts should be constructed along the identified Super Corridors, and counties/cities should provide adequate notice of at least two weeks for road closures along portions of the routes. These recommendations will help improve efficiency along the Super Corridor Routes and will provide shippers/truckers a reliable route to use when hauling over-size loads. One of the more difficult permitting issues to address is height. Mn/DOT currently designs bridges for 16’ 4”. It also requires that a safety margin of six inches on all moves to account for maintenance overlays and sag verticals. As a result, to move a load that is 16’ high the permit office requires all vertical clearances to be at least 16’ 6”. This policy means that all new bridges that are being built fail to meet this requirement. It is important to note that most height permits are less than 16 feet and in fact, almost all Trunk Highways can accommodate moves for heights up to 15’ 4. For example, a load that is 15’4” only has to avoid one bridge structure travelling on I-35 from Duluth to Iowa. A load that is 15’6” has to avoid eight low clearance bridges, whereas a load that is 15’8” has to avid twenty-two structures (as identified on the current Super Corridor route system). The Super Corridor route map shown in Figure ES-2 is reflective of routes that that can support a 16’x16’x130’ envelope and a weight of 235,000 lbs. When planning improvements and/or changes along these routes, District staff should try and preserve the ability to accommodate these characteristics and/or improve upon them if feasible.
Western Minnesota Regional Freight Study ES-11
Figure ES-2: Super-Haul Truck Permit Corridors
Another step in support of the “Super-Haul Corridor” concept could be the creation of web-based communication and scheduling applications notifying specialized carriers when weather, road maintenance or incidents result in road closures or restrictions along the Super-Haul Corridor
Western Minnesota Regional Freight Study ES-12
routes. For example, Mn/DOT may consider publishing a web-based map of Super-Haul Corridors allowing carriers and shippers to effectively plan out a route that allows them to best transport over-size loads to a specified destination. In addition, special roadway design policies could be adopted for Super-Haul Corridors to limit potential restrictions such as roundabouts or low bridge clearances.
7. CONSIDER POLICIES TO IMPROVE REGIONAL TRUCK SIZE & WEIGHT UNIFORMITY One of the key issues that businesses brought forward during the study was the lack consistency between truck size and weight regulations in states/provinces that border Minnesota. Minnesota and Wisconsin have similar truck size and weight regulatory schemes on high level state network routes, but size and weight limits become more divergent on lower level networks, and as special exemptions to state laws are crafted by competing industries. The highway networks in Northern Minnesota and Northwestern Wisconsin are comprised of federal, state, county, city, or township roadways that are designated differently according to their intended purpose, and are governed differently regarding truck size and weight. Technical Memorandum #2 discussed the various regulatory schemes for at the state and federal level. National Network (NN) Highways which are defined in the Code of Federal Regulations (CFR Part 658, Appendix A). Non-NN highways offer more flexibility because they are not subject to federal size limitations. While all Interstate highways are automatically designated as part of the NN, states designated non-Interstate elements of the NN. Seek truck size and weight harmony on the routes with the most flexibility: Minnesota, may wish to work with Wisconsin and North Dakota to determine the continuity of non-NN highway segments across state boundaries. Where non-NN routes from a bordering state connects to a NN route in Minnesota, Minnesota could petition to remove the NN designation within its border. The advantage to removing a NN designation would be to allow wider or longer combinations that what is allowed on the NN. The so-called “ISTEA Freeze” which limited the overall length of twin-trailer combinations to what existed in a state as of June 1, 1991, does not apply to non-NN routes. As a result, if allowed to operate longer combinations carriers can increase their gross weight without violating state or federal bridge laws. Consider Size and Weight Reciprocity Agreements with Neighboring States: On state routes where Mn/DOT has the flexibility to examine more productive trucking options, MnDOT could examine legislation to create reciprocity across state lines for certain commodity exemptions or variations in truck size and weight laws were producers in a neighboring state enjoy more productivity through a more advantageous regulation. For instance, in Minnesota the first haul of raw agricultural or timber products can exceed the normal gross vehicle weight by 10% for a total maximum weight of 88,000 pounds. In Wisconsin, the first haul of agriculture or timber can exceed the normal gross vehicle weight by 10,000 pounds for a total maximum weight of 90,000. Currently Michigan and Wisconsin have a form of a reciprocity agreement, which allows trucks operating in Michigan at higher weights than allowed in Wisconsin in normal operations, to be granted an annual or consecutive month permit to operate at higher weight near the border. The Minnesota Legislature could seek a similar agreement with surrounding states where commodity exceptions are similar, but not the same.
Western Minnesota Regional Freight Study ES-13
Join a regional permitting compact: Another form of truck size and weight reciprocity has become a common practice in some parts of the U.S. More than one-half of all states in the U.S. belong to multi-state permitting compacts. Under a multi-state compact, carriers can received extra-dimension and/or overweight operating permits, provided the requested permit operation falls within a regional permit “vehicle envelop.” The vehicle envelop defines the limits of overweight or over-dimension operations all states in the Regional Permit Compact are willing to allow. Currently no regional permit compact exists in the Midwestern U.S. North Dakota is a member of the regional compact developed by the Western Association of State Highway and Transportation Officials (WASHTO). In the past North Dakota has encouraged Minnesota to also enter the WASHTO compact. This would help create a routine permitting procedure to expedite freight movements from Minnesota to as far was the West Coast. During the study process, some carriers and shippers expressed interest in creating a uniform permitting procedure throughout the Upper Midwest states (MN, WI, ND, SD, IA) to maximize efficiency, and minimize paperwork and delays caused by the permitting process.
8. UNDERTAKE A NUMBER OF QUICK START PROJECTS (LESS THAN $50,000): Other state DOT’s and MPO’s that have worked to engage the private sector in their planning efforts have suggested that "quick start" type projects, can be invaluable to gaining and holding the interest and input of private sector carriers and shippers. Information about this regional freight study was broadly disseminated to the business community in Northern MN, and Western WI via freight forum invitations and a Mn/DOT website. In addition, businesses were contacted and many took time out of their busy schedules to participate in-person interviews. One of the difficulties that has been identified in getting the private sector to participate in public planning processes is the significant difference in planning horizons between the public and private sectors. Most businesses consider long term planning horizons to be 2-5 years. Most public sector transportation agencies consider long term planning to be 20-50 years. As a result, a common complaint of private sector entities invited to provide input to public processes, is: “We took the time to provide information, but never see any results.” During the public outreach efforts for this project a number of issues were raised that could be addressed through relatively inexpensive means that can be done in a relatively short period of time. These types of projects are sometimes referred to as “Quick Start Projects.” Completing a number of Quick Start projects in direct response to the input provided by the private sector for this project can help keep regional businesses involved in similar efforts in the future and provide tangible evidence of responsive government. The following are recommended as Quick Start Projects for the Northern Study Region: Develop a regional marketing campaign aimed at businesses and carriers to inform them about agency resources. Many comments were received regarding web resources for presenting permitting, construction, and other route or regulatory information. Both Minnesota and Wisconsin have statewide information about road posting, permitting and construction.
Western Minnesota Regional Freight Study ES-14
However, sometimes the information is presented on an agencies “home” website, and in other cases data may be presented on district websites. An effort could be undertaken to identify the most requested information from private sector stakeholders and seek ways to consolidate pertinent in formation in a single location, or provide links. This web site should then be advertized and links to it distributed to chambers of commerce and other business organizations. Restripe the centerlines on TH-32 Center Lines between TH-11 and US-10. Install additional intersection warning lights along TH 59 between the US Canadian Border & Interstate 94. Currently warning lights are provided along TH-59 at the intersections of TH-32 and County Rd 19. While there are additional controlled intersections the others do not have warning signals and the inconsistency is a safety concern because it leads to driver expectations that the second signal will be marked the same. A driver sees the flashing when approaching from the north or south and can anticipate the signal change, they expect the same for the second signal – and are surprised when the light unexpectedly changes. The Highway also curves along this segment. Conduct sketch-level engineering analysis for building left turn lanes at the intersection of TH-113 and TH 59 Height clearance obstacle: remove Michigan Street Bridge (Jenswold Bridge) 40th Ave W/Oneota – turning radius I-35 interchange reconstruction (a new study is underway) – seek public comment from trucking industry on ways to improve port access. Old Piedmont Ave and 1st St – humped intersection
There were also many comments received during the outreach process regarding the addition of turn lanes on some routes, widening shoulders and redesigning some intersections. While most of these projects fall outside the existing resources for Mn/DOT or the MIC to address them, failure to respond in anyway will result in disengaged stakeholders who believe their comments have fallen on deaf ears. A communication effort should also be undertaken that stresses that everyone’s comments were considered and that where possible changes are being made. However, freight projects must also compete with a host of other projects and the lack of resources is likely to prevent some projects from ever being addressed.
Northern Minnesota & Northwestern Wisconsin Regional Freight Study 1
INTRODUCTION The Western Minnesota Freight Study is a multimodal transportation planning effort that includes highway (commercial vehicle operations), rail, air cargo, and intermodal transportation. The study is sponsored by the Minnesota Department of Transportation (Mn/DOT). This freight planning effort builds upon prior planning activities by Fargo-Moorehead Metropolitan Planning Organization, North West Regional Development Commission, Area Transportation Partnerships (ATPs), Mn/DOT Districts 2, 4, and 8, and Mn/DOT’s Office of Freight and Commercial Vehicle Operations (OFCVO). The purpose of the study is to provide a better understanding of the demands from freight being placed on the regional transportation infrastructure and provide a framework that addresses the following goals: Examine regional and local issues not captured in previous freight transportation study/planning attempts, including freight issues specific to the region. The primary focus will include but is not limited to agriculture, energy, bulk commodities, minerals, timber, manufacturing, global gateways including intermodal and oversize/overweight cargo movements (e.g., super routes), interregional truck routes, and last mile connections. Document the existing freight transportation system in Western Minnesota & Wisconsin, and Western Minnesota, including facilities, service levels and current and projected commodity flows. Identify significant existing and projected needs, bottlenecks, infrastructure and regulatory issues, and other constraints in the region’s freight transportation and their implications; Identify industry- and region-specific issues and trends as they relate to freight transportation and their solutions; Plan for improvements to freight movements specific to the regions, through a combination of operating and program efficiencies, infrastructure upgrades and investments, public/private initiatives and innovative funding, regulatory initiatives, and communications; Strengthen freight considerations in public project planning and investment decision-making.
BACKGROUND Prior to this Final Report the project sponsors worked with the consulting team to produce two working papers and two technical memorandums: Working Paper #1: Regional Freight System Inventory: This working paper describes the freight transportation networks in the region. The working paper provides a descriptive narrative supported by tables, graphs, and maps of the physical supply, condition and high-level performance of freight networks for the relevant modes in the region. Working Paper #2: Regional Freight System Analysis: This working paper describes the nature and characteristics of trade in each region by analyzing commodity flows by mode to, from, through and within each Region. The profiles will also describe the economic basis of each region, workforce characteristics and discuss those industries in each regional that are highly dependent on transportation, as well as which of those industries likely to grow in the future. The "freight profiles" contained in the working papers are high-level descriptions of the following attributes in each region:
Western Minnesota Regional Freight Study Final Report
2
• Major commodity origin/source markets by mode, weight, and value in each region. • Key destination nodes within each region by mode, weight, and value. • Predicted high-growth industries/commodities • A description of the key economic linkages between: • the Northern MN/WI Region and the rest of North America, and; • Maps showing key commodity flow attributes in relation to the primary freight
transportation network Technical Memorandum #1 summarized the key findings from the two Working Papers, and complemented the economic and commodity data with extensive stakeholder outreach. Through the data analysis and stakeholder outreach key issues surrounding freight infrastructure needs or operational improvements were identified in the study region. These issues and opportunities were then summarized in several ways:
• "Quick Start Projects" - relatively low cost (less than $50,000) infrastructure, operational and/or institutional improvements that can benefit freight mobility, reliability or security;
• Transportation Improvement Program Projects - possible projects suitable for inclusion in the next MPO TIP or District STIP.
• Policy or institution issues that require additional research or planning will be presented in the form of problem statements.
Technical Memorandum #2 addresses the study goals of analyzing improvements to freight movements specific to the regions by examining an array of operating and program efficiencies, infrastructure upgrades and investments, regulatory initiatives, and public/private initiatives. Tech memo #2 also makes recommendations for strengthening freight considerations in public project planning and investment decision-making.
THE STUDY REGION The Western MN region includes counties within Mn/DOT District 2 (Clearwater, Hubbard, Kittson, Lake of the Woods, Marshall, Norman, Pennington, Red Lake and Roseau), counties within Mn/DOT District 4 (Becker, Big Stone, Clay, Douglas, Grant, Mahnomen, Otter Tail, Pope, Stevens, Swift, Traverse, and Wilkins), and counties within Mn/DOT District 8 (Chippewa, Kandiyohi, Lac Qui Parle, Lincoln, Lyon, McLeod, Meeker, Murray, Pipestone, Redwood, Renville, and Yellow Medicine). The Western Minnesota Study was undertaken concurrently with another study conducted for the Northern Portion of Minnesota and Northeastern Wisconsin. A map displaying the boundaries of each study region is presented in Figure 1. The landscape for this area forms a transition from forest to woodland prairie resulting in more agribusiness than timber production within the region. At one time, native prairie land and open aspen savanna with tall grass prairie mix dominated the landscape. Today these areas provide some of Minnesota’s most productive agricultural land, including corn, sugar beets, wheat, hay, and soybeans. The southern portion of the western study region including District 8 and part of District 4 is better suited for the production of corn, wheat and soybeans. The northern portion, including District 2 and part of District 4, primarily produces sugar beets and potatoes. Western
Western Minnesota Regional Freight Study Final Report
3
MN also has a significant source of manufacturing, agricultural processes, power generators, ethanol plants, grain elevators, and livestock industries located throughout the region.
Figure 1: Western Minnesota Freight Study Region
FREIGHT TRENDS AND ISSUES
Western Minnesota Regional Freight Study Final Report
4
In the modern global economic environment, cost-effective, time-sensitive transportation services are increasingly a strategy for competitive advantage in manufacturing, mining, agriculture, and service-based industries. Businesses shop the world for raw materials, parts, and labor; managing widely dispersed supply chains; using real-time information integrated with reliable, efficient, and responsive transportation services. Globalization of the U.S. economy has grown at a rapid pace over the past several decades and virtually all areas of economic activity are part of the globalization trend. Advances in technology and management practices allow U.S. firms to employ strategies that enable customized products for mass-market distribution. In the business environment that has evolved, many companies today use transportation as a competitive advantage against competitors both domestically and internationally. As a result, the ability of state and regional infrastructure managers to deliver robust transportation systems is directly tied to the economic competitiveness.
STRUCTURAL CHANGES TO THE U.S. ECONOMY Developed countries, including the US have seen structural changes in their economies that include an aging population, technology developments and improvements, and a shifting from a manufacturing base to a service base economy. Developing countries, by definition, are changing the structure of their economies as well, moving towards manufacturing and striving to become globally competitive with developed countries. In general, the US economy is continuing to shift from basic, resource-oriented industries, such as agriculture, mining and basic manufacturing, toward a more diverse industry mix including high value-added industries such as microelectronics and aerospace. In turn, demand for moving goods is shifting from bulk movements via rail, truckload and water to small, higher-value shipments via air freight, courier and less-than-truckload. This is particularly true in high-tech industries. In the early 1980’s, manufacturing was the leading sector of the U.S. economy, roughly equal in economic contribution to the Services and “FIRE” (finance, insurance, and real estate) sectors combined. However, over the course of the past two decades the services sector of U.S. economy has significantly outpaced manufacturing growth as a percentage of Gross Domestic Product. By 2005, the service industries sector had increased its share of the national economy to account for 68 percent of current-dollar GDP. 1 This transition to a service based economy has implications for transportation and logistics:
"The changes at work in the American economy are profound. The agricultural and manufacturing economy of the 20th Century has evolved. Services are now the fastest-growing sector of the economy. Logistics and transportation sectors are second…The American economy demands increasing volumes of trade if it is to continue to grow. The economic sectors that remain robust will require far more trade and travel per unit of output than was required 30 years ago."2
ECONOMIC CHANGES IN THE STUDY REGION
Western Minnesota Regional Freight Study Final Report
5
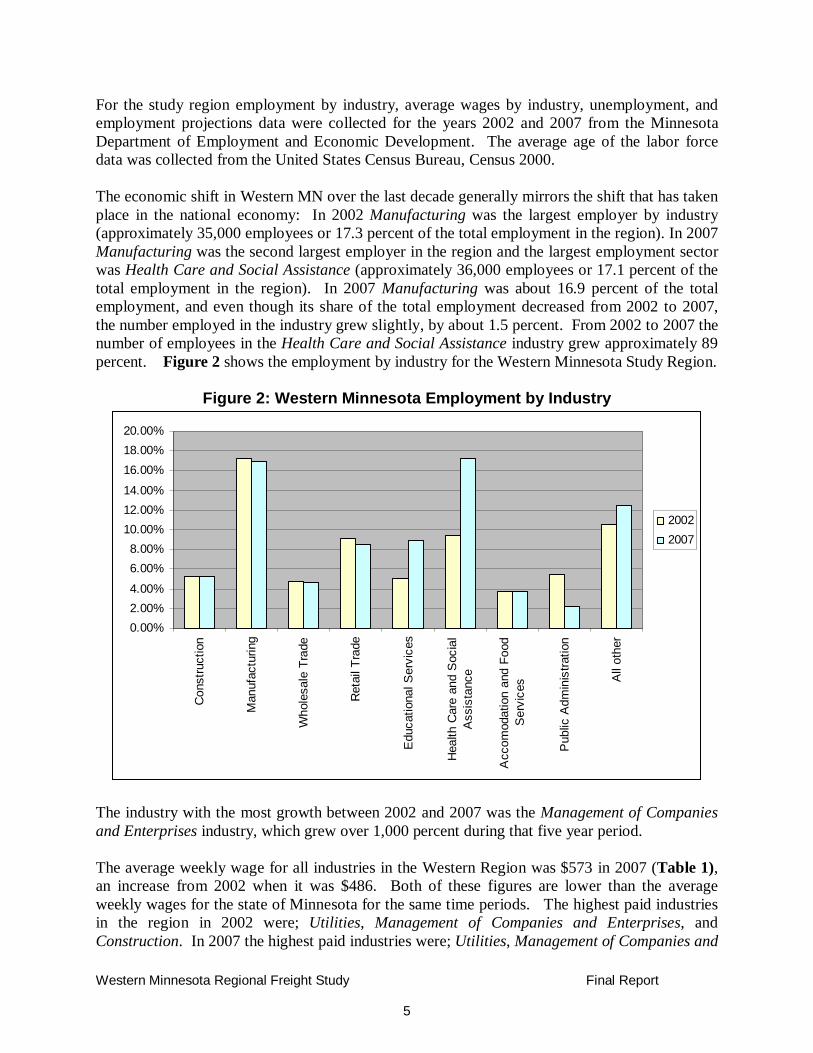
For the study region employment by industry, average wages by industry, unemployment, and employment projections data were collected for the years 2002 and 2007 from the Minnesota Department of Employment and Economic Development. The average age of the labor force data was collected from the United States Census Bureau, Census 2000. The economic shift in Western MN over the last decade generally mirrors the shift that has taken place in the national economy: In 2002 Manufacturing was the largest employer by industry (approximately 35,000 employees or 17.3 percent of the total employment in the region). In 2007 Manufacturing was the second largest employer in the region and the largest employment sector was Health Care and Social Assistance (approximately 36,000 employees or 17.1 percent of the total employment in the region). In 2007 Manufacturing was about 16.9 percent of the total employment, and even though its share of the total employment decreased from 2002 to 2007, the number employed in the industry grew slightly, by about 1.5 percent. From 2002 to 2007 the number of employees in the Health Care and Social Assistance industry grew approximately 89 percent. Figure 2 shows the employment by industry for the Western Minnesota Study Region.
Figure 2: Western Minnesota Employment by Industry
0.00%2.00%4.00%
6.00%8.00%
10.00%12.00%14.00%
16.00%18.00%20.00%
Con
stru
ctio
n
Man
ufac
turin
g
Who
lesa
le T
rade
Ret
ail T
rade
Edu
catio
nal S
ervi
ces
Hea
lth C
are
and
Soc
ial
Ass
ista
nce
Acc
omod
atio
n an
d Fo
odS
ervi
ces
Pub
lic A
dmin
istra
tion
All
othe
r
20022007
The industry with the most growth between 2002 and 2007 was the Management of Companies and Enterprises industry, which grew over 1,000 percent during that five year period. The average weekly wage for all industries in the Western Region was $573 in 2007 (Table 1), an increase from 2002 when it was $486. Both of these figures are lower than the average weekly wages for the state of Minnesota for the same time periods. The highest paid industries in the region in 2002 were; Utilities, Management of Companies and Enterprises, and Construction. In 2007 the highest paid industries were; Utilities, Management of Companies and
Western Minnesota Regional Freight Study Final Report
6
Enterprises, and Finance and Insurance. The construction industry was the fourth highest paid industry in 2007.
Table 1: Average Weekly Wage by Industry NAICS Code Industry Minnesota Western MN
11 Ag, Forestry, Fishing & Hunting $443 $516 $426 $523 21 Mining $952 $1,262 $630 $800 22 Utilities $861 $973 $1,029 $1,197 23 Construction $854 $1,005 $655 $773 31 Manufacturing $1,295 $1,481 $639 $725 42 Wholesale Trade $1,014 $1,242 $643 $791 44 Retail Trade $418 $453 $333 $379 48 Transportation & Warehousing $802 $874 $515 $599 51 Information $897 $1,116 $540 $651 52 Finance and Insurance $1,155 $1,511 $650 $801 53 Real Estate & Rental Leasing $643 $806 NA NA 54 Professional & Technical Services $1,091 $1,342 NA $749 55 Mgmt of Companies & Enterprises $1,531 $1,991 $817 $1,026 56 Administrative and Waste Services $493 $564 $394 $412 61 Educational Services $680 $771 $545 $650 62 Health Care & Social Assistance $665 $793 $449 $531 71 Arts, Entertainment, & Recreation $438 $509 $209 $214 72 Accommodation & Food Services $238 $272 $164 $192 81 Other Services, Ex. Public Admin $437 $498 $304 $350 92 Public Administration $739 $855 $545 $702
Source: Wisconsin Department of Workforce Development, Quarterly Census of Employment and Wages Data, 2002 and 2007, www.worknet.wisconsin.gov; Minnesota Department of Employment and Economic Development, Quarterly Census of Employment and Wages Data, 2002 and 2007, www.deed.state.mn.us
The majority of the labor force in the Study Region is 35 to 44 years old, approximately 26 percent. Approximately 22 percent of the labor force is 45 to 54 years old. The unemployment rate in the Western Region was 4.3 percent in 2002 and increased to 4.5 percent in 2007.
THE GROWTH IN GLOBAL TRADE Over the last several decades, economic activity has been shifting from industrialized countries to developing countries such as China, India, Russia, and other emerging economies throughout Asia and South America. The growing importance of trade in the US economy is a reflection of world economic trends. Between 1960 and 1999, world merchandise trade (exports and imports) grew at an average annualized rate of over 10 percent (in 2002 dollars).† Globalization has been a significant element of the growth in the US economy until recently. Growth in trade, its
† Merchandise Trade Section, Statistics Division, World Trade Organization
Western Minnesota Regional Freight Study Final Report
7
significance in the economy, and the changing characteristics of trade partnerships can be traced to a number of factors, including: Liberalization of world trade policies; Growth of multinational trade blocks and multinational corporations; and Accelerated adoption of advanced information technologies. Figure 3 summarizes the growth in trade by major product group. As shown, there has been significant growth in Agricultural Products and Fuels and Mining Products. However, the most dramatic increased has been in the trade of Manufacturing Goods.
Figure 3: World Merchandise Trade by Major Product Group3 Volume indices, 1950=100
Manufactures
Fuels and mining products
Agricultural products
100
1000
10000
1950 55 60 65 70 75 80 85 90 95 00 2005
Log. scale
Manufacturing
Fuel and mining products
Agricultural products
Volume indices, 1950=100
Manufactures
Fuels and mining products
Agricultural products
100
1000
10000
1950 55 60 65 70 75 80 85 90 95 00 2005
Log. scale
Manufacturing
Fuel and mining products
Agricultural products
For the U.S., following the global trend of increasing trade has resulted in significant growth in the trade of goods and services. A significant portion of the growth in international trade can be attributed to trade within North America between the US and its neighbors Mexico and Canada. NAFTA has been a pivotal driver of trade increases since its implementation in 1994. Total two-way trade between the US and NAFTA partners grew a remarkable 111 percent between 1993 and 2003, while total two-way trade between the US and the rest of the world grew by 79 percent.4 Table 2 demonstrates that the growth in global trade, as well as the strong influence of NAFA on U.S. and regional trade between 2004 and 2008. The top half of Table 2 shows the growth in
Western Minnesota Regional Freight Study Final Report
8
NAFTA trade for the U.S. and Minnesota. The table shows Minnesota’s growth in trade with Canada has been more than double the national growth rate, having increased by nearly 75% in five years. The lower half of Table 2 shows the growth in global exports for Minnesota and Wisconsin, as well as the share of total exports bound to Canada. For Minnesota, exports to Canada made up nearly 30% of the State’s total exports by value in 2008 For Wisconsin, exports to Canada made up nearly 32% of total exports by value.
Table 2: Growth in Trade – U.S. and Minnesota (Millions of $) Trade
US/NAFTA $711,647 $789,537 $866,099 $908,888 $963,923 35.4% MN/NAFTA $13,085 $15,485 $16,132 $18,027 $22,817 74.4% Note: For figures about The value of all surface modes is not equal to the sum of truck, rail, pipeline mail, foreign trade zones, other and unknown modes of transportation. For additional detail refer to the metadata. SOURCE: U.S. Department of Transportation Bureau of Transportation Statistics TransBorder Freight Data. Report created: Fri May 29 2009
Export data source: Foreign Trade Division, U.S. Census Bureau
Western Minnesota Regional Freight Study Final Report
9
A major factor in facilitating global trade has been the development and accelerated adoption of new information technologies. By reducing the cost of communication, information technology can assist in globalizing production and capital markets. Companies seek to outsource their operations around the world to take advantage of low-cost labor markets, raw material supplies, high-skill labor markets and access to distribution infrastructure, wherever these resources may present the greatest competitive advantage. This pattern of dispersed operations may occur through growth in multinational corporations with operating units throughout the world, or it may occur through alliances among firms in different parts of the world. In either case, advanced information technology facilitates the process by improving and speeding the information flow across global and corporate boundaries. Perhaps the one area where the advancement of information technology has had the greatest impact is supply chain management. The integration of information and transportation has allowed companies to disperse their operations to take advantage of competitive conditions throughout the world while reducing inventories and meeting higher service requirements.
KEY TRADE FLOWS AND MARKETS FOR THE STUDY REGION The largest commodity group exported out of the Western MN region is Farm Products, which accounts for 52 percent of all outbound tonnage or 28.2 million tons. The second largest commodity group exported out of the region is Nonmetallic Minerals with 31 percent or 16.7 million tons of all outbound tonnage. The remaining top three exported commodities are Food or Kindred Products, Clay, Concrete, Glass or Stone, and Lumber or Wood Products. Other areas of Minnesota make up the largest market for goods leaving the Western MN region receiving nearly 47 percent or 27.5 million tons. The second largest export market is Seattle with 11 percent, followed by Fargo with 7 percent.
COMMODITY FLOWS FOR MN/DOT DISTRICT 2 The total amount of freight moving on the District 2 transportation system is estimated at 21.7 million tons. District 2’s key export groups are shown in Table 3. The largest commodity group exported from the District is Farm Products at 6.2 million tons. Non-Metallic Minerals are the next largest export from District 2 totaling 2.8 millions tons.
Table 3: Key Export Commodities District 2, 2007 STCC Commodity Tonnage Rank Total Tons
1 Farm Products 6,169,309 14 Nonmetallic Minerals 2,830,981 20 Food Or Kindred Products 1,059,189 24 Lumber Or Wood Products 816,197 28 Chemicals Or Allied Products 306,033
Two modes are present for freight transportation out of District 2. Truck is the predominant mode of transportation out of the District. By tonnage, it accounts for nearly 70 percent of all
Western Minnesota Regional Freight Study Final Report
10
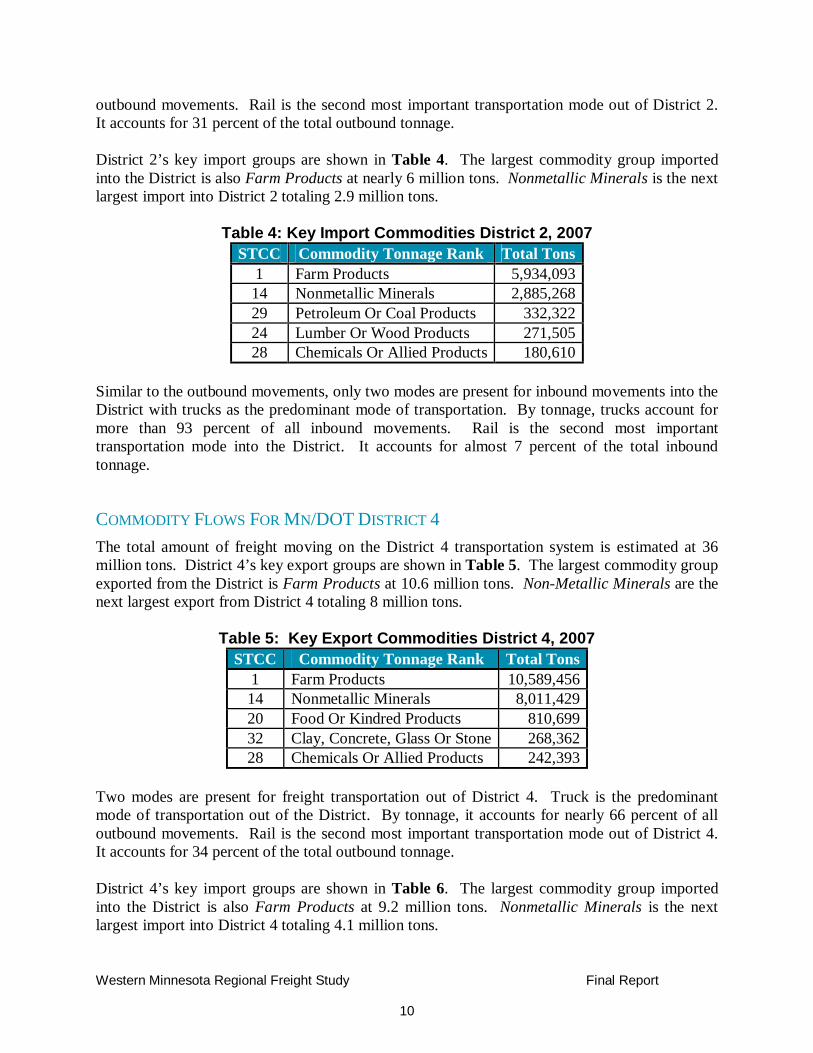
outbound movements. Rail is the second most important transportation mode out of District 2. It accounts for 31 percent of the total outbound tonnage. District 2’s key import groups are shown in Table 4. The largest commodity group imported into the District is also Farm Products at nearly 6 million tons. Nonmetallic Minerals is the next largest import into District 2 totaling 2.9 million tons.
Table 4: Key Import Commodities District 2, 2007 STCC Commodity Tonnage Rank Total Tons
1 Farm Products 5,934,093 14 Nonmetallic Minerals 2,885,268 29 Petroleum Or Coal Products 332,322 24 Lumber Or Wood Products 271,505 28 Chemicals Or Allied Products 180,610
Similar to the outbound movements, only two modes are present for inbound movements into the District with trucks as the predominant mode of transportation. By tonnage, trucks account for more than 93 percent of all inbound movements. Rail is the second most important transportation mode into the District. It accounts for almost 7 percent of the total inbound tonnage.
COMMODITY FLOWS FOR MN/DOT DISTRICT 4 The total amount of freight moving on the District 4 transportation system is estimated at 36 million tons. District 4’s key export groups are shown in Table 5. The largest commodity group exported from the District is Farm Products at 10.6 million tons. Non-Metallic Minerals are the next largest export from District 4 totaling 8 million tons.
Table 5: Key Export Commodities District 4, 2007 STCC Commodity Tonnage Rank Total Tons
1 Farm Products 10,589,456 14 Nonmetallic Minerals 8,011,429 20 Food Or Kindred Products 810,699 32 Clay, Concrete, Glass Or Stone 268,362 28 Chemicals Or Allied Products 242,393
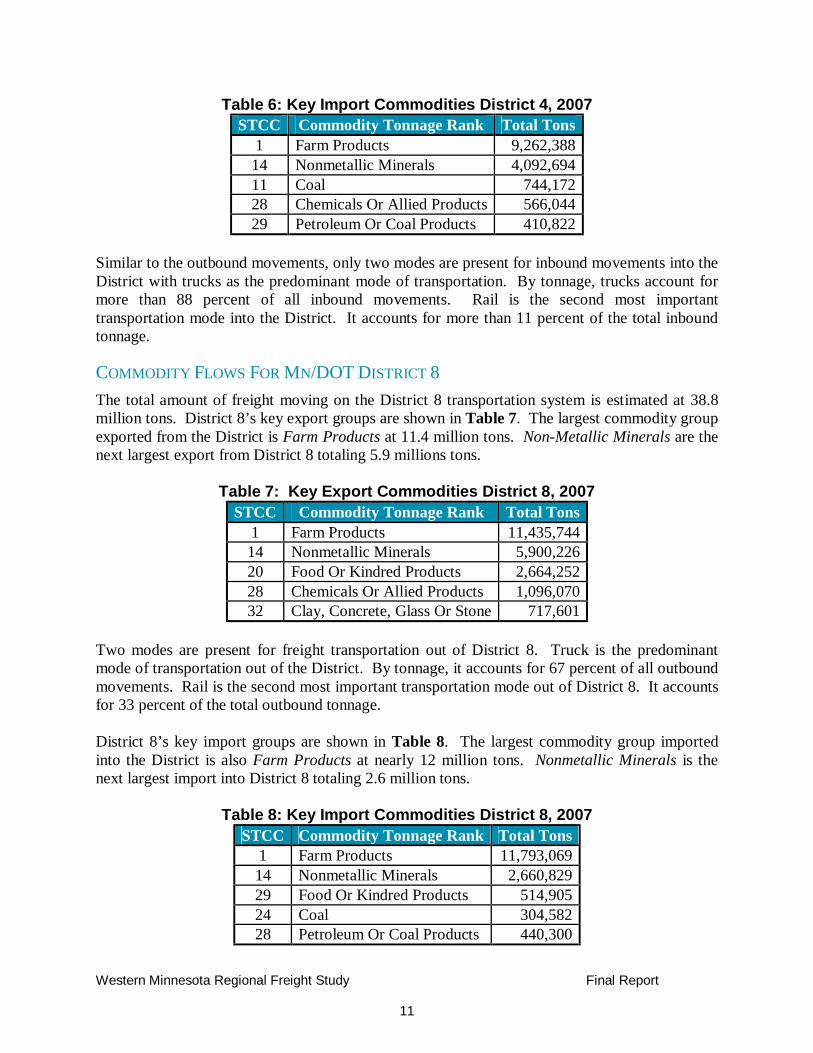
Two modes are present for freight transportation out of District 4. Truck is the predominant mode of transportation out of the District. By tonnage, it accounts for nearly 66 percent of all outbound movements. Rail is the second most important transportation mode out of District 4. It accounts for 34 percent of the total outbound tonnage. District 4’s key import groups are shown in Table 6. The largest commodity group imported into the District is also Farm Products at 9.2 million tons. Nonmetallic Minerals is the next largest import into District 4 totaling 4.1 million tons.
Western Minnesota Regional Freight Study Final Report
11
Table 6: Key Import Commodities District 4, 2007 STCC Commodity Tonnage Rank Total Tons
Similar to the outbound movements, only two modes are present for inbound movements into the District with trucks as the predominant mode of transportation. By tonnage, trucks account for more than 88 percent of all inbound movements. Rail is the second most important transportation mode into the District. It accounts for more than 11 percent of the total inbound tonnage.
COMMODITY FLOWS FOR MN/DOT DISTRICT 8 The total amount of freight moving on the District 8 transportation system is estimated at 38.8 million tons. District 8’s key export groups are shown in Table 7. The largest commodity group exported from the District is Farm Products at 11.4 million tons. Non-Metallic Minerals are the next largest export from District 8 totaling 5.9 millions tons.
Table 7: Key Export Commodities District 8, 2007 STCC Commodity Tonnage Rank Total Tons
1 Farm Products 11,435,744 14 Nonmetallic Minerals 5,900,226 20 Food Or Kindred Products 2,664,252 28 Chemicals Or Allied Products 1,096,070 32 Clay, Concrete, Glass Or Stone 717,601
Two modes are present for freight transportation out of District 8. Truck is the predominant mode of transportation out of the District. By tonnage, it accounts for 67 percent of all outbound movements. Rail is the second most important transportation mode out of District 8. It accounts for 33 percent of the total outbound tonnage. District 8’s key import groups are shown in Table 8. The largest commodity group imported into the District is also Farm Products at nearly 12 million tons. Nonmetallic Minerals is the next largest import into District 8 totaling 2.6 million tons.
Table 8: Key Import Commodities District 8, 2007 STCC Commodity Tonnage Rank Total Tons
Western Minnesota Regional Freight Study Final Report
12
Similar to the outbound movements, only two modes are present for inbound movements into the District with trucks as the predominant mode of transportation. By tonnage, trucks account for more than 93 percent of all inbound movements. Rail is the second most important transportation mode into the District. It accounts for 6 percent of the total inbound tonnage.
THE LOGISTICS REVOLUTION The integration of information and transportation to accommodate global supply chains has given rise to a logistics revolution in private sector business practices. Just-in-time (JIT) inventory practices, electronic shipment tracking, the use of multiple modes, the optimization of distribution facilities, and e-commerce are just some of the changes that have occurred, and are still occurring, in the economy. Figure 4 depicts a simplistic supply chain illustrating the multiple parties and close coordination required to make the system work smoothly and efficiently. Many companies now outsource coordination tasks to freight forwarders or third-party logistics (3PL) firms.
Figure 4: Illustrative Supply Chain Network
Just-in-time inventory is a supply chain system designed to maximize delivery and inventory efficiency. In many cases, JIT systems allow producers to deliver products and services directly to the customers based on their specified demands, typically bypassing intermediate distributors; thus, trucks on the highways and the containers on the rails have become moving warehouses in the new economy. As the U.S. economy becomes more service oriented and U.S. producer’s focus on more high-value or value-added products that are expensive to stock as inventory, companies are adopting modern supply chain management techniques with the following attributes:
Western Minnesota Regional Freight Study Final Report
13
Demand Pull Supply Chains: The movement of product triggered by the consumer as opposed to the producer (supply-push). Customer-Focused Logistics: Tailoring logistics networks to respond to the unique needs and profitability requirements of each specific group of customers. Transportation Effectiveness: Leveraging the ability of integrated transportation to improve customer service and total supply chain cost performance.
REGIONAL SUPPLY CHAIN EXAMPLES
GRAIN SUPPLY CHAINS As noted in the commodity summary, Farm Products make up the largest commodity group by volume in the Western Minnesota Region. Wheat is a significant crop in the Northwest portion of the State is mostly occurring in Kittson, Roseau, Marshall, and Polk counties. Minnesota harvested 104.1 million bushels of wheat in 2003. Minnesota also leads the nation in sugar beet production, primarily in the Red River Valley region of North Western MN. A 1998 study by the Department of Agriculture Economics at North Dakota State University, state of North Dakota, the Red River Valley sugar beet industry contributes an estimated (direct and secondary) economic impact of $2.3 billion in Minnesota and North Dakota The Red River Valley sugar beet association formed in 1926 represents 2,500 sugar beet growers who are shareholder of the American Crystal Sugar Company. American Crystal Sugar today is a successful growers owned cooperative, the nation largest producer of beet sugar. ACS provides millions of dollars for the Red River Valley economy in product and wages. Combined slice capacity of over 34k ton daily 2,950 growers up to 2k employee during harvest Minnesota also leads the nation in turkey production. Minnesota turkey farmers raised approximately 49 million birds in 2008, bringing more than $600 million in income for producers, processors, and other related industries. There are approximately 600 turkey farms and 250 producers currently operating in Minnesota. 90 percent of turkey products processed in state are exported out of Minnesota of the 90 percent 15% are exported to international markets. The four largest turkey processors in the state include: Jennie-O-Turkey Store MN (5 facilities in MN and1in WI) Northern Pride Inc. (Thief River Falls) Turkey Valley Farms North Star Foods Throughout most of the twentieth century, the U.S., and in particular the Upper Great Plains was the breadbasket to the world. U.S. farmers lead the world in producing high volumes of low cost, high quality feed and cereal grains. In the latter-half of the century however, new market entrants, namely countries in South America, with lower cost land and labor inputs also began producing large volumes of quality grains. The price competition that ensued and the glut of
Western Minnesota Regional Freight Study Final Report
14
grain available for export created a "farm crisis" in the U.S. during the 1980s. To remain competitive U.S. farmers became more mechanized to plant and harvest more acres per farm, and relied on crop genetics to produce more grain per acre. As U.S. farmers struggled to maintain their long held lead on world agriculture export markets, two major forces began to turn the demand for agricultural products in completely new directions. Population and economic growth are two major forces that determine long term agriculture demands. As the world's population grows, more people need to be fed. As world incomes rise, especially in developing countries, the demand for more diverse diets and value-added agriculture, such as processed foods and identity preserved grains also increase. During the 1980's and 1990's, the increase in global trade and foreign investments by manufacturers in third world counties wishing to tap cheap labor supplies, helped raise the standard of living in many poor nations. As a result, the demand for protein and value-added agriculture products created a host of new opportunities for U.S. farmers. "Widespread consumer demand for assurance that their food is safe has become one of the strongest forces impacting global food trade. In the 1990’s, Europe experienced an extended series of crises in the food sector, which created widespread public distrust of government regulators and government science, and cost the food industry billions of dollars. The list includes such widely reported incidents as bovine spongiform encephalopathy (BSE, more commonly known as mad cow disease), foot and mouth disease, dioxin contamination, diesel fuel in palm oil, sewage waste in feed, listeria in cheese, salmonella and antibiotics in poultry, and E-coli in animal meat. In Great Britain alone 129 people died in the 1990’s of variant Creutzfeldt-Jacob disease, contracted by eating BSE-contaminated beef." Just as U.S. agriculture in general has undergone significant changes in the past 20-30 years, the transportation of grain by rail has changed dramatically and today grain transport continues to evolve. Country Elevator Delivery Model: For much of the twentieth century farmers hauled their grain from the field to a country elevator in single unit trucks. Because of the proliferation of elevators, the typical field to elevator road haul was 25 miles or less. Grain collected at the local elevators was handled as a fungible commodity – grain of one type was completely substitutable. The grain was loaded into covered hopper cars and assembled into train sets of approximately 75 cars. Beginning in the 1980s as the railroads sold-off unprofitable, light density lines, short-line railroads took on the role of feeder services collecting rail cars from the hinterland to be interchanged to the Class I railroads. The basic elements of the country elevator grain delivery model are shown in Figure 5. Most of the grain moving through the country elevator model was bound for international export.
Western Minnesota Regional Freight Study Final Report
15
Figure 5: County Elevator Supply Chain for Grain
Farms
Straight Truck
Shortline Railroad
Class I Railroad
Export Gateway
Country
Elevators
First Haul:
• Farm to local elevator• Short haul (5 – 25 mi)• Single Unit Trucks• County/Township Roads
Line Haul:
• Fungible commodity• 75-80 car unit trains• River, inland and coastal port gateways
Shuttle Train Elevator Grain Delivery Model: The "shuttle train" concept as it applies to bulk grain shipments was introduced by Class I railroads in the early 1990s. The shuttle train initiative significantly changed how grain from the Northern Great Plains moved by railroad to domestic and international markets. Historically, grain and coal have constituted the two largest commodities handled by railroads. Several decades ago rail equipment utilization for grain and coal was similar. However following deregulation of the railroad industry in the early 1980s Class I railroads made dramatic productivity gains in coal transportation markets. Unit coal trains of 100 or more cars have now been common for at least two decades. Today coal hauls of 2,000 miles or more, and equipment cycle times of seven days are common. In comparison, unit train standards for grain in the 1980s and 1990s were 54 cars (BNSF) or 70 cars (UP), up from only 25 cars in the 60s and 70s. The average equipment cycle time for unit trains hauling grain is 18 to 24 days, substantially unchanged from the mid 1970s. Using shuttle trains, the Class I railroads are replicate coal transport productivity increases in grain markets. (Figure 6).
Western Minnesota Regional Freight Study Final Report
16
Western Minnesota Regional Freight Study Final Report
17
Figure 6: Shuttle Train Supply Chain Model for Grain
Export Gateway
First Haul:
• Farm to shuttle elevator• medium haul (5 – 75 mi)• Tractor semitrailer combination trucks• State/County/Township Roads
Line Haul:
• Fungible grain commodities• 100-120 car unit trains• 186,000 hopper cars• Coastal port and NAFTA gateways
Farms
5 or 6 Axle Semi Truck
Shuttle Elevator
Class I Railroad
Export Gateway
First Haul:
• Farm to shuttle elevator• medium haul (5 – 75 mi)• Tractor semitrailer combination trucks• State/County/Township Roads
Line Haul:
• Fungible grain commodities• 100-120 car unit trains• 186,000 hopper cars• Coastal port and NAFTA gateways
Farms
5 or 6 Axle Semi Truck
Shuttle Elevator
Class I Railroad
The Containerized Grain / Value-added Products Delivery Model: In response to the food crises in Europe during the 1990s, food companies in both Europe and Asia began to demand certain protocols in the production, processing and distribution of foods for intended for human consumption. One of the most prominent among these protocols is the ability to trace the origin, method of production and handling of grains. As a result, the traceability requirement for food products as they pass through the supply chain is causing grain marketers to rethink how grain bound for export market is handled and transported. Whereas the traditional bulk grain transportation system treats grain as a fungible commodity, in today’s global food markets buyers are demanding that grains be “identity preserved” (IP). In demanding IP grains, many markets no longer accept grains grown from genetically modified organisms (GMO), i.e., genetically modified seeds, or requiring organically grown products. Consequently, there is move away from bulk shipments to smaller lot-sizes in containers. In 2002, by weight, 15 percent of all U.S. agricultural product exports were shipped in containers, up from 9 percent in 1992. By value, more than 52 percent of all U.S. agricultural trade was shipped via containers. In 2002, it was estimated that over 600 U.S. companies were employing containers to ship grain and grain products to over 130 countries. So long as concerns exist about the integrity of world food supplies, the demand for IP grains shipped via sealed containers is likely to grow. The containerized, IP grain delivery model is typically accomplished in one of two ways:
Western Minnesota Regional Freight Study Final Report
18
Bulk grain from the field is first packaged in bags or totes and stacked on pallets. Then the product is loaded into containers. Bulk grain from the field is loaded directly in to a container that has been sanitized and lined with a plastic bag. Once a container is loaded it can be loaded on to a truck pulling a flatbed semitrailer. Drayage companies pick up containers for delivery to the nearest intermodal rail ramp from where it moves by intermodal train to a seaport. Utilizing containers, the specialized grain producer can control the individual shipment from the farm to its final overseas destination rather than merely from the farm to the first elevator (Figure 7).
Figure 7: Supply Chain for Containerized Grain and Value-added Products
Ethanol Plant or Livestock Feed Lots
Export Gateway
First Haul:
• Farm to container yard• Long haul (50 – 250 mi)• Tractor Semitrailer Combination Trucks• Interstate/State/County Roads
Line Haul:
• Identity preserved commodities• 100-120 car unit trains• 186,000 hopper cars• Coastal deep water ports
Class I Railroad
Container Yard
Farms and M
anufacturers
5 or 6 Axle Semi Truck
Enablers:• Access to empty containers• Service agreements with ocean carriers
ALL-TERRAIN VEHICLE AND SNOWMOBILE MANUFACTURING SUPPLY CHAINS A study by the University of Minnesota’s Tourism Center completed in 2006, estimated that direct all-terrain vehicle (ATV) expenditures in Minnesota during 2005 total nearly $642 million. ATV manufacturing in the state accounted for 4,216 jobs and wages totaling more $39 million.5 Figure 8 depicts a typical supply chain for vehicle manufacturers in Northwestern Minnesota, such as Polaris Industries and Arctic Cat Industries. Both manufacture ATVs and snowmobiles. The primary origins of the parts used to assemble the vehicles include Central Minnesota,
Western Minnesota Regional Freight Study Final Report
19
Montreal, New York, Massachusetts, North and South Carolina, California, Michigan, and some material imports from Asia and Mexico. Parts arrive to manufacturing facilities in Northwestern Minnesota primarily by truckload lots, supplemented by less-than truckload shipments. Some truckloads are transloaded from rail to truck at yards in Minneapolis and St. Paul. Combinations of Class I and Shortline railroads such as the Minnesota Northern Railway also deliver inputs to the manufacturing process such as plastic resins. The primary markets for finished ATVs include Southwest California, Arizona, Southeast Texas, Georgia, Florida, North and South Carolina, Canada, Minnesota, and Wisconsin. The primary markets for snowmobiles include the Mountain West, Canada, Alaska, Minnesota, and Wisconsin. Overseas markets account for approximately 15 to 18 percent of the outbound distribution. Recreation vehicle demand has been holding steady even with recent national economic difficulties. Some finished products are trucked Minneapolis/St. Paul and then loaded on to rail bound to east or west coast ports depending on the export market. Markets expected to grow in the next three to five years include Southwest California, Alaska, Western Europe, and Canada. Domestic shipments are made primarily by truck with the average shipment weight of 25 to 30 thousand pounds of cargo and in 53 foot semi-trailers.
Western Minnesota Regional Freight Study Final Report
20
Figure 8: Illustrative Supply Chain for ATV/Snowmobile Manufacturer
Western Minnesota Regional Freight Study Final Report
21
WIND GENERATION ELECTRICAL SUPPLY CHAIN In 2005 the Minnesota Legislature passed a bill calling on the Minnesota Public Utilities Commission to conduct a Wind Integration Study to examine the impacts on reliability and cost if Minnesota were to rely more heavily on wind generation for its electricity supplies. The The results of the study showed that this regional electric power system can reliably accommodate the addition of wind generation to supply up to 25% of Minnesota retail electric energy sales if sufficient transmission investments are made to support it.6 Wind is a readily available energy resource across the Upper Great Plains and along the North Shore of Lake Superior (Figure 9)
Figure 9: Wind Energy Resource Map for the United States
As wind farms are developed in Western Minnesota and the Dakota’s the demand for wind turbines have been steadily climbing. The turbines are often manufactured in Europe and are increasingly shipped into the Port of Duluth in pieces because of their oversize and heavy nature. At the Port of Duluth they are loaded onto special rail cars or trucks that are outfitted for over weight/over dimension moves. From the port they are moved to wind farms in Minnesota and Iowa. Figure 10 depicts a typical supply chain for wind turbines.
Western Minnesota Regional Freight Study Final Report
22
Figure 10: Illustrative Supply Chain for Wind Turbines
Western Minnesota Regional Freight Study Final Report
23
The implications of the logistics revolution for the Western Regions of Minnesota likely has several implications: 1) population centers will see increasingly higher levels of freight activity and truck traffic, as product movements are triggered by consumer consumption; 2) as highway congestion grows, alternative product movement strategies like transloading in regional centers like Fargo/Moorehead will impact regional land use strategies; and 3) to remain competitive in the new global economy, businesses will seek environments where transportation systems allow integrated supply chain strategies to succeed - namely transportation networks must support reliability, agility, dependability, and to some extent redundancy to meet the JIT expectations of consumers and larger receivers in commercial, industrial, and retail sectors of the economy.
KEY REGIONAL INFRASTRUCTURE INTERMODAL
Intermodal terminals represent key nodes in the regional freight system. The definition of what constitutes and intermodal terminal can take on different meanings in some contexts. For example in the railroad industry an intermodal terminal refers specifically to terminals were containerized cargos are assembled and loaded. For the purposes of this regional freight inventory, intermodal terminals are defined as locations where freight is transferred from one mode of transportation to another. Intermodal terminals include truck/rail, container (containers on flat cars, trailers on flat cars, bi-modal), pipeline terminals, air cargo terminals, grain shuttle terminals, and lake terminal/ports. A majority of the intermodal terminals in the region are located in urban centers. Figure 11 and Table 9 identify the intermodal terminals for the Western MN region. Intermodal terminals in the region are most often grain and pipeline facilities.
Western Minnesota Regional Freight Study Final Report
24
Table 9: Intermodal Terminals in Western MN
Figure 11: Intermodal Terminals in Minnesota and Wisconsin
District Company Name Intermodal Terminal Commodities 2 Beltrami Farmers Elevator Grain Shuttle Terminal Wheat, soybeans, corn 2 Erskine Grain Terminal LLC Grain Shuttle Terminal Soybeans, wheat
2 Farmers Elevator Co. of Alvarado Grain Shuttle Terminal Wheat, barley, soybeans, sunflower seed, corn
2 Markit County Grain, LLC Grain Shuttle Terminal Corn, soybeans, wheat 2 Mid Valley Grain Co-Op Grain Shuttle Terminal Corn, soybeans, wheat 2 Northwest Grain Grain Shuttle Terminal Wheat, soybeans, corn 2 Magellan Pipeline Pipeline Terminal Oil Products 4 BNSF Dilworth Yard Container Terminal COFC/TOFC 4 Agassiz Valley Grain, LLC Grain Shuttle Terminal Wheat, soybeans, corn 4 Cargill, Inc. Grain Shuttle Terminal Corn, soybeans, wheat 4 Elbow Lake Co-op Grain Grain Shuttle Terminal Corn, wheat, soybeans 4 Farmers Elevator Grain Shuttle Terminal Corn, soybeans, wheat 4 Glacial Plains Cooperative Grain Shuttle Terminal Corn, soybeans, oats 4 Hoffman Co-op Grain Assn. Grain Shuttle Terminal Corn, soybeans, wheat 4 Minn-Kota Ag Products Grain Shuttle Terminal Soybeans, Corn, Wheat 4 New Horizons Ag Service Grain Shuttle Terminal Corn, soybeans, wheat 4 New Horizons Ag Service Grain Shuttle Terminal Corn, soybeans, wheat 4 Prairie Lakes Co-op Grain Shuttle Terminal Corn, soybeans, wheat, oats 4 Red River Grain Company Grain Shuttle Terminal Wheat, soybeans, corn 4 West Central Ag Services Grain Shuttle Terminal Corn, soybeans, wheat 4 Western Consolidated Co-op Grain Shuttle Terminal Corn, oats, soybeans 4 Magellan Pipeline Pipeline Terminal Oil Products 4 BNSF Dilworth Auto Reload Truck/Rail Terminal Auto Reload (GM, Chrysler) 8 North Star Rail Intermodal Container Terminal Bi-Modal (RailRunner) 8 ADM Corn Processing Grain Shuttle Terminal Corn, soybeans, wheat 8 Cargill, Inc. Grain Shuttle Terminal Corn, soybeans, wheat 8 Cargill, Inc. Grain Shuttle Terminal Corn, soybeans 8 CHS, Inc. Grain Shuttle Terminal Corn, soybeans 8 Farmers Cooperative Elevator Grain Shuttle Terminal Corn, soybeans 8 Madison Energy Grain Shuttle Terminal Corn, wheat, soybeans 8 Meadowland Farmers Co-op Grain Shuttle Terminal Corn, soybeans, oats
Western Minnesota Regional Freight Study Final Report
25
Western Minnesota Regional Freight Study Final Report
26
REGIONAL ROADWAY NETWORKS
Trucks are an essential transportation mode for moving high-value goods throughout Minnesota, Wisconsin, and the United States. Designated roadway networks play an integral part in helping move goods throughout the states as they permit trucks to access regions that other transportation modes could not. The roadway system is comprised of interstate, state, county, city and township roads that allow freight to be transferred effectively. Existing designated transportation networks were used as a basis to designate the new Minnesota truck network. The routes were selected because of their designation for existing truck use and for the specific purpose each serves in the overall transportation network. The networks include: Interstate/National Highway System/Strategic Highway Network National Network and Minnesota Twin Trailer Network Interregional Corridor (IRC) System 10-Ton Roadways Local Roadways (less than 10 tons) Minnesota Tiered Roadway Network (Designated State Trunk Network) The roadway networks for the Western MN region are shown in Figure 12. The following sections describe the components of the roadway system and the networks identified above.
Western Minnesota Regional Freight Study Final Report
27
Figure 12: Tiered Roadway Network for Northern MN/WI and Western MN
National Highway System/Strategic Highway Network
Western Minnesota Regional Freight Study Final Report
28
The National Highway System (NHS) was developed by the United States Department of Transportation in cooperation with states, municipalities and metropolitan planning organizations. The NHS includes the Interstate Highway System and the Strategic Highway Network (STRAHNET), which is a system of public highways that provides access, continuity and emergency capabilities for military personnel and equipment. Other principal arterials and connector routes are also part of the NHS. Within the Western MN region, I-94 is the only element of the NHS and STRAHNET system. Table 10 shows the distribution of NHS and STRAHNET miles for each study area and district.
Table 10: NHS and STRAHNET System Miles District NHS Miles STRAHNET Miles
ATP 2 174 0
ATP 4 424 115
ATP 8 467 0 Western Region 1,064 115
National Network and Minnesota Twin Trailer Network The National Network (NN) consists of designated roadways throughout the United States that allow truck access including long combination vehicles (LCV), semi-trailer trucks with two trailers and single-trailer trucks with an extra-long trailer. In Minnesota, 4,904 miles of roadway are part of the NN. The NN is supplemented by Minnesota’s Twin Trailer Network (TTN), a system of other trunk and local highways on which LCVs may also operate. These networks permit oversize and overweight movements, usually within specific routes and travel times defined by a permit. Western MN is well served by the NN and Twin Trailer Network as many trunk and local highways help supplement the NHS is this region. Table 11 shows the distribution of NN and TTN miles for each study area and district.
Table 11: NN and Twin Trailer Network System Miles District NTN Miles MN TTN Miles
ATP 2 625 214 ATP 4 875 175 ATP 8 881 860
Western Region 2,380 Interregional Corridor (IRC) System A statewide, 2,996-mile Interregional Corridor (IRC) System was designated by Mn/DOT in 1999 to enhance the economic vitality of the state by providing safe, timely, and efficient movement of goods and people. The IRC system consists of Minnesota’s trunk highway system and is categorized into two categories: high-priority and medium-priority interregional corridors. High-priority IRCs connect the Twin Cities Metropolitan Area (TCMA) with primary Regional Trade Centers (RTC) throughout the state such as Fargo-Moorehad. Secondary RTCs include Bemidji, Detroit Lakes, Fergus Falls, Alexandria, Willmar, Marshall, and Hutchinson. I-94 is the only high-priority IRC within this region. Medium-priority IRCs include TH 2, TH 10, TH 212, and TH 23. Although the western region does not have a strong north-south IRC, many
Western Minnesota Regional Freight Study Final Report
29
freight users/shippers cross into North and South Dakota and utilize I-29 for this purpose. In general, Western MN is well served by the Interregional Corridor system. Figure 13 displays the IRC system along with primary and secondary RTCs.
Figure 13: Minnesota Interregional Corridor (IRC) System
Western Minnesota Regional Freight Study Final Report
30
Ten-Ton Roadways Ten-ton roadways provide important connections between intermodal freight facilities/major freight generators and the IRC system. These roadways generally include city and county routes that receive state aid funding, as well as trunk highways, interstates and some local roads. Year-round 10-ton roadways also provide a predictable freight roadway network, whereas all other roadways are subject to axle load limitations, including seasonal load restrictions. Mn/DOT is currently identifying an approach to develop a statewide network of 10-ton roadways to improve freight movements throughout the state and to limit routes with load restrictions. Figure 14 displays the 10-ton roadway system throughout Minnesota. Mn/DOT has identified Tier 1 and Tier 2 routes within the 10-ton roadway system. These routes help freight shippers plan routes and coordinate transportation shipments. In general, Northern MN has a fair amount of Tier 1 and Tier 2 roadways. However, not all identified 10-ton roadways connect with one another, resulting in gaps throughout the system. The 10-ton system needs to expand to better serve freight movements throughout the state. In Wisconsin, this is not an issue as cross border traffic is limited by Minnesota law. Local Roadway System (Less than 10-tons) Local roadways play an important role in freight movement, as almost every freight shipment either begins or ends on the local roadway system. While local roads may have posted maximum axle load ranges from five to 10 tons, based upon design capacity and materials, most local roads are not posted for 10-ton shipments. Mn/DOT and local jurisdiction authorities can impose temporary limitations on local roadways due to seasonal variations. Variations such as spring load limitations due to roadbed and surfacing capacity reductions caused by ground thawing and water incursion can hinder the movement of 10-ton freight. However, local roadways with lower design strengths can function satisfactorily under most circumstances. The low weight capacity of these local roadways limits the ability to efficiently move freight within each region. Season and other load limits have a notable impact on farm and commercial access in Western MN Expansion of the year-round 10-ton roadway network is widely recognized as a need to better serve freight movement within and between regions.
Western Minnesota Regional Freight Study Final Report
31
Figure 14: Ten-Ton Roadways in Minnesota
Western Minnesota Regional Freight Study Final Report
32
Tiered Roadway Network As described above, there are many different roadway networks, with differing levels of importance/significance to truck freight movement. Taken in combination, this roadway network proved too large to provide any specific and useful investment guidance. In May 2008, Mn/DOT began an analysis to identify trunk highways in Minnesota that are significant to the movement of freight. Developed as part of the 2008 Statewide Transportation Plan, this network was to be designated as a truck network that would supplement the Interregional Corridor (IRC) system. Therefore, Mn/DOT’s Tiered Roadway Network identifies the roadways that are most important to truck traffic. The tiered approach combines truck traffic and roadway design characteristics to help identify the roadways essential to the efficient movement of freight. The Tiered Roadway Network is shown in Figure 15. Heavy commercial annual average daily traffic (HCAADT) was used to validate the existence of elevated levels of HCAADT on the existing systems. HCAADT is an estimate of the total number of vehicles with at least two axles and six tires, using a specific segment of roadway on any given day of the year. Heavy Commercial vehicles include trucks only. Based on observed statewide data, tiers were classified based on breaks of 650 and 300, resulting in the following tiers: Tier 1: Roads on the network with HCAADT greater than 650 Tier 2: Roads on the network with HCAADT between 301 and 650 Tier 3: Roads on the network with HCAADT less than 300 The three tiers together form the State’s Designated Truck Network. Roadway design characteristics were used to verify appropriate design for each tier and to identify network deficiencies. Multi-lane segments of roadways provide a safe route for a vehicle envelope of 14 feet tall, 14 feet wide and 67 feet long. Almost all segments of multi-lane roadways are on Tier 1. In addition, shoulders of at least 10 feet in width provide a similar safety benefit. Roadway segments with shoulder width less than 10 feet are sporadically distributed across the network. In general terms, major truck corridors (e.g. Tier 1) in Minnesota include I-35, I-94, TH 2, TH 10, TH 12, TH 53, TH 59, TH 169, TH 33, TH 61, and TH 210. The Tier 1 network in Western MN supports adequate east/west freight movements, but lacks a north/south Tier 1 truck route.
Western Minnesota Regional Freight Study Final Report
33
Figure 15: Tiered Roadways in Minnesota
Western Minnesota Regional Freight Study Final Report
34
Regional Rail Networks The rail network is important for moving a variety of commodities, especially heavy bulk goods. Rail companies are divided into three classes which are established by the federal Surface Transportation Board (STB). These classes are based upon a railroad company’s gross operating revenues and generally reflect the type of service provided: long haul, regional, and local. Class I carriers have annual gross operating revenues over $346.8 million (2006 dollars). In general, they are considered long-haul carriers. Class III railroads, also referred to as shortline or regional railroads, have gross operating revenues of less than $27.7 million (2006 dollars). Three Class I carriers operate in Western Minnesota including the Burlington Northern Santa Fe, Union Pacific, and Canadian Pacific Railroads. Statewide Minnesota claims 4,481 miles of active railroad track in the state which ranks 8th in the nation. About one-third of the state’s total rail miles fall within the Minnesota portions of the study region. Wisconsin claims 3,401 miles of active railroad track, ranking it 15th in the nation for total miles of railroad, with 469 miles of track running through the Wisconsin portion of the study area. The railroad mileage in Western Minnesota is show in Table 12, and a map displaying the railroad networks is illustrated in Figure 16.
Table 12: Railroad Miles in Western MN
All Western Railroads District 2 Railroads District 4
Railroads District 8 Railroads
Class I Miles Carrier Miles Carrier Miles Carrier Miles BNSF 836 BNSF 224 BNSF 384 BNSF 228 CN 44 CN 44 CN 0 CN 0 CP 461 CP 147 CP 224 CP 90 UP 0 UP 0 UP 0 UP 0 Total Class I 1,341 415 608 318 Class III Carrier Miles Carrier Miles Carrier Miles DAK 20 DAK 20 MNN 173 MNN 173 MPLI 53 MPLI 53 NPR 46 NPR 46 OTVR 72 OTVR 72 RRVW 3 RRVW 3 TCWR 120 TCWR 5 TCWR 115 Total Class III 486 219 80 188 Total Rail Miles All Carriers 1,827 634 688 506
Western Minnesota Regional Freight Study Final Report
35
Figure 16: Freight Railroads in Minnesota and Wisconsin
Western Minnesota Regional Freight Study Final Report
36
AIR CARGO
Air Cargo Facilities in the Region In 2006, the Mn/DOT Office of Aeronautics completed an update of the Minnesota Aviation System Plan (MASP-2006). The MASP-2006 provides a macro level plan for guiding airport development in greater Minnesota. It also provides input into the Federal Aviation Administration’s National Plan of Integrated Airport Systems (NPIAS), individual airport master plans, and the State’s Transportation System Plan. Information presented in this section is taken from the air cargo portion of the MASP-2006. Overview of Air Cargo Operations Air cargo aircraft used on international North Atlantic and Pacific routes are usually wide-body jet aircraft with payloads ranging from 80,000 to 234,000 pounds. Narrow-body jet aircraft are typically used for short haul domestic routes and narrow-body turbo prop aircraft (also called feeder aircraft) typically serve small market needs. The payloads of narrow body jet aircraft range from 18,000 pounds to 95,000 pounds while the payloads for feeder aircraft range from 2,000 to 10,000 pounds. The upper decks on narrow-body jet aircraft accommodate containers, while the lower deck is bulk loaded in a process where individual pieces of non-containerized freight are placed directly into the aircraft. Feeder aircraft are typically bulk loaded only. Within the Minnesota air cargo system, feeder aircraft are used to serve communities on intrastate routes. Feeder aircraft also serve larger market airports such as Duluth or Rochester on routes where the distance is too great to truck. At these large market (or primary) airports, cargo from feeder aircraft is transferred onto a mix of narrow-body and wide-body aircraft that connect to cargo hub airports across the nation. Minnesota Air Cargo Airports in the Study Region In 2005 there were nine air cargo airports in the region that support scheduled air cargo operations for integrated and all-cargo carriers. These airports act as local market stations, serving their respective surrounding market areas, or as consolidation points for feeder aircraft and trucks. The region has several scheduled service air cargo airports: Alexandria Municipal Airport (AXN) Detroit Lakes Airport (DTL) Fergus Falls Municipal Airport (FFM) Thief River Falls Regional Airport (TVF) Thief River Falls Regional Airport (TVF) Several airports in the region offer on-demand charter operations to varying degrees of volume and frequency, ranging from one to 15 percent of total airport operations. They include: Glenwood Municipal Airport (GHW) Granite Falls Municipal Airport (GDB) Roseau Municipal Airport (ROX) Warroad International Airport (RRT) Roseau Municipal Airport (ROX)
Western Minnesota Regional Freight Study Final Report
37
Warroad International Airport (RRT) Note that all of Minnesota’s commercial passenger service airports also have air cargo service via scheduled passenger airline aircraft. Airports in the study region include: Bemidji Beltrami County Airport (BJI) Brainerd Lakes Regional Airport (BRD) Thief River Falls Regional Airport (TVF) Figure 17 shows the location of Minnesota air cargo airports by service type. Each airport listed may provide multiple air cargo services.
Figure 17: Minnesota Air Cargo Airports
Western Minnesota Regional Freight Study Final Report
38
Of the Minnesota airports supporting scheduled air cargo service, only the primary runways at Minneapolis-St. Paul International (MSP) and Duluth International (DLH) are long enough to support fully loaded and fueled wide-body aircraft typically used on transcontinental and international routes. Rochester International Airport (RST) may support smaller wide-body aircraft such as the Airbus A300 on shorter domestic routes. Other Minnesota airports supporting scheduled air cargo service typically handle turbo-prop feeder aircraft, though several are capable of accommodating small narrow-body jets such as the Boeing B727 or the DC-9. Runway lengths at Bemidji-Beltrami County (BJI), Brainerd Lakes Regional (BRD), and Thief River Falls Regional (TVF) are currently sufficient to handle these aircraft.
PIPELINES
Pipelines are responsible for moving a significant tonnage of fluid energy to and throughout the region, including the transportation of crude oil and natural gas. The end user receives the majority of this product ranging from power plants to private residences. Several power and transmission companies account for line ownership and operation including Great Lakes Gas Transmission Limited Partnership, Enbridge Energy, Magellan Midstream Partners L.P., and Minnesota Pipe Line Company as well as many other private providers. Additionally, other pipelines in or near each region also carry crude oil to and from the two Twin Cities refineries as well as to the Duluth-Superior Port for shipping. Great Lakes Gas and Enbridge Energy Pipelines are located in the northwestern section of the region (Northwest MN). The Great Lakes Gas Transmission Pipeline transports natural gas from Canada to Minnesota for local use and distribution. The Enbridge Energy Crude Oil Pipeline transports crude and refined petroleum products from Canada and the Dakotas into the state via terminals within the northwest part of the region. Magellan Midstream Partners also operates two terminals in the region and transports petroleum products from the Dakotas to Minnesota. Figure 18 shows the pipeline network in Minnesota.
Western Minnesota Regional Freight Study Final Report
39
Figure 18: Pipelines in Minnesota
Western Minnesota Regional Freight Study Final Report
40
PROGRAM ANALYSIS AND RECOMMENDATIONS For the study region a list of key issues was identified for potential addition investigation by the study team. After meetings with the Project Steering Committees, and additional meeting with the project management staff, the list of policy/institutional issues was narrowed to key issues that the consultant team was asked to investigate in-depth. 1. Explore Opportunities to Expand Intermodal Services in Dilworth, MN Examine previous studies and review possible actions for expanding intermodal service at the existing BNSF ramp in Dilworth, MN 2. Establish A Regional Freight Advisory Committee Consider the possibility of forming a regional freight advisory group for the purpose of formalizing private sector input to District, MPO and RDC planning processes. 3. Designate a Tiered Truck Network Investigate criteria for a possible tiered freight based highway network using established road design parameters, truck volumes, and strategic importance. 4. Commercial Commodity Corridor Routes An analysis of all a freight-tiered trunk highway system evaluating the ability to serve as commercial commodity corridors based on key freight factors. 5. Freight Safety and Information Strategies Discuss ITS strategies that can address freight safety and information needs, as expressed by key stakeholders. A sketch-level description of each application and an implementation plan will be provided for: 6. Super-haul Truck Corridors Conduct an analysis documenting best routes for heavy freight movements. 7. Truck Size and Weight Harmonization Explore the differences in trucking weight and dimension laws between Minnesota and Wisconsin, as well as, differences between Minnesota and North. 8. Undertake a Number of “Quick Start Projects (Less than $500,000) Identify a series of relatively low-cost freight beneficial projects that can be completed in a short-time frame.
Western Minnesota Regional Freight Study Final Report
41
1. DILWORTH RAILROAD INTERMODAL SERVICE EXPANSION Many stakeholders interviewed for the Regional Freight Study expressed interest in expanding intermodal services at the Burlington Northern Santa Fe (BNSF) Railroad Dilworth Facility in the Fargo-Moorhead Area. The analysis examines opportunities for improving existing services. BNSF Dilworth, MN intermodal terminal occupies about seven acres. When it was operating as an active intermodal terminal, it included one side loader to lift containers onto or off of trains and one hostler to move equipment around the yard. It has 1,700 feet of loading/unloading tracks, 100 parking spots, and 20 loading/unloading car spots. During interviews and at freight forums for this project, a number of stakeholders expressed concern over the intermodal service at the Dilworth terminal. Among the concerns are the lack of a container pool at the facility and the cost of repositioning empty containers to Dilworth. Respondents also noted an insufficient number of parking spaces at the terminal and insufficient room to grow or for related facilities such as warehousing. The terminal is currently a “paper ramp.” BNSF markets the facility as an intermodal hub, but is actually no longer rail-served. Instead, all containers are trucked to the BNSF terminal in St. Paul, and the containers are loaded onto BNSF intermodal trains in St. Paul. This adds costs to shippers who use Dilworth. Containers are drayed twice: once to the Dilworth terminal and a second time to the BNSF terminal in St. Paul. BNSF only quotes rates outbound from Dilworth to Seattle, WA, so all containers must be drayed 241 miles eastward, so that the same containers can later pass through Dilworth on intermodal trains bound for Seattle, WA. Between 1999 and 2003, the number of lifts at the Dilworth intermodal facility hovered at around 11,000 per year. (A “lift” refers to the movement of a container onto or off of a train). If the terminal’s loaded to empty ratio is 1:1, there are two lifts for every loaded container handled. In 2003, the number of lifts declined to 8,900 and then to 8,100 lifts in 2004. The level of traffic soon after plunged, so that there were only 2,000 lifts in 2006.7 The traffic decline was primarily caused by a dramatic increase in repositioning charges, which made it uneconomical for shippers to use the terminal. Export shippers do not negotiate directly with railroads for international intermodal service. Rather, they negotiate with ocean carriers who quote combined rail and water rates. The ocean carriers negotiate with the railroads. It is uncertain whether the high rates were caused by the BNSF charges to ocean carriers or the ocean carriers unwillingness to reposition containers to Dilworth. As of 2007, ocean carriers were reporting repositioning costs of $350 - $750 per container, with a tendency toward the high end of this range.8 At the time, BNSF published tariff rates for repositioning containers to Dilworth were $670 from St. Paul and $900 from Chicago for a twenty foot international container. This pricing effectively closed the Dilworth facility. In 2008 the North Dakota governor’s office intervened and negotiated with BNSF to equalize rates for repositioning empty containers from Chicago to Minot/Dilworth versus St. Paul. Currently, the BNSF published tariff rate to reposition a 20 foot container from Chicago to Dilworth or Minot is $386 per container, the same rate charged to reposition an empty container
Western Minnesota Regional Freight Study Final Report
42
from Chicago to St. Paul. If an ocean carrier has containers available in St. Paul, the shipper in the Twin Cities will not need to pay the $386. The level of traffic at the Dilworth facility has not been sustainable since at least 1999. Intermodal facilities must maintain a minimum level of traffic to be financially feasible. Intermodal customers expect frequent service (at least three trains per week), or the facility will not be used. The number of cars per train must also be of sufficient quantity, so that the railroad can provide efficient service. Generally, intermodal is provided as point-to-point service, so intermodal units travel in unit trains directly between terminals. In 2006, the average BNSF intermodal train carried 163 units (trailers and containers), although the company prefers to operate larger trains of 250 units.9 The willingness of railroads to pick up and drop off less than trainload quantities of intermodal units varies by carrier and mitigating factors, such as equipment balance. The traffic volume must also be able to defray the fixed costs associated with intermodal terminals, such as the lifting equipment, the personnel, the scales, etc. Ocean carriers are also hesitant to supply containers to low volume terminals, preferring to concentrate their container supply in larger markets. The minimum traffic volume needed to sustain an existing terminal is often cited at somewhere between 15,000 to 25,000 lifts per year. Because these traffic levels were unsustainable, and because shippers in North Dakota would like to have access to an intermodal facility in Minot, ND, the State of North Dakota presented a potential solution in 2007. Under the “co-load” proposal, a second intermodal terminal would be constructed in Minot, ND. Trains bound for the Pacific Northwest would be partially loaded at Dilworth, MN. The partial trains would be consolidated with additional intermodal cars at Minot. Trains with complete trainload quantities of intermodal containers would then proceed to the Pacific Northwest. Much of the Minot facility has been built, in part with a $1.5 million grant from the U.S. Commerce Department’s Economic Development Administration. The terminal is on a 180 acre site and is called the Port of North Dakota. BNSF agreed to test the co-load concept for a period of six months, provided that a third party operator market the facility, establish a customer base, and make the co-load concept into a viable business. This effort is currently stalled. Meanwhile, the Port of North Dakota is being used to transload petroleum products. Rates at the Dilworth Facility - In assessing potential solutions at the Dilworth facility, one important issue is to assess the current costs of using the Dilworth hub and understand whether shippers in western Minnesota are at a disadvantage compared to shippers located in close proximity to the BNSF terminal in St. Paul. Publicly available rates were downloaded from the BNSF website. These tariff rates tend to be higher than the privately negotiated rates between railroads and ocean carriers. The rates in Table 13 also include a 13 percent fuel surcharge that was in effect in April 2009. These are compared to the average carrier revenue per intermodal unit for shipments between the St. Paul/Minneapolis Business Economic Area (BEA) and the Seattle Washington BEA during 2007. The rates for general freight are considerably higher, but the quantities of general freight shipped out of Dilworth are likely to be negligible. This analysis suggests that the rates for agricultural shipments between Dilworth and Seattle were not dramatically different from those between St. Paul and Seattle. However, a container pool is located in St. Paul, while none is available at Dilworth. If both the Dilworth and the St. Paul
Western Minnesota Regional Freight Study Final Report
43
shippers must reposition an empty container from Chicago, then the costs are similar. However, if the St. Paul shipper has a container already locally available, his costs are $436‡ less than those of the Dilworth shipper. Container repositioning and availability remain issues. Table 13: Comparison of Rates for 20 Ft Container Dilworth vs. St. Paul Terminal
Nature of Rate Dilworth St. Paul
Tariff rate – Agricultural products (international, bagged) to Seattle, WA with fuel surcharge $1,068 $1,068
Tariff rate – Agricultural products (international, bulk) to Seattle, WA with fuel surcharge $1,104 $1,104
Tariff rate – General merchandise (international) to Seattle, WA with fuel surcharge $1,964 $1,493
Tariff rate – Reposition empty container from Chicago, IL with fuel surcharge $436 $436
Average revenue per unit for grain/oilseed shipments from St. Paul BEA to Seattle BEA from STB Waybill Sample, indexed to 4/2009
NA $1,029
COMPETITIVE SITUATION OF THE DILWORTH TERMINAL BNSF’s Internet site includes a web page which provides advice to any party that would like to propose a new intermodal terminal.10 The company provides a list of criteria, which one could interpret as BNSF’s own view of the critical success factors for intermodal terminals. These include the following: Service to market that does not overlap with existing intermodal facility; Weekly minimum volumes that allow trainload volumes and economics; Inbound and outbound balance; and Sustainable growth over the long term. These considerations can serve as a gauge of the strengths and weaknesses of the Dilworth terminal. Market overlap - The map in Figure 19 from the BNSF website shows the company’s existing intermodal hubs and service areas, assumed to be a 200 mile radius. The map suggests that the Dilworth facility is sufficiently distant from St. Paul that BNSF would not consider the two market areas to be excessively overlapped.
‡ Includes fuel surcharge
Western Minnesota Regional Freight Study Final Report
44
Figure 19: Existing BNSF Intermodal Hubs and Market Areas
Source: BNSF Website Volumes - As mentioned previously, the volumes at the Dilworth facility were not sustainable. If one assumes that the facility operates 260 days per year (52 weeks at 5 days per week), and the facility is expected to serve one train in each direction, the total lifts per train at 11,000 lifts (Dilworth volume between 1999 and 2003) would only be about 21. Even if the facility were only operational three days per week, the total lifts per train would be 35. This is far less than the 163 average units per BNSF train or the 250 units per train that BNSF would ideally hope for. The North Dakota co-load idea could help to increase the volumes at the combined Dilworth/Minot facilities. Another possibility could be to improve access to the facility, such as to develop a rail feeder service on a shortline railroad. By lowering the cost to dray containers to the Dilworth terminal, volumes at the terminal could be increased. A third idea could be to improve the facilities at the terminal, such as to add container loading equipment. These ideas will be discussed later in this chapter. Sufficient volumes are not just an issue to rail carriers, but to the ocean carriers that provide the containers as well. For example, Maersk lines decided to rationalize its network, as discussed in a Maersk Line February 2007 press release: “The reality today is that the primary transportation cost drivers in North America have to a large degree, shifted from ocean leg to the inland leg of the transportation chain…Land side costs have been driven up by bunker prices, rising terminal and rail costs and insufficient land based infrastructure to support continuous double digit volume growth…In order to address these challenges, and continue to offer services that meet our customers’ expectations, we will optimize our North American service network. The optimization will be accomplished through a carefully planned and executed phase out of service to certain lower volume locations which we can no longer cost effectively serve.”
Western Minnesota Regional Freight Study Final Report
45
Inbound and Outbound Balance - This will be one of the more difficult issues to resolve at the Dilworth terminal. A recent study by the Upper Great Plains Transportation Institute regarding the feasibility of an intermodal terminal in the Fargo/Moorhead Area surveyed local shippers regarding their likely usage of a terminal.11 This study suggested that 73 percent of the traffic would be outbound. The ratio of inbound/outbound traffic in Dilworth is probably at least as imbalanced, as agricultural products are shipped out but little is shipped in. This is the primary reason for the repositioning charge that Dilworth area shippers must pay for bringing empty containers to Dilworth. Generally, inbound intermodal traffic consists of consumer items, much of which are sourced from Asia. Therefore, the inbound containers tend to terminate at locations of high population density or at major distribution hubs. The population of the Chicago metropolitan area in 2007 was about 9.5 million people. Chicago also serves as the nation’s primary connecting point between eastern and western railroads. The map in Figure 20 depicts the flow of consumer products over the BNSF network, with the primary flow beginning in the San Pedro Ports of Los Angeles and Long Beach and terminating in Chicago. Due to its status as the nation’s leading distribution hub, Chicago is the largest destination of containers and therefore the largest source of empty containers. Minneapolis/St. Paul is a reasonably large metropolitan area with about 3 million inhabitants in 2007. Due to the size of the market, the Twin Cities area would be expected to maintain a medium sized pool of empty containers. The Fargo metropolitan area, by contrast, had about 192,000 people in 2007, so it will tend to attract relatively low volumes of consumer products, particularly compared to the outflow of agricultural products. The question arises as to why BNSF must charge Dilworth shippers to reposition empty containers from Chicago, when BNSF trains carry large volumes of empty containers past Dilworth on its mainline every day? These containers are being repositioned to Asia for another eastbound voyage to the United States. As a starting matter, the average container ship is designed to carry containers with an average lading weight of between 12 and 14 tons. According the STB 2007 waybill sample, the average container traveling from the St. Paul BEA to the Seattle BEA with agricultural products weighed 21.75 tons. Shipping lines must balance these heavier containers with empty or lightly loaded containers. Not all containers could return to Asia with heavy commodity products, such as grain.
Western Minnesota Regional Freight Study Final Report
46
Figure 20: BNSF Consumer Product Flows
Source: BNSF Website Another issue relates to the round trip economics for transporting goods between the U.S. and Asia. Generally, the rates that are received for eastbound traffic between North America and Asia are much higher than rates for westbound traffic. The westbound traffic represents “backhaul moves,” i.e. the conversion of containers that would otherwise have returned empty to Asia to revenue moves. However, ocean carriers and railroads have an incentive to reposition containers as quickly as possible to Asia for the more lucrative eastbound moves from Asia to North America. Once containers have been loaded onto trains and are in transit to Pacific Northwest ports, stopping and unloading these containers may be considered an unacceptable delay, particularly given the relatively low profit margins on westbound traffic. Railroads incur incremental costs associated with stopping a train and loading/unloading containers at an intermodal terminal. Railroads will tend to seek recovery of this cost, which would have been avoided if the container had simply continued to Pacific Northwest ports. Rail carriers also market the speed of their intermodal service. Picking up and dropping off cuts of cars at intermediate points will tend to delay trains and potentially make the overall service less competitive.
Western Minnesota Regional Freight Study Final Report
47
Finally, as of May 2009, the amount of capacity for westbound trans-Pacific voyages has contracted. Because the demand for Asian imports has declined, fewer ships are traveling between North America and the Pacific, impacting both directions. While there was at one time excess capacity for westbound container shipments to Asia, that is not the case today. Sustainable Growth over the Long Term - The Dilworth terminal has a high potential for growth. Containerized grain grew dramatically over the past several years. The dominant cargoes handled at the terminal will continue to be containerized agricultural products, mostly consisting of corn and soybeans bound for export to Asia. Between 2003 and 2007, containerized grain volumes to Asia grew by five fold, as shown from the U.S. Department of Agriculture (USDA). The causes of the increases are several: Overall increase in export demand - According to statistics from the Minnesota Department of Agriculture, Minnesota exports grew by an annual rate of 6.5 percent between 2000 and 2007. In 2007, 56.5 percent of Minnesota’s exports consisted of soybeans and feed grains, such as corn or distillers dried grains with solubles (DDGS). The largest overseas markets for Minnesota agriculture were Japan, China, Canada, Taiwan, and Korea. Growth of identity preserved grains - Few statistics are available on the overall size of the identity preserved (IP) grain market, but this has been a large growth area over the past decade. Previously, it had been assumed that whatever grains were moving by container were IP grains. Over the past several years, this ceased to be the case. IP grains tend to be shipped in smaller lot sizes and require, in most instances, a traceable “chain of custody.” Specialty or IP grain cannot co-mingle with other shipments. Containerized shipping enables farmers to seal containers at their origin, so that these grains are never mixed with other grains at elevators or elsewhere in the logistics chain. Growth of ethanol production and its byproduct, DDGS - An export market for DDGS has been established, but this product is poorly suited for shipping in a conventional bulk ship. Unless DDGS is put through a drying process, it tends to clump and would be very difficult to extract out of a bulk ship. DDGS is more suitable for shipping by container. Relationship between bulk shipping rates and containerized shipping rates - As container ships grow larger, the cost of ocean shipping per container has declined, due to ship economies of scale. However, strong Asian demand for commodities drove up bulk shipping rates in 2007 and early 2008. In the first half of 2008, bulk shipping rates from the Pacific Northwest to Japan peaked at $80 per metric ton. As of July 2008, the cost of containerized grain shipments from the Pacific Northwest to Japan was only $55 per ton. However, by December 2008 bulk rates from the Pacific Northwest to Japan had plunged to $13 per ton while containerized rates were at $40 per ton.12 Changing buyer behavior - Anecdotal evidence suggests that a larger number of buyers are in the market for smaller lot sizes of grains. Some customers would prefer to buy grain by the container-load rather than entire shiploads. Figure 21 demonstrates the strong growth between 2000 and 2007 for containerized grain shipment from the U.S. to Asia.
Western Minnesota Regional Freight Study Final Report
48
However, as shown by Figure 22, data from the U.S. Department of Agriculture suggests that containerized grain shipments to Asia have declined significantly since early 2008.
Figure 21: Containerized Grain Exports from the U.S. to Asia
Containerized Grain Exports To Asia
-
50
100
150
200
250
300
350
400
450
2000 2001 2002 2003 2004 2005 2006 2007
Thou
sand
twen
ty-f
oot e
quiv
alen
t uni
ts
Source: Port Import Export Reporting Service (PIERS), Journal of Commerce
Western Minnesota Regional Freight Study Final Report
49
The high overall export volumes in 2007 and 2008 represent a spike that is not expected to be matched again anytime soon, as shown in the USDA long term export forecast of Figure 23. Long-term forecasts further suggest that containerized grain shipments will probably experience slow, steady long-term growth, but not reach 2007 volumes for some time.
Source: USDA It is doubtful that bulk shipping rates will exceed containerized rates again in the near future. This inversion was caused by a temporary misalignment between demand and capacity in the bulk shipping fleet. Heavy demand for raw materials in China and other emerging markets created a high demand for bulk ships. Since that time, the size of the global bulk fleet has increased dramatically, just as demand has weakened. Figure 24 shows the changes in relative costs between containerized and bulk westbound trans-Pacific shipments.
Western Minnesota Regional Freight Study Final Report
50
Figure 24: Comparison of Ocean Rates per Short Ton: (Bulk Grain Vessels from Pacific NW to Japan vs. Ocean Container Tariff Rates: Soybeans from U.S. to Asia)
100
105
110
115
120
125
130
135
140
145
2001
2002
2003
2004
2005
2006
2007
2008
2009
2010
2011
2012
2013
2014
2015
2016
2017
2018
Source: USDA, WSA Analysis, Assumes 21.75 tons per TEU
POTENTIAL MEASURES TO RESTORE RAIL SERVICE TO DILWORTH / IMPROVE RATES The traffic at the Dilworth terminal has and will continue to be dominated by containerized agricultural products, particularly corn, DDGS, and soybeans. This has several implications. Given the large growth in containerized grain over the past several years, the potential market for the Dilworth terminal should be significantly larger than the 11,000 lifts that had passed through Dilworth before 2003, assuming competitive rates. On the other hand, the USDA forecast data above suggests that growth will be moderate in the future. The largest challenge to the Dilworth terminal will be the imbalance of traffic caused by relatively low inbound volumes. Rail drayage - BNSF would be more likely to resume rail service to Dilworth if the volumes at the terminal increased to sustainable levels. One way to increase the container volumes could be to reduce the cost of drayage to the terminal and increase the size of the terminal’s catchment area. One potential way to accomplish this would be to provide rail drayage. A similar approach has recently been used to provide intermodal rail service to shippers in the area around Montevideo, MN. North Star Rail Intermodal, LLC (North Star) has established an intermodal facility in Montevideo (Figure 25). When WSA conducted a case study of the company for the Minnesota Department of Agriculture in 2008, the company ran seven loaded trains per two week cycle between the Montevideo facility and the Canadian Pacific (CP) Shoreham Yard in St. Paul, MN on the Twin Cities & Western (TC&W).13 Containers were transferred between the TC&W trains and CP trains at the Shoreham Yard. From St. Paul, containers were then carried
Western Minnesota Regional Freight Study Final Report
51
to the Port of Vancouver for export to Asia. North Star also has transloading equipment located at Montevideo which can transfer grain from trucks or covered hopper rail cars to containers.
Figure 25: North Star Rail Transload Equipment The cost savings from the rail service were estimated to be substantial. The cost of using rail to dray containers the 130 miles from Montevideo to the Shoreham Yard was estimated to be somewhere between $10 and $13.69 per ton. This compares to $21 per ton plus surcharges to dray containers by truck over the same route, assuming that containers would have been loaded in Montevideo in both circumstances. The cost of replicating the Montevideo facility was estimated to be about $4.7 million, although the cost to North Star would have been less because much of the yard infrastructure was in place before North Star moved into the property. It is possible that traffic at the Dilworth intermodal facility could increase if a rail feeder service were established, analogous to the manner in which the Montevideo service feeds into the CP Shoreham Yard. In the case of the North Star service at Montevideo, several factors made the service feasible: TC&W - The TC&W is unique in that it has direct access to a Class I railroad intermodal network through its trackage rights to the CP Shoreham Yard. At 130 miles, the distance between Montevideo and St. Paul is sufficiently far to make the intermodal service worthwhile. The TC&W’s trackage is maintained at a level that allows train speeds up to 30 miles per hour, which is faster than those of other regional railroads. Location - Montevideo is located in a high agricultural production area. To the southeast of the facility are Renville and Redwood Counties, the two highest producing counties in Minnesota for both soybeans and corn.
Western Minnesota Regional Freight Study Final Report
52
Cooperation among the parties - North Star was able to obtain cooperation from all parties necessary to make the service possible: CP, the TC&W and Hapag-Lloyd shipping lines. Key to obtaining this agreement was the consistency of the service with each partner’s operations. Because the TC&W directly accesses the CP Shoreham Yard, the service was not burdensome to the CP. Unloading a North Star intermodal train is similar to unloading containers from trucks. The service was also convenient for shipping lines, since the containers are only removed from the CP’s intermodal network for a short time. From the time that loaded containers leave Shoreham Yard to the time that the empty containers arrive back again is only 48 hours. Shipping lines can still quickly reposition containers to Asia. The only regional railroad that has direct access to Dilworth is the Otter Tail Valley Railroad. One could consider establishing a satellite intermodal terminal on the carrier’s line in Fergus Falls, MN, but the distance is probably too short at 55 miles from Fergus Falls to Dilworth. A recent study by the American Transportation Research Institute (ATRI) estimated that the marginal cost of operating a truck per hour is about $83.68.14 It would be difficult to load a container onto a railcar and ship it 55 miles for less than $83.68 per container. A more intriguing possibility is to establish a satellite intermodal terminal on the Red River Valley & Western Railroad (RRVW), since the RRVW could extend the Dilworth terminal’s catchment area farther. The RRVW system is shown on the map in Figure 26. For example, the RRVW 7th Subdivision extends about 188 miles from Dilworth to Maddock, ND. The RRVW and the TC&W are affiliated companies. Placing a feeder intermodal terminal near Maddock could make it feasible to dray a container from much farther to the Dilworth terminal than would otherwise be economically feasible. If the service between Dilworth and Maddock operated under similar parameters to the North Star intermodal service, the cost of the rail service would be between $15 to $17 per ton.15 Assuming it is similar to that of North Star Rail Intermodal, the cost of building a terminal would probably be between $4 to $5 million, depending upon the site, the specific requirements, road access into the site, and the requirements of the local jurisdiction. If a preexisting rail yard can be found, the cost of retrofitting the yard will be less.
Western Minnesota Regional Freight Study Final Report
53
Figure 26: Red River Valley & Western System Map
Source: Red River Valley & Western website The terminal could also be constructed to work with RailRunner Terminal Anywhere™ technology. RailRunner is an innovative intermodal solution in which the intermodal highway chassis becomes part of a railcar. Chassis are lifted onto bogeys, which are essentially sets of rail wheels (see Figure 27). The benefit of RailRunner or other types of bimodal equipment is that it reduces the investment requirements for establishing an intermodal terminal. No expensive lifting equipment needs to be bought. Because the equipment is lighter, less ground preparation is required for the site. Other similar bimodal products are currently in service, such as the Wabash National’s RoadRailer, which is used in Norfolk Southern Triple Crown service. However, RailRunner is the only equipment that currently offers a bimodal solution for intermodal chassis.
Western Minnesota Regional Freight Study Final Report
54
Figure 27: Assembling a RailRunner Train
Source: RailRunner Website A terminal on the RRVW could serve as an alternative arrangement if BNSF rejects the idea of establishing a co-load operation and refuses to provide intermodal container service to the Port of North Dakota. In terms of agricultural markets in North Dakota, the largest exports in the state are wheat, corn and DDGS, sunflower and soybeans. In a recent project for the State of North Dakota, Minot area shippers expressed the most interest in shipping peas and lentils by container, followed by wheat products.16 The production of peas and lentils is concentrated in the Northwest part of the state, with the northwest counties accounting for 61 percent of production. An intermodal terminal on the RRVW would bring intermodal access closer, but it would not be located in close proximity to the largest pea and lentil markets. The highest concentrations of corn and soybean production in the state are in Cass and Richland counties, already within truck drayage distance of Dilworth. An intermodal terminal in Maddock, ND would be well-situated to serve sunflower and wheat markets in North Central North Dakota. In conclusion, an intermodal terminal on the RRVW would not be ideally situated to serve all of the largest agricultural markets in the state, but it would still offer shippers improved transportation options. Unfortunately, several obstacles would need to be overcome for an intermodal terminal to be established on the RRVW. As a starting matter, the carrier does not have direct access to the Dilworth terminal but would need to gain trackage rights over the BNSF mainline between Dilworth and Casselton. BNSF may not grant these trackage rights. Second, the availability of empty containers would still be a problem. The North Star service has access to the container pool in St. Paul. Service between Maddock and Dilworth would not follow the same model since Dilworth does not have a container pool. Shippers would still need to pay to reposition containers to Dilworth, which is the terminal’s main impediment to begin with. On the other hand, the increased traffic volumes that a feeder rail intermodal service would bring could help to restore rail service to the terminal and make continued service viable into the future.
Western Minnesota Regional Freight Study Final Report
55
RECOMMENDATIONS FOR EXPANDING INTERMODAL SERVICE AT DILWORTH Steps to improve service conditions at the BNSF Dilworth Intermodal Ramp could include coordination activities with the North Dakota Department of Transportation, and regional entities such as the Greater Fargo/Moorhead Economic Development Corporation and the Fargo Moorhead Council of Governments. The study analysis suggests that the Dilworth terminal’s greatest weakness is an imbalance between inbound freight and outbound agricultural traffic. For this reason, it may make sense to involve non-agricultural stakeholders in the process of trying to restore direct rail service to the Dilworth terminal, and investigate potentially large generators of inbound freight. For example, large employers in Red River Valley include Case New Holland (CNH), Bobcat Company, Polaris Industries and Arctic Cat Inc. Equipment and recreational vehicle manufacturers often maintain worldwide supply chains. The inbound container traffic of companies such as these could help to balance outbound agricultural traffic at Dilworth. Other companies that may generate large volumes of inbound containerized freight may locate in the Fargo area. With a better balance of traffic, Dilworth could be a more viable intermodal terminal. Studies of the Dilworth facility to date have not fully considered the volume and balance of freight across state borders, nor have discussions with BNSF taken place on a bi-state level. Across the upper Midwest there are a variety of truck size and weight regulations that greatly influence the productivity of highway freight movements. The regulatory environment commercial motor vehicles (CMV) face is complicated because different truck configurations are allowed for some commodities and differing designated roadways across jurisdictions (national, state and provincial). Harmonizing regulations between Minnesota and other neighboring jurisdictions could have significant impacts on freight efficiency and would foster seamless interoperability between the road networks in the study region.
2. ESTABLISH REGIONAL FREIGHT ADVISORY COMMITTEE Mn/DOT has established guidelines for public involvement, but has not developed practices or guidelines specifically for engaging the private sector in planning activities. To its credit, Mn/DOT formed the first statewide freight advisory committee in 1997. The Minnesota Freight Advisory Committee (MFAC) continues to meet 3-4 times each year, but the group advises primarily on policy and research issues and does not have a role in the project programming process. To facilitate greater participation in state and metropolitan transportation planning, federal legislation encourages States and Metropolitan Planning Organizations (MPOs) to provide opportunities for various interested parties to provide input into the development of transportation plans and programs. For example, the Safe, Accountable, Flexible, Efficient Transportation Equity Act: A Legacy for Users (SAFETEA LU) stipulates that MPOs and States shall provide freight shippers and providers of freight transportation services with reasonable opportunities to comment on transportation plans and programs.
Western Minnesota Regional Freight Study Final Report
56
Experience from other States and MPOs has shown that several common attributes exist for successfully establishing a freight advisory group:
• Identify a champion - someone with the experience, authority and resources; • Have a vision for the group that communicates a sense of purpose; • Establish credible leadership for the group (e.g. high-level leaders in the planning
organization, carrier executives, business leaders, or former politicians); • Create a sense of urgency - identify some critical issues that when resolved will show
tangible results or benefits; • Provide opportunities to exchange information in the process; and • Develop methods for assessing stakeholder's perceived value of the forum early-on, be
flexible and willing to adapt to meet stakeholder preferences.
RECOMMENDATIONS FOR ESTABLISHING A DISTRICT OR REGIONAL FAC Mn/DOT Districts 4 and 8, should spearhead the formation of a Regional Freight Advisory Committee. The purpose of a Regional FAC would be to facilitate strategic information exchange and coordination among regional business leaders and other diverse freight stakeholders regarding freight needs and potential solutions to help build a better transportation system and quality of life in the region. A number of other recommendations resulting from this study may also provide an initial work plan for the group. Differences in cross-border truck size and weight issues, was repeatedly raised by stakeholders that were engaged for this study. The formation of a Regional FAC could provide a platform for actions to address regional differences. Other function of a Regional FAC could include:
• Serve as a forum for discussions about freight movement in the regional and for providing advice to District leadership about freight issues – Some freight stakeholders felt that the FAC should start on an informal basis by serving as a discussion forum to provide MnDOT with input regarding freight issues and to educate the public and private sectors about their respective needs.
• Set criteria for selecting projects –While Mn/DOT has not involved the MFAC in this role to date, several other states and MPO’s involve freight stakeholders in setting criteria for selecting projects. An FAC would not necessarily prioritize projects, but would help determine criteria to consider when evaluating projects.
• Prioritize projects – Currently Minnesota has several non-highway programs for making loans for rail or waterway improvements. Historically, bonded loan programs in the state have been structured on a “first-come, first-served” basis. However, without a prioritization structure these resources are not likely being allocated as efficiently or as effectively as they might be. Starting at a regional level, Mn/DOT could seek guidance from freight stakeholders to identify those projects most important for improving regional freight mobility.
Western Minnesota Regional Freight Study Final Report
57
A district-level FAC could also be closely coordinated with Minnesota’s statewide MFAC, as well as regional MPO planning committees, through cross membership. Many of the stakeholders contacted through the course of the Regional Freight Study were eager to share comments and ideas, and would provide a ready opportunity for an initial contact list. Consideration might also be given to reaching across state borders to involve agencies and businesses from North Dakota and South Dakota. One organization that might facilitate the regional approach is Northern Great Plains, Inc. Located in Fargo, ND Northern Great Plans (NGP), Inc. is a non-for-profit group whose mission is to maximize the potential of rural communities through “identifying and promoting policies and practices that support an integrated approach to economic opportunity, a healthy environment and strong social fabric.”§ Several years ago following the completion of a 5-state regional planning effort, NGP Inc. contemplated the creation of a multistate freight advisory committee.
3. DESIGNATE A TIERED TRUCK NETWORK For the Minnesota Regional Freight Study project, the team developed a three tiered roadway network. The tiered roadway network highlights the roadways that are most important to truck traffic. Combining the existing designated systems together results in a system that was too large to provide any investment guidance. The tiered approach combines truck traffic and roadway design characteristics to identify the roadways essential to the efficient movement of freight. Heavy commercial annual average daily traffic (HCAADT) was used to validate the existence of elevated levels of HCAADT on the existing systems. HCAADT is an estimate of the total number of vehicles with at least two axles and six tires, using a specific segment of roadway on any given day of the year. Heavy commercial vehicles include trucks only. Based on observed statewide data, tiers were classified based on breaks of 650 and 300:
• Tier 1: Roads on the network with HCAADT greater than 650 • Tier 2: Roads on the network with HCAADT between 301 and 650 • Tier 3: Roads on the network with HCAADT less than 300
The three tiers together form the Minnesota designated truck network. For the Minnesota Regional Freight Study project, the team developed a three tiered roadway network. The tiered roadway network highlights the roadways that are most important to truck traffic. The prevailing criteria in developing the tiered truck network was Heavy Commercial Annual Average Daily Traffice (HCAADT), however consideration was also given to factors such as established road design parameters and strategic importance. An effort was also made to incorporate existing Mn/DOT activities with regard to 10-ton route designations. Combining the existing designated systems together results in a system that was too large to provide any investment guidance. The tiered approach combines truck traffic and roadway design characteristics to identify the roadways essential to the efficient movement of freight.
Western Minnesota Regional Freight Study Final Report
58
The tiered highway system for Mn/DOT District 2 is displayed in Figure 28, the tiered network for Mn/DOT District 4 is shown in Figure 29 and the tiered network for District 8 is Figure 30.
Figure 28: Tiered Truck Network for Mn/DOT District 2
Western Minnesota Regional Freight Study Final Report
59
Figure 29: Tiered Truck Network for Mn/DOT District 4
Western Minnesota Regional Freight Study Final Report
60
Figure 30: Tiered Truck Network for Mn/DOT District 8
Western Minnesota Regional Freight Study Final Report
61
Heavy commercial annual average daily traffic (HCAADT) was used to validate the existence of elevated levels of HCAADT on the existing systems. HCAADT is an estimate of the total number of vehicles with at least two axles and six tires, using a specific segment of roadway on any given day of the year. Heavy commercial vehicles include trucks only. Based on observed statewide data, tiers were classified based on breaks of 650 and 300, resulting in the following tiers:
• Tier 1: Roads on the network with HCAADT greater than 650 • Tier 2: Roads on the network with HCAADT between 301 and 650 • Tier 3: Roads on the network with HCAADT less than 300
The three tiers together form the designated truck network, with top two tiers suggesting the highest priorities for future investment. Heavy commercial vehicle characteristics were used to verify appropriate design criteria for each tier and to identify network deficiencies. Multi-lane segments of roadways provide a safe route for a vehicle envelope of 14’ tall, 14’wide and 67’long. Almost all segments of multi-lane roadways are on the Tier 1 network. Roadway shoulders of at least 10’ in width provide a similar safety benefit.
RECOMMENDATIONS FOR A TIERED TRUCK NETWORK Mn/DOT and the Districts may wish to adopt the tiered network metrics as a means to identify, consider and/or integrate commercially advantageous freight-related improvements into the project prioritization process. Projects on the Tier 1 network in particular could be prioritized into their ATP/STIP process as an element of highway investment that directly impacts the competitiveness and access for local businesses that are significant freight generators. Districts should focus on Tier routes due to their higher freight volumes and higher cost effectiveness for identified freight improvements. Tier 2 and 3 routes also may exert some influence in project prioritization to a much lesser degree, with the logical exception of short segments that may be directly influenced by the activities of specific industrial site. A list of freight related evaluation criteria examined in Tech Memo #2 (Program Analysis) is provided below:
• Heavy Commercial Average Daily Traffic for the Tier 1 freight network • Proximity of key freight generators to the Tier 1 freight network • Pavement conditions on key Tier 1 freight routes • Roadways with shoulders less than 10 feet • Two lane rural roadways with daily volumes over 11,200
For the analysis and mapping elements, roadways with shoulders less than 6-feet were analyzed to comply with the Statewide Transportation Policy Plan 2009-2028. However, for Tier 1 roadways, Districts should strive to incorporate shoulder improvements on Tier 1 routes that have shoulders less than 10-feet, which will improve safety and increase efficiency along these routes, as Tier 1 roadways generally provide the greatest benefit to shippers when moving freight.
Western Minnesota Regional Freight Study Final Report
62
As part of the Tiered Truck Network, 10-ton roadways provide important connections between intermodal freight facilities, major freight generators and other key freight destinations throughout the state. These roadways generally include city and county routes that receive state aid funding, as well as trunk highways, interstates and some local roads. Year-round,10-ton roadways also provide a predictable freight roadway network, whereas all other roadways are subject to axle load limitations, including seasonal load restrictions.
4. IDENTIFY COMMERCIAL CORRIDORS FOR PRIORITY INVESTMENT An analysis was conducted to examine the Trunk Highways (TH) in each region to determine their capability to function as commercial truck routes. Designation of such roads could allow for special permitting to increase efficiency and competiveness. The analysis documents the characteristics of TH’s using a number of different factors which are presented in different maps including:
• Access to non-National Network • Roadways with shoulder widths less than six-feet • Two-lane rural roadways with daily volumes over 11,200 • Pavement conditions on Tier 1, 2 and 3 freight networks • Proximity of key freight generators to the Tier 1 freight network • Heavy Commercial Average Daily Traffic for the Tier 1 freight network
The information presented is intended to assist the district in further evaluating potential improvement on the trunk highway system from a freight perspective. This information should be weighted with other information as improvements and priorities are developed through the District plan process.
ROADWAYS WITH SHOULDERS LESS THAN 6 FEET One of the safety issues that has been raised in freight discussions throughout the state is related to shoulder width. Large trucks do not have as much flexibility to pull-off the roadway in emergency situations as easily as smaller vehicles. In addition, wide shoulders provide greater flexibility for oversize loads. Wide shoulders was a highway characteristic most often cited by shippers and haulers as a desired safety improvement, based on stakeholder input during the study process. In discussions with District staff, a six-foot shoulder was identified as a desirable goal. However, every project needs to be evaluated on a case-by-case basis to determine its feasibility. For example, widening shoulders on a route that has extensive bog or peat sections may not be cost effective on lower volume routes. Figures 12, 13 and 14 present the locations along the Minnesota Truck Route Tier System that have shoulders less of than six-feet. Table14 displays information on the total number of miles by Tier that have shoulder widths of less than six-feet for the combined Northern and Western Minnesota regions. The number of Tier 1 routes with shoulders less than six-feet is less than Tier 2, which is subsequently less than Tier
Western Minnesota Regional Freight Study Final Report
63
3 roadways. It is clear that the vast majority of TH’s and U.S. highways, especially the Tier 1 and Tier 2 routes, do currently have shoulder widths greater than six-feet. Table 14: Shoulder Widths Less Than Six-Feet, Northern and Western Minnesota
Total Miles Miles of Shoulders < 6 feet Percent of Miles < 6 feet
Figure 31 shows the Tier 1 system in Western Minnesota and the majority of the network has shoulder widths over six-feet. District 4 has slightly more Tier 1 roads with shoulders less than six-feet than District 8. District 2 has three small sections along U.S. Highway 2 that have shoulders less than six-feet, and District 4 has two sections along U.S. Highway 10 and TH 34 with narrow shoulders. District 8 has a handful of roadway sections that do not have six-foot shoulders, but these segments are limited to TH 23 and U.S. Highway 12/212.
Western Minnesota Regional Freight Study Final Report
64
Figure 31: Shoulder Widths Tier-1 Roadways
Western Minnesota Regional Freight Study Final Report
65
Figure 32 shows Tier 2 roadways with shoulders less than six-feet within this study region. As expected, Tier 2 roadways within District 2, 4 and 8 have more roadways with shoulders less than six-feet than the Tier 1 system. Areas with narrow shoulders for District 2 were highlighted earlier. For District 4, spot locations along U.S. Highway 59 and 12, and segments along TH 28 and TH 78 seem to represent most of the routes with narrow shoulders. In District 8, segments of U.S. Highways 75, 12 and 14, and TH 68 contain most of the route miles with narrow shoulders.
Figure 32: Shoulder Widths Tier 2
Western Minnesota Regional Freight Study Final Report
66
Figure 33 displays shoulders less than six-feet along the Tier 3 system within the Western region. The vast majority Tier 3 roadways throughout each District in Western Minnesota have shoulder widths less than six-feet.
Figure 33: Shoulder Widths Tier 3
Western Minnesota Regional Freight Study Final Report
67
ROADWAYS WITH AADT OVER 11,200 Significant discussion took place during the development of Mn/DOT’s State Plan with respect to safety on high-volume, high-speed, rural two-lane routes. As volumes increase, passing opportunities are limited; slower vehicles can inhibit flow and frustrate drivers. Mn/DOT has established a performance threshold of 11,200 vehicles per day for identifying when potential rural routes could be considered for going from two lanes to four lanes. Table 15 displays the total number of Tier 1 miles in Northern and Western Minnesota as well as the number of miles on rural two-lane roadways with ADT over 11,200. The number of miles listed below would be eligible for the expansion of a two-lane roadway to a four-lane roadway.
Table 15: Two-Lane Roadway Miles with less than 11,200 Vehicles per Day
Total Miles
Two-Lane Rural Roadway Miles with
ADT > 11,200
Percent of Two-Lane Rural Roadway Miles with ADT >
11,200 Tier 1 1,479 3 0.2%
Western Minnesota has few areas that would meet the safety threshold. As presented in Figure 34, District 2 has one segment along Highway 34, near Park Rapids that meets the threshold. District 4 and District 8 have no rural roadways that meet this criterion. Most Tier 1, rural two-lane TH’s within the state provide good safety and mobility. As volume change occurs over time, and as Mn/DOT monitors safety information by segment and intersection, Districts should continue to track key freight routes and their ability to continue to fulfill needs.
Western Minnesota Regional Freight Study Final Report
68
Figure 34: Tier 1 AADT
Western Minnesota Regional Freight Study Final Report
69
RIDE QUALITY INDEX The Ride Quality Index (RQI) is used to measure pavement conditions on the state highway system. The RQI is a Mn/DOT assessment of ride smoothness and is measured on a scale of five to zero with five being the best. As stated in the State Transportation Plan, “The objective is to provide a smooth ride (good condition = rating of three or better) for a large percentage of the state highway system and limit the number of miles that have a rough ride (poor condition = two or less).” Shippers and carriers desire smooth pavements to ensure that goods arrive undamaged. The RQI measure has been shown for the Tier 1 and Tier 2 freight system to identify routes that have good pavement conditions for freight movements versus those that have poor pavement conditions. Sections of roadway that are not highlighted in Figures 35, 36 and 37, delineate “fair” conditions (rating of 2.1 – 2.9). Table 16 presents the number of miles in “good” condition and the number of miles in “poor” condition for the combined Northern and Western Minnesota regions. As documented, the majority of all Tier system roadways have an RQI rating of “good” (three or above), while only a small percentage of roadways are rated “poor.” Table 16: Ride Quality Index Rating for Northern and Western Minnesota Regions
Figure 35 displays the ride quality for the Tier 1 system throughout Minnesota. Overall, the system in Western Minnesota functions very well as the vast majority of roadways have a “good” rating. All Tier 1 roadways in District 2 have a “good” or “fair” rating. A vast majority of Tier 1 roadways in District 4 also have a “good” rating, while a small segment along Interstate 94 has a rating of “fair.” Only two small segments of roadway have a “poor” rating in the entire western region. The “poor” segments are located in District 8 along TH 23 and TH 15 near Hutchinson. Figure 36 displays the Tier 2 system RQI for the study regions. Overall, the vast majority of the Tier 2 system in Western Minnesota has a “good” rating. The bulk of Tier 2 roadways in District 2 also have a RQI rating of “good” or “fair.” A portion of U.S. Highway 75 has a “poor” rating located south of East Grand Forks. Most of the roadways in District 4 and District 8 have a “good” or “fair” rating. Pavement conditions for Tier 3 networks are shown in Figure 37.
Western Minnesota Regional Freight Study Final Report
70
Figure 35: Pavement Condition Tier 1
Western Minnesota Regional Freight Study Final Report
71
Figure 36: Pavement Condition Tier 2
Western Minnesota Regional Freight Study Final Report
72
Figure 37: Pavement Condition Tier 3
Western Minnesota Regional Freight Study Final Report
73
PROXIMITY OF FREIGHT GENERATORS TO TIER 1 CORRIDORS The freight system that has been identified should provide good accessibility to most of the key freight generators. To assess this, the major freight generators, which were defined by Mn/DOT, were identified and 10, 20, and 30 mile buffers were generated from all Tier 1 corridors. Table 17displays the number of major freight generators in the combined regions of Northern and Western Minnesota. As presented in Figure 38 and in the table below, 88 percent of the current freight generators are located within ten miles of a Tier 1 roadway and less that 5 percent (4 generators) are beyond 30 miles from a Tier 1 roadway.
Table 17: Freight Generator Locations along the Tier 1 System
Freight Generators
within 10 Miles of Tier 1
Roadways
Freight Generators within 10-20
Miles of Tier 1 Roadways
Freight Generators within 20-30
Miles of Tier 1 Roadways
Freight Generators
outside 30 Miles of Tier 1
Roadways Tier 1 72 3 3 4
Figure 21 displays the location of major freight generators and their proximity to Tier 1 truck routes for Western Minnesota. A majority of key freight generators in the western study area are located within ten miles of a Tier 1 route, however, some freight generators are located longer distances such as twenty and/or thirty miles of a Tier 1 roadway. Freight generators that are not located within thirty miles of a Tier 1 roadway must use Tier 2 and Tier 3 routes to move freight shipments. Using Tier 2 and 3 roadways can be prohibitive because these routes tend to have shoulders less than six-foot wide and may have an RQI rating of “poor.” District 2 does have some freight generators (3) that are not located within thirty miles of a Tier 1 roadway. These locations are in the northern part of District 2 (in Roseau, Warroad and Baudette, all along TH 11). It is important to note that these freight generators use Tier 2 and Tier 3 routes to move freight shipments. Along this section of TH 11, there are segments of roadway with shoulders less than six-foot wide, but the corridor does have a good RQI rating. Most of the freight generators in District 4 are located within ten miles of a Tier 1 roadway, but one major freight generator in the western portion of District 4 is not located within thirty miles of a Tier 1 roadway (intersection of U.S. Highway 75 and TH 28). In this instance, the freight facility is served by highways with wider shoulders and a good RQI rating. All major freight generators located in District 8 lie within thirty miles of Tier 1 roadway.
Western Minnesota Regional Freight Study Final Report
74
Figure 38: Freight Generator Proximity to Tier 1 Truck Routes
Western Minnesota Regional Freight Study Final Report
75
HEAVY COMMERCIAL TRUCK VOLUMES Truck volumes were calculated along the Tier 1, 2, and 3 systems to determine the number of heavy commercial trucks using the system and to identify where Heavy Commercial Average Daily Traffic appeared to be the highest. Each tier was individually evaluated using a standard deviation classification. Each tier had different volume ranges from which the deviation was calculated. For example, the “Low” category represents truck volumes less than one-half standard deviation from the mean for that tier. The “Medium” category represents truck volumes within one-half standard deviation of the mean, and the “High” category represents truck volumes greater than one-half standard deviation from the mean. Table 18 displays the number of Tier roadways within both study areas (Districts 1, 2, 4 and 8) with the average HCADT for each Tier system. As can be seen in Figure 39, many of the high truck volumes appear around cities, which consequently have major freight generators. Other high HCADT routes include I-94, U.S. Highway 212, TH 210, 9, 19, 27, 29 and 71.
Table 18: Average HCADT along the Tier Freight System
Tier Miles Average HCADT
1 1,479 820 2 1,742 350 3 3,210 180
As shown in Figure 39, areas with high truck volumes in District 2 are centered around cities such as Bemidji, Thief River Falls and Park Rapids. District 4 has high truck volumes near Moorhead, Detroit Lakes, Fergus Falls and Alexandria. In addition, Interstate 94 has high truck volumes within District 4 due to the roadway’s Tier 1 classification and because of its importance as both an interstate and interregional roadway. High truck volumes in District 8 are located near Willmar, Hutchinson and east of Marshall.
Western Minnesota Regional Freight Study Final Report
76
Figure 39: Heavy Commercial Annual Average Daily Traffic (HCAADT)
Western Minnesota Regional Freight Study Final Report
77
RECOMMENDATIONS FOR COMMERCIAL COMMERCE CORRIDORS The mapping exercise for the Tiered Truck Network indicates that most of the key truck routes in Minnesota do have shoulder widths that meet a reasonable level of safety in the case of emergency or other needs. The analysis found that only 11% of proposed Tier 1 Truck Route Highways do not meet a standard of at least a six-foot shoulder width. Given that Tier 1 routes generally have more truck volumes than Tier 2 or Tier 3 routes; any shoulder remedies should be focused on Tier -1 routes with higher truck volumes. A longer term goals should be considered for developing a minimum 10 foot shoulder width on Tier 1 highway, however an analysis should also be conducted regarding the feasibility and benefit-cost of shoulder improvements in relationship to other needs in each District. There are a few generators that are not served well by the Tier 1 network; two Tier 2 routes serve these facilities. Districts may want to consider elevating priorities on key Tier 1 routes that broaden the reach of the freight network to these areas (e.g. Thief River Falls, Roseau, Warroad). Districts may also consider providing improved maintenance of these routes to ensure quality service. Based on limited interviews and the regional freight forums the consultant team took initial steps to outline several key industry supply chains in the region. In addition, as noted the consultant team mapped the trunk highway system by design characteristics and other factors that can assist in deciding what routes might be considered under a commerce corridor designation. As a next step, possibly working through a regional freight advisory committee, MnDOT should map commodity-specific origin to destination routes that could benefit from routinely permitted loads for greater productivity without any liability to the overall highway network condition or any change in wear factors.
5. FREIGHT SAFETY AND INFORMATION STRATEGIES During the study process, freight interests expressed a need for greater use of technology to increase information flow, upgrade roadway safety, and improve the reliability of goods movement. Among the many ideas proposed during stakeholder interviews, freight forums, and Steering Committee meetings a number of technology-related solutions were consistently mentioned and supported by freight operators. These included: an enhanced 511 system for freight information, a parking stall occupancy detection system at rest areas, intersection/entry warning systems, wildlife detection and warning systems, alternate route communication and interagency coordination and truck prioritization at signaled intersections. Provided below are six specific recommendations to address the most significant technology needs identified by the stakeholder input process. Each technology improvement is profiled with an overview of the need, a description of the issue to be addressed, a sketch-level design of each solution, and an implementation strategy.
Western Minnesota Regional Freight Study Final Report
78
511 ENHANCEMENTS Minnesota has offered both the 511 telephone and 511mn.org traveler information services to the public since 2001 as a resource for weather, traffic and weight-restricted road information. The Condition Acquisition and Reporting System (CARS) Pooled Fund Effort provides the data management back-end and client data management tools that drives the 511 services. The CARS was created by Castle Rock Consultants for the pooled fund group. Individual data entry clients are able to add and edit numerous types of information housed in a central location. This system actually pre-dates the 511 services, with work beginning in 1998. The architecture of CARS and the 511 systems allow for additional information inputs as well as the integration of new access methods. Numerous freight operators indicated during the study that an enhanced 511 system could provide better service to commercial vehicle interests. Freight stakeholders have expressed a desire for improved information delivery for the commercial vehicle community. These improvements can be categorized into two categories: Expanded content – more information on weight or bridge height restrictions, road closures, alternate routes and border crossing states. Improved delivery – easier to use web interface and telephone menus, optimized interfaces for mobile devices, access devices (kiosks, etc.) at rest areas and “push” automated e-mail systems to provide notification over e-mail, SMS, Twitter or similar services. Access to these types of information through mechanisms that are well adapted to the mobile environment would provide benefits through better, more efficient and safer route selection. Delivery of the enhanced 511 services will require several subsystem changes. Each of these must be coordinated to allow for proper integration prior to advertising the availability of the freight-specific features. Additional Data Collection: to expand the contact offered by 511, more data will need to be entered into the system. Some commercial-vehicle specific data is already available, but additional bridge height information and geographic (beginning and end points) information on road construction and weight restrictions could be added. Information on local (county, township, and municipal) roads could also be added into the system to allow for decisions on routing. Adding the new information types will require modifications to the CARS database and possibly the user interface on the data entry client application. These changes would require coordination with the other states involved in the CARS pooled fund. The work to complete these changes would be completed under contract with Castle Rock Consultants, who maintain the database and would make any needed programming changes. Appropriate funding is also needed for this contract. More access options: 511 content is currently accessible via cell phone or on the 511mn.org web site. Stakeholders have expressed a desire to access the content via a subscription or “push”
Western Minnesota Regional Freight Study Final Report
79
e-mail. Such an e-mail could be received on a variety of devices enhancing the information’s value. Washington State has implemented a similar system to provide a variety of alerts. The existing Mn/DOT 511 web site is optimized for a desktop (large screen/high resolution) experience. With the proliferation of portable smart-phone type devices, it will be beneficial to create a site that is formatted specifically for these smaller displays. All of these modifications would make use of existing infrastructure and consist largely of expanding data entry roles and alternations to the 511 software packages. Creating an enhanced 511 service will begin with writing a detailed list of requirements describing the alterations and the performance needs from a user standpoint. From these requirements, a specification can be written and a Request For Proposals issued to begin the upgrade procurement process.
REST AREA PARKING AVAILABILITY Long haul, over-the-road (OTR) truck drivers face a number of regulatory and logistical requirements. Among these are finding “wait” destinations for next-day arrivals, maximum on-duty and driving time limits, and multi-day total hour limits. To meet these requirements, truck drivers must carefully plan their rest periods both for timing and location purposes, since appropriate parking facilities may be widely separated. Typically, drivers have several options for parking/resting; ideally a commercial truck stop or safety rest area will have space available. However, based on stakeholder input, increasingly these may be filled to capacity, resulting in a driver going on to find an alternative parking location or parking on Interstate interchange on-ramps, creating an unsafe condition. As noted, commercial vehicle parking was highlighted as an issue during the stakeholder outreach sessions for Northern and Western Minnesota and Northwest Wisconsin. This issue has be recognized by the DOT for several years and has studied it in depth. The State of Minnesota operates 62 Safety Rest Areas (SRA) along Interstate Freeways and some high-volume, non-interstate roads. Figure 40 provides the location of these rest areas that allow truck parking in the four Mn/DOT districts involved in this study. In an earlier study conducted from 1995 to 1998, 15 SRAs were identified as having issues with commercial vehicle parking capacity being exceeded on a frequent basis. These were then studied further to identify parking demand characteristics in a 2001 study by the Minnesota Department of Transportation.
Western Minnesota Regional Freight Study Final Report
80
Figure 40: Safety Rest Areas with Parking
Western Minnesota Regional Freight Study Final Report
81
In some cases average capacity utilization exceeded 100 percent on weekdays, creating several issues:
• Vehicles parked in non-stall areas of parking lots • Vehicles had to “pull though” the SRA. Impairing the efficiency of the vehicle and
creating unnecessary entry/exit traffic. • Vehicles approached the SRA, bypassing other parking options, only to find there was no
parking available. This left the driver with no choice but to press on when they should have stopped, or to park unsafely along the Interstate or TH.
The parking availability shortfall issue is projected to affect more SRAs and to become worse overall in the future. Since continual expansion of available parking is costly and may not be feasible for many SRAs, one approach to addressing the problem is to inform drivers of parking availability in advance of the SRA so that they may make better decisions about where and when to stop. To provide this type of information, a system could be developed for detecting parking stall occupancy and communicating this information to drivers. The method of stall occupancy detection must include several characteristics:
• Easy to install • Maintenance-free (durability) • Accurate • Affordable • Automated
Since the SRAs will not have personnel dedicated to a parking availability system, there should be no requirements for them to maintain or operate it. Further, the detection system should not interfere with the normal parking movements in the SRA’s parking area and should not require any interaction with the vehicle occupant or equipment to be placed on vehicles. Several systems are available to provide detection functions at individual parking stalls. These systems typically use in-pavement mounted devices that are self-powered and communicate wirelessly to host systems. This approach would require a minimum of one sensor device for each of the commercial vehicle parking stalls and one or more host devices to collect the data. Depending on the specific solution formulated, additional system intelligence in the form of host processing computers or other devices may or may not be required. To minimize costs and technical complexity and maximize flexibility for messages, a roadside-mounted Dynamic Message Sign (DMS) system is an effective mechanism. Signs may be conventional matrix-types or hybrid static/dynamic. Hybrid signs would be similar to those used for urban parking garage applications that list a location and a number of spaces available. To meet the notification objective of allowing a driver to make a choice of whether to use a SRA parking facility for rest, a minimum of two DMS will be needed. One placed at a decision point upstream of the SRA and one at the entrance to the SRA. Given the long distances that can separate parking facilities, the entrance DMS is necessary because parking availability may have changed since the driver passes the upstream notification sign.
Western Minnesota Regional Freight Study Final Report
82
A variety of communications mechanisms are available for control of the DMS. Selection should be based on the best fit for the individual RSA and sign. Data may also be communicated to the existing 511 traveler information system for direct distribution As noted, an earlier Mn/DOT study identified fifteen SRAs as having an issue with availability of parking, of these five had an average number of trucks observed that was equal to or greater than the number of spaces available. Excess vehicles that lack proper parking stalls can create safety concerns as they may park in other areas at the SRA. The SRA site(s) selected for such a project should have the following characteristics:
• Existing parking space problem • Other truck parking is available upstream of the SRA • Locations for DMS on Minnesota State Property • Close proximity to the Twin Cities to minimize project administration/evaluation costs
Based on these characteristics, the RSA’s near Alexandria and Moorhead along I-94 appear to be the best candidates for this application; however, there may be other sites prioritized above these. A simple schematic of the proposed system is shown in Figure 41 below.
Figure 41: Proposed Schematic for Rest Area Parking Notification
Providing parking information for RSAs will require the following steps, if funding is allocated:
• Selection of RSAs with the most significant parking issues • Selection of detection technology • System design and data management tool creation • Installation at selected sites • Integration with 511mn.org and 511 telephone service
Western Minnesota Regional Freight Study Final Report
83
INTERSECTION/ENTRY WARNING SYSTEMS Approximately 500 people are killed on Minnesota roads each year. In 2006, one out of every three fatalities occurred at intersections. Of these intersection fatalities, one out of three was located at rural intersections with thru-stop control. Furthermore, the differences between heavy commercial vehicle acceleration performance and that of passenger vehicles may create safety concerns where trucks enter mainline roadways. There are two points of particular concern relating to truck movements as they interact with passenger traffic: Truck movements at rural intersections with thru-stop control. These areas have safety concerns with all types of traffic. However, the large weight differences between passenger vehicles and heavy commercial trucks make such collisions very problematic. Entry of trucks from freight depots or agricultural processing facilities on to rural roadways. In either of these cases, rural locations may be isolated with limited roadway lighting and/or poor visibility. A vehicle entering with unexpectedly slow acceleration may cause an inappropriate or insufficient driver response. These problems are exacerbated during peak freight movement periods, such as harvests. An advance warning mechanism to alert drivers to an entering truck on to alert a truck operator to the presence of a passenger vehicle could mitigate some of these safety issues. A number of approaches are available to create a warning system addressing the issues described above. However, all solutions will include some method of detecting a vehicle’s presence and some mechanism to relay that information to drivers. Mn/DOT has recently completed an evaluation of a prototype Intersection Warning System (IWS) that can be used as a model. The prototype IWS was installed at a “T” intersection, and used two radar sensors on the “mainline” roadway to operate a warning sign that alerted traffic stopped on the leg of the “T”. All components were operated using solar power and wireless communications, making them ideal for rural areas where power may be expensive to install and wiring runs may be difficult due to roadside conditions and distances. Advisory signs may be installed for either the entering or mainline traffic, depending on the specific needs of the site. An example sign is shown at right. The DOT evaluation showed this application to be effective at reducing traffic conflicts in a variety of weather conditions and traffic volumes. Mn/DOT is currently beginning evaluation of several alternatives to the prototype IWS already
Western Minnesota Regional Freight Study Final Report
84
tested. This effort is expected to last two to three years, and will provide data on system reliability, operational characteristics and maintenance requirements. During this evaluation period identification of the highest conflict-rate intersections along freight movement corridors would allow for quick deployment once a preferred system is selected by Mn/DOT. Some specific freight corridor intersections and/or freight entry point locations where this technology may be applicable were identified earlier in the Regional Freight Issues section of this report. Installations would be contained within DOT rights-of-way and may be completed either by DOT staff or under contract with private parties, depending on the nature of the final system. Budget considerations and planning may be undertaken following system selection.
WILDLIFE WARNING Crashes involving wildlife, particularly deer present a safety hazard in addition to the property damage associated with a collision. Nationwide, there are over 100 fatalities and one billion dollars in property damages due to collisions with wildlife. In Minnesota there are over 5,000 crashes per year involving deer. Mn/DOT has spent several years researching this problem and potential solutions. A prototype system for detecting wildlife and alerting drivers has been shown to be effective in reducing the number of crashes. Wildlife collisions were noted by many stakeholders as being a concern for commercial vehicles, particularly along Highways 71, 30 and 212, west of Montevideo. Beyond the damage done to vehicles and potential for injury, collisions with wildlife can also have schedule impacts affecting the efficiency of freight movements. While fencing can be effective in reducing the numbers of deer or other wildlife crossings at a given point, fences typically need to be high (over eight feet) and thus are expensive to install. Wildlife movement will also generally adapt to a barrier by crossing at the end of the fenced area. Given this behavior, the preference is for detection and warning systems similar to what is commonly installed at pedestrian crossings. The basic components of a wildlife warning system are the detectors, warning flashers, communications and power systems. Detection stations are placed between the edge of the pavement and the tree line, with signs spaced along the area of concern in each direction. When an animal crosses the detection perimeter, the signs will flash for an appropriate period of time. This arrangement is shown schematically in Figure 242
Western Minnesota Regional Freight Study Final Report
85
Figure 42: Schematic of Wildlife Warning System
Since this is a system that requires periodic inspection and maintenance, support from the Mn/DOT District will be a key factor in ensuring its success. Site selection is also an important part of implementation. High concentrations of wildlife movement are needed to make a detection system cost effective, as the total system cost will scale with the number of feet of roadway to be covered. A short list of the steps involved with deploying such a system is provided below.
• Identify sites. • Engage District personnel in planning for operations and maintenance of the system. • Select sites with highest number of crashes/animal crossings. • Contract for installation of the system • Monitor area for crash reports/number of deer or other animal carcasses to assess system
effectiveness
ALTERNATE ROUTING PLAN The “safe and efficient movement of people and goods” is a common theme or mission statement for many transportation agencies. As a result of this goal, various state DOTs and other communities have used and implemented alternate routes to enhance their transportation system. There are two primary reasons for using alternate routes: 1) economic impacts associated with the movement of people and goods from origin to destination with minimal delay, and 2) by keeping traffic moving it reduces queuing and minimizes the risk of secondary crashes.
Western Minnesota Regional Freight Study Final Report
86
With the introduction of “just in time deliveries” and the economic impacts associated with shipping freight, many DOTs have become very proactive in using alternate routes during traffic incidents. Roadway delay also affects many other professions in terms of lost productivity as well as travelers who are on vacation and do not want to be caught up in needless traffic delays. In addition to the economic impacts, safety is the other primary reason that alternate routes have been implemented. Safety is a crucial element for the first responders who rush to the scene of a traffic incident and risk their own personal safety while trying to assist or rescue someone who has been involved in a crash. This is also a major concern for the freight operators and the traveling public as well, since when traffic backs up as a result of a crash, “secondary crashes” account for roughly 20 to 30 percent of all crashes that occur. Alternate route planning is one mitigation measure that addresses these safety needs. In the 2004 ITS Scoping Study and Implementation Plan, alternate route planning was specifically identified as a regional need in Mn/DOT District 4. Successful use of an alternate route relies on a highly integrated approach involving a number of entities, communication networks and traveler information media. Cooperation, coordination, and communication are three of the most essential elements associated with the implementation of an alternate route. The three C’s as they have typically been referred to as, all relate to the ability for multiple agencies to work together on the implementation of an alternate route. When an incident occurs, many activities must occur to divert traffic off the highway and onto a assigned adjacent roadways nearby. Law enforcement (State Patrol and the county sheriff’s department) are often at the forefront of activities during an alternate routing event. These agencies must coordinate amongst themselves as well as with the state DOT maintenance staff, county highway departments, local public works agencies and local law enforcement agencies that are affected. Fire departments are often involved due to life safety issues, fire hazards, hazardous material situations, and other relevant duties. Emergency medical technician, ambulance providers and other medical professionals also need to be aware of how traffic is coming in and out of the incident area so that they can get to the scene as quickly as possible. In addition to all of these people, towing and recovery professionals must be involved to clear the scene and remove vehicles and other debris that was involved in the incident. A comprehensive communications plan and protocol should be developed as part of a regional alternate route plan. This would ensure that information is clearly communicated in a standard format to all affected entities. There are a number of communication devices that the DOT and others have at their disposal to assist in communicating to the public that an alternate route has been activated.
Western Minnesota Regional Freight Study Final Report
87
DYNAMIC/CHANGEABLE MESSAGE SIGNS (DMS/CMS) Changeable message signs are one of the most commonly deployed communication devices. In rural areas, the use of Portable Changeable Message Signs (PCMS) are placed leading up to the “incident area” to inform the motorist that they are coming upon a road closure or that they should expect delays. They also can be used to inform them of the alternate route and where to exit the interstate or freeway. The flow of information to motorists, both passenger vehicles and large trucks, is critical to the overall operation of the transportation network and the movement of people and goods. District ITS scoping studies have identified several specific needs for message signs, and in some cases (near the Fargo/Moorhead area, for example) these have already been deployed. The existing needs should be re-assessed with a specific eye to providing information relevant to freight movement needs as part of comprehensive alternate route planning. Once motorists are directed off of the interstate or freight corridor segment, alternate route signing can be used to get them back on the highway. “Trailblazing” signage as this is often called, provides useful direction to motorists when coming upon intersections, but it also can reduce the amount of staffing necessary to direct traffic. This generally, low-cost improvement is very worthwhile when an incident occurs and traffic needs to be redirected.
511 The existing 511 telephone information system may also be used to communicate roadway information and the use of alternate routes. Similar information can also be posted on the DOT website for live traffic information and can be constantly updated as conditions change. There are a number of steps that go into developing an alternate route guide. The first is to identify the stakeholders who need to be involved. Oftentimes it is many of the agencies and organizations mentioned in this section. The next step is to identify the potential roadways that could be used as an alternate route. Field verification and data collection along these potential routes is advised to ensure that there are not any issues (bridge restrictions; height, width, and weight restrictions; etc.) that would eliminate the roadway from being used as an alternate route. Once the roadways have been identified, an alternate route guide can be developed to identify the specific actions and notifications that need to be made for implementation and activation. In addition to developing a guide, the alternate routes will be permanently signed to reduce the staffing required to direct traffic during use. Various other traffic incident management strategies can be integrated into these measures to assist in the implementation of an alternate route such as ramp gates and barricades, service patrol vehicles, and various ITS components (cameras, ramp meters, etc.).
Western Minnesota Regional Freight Study Final Report
88
TRUCK PRIORITY AT SIGNALIZED INTERSECTIONS One of the challenges for truck operations and reliability on non-Interstate roadways is the interaction with intersection signals, both at high-speed intersections and in the small urban areas along major freight corridors. In addition to providing advanced warning of an impending red light, it is also possible to provide heavy commercial vehicles with priority at these intersections. Priority would extend mainline green times when a large vehicle is approaching, diminishing the likelihood of requiring a stop. Several user groups expressed a desire for an advance warning system for signals along the major freight corridors. Advanced warning activates a beacon on the approach to an intersection prior to a light changing from green to red. This is useful to truck operators for several reasons: it improves safety since more reaction time is provided for the driver, it allows the truck to stop without resorting to engine braking (which is illegal in some jurisdictions), and trucks are able to use lower braking force, extending the life of brake components. While installing an advance warning system is relatively straightforward, it does not address the need to minimize the number of stops that a truck may have to make along its route. Stops increase fuel use, vehicle wear, delay for other motorists, and cause timetables to be less predictable. A true commercial vehicle priority system would identify vehicles above a certain size, and adjust the green or red signal durations to minimize the probability that the vehicle would have to stop at the intersection. This provides not only safety benefits, since there will be fewer stops by the vehicle and fewer conflicting movements through the intersection, but also operational benefits to both traffic managers (decreased total delay) and vehicle operators. Mn/DOT recognized this issue in 2001 and studied the problem in depth to assess the effectiveness and cost/benefit ratio of a tuck priority system. Depending on the timing plans used, substantial reduction in total time through the intersection can be achieved for both the trucks and passenger vehicles. Deployment of a priority system should focus on corridors where there are a large number of signals that have high truck volumes. Since each signal will contribute a small advantage, larger numbers provide a greater cumulative effect and will deliver the greatest benefits to truck operators. Highway 59 between Fergus Falls and the Canadian border and Highway 2 between Duluth and Grand Forks are examples of such routes with 7 and 23 signals, respectively. Two basic methods are used to detect the presence of a truck as it approaches an intersection: a standard inductive loop or a non-intrusive detector. Depending on the specifics of a given intersection either may be the most cost-effective approach. The inductive loop solution requires a pair of loops positioned upstream of the signal. Depending on the approach speed, this distance may be up to 1,000 feet or more. The two loops are spaced so as to activate simultaneously when a truck is present. The intersection signal controller will then adjust the timing of the light to allow longer green time, thus providing a greater chance for the truck to pass through without stopping.
Western Minnesota Regional Freight Study Final Report
89
Non-intrusive systems substitute a self-contained detector (usually microwave-based) in place of the loops with an appropriate power supply and a wireless communications link. Although the non-intrusive system is more complex, it may be easier to install and less expensive in certain locations. A concept diagram of the two options is shown in Figure 43
Figure 43: Schematic of Truck Priority Signalization
Deployment of truck priority signal systems should be approached on a corridor basis, which will involve the assessment of current signal hardware in multiple jurisdictions. All modern intersection signal controllers support a priority function, but there may be cases where older systems are still in use. Selection of a target corridor may be done on a cost-benefit basis, since the capital required on a per-intersection basis can easily be estimated and savings in time can also be calculated. Each potential route can then be assessed and the best candidates selected. The process for implementation can then proceed like any other signal upgrade and will not require any major new infrastructure or maintenance skill sets.
RECOMMENDATIONS FOR FREIGHT SAFETY AND INFORMATION STRATEGIES Six ITS strategies were explored in the program analysis effort. The possible implementation actions for these strategies are outlined below, and may provide the basis for an initial work plan if one or more the Districts in the Western Region decides to create a freight advisory committee:
• Expand 511: Expand content to include more information on weight or bridge height restrictions, road closures, alternate routes and border crossings. Mn/DOT can also improve delivery by making it easier to use web interface and telephone menus, optimize interfaces for mobile devices, install access devices (kiosks, etc.) at rest areas and
Western Minnesota Regional Freight Study Final Report
90
implement a “push” automated e-mail system to provide notification over e-mail, SMS, Twitter or similar services.
• Advanced parking stall availability at rest areas: Select safety rest areas that have the
most significant parking issues and determine an appropriate level of detection technology. Design systems and create data management tools that can be integrated with 511.mngorg and 511 telephone services.
• Truck priority at signal lights: Focus deployment of a truck priority signal system on
corridors where there are a large number of signals that have high truck volumes. Since each signal will contribute a small advantage, larger numbers provide a greater cumulative effect and will deliver the greatest benefits to truck operators. Highway 59 between Fergus Falls and the Canadian border and Highway 2 between Duluth and Grand Forks are examples of such routes, with 7 and 23 signals, respectively. Deployment of truck priority signal systems should be approached on a corridor basis and the actual selection of a target corridor may be done using a cost-benefit analysis, since the capital required on a per-intersection basis can easily be estimated.
• Wildlife collision avoidance: Select sites with the highest number of crashes/animal
crossings. Engage District personnel in planning for operations and maintenance of the system. Monitor areas for crash reports/number of deer and other animal carcasses to assess system effectiveness.
• Alternate route planning: Identify corridors that would benefit from this program (e.g.,
corridors with high crash rates, interrupted performance due to weather events, affects of seasonal event traffic, etc.). Successful use of an alternate route relies on a highly integrated approach involving a number of entities, communication networks and traveler information media. Cooperation, coordination, and communication are three of the most essential elements associated with the implementation of an alternate route program. A comprehensive communications plan and protocol should be developed as part of a regional alternate route plan. This would ensure that information is clearly communicated in a standard format to all affected entities.
• Advanced warning signalization for intersections and truck entry areas: Identify
rural intersections that have low lighting and/or poor visibility, which may be exacerbated during peak freight movements such as harvest season. Advisory signs may be installed for either the entering or mainline traffic, depending on the specific needs of the site. Installations would be contained within DOT rights-of-way and may be completed either by DOT staff or under contract with private parties, depending on the nature of the final system.
Western Minnesota Regional Freight Study Final Report
91
6. SUPER HAUL TRUCK CORRIDORS Mn/DOT provides permitting of over-sized, over-weight loads on Trunk Highways throughout the state. In 2008, Mn/DOT’s permit office issued over 121,500 permits, compared to 95,400 in 2007. As an example, significant movement of wind turbine equipment (both blades and tower sections) are moved frequently, many from the Duluth ports. Mn/DOT’s commercial vehicle section processes these permits (i.e., finds the most appropriate route based on the size and weight of the load). Providing some ability to move these oversized and over-weight loads north-south and east-west through the state and connect to the Duluth ports encourages continued economic activity at the port, as well as provides ability for manufactures and/or businesses within the state to ship large equipment. The purpose of identifying Super Corridor Routes is to acknowledge that certain routes are currently being used to move oversized and over-weight loads from the Duluth port to other areas of the state, and when designing improvements for these routes, engineers should propose solutions that do not interfere with its Super Corridor function. When permitting oversized and over-weight loads there are four main parameters that must be addressed. These are:
• Weight • Width • Length • Height
When permits deal with any two of these parameters it is relatively easy to accommodate or find routes for the movement of the load. When permits deal with three or more of these parameters the number of routes that can accommodate the move is more restricted. The two most restrictive elements are weight and height. These are typically limited by bridges. As part of developing Super Corridor routes, Mn/DOT identified key characteristics for these routes. Superload Corridors shown on Figure 44 can accommodate a loaded vehicle with a 14-foot height limit, a 10-foot width limit, a 110-foot length limit and an 80,000 pound weight limit. These corridors in combination with portions of the Expanded Envelope Corridors cover about 80 percent of all over-size load movements in Minnesota. Expanded Envelope Corridors are routes that can accommodate much larger loads than the Super Corridors. These routes can be permitted for a loaded vehicle that is 16-feet high, 16-feet wide and 130-feet long with a weight of 235,000 pounds. Special Considerations are sections of corridors that may have constraints or special considerations for transporting over-size loads such as requiring the use of an escort. Other constraints may include roads that have narrow shoulders or low bridges, which require the use of some local routes, and/or curvatures that may require special moving considerations. In addition, whenever possible, no roundabouts should be constructed along the identified Expanded Envelope routes, and counties/cities should provide adequate notice of at least two weeks before a road closes along portions of the routes. These recommendations will help
Western Minnesota Regional Freight Study Final Report
92
improve efficiency along the Super Corridor Routes and will provide shippers/truckers a reliable route to use when hauling over-size loads. As noted, one of the more difficult permitting issues to address is height. Mn/DOT currently designs bridges for 16’ 4”. It also requires that a safety margin of six inches on all moves to account for maintenance overlays and sag verticals. As a result, to move a load that is 16’ high the permit office requires all vertical clearances to be at least 16’ 6”. This policy means that all new bridges that are being built fail to meet this requirement. It is important to note that most height permits are less than 16 feet and in fact, almost all Trunk Highways can accommodate moves for heights up to 15’ 4. For example, a load that is 15’4” only has to avoid one bridge structure travelling on I-35 from Duluth to Iowa. A load that is 15’6” has to avoid eight low clearance bridges, whereas a load that is 15’8” has to avid twenty-two structures (as identified on the current Super Corridor route system). The Super Corridor route map is reflective of routes that that can support a variety of over-size loads. When planning improvements and/or changes along these routes, District staff should try and preserve the ability to accommodate these characteristics and/or improve upon them if feasible.
Western Minnesota Regional Freight Study Final Report
93
Figure 44: Proposed Super-Haul Corridors in Minnesota
Western Minnesota Regional Freight Study Final Report
94
RECOMMENDATIONS FOR SUPER-HAUL TRUCK PERMIT CORRIDORS In addition to designating commercial commodity corridors for improved regular truck operations, Mn/DOT Districts 1 and 2 may also wish to consider designating “super haul” corridors that would be developed to handle an increasing number of over-dimension and overweight loads. As an example, the high-clearance route in the region is provided below. The following recommendations are for development of a designated over-dimension network, based on this example.
• As a starting point Mn/DOT may wish to publish web-based maps for specialized carriers who routinely transport over-size loads, to increase efficiency and improve route planning when moving super-haul loads. The route information mapped by this study can serve as a starting point for this purpose, as carriers could better plan movements by understanding “Super Corridors” based on routinely used routes for permitted loads. Freight shippers can also use the map to effectively plan out a route that allows them to best transport over-size loads to a specified destination. The Superload Corridors and Expanded Envelope Corridors allow large freight shipments to be transported north-south and east-west to/from the Duluth-Superior ports, as well as throughout Minnesota.
• Another step in support of the “Super Haul Corridor” concept would be the creation of a scheduling procedure for road closures along the Super Corridor routes and create a policy to limit roundabouts on these corridors. For example, roundabouts could be prohibited on Superload or Expanded Envelope Corridors, and counties/cities could provide Mn/DOT Office of Freight at least two weeks notice if a roadway along the corridor will be closed. This will help improve over-size freight movements along these routes by effectively rerouting these loads around a closure. In addition, when planning future improvements along Super Corridors, District staff should make every effort to try and preserve the ability to accommodate characteristics associated with each route and/or improve upon them, if feasible.
BACKGROUND: GENERAL NETWORK LIMITATIONS The highway networks in Western Minnesota are comprised of federal, state, county, city, or township roadways that are designated differently according to their intended purpose, and are governed differently regarding truck size and weight.
Federal Truck Size and Weight Limits At the federal level Congress and the Federal Highway Administration (FHWA) have defined a primary network from a policy standpoint for encouraging interstate commerce and heavy truck travel. The National Network of Highways includes: (1) the Interstate Highway System and (2) other highways designated by the states in response to the Surface Transportation Assistance Act
Western Minnesota Regional Freight Study Final Report
95
(STAA) of 1982. The National Network, sometimes referred to as the national truck network consists of highways submitted to FHWA as being capable of safely handling larger commercial motor vehicles. The criteria provided to states for guidance in designating NN routes is found in Chapter 23 of the Code of Federal Regulations (CRF), Section 658.9:
(1) The route is a geometrically typical component of the Federal-Aid Primary System, serving to link principal cities and densely developed portions of the States. (2) The route is a high volume route utilized extensively by large vehicles for interstate commerce. (3) The route does not have any restrictions precluding use by conventional combination vehicles. (4) The route has adequate geometrics to support safe operations, considering sight distance, severity and length of grades, pavement width, horizontal curvature, shoulder width, bridge clearances and load limits, traffic volumes and vehicle mix, and intersection geometry. (5) The route consists of lanes designed to be a width of 12 feet or more or is otherwise consistent with highway safety. (6) The route does not have any unusual characteristics causing current or anticipated safety problems. (c) For those States where State law provides that STAA authorized vehicles may use all or most of the Federal-Aid Primary system, the National Network is no more restrictive than such law. The appendix contains a narrative summary of the National Network in those States.
In Minnesota, 4,904 miles of roadway are part of the National Network, which is further supplemented by Minnesota’s Twin Trailer Network, a system of other trunk and local highways on which tractor, semitrailer-trailer combinations may also operate. Table 19 displays the size regulations that apply to National Network Highways. It is important to note that while federal law imposes a gross vehicle weight limit on Interstate Highways of 80,000 pounds, the federal weight limitation does not extend to other highway elements of the National Network. However, many states, including Minnesota, have adopted the federal bridge formula to govern gross vehicle weight on non-interstate highways.
Western Minnesota Regional Freight Study Final Report
96
Table 19: National Network Commercial Vehicle Size Standards
Dimension Regulatory Standard
Overall vehicle length
No federal length limit is imposed on most truck tractor-semitrailers operation on the National Network. Exception: On the National Network, combination vehicles (truck tractor plus semitrailer or trailer) designed and used specifically to carry automobiles or boats in specially designed racks may not exceed a maximum overall vehicle length of 65 feet, or 75 feet, depending on the type of connection between the tractor and trailer.
Trailer length
Federal law provides that no state may impose a length limitation of less than 48 feet (or longer if provided for by grandfather rights) on a semitrailer operating in any truck tractor-semitrailer combination on the National Network. (Note: A state may permit longer trailers to operate on its National Network highways.) Similarly, federal law provides that no state may impose a length limitation of less than 28 feet on a semitrailer or trailer operating in a truck tractor-semitrailer-trailer (twin-trailer) combination on the National Network.
Vehicle width
On the National Network, no state may impose a width limitation of more or less than 102 inches. Safety devices (e.g., mirrors, handholds) necessary for the safe and efficient operation of motor vehicles may not be included in the calculation of width.
Vehicle height
No federal vehicle height limit is imposed. State standards range from 13.6 feet to 14.6 feet.
The total National Network system is about 200,000 miles. The segments of the National Network in Western Minnesota area shown in Table 20
Western Minnesota Regional Freight Study Final Report
97
Table 20: National Network Segments in Western MN Route From To District
US 59 CH 11 E. of Moorhead I–694 Arden Hills. 2 US 59 I–90 US 2 Crookston. 2 US 61 MN 175 Hallock Canadian Border. 2 US 75 ND State Line US 59/MN 32 Thief River Falls. 2 US 75 MN 32 Greenbush MN 72 Baudette. 2 US 169 US 59/MN 1 Thief River Falls MN 11 Greenbush. 2 US 212 US 71 Park Rapids MN 371 Walker. 2 MN 1 US 75 Hallock US 59. 2 US 12 US 59 Holloway I–94 Minneapolis. 4 US 59 MN 7 Appleton US 12 Holloway. 4 US 59 I–94 N. Int. Fergus Falls MN 175 Lake Bronson. 4 MN 7 US 75 near Odessa MN 100 St. Louis Park. 4 MN 9 US 12 Benson US 59 Morris. 4 MN 27 MN 29 Alexandria MN 127 Osakis. 4 MN 28 SD State Line Browns Valley I–94/US 71 Sauk Centre. 4 MN 29 I–94 Alexandria MN 27 Alexandria. 4 MN 55 MN 28 Glenwood 7th St. N., W. Int. Minneapolis. 4 MN 210 ND State Line Breckenridge US 59 W. Int. Fergus Falls. 4 US 14 US 75 Lake Benton US 52 Rochester. 8 US 59 I–90 Worthington MN 30 S. Int. Slayton. 8 US 212 SD State Line MN 62 Edina. 8 MN 19 US 59 Marshall MN 22 Gaylord. 8 MN 22 US 212 Glencoe US 12 Litchfield. 8 MN 23 US 75 Pipestone I–35 near Hinckley. 8 MN 30 US 75 Pipestone US 59 S. Int. Slayton. 8 MN 68 US 75 Canby MN 19 Marshall. 8
State Truck Size and Weight Limits One of the key issues that businesses brought forward during the study was the lack consistency between truck size and weight regulations in states/provinces that border Minnesota. Minnesota, North Dakota and South Dakota have fairly divergent truck size and weight regulatory schemes. Table 21A presents a summary of the truck size and weight regulations for regular operations in Minnesota, North Dakota, South Dakota and other surrounding jurisdictions. Table 21B presents commercial vehicle oversize / overweight permitting information for the same jurisdictions.
Western Minnesota Regional Freight Study Final Report
98
Table 21A: Regional Regulations for Truck Size and Weight – Regular Operations
Northern Minnesota & Northwestern Wisconsin Regional Freight Study 99
Table 21B: Regional Regulations for Truck Size and Weight – Permit Operations
Truck Policy and Global Competitiveness The regulatory differences between Minnesota and North Dakota, and Minnesota and South Dakota often put businesses operating near the border at a competitive disadvantage with similar businesses located just across the border. Agriculture provides a prominent example of how truck size and weight is becoming a more competitive issue. In Minnesota between 1965 and 1995 railroads abandoned nearly 5,000 miles of track, reducing the overall rail network in Minnesota by more than 40 percent.xvii During the same time period the productivity of Class 1 railroad operating assets increased by more than 50%, as line-haul trains became longer and hopper cars used for grain transport increased in capacity from 236,000 pounds to 286,000 pounds. The productivity gains from rail network rationalization are more difficult to quantify, but have come at an expense to the users of rail services who must now transport goods further to loading points, and highway agencies that bear the costs associated with increased truck volumes. Global competition in agriculture continues to grow as the U.S. enters into an increasing number of free trade agreements:
Agricultural trade throughout the world is changing. Keeping up with fluctuations in markets, new and amended regulations, and issues that affect trade is challenging.
Western Minnesota Regional Freight Study Final Report
100
Technology and fewer trade restrictions have opened international markets for both buyers and sellers.xviii
For Minnesota farmers and ag-producers to compete, they must have competitive transportation options. To help local industries remain competitive in the face of global competitors, more than half of the states in the U.S. also allow some commercial vehicle operations on state roads to exceed federal gross vehicle weight (GVW)or axle load limits. As was shown in Table 21A and 21B, both North Dakota and South Dakota allow substantially higer gross vehicle weights on their state road systems. In addition, seventeen states and all provinces in Canada allow the operation of longer combination vehicles (LCVs). Many national and regional studies, including a study funded by the Minnesota Department of Transportation in 2006, have concluded that increased commercial vehicle productivity can be achieved while reducing infrastructure impacts, and maintaining high safety standards. These studies are summarized in the final section of this report, however among the key finds of the Mn/DOT Truck Size and Weight (TS&W) Project:
• The complexity of TS&W laws results in added cost to industry and complicates compliance. TS&W laws need to be simplified and industry training provided.
• Lack of consistency among states creates barriers to cross-border freight movement. • There needs to be increased flexibility of weight limits and vehicle configurations to
allow greater payloads.xix
Opportunities for Greater Truck Size and Weight Uniformity State and provincial regulations are continually changing. By identifying and working toward a harmonized set of truck size and weight regulations and a uniform permitting system the Upper Midwest’s economic competitiveness can be improved. There are several opportunities identified through this research where the state could investigate the potential for modifying size and weight restrictions on freight intensive highways; especially those that are in close proximity to large freight generating clusters participating in significant cross border trade. An ever-increasing volume of intra-state and intra-provincial regional trade creates a sense of urgency for states and provinces to begin a dialog that will result in a more efficient and economically competitive truck transportation system through truck size and weight harmonization. Inefficiencies exist because of the differences between state and provincial permitting processes. For the region to become more competitive, policy makers and transportation departments in the region should work together to provide a uniform permitting system. Seek reciprocity on similar size and weight operations across borders: Currently Wisconsin and Michigan deal with differences in length and weight regulations for commercial vehicles operating near the Wisconsin/Michigan border through a form of reciprocity. The following is taken from Wisconsin Statutes Section 348.27(9):
Western Minnesota Regional Freight Study Final Report
101
Transportation of loads near the Michigan-Wisconsin state line - 348.27 (9). (a) The department may issue annual or consecutive month permits for the transportation on a vehicle or combination of vehicles of loads exceeding statutory length or weight limitations over any class of highway for a distance not to exceed 11 miles from the Michigan-Wisconsin state line, except that a vehicle or combination of vehicles transporting exclusively peeled or unpeeled forest products cut crosswise, wood chips, or forestry biomass may operate under such a permit anywhere upon USH 2 in Iron County or Ashland County or upon USH 2 in Bayfield County from the Ashland County line through Hart Lake Road if the vehicle or combination of vehicles is traveling between this state and Michigan and does not violate length or weight limitations established, as of April 28, 2004, under Michigan law. If the roads desired to be used by the applicants involve streets or highways other than those within the state trunk highway system, the application shall be accompanied by a written statement of route approval by the officer in charge of maintenance of the other highway. (b) For a vehicle or combination of vehicles the weight of which exceeds any of the provisions of s. 348.15 (3), the fee for an annual permit under this subsection shall be one of the following:
1. If the gross weight is 90,000 pounds or less, $100. 2. If the gross weight is more than 90,000 pounds but not more than 100,000 pounds, $175. 3. If the gross weight is greater than 100,000 pounds, $175 plus $50 for each 10,000-pound increment or fraction thereof by which the gross weight exceeds 100,000 pounds.
(c) The fee for a consecutive month permit under this subsection for a vehicle or combination of vehicles the weight of which exceeds any of the provisions of s. 348.15 (3) shall be determined in the manner provided in s. 348.25 (8) (bm), except that the applicable fee for an annual permit under par. (b) shall be used in the computation.
Given the similarity in the regulations between Minnesota and North Dakota on higher-level roadways, a first step towards uniformity may be to seek areas of common ground and statutorily seek reciprocity in operating limitations. Maine and New Hampshire are another example of states that accept minor differences in size and weight limitations when operating across borders. Seek Opportunities to Use Non-National Network Highway for Larger Vehicle Envelopes: The maps in Figures 45, 46, and 47 display Minnesota Trunk Highways leading up to the state’s borders that are not designated as elements of the National Network. The National Network imposes federal restrictions on truck size, but does not impose federal weight restrictions off the interstate. Non-National Network segments provide opportunities for more efficient trucking configurations for businesses located near borders, where changes to state laws could create greater cross-border uniformity. Minnesota and North Dakota and other surrounding jurisdictions could focus future planning efforts on evaluating non-National Network border crossings and the potential to modify size and weight regulations on these routes; especially those that are in close proximity to large clusters of freight generators.
Western Minnesota Regional Freight Study Final Report
102
Figure 45: MnDOT District 2 Non-National Network Route Segments
Western Minnesota Regional Freight Study Final Report
103
Figure 46: MnDOT District 4 Non-National Network Route Segments
Western Minnesota Regional Freight Study Final Report
104
Figure 47: MnDOT District 8 Non National Network Routes Segments
Western Minnesota Regional Freight Study Final Report
105
RECOMMENDATIONS TO IMPROVE REGIONAL TRUCK SIZE & WEIGHT UNIFORMITY
• Seek truck size and weight harmony on the routes with the most flexibility: Minnesota, may wish to work with North Dakota and South Dakota to determine the continuity of non-NN highway segments across state boundaries. Where non-NN routes from a bordering state connects to a NN route in Minnesota, Minnesota could petition to remove the NN designation within its border. The advantage to removing a NN designation would be to allow wider or longer combinations that what is allowed on the NN. The so-called “ISTEA Freeze” which limited the overall length of twin-trailer combinations to what existed in a state as of June 1, 1991, does not apply to non-NN routes. As a result, if allowed to operate longer combinations carriers can increase their gross weight without violating state or federal bridge laws.
• Consider Size and Weight Reciprocity Agreements with Neighboring States: On
state routes where Mn/DOT has the flexibility to examine more productive trucking options, MnDOT could examine legislation to create reciprocity across state lines for certain commodity exemptions or variations in truck size and weight laws were producers in a neighboring state enjoy more productivity through a more advantageous regulation. As an example in 2008 the Minnesota Legislature passed a bill that will allow trucks legal in North Dakota to access a proposed canola processing plant operating double trailer vehicle configurations with a gross weight of 105,500 lbs. The vehicles are limited to specific routes (off the NN), comply with the state bridge formula and operate under permit. Seeking general reciprocity for similar operations along state borders could reduce the number of legislative requests for special exemptions.
• Join a regional permitting compact: Another form of truck size and weight reciprocity has become a common practice in some parts of the U.S. More than one-half of all states in the U.S. belong to multi-state permitting compacts. Under a multi-state compact, carriers can receive extra-dimension and/or overweight operating permits, provided the requested permit operation falls within a regional permit “vehicle envelop.” The vehicle envelop defines the limits of overweight or over-dimension operations all states in the Regional Permit Compact are willing to allow. Currently no regional permit compact exists in the Midwestern U.S. North Dakota currently participates in the regional compact developed by the Western Association of State Highway and Transportation Officials (WASHTO). Some of the limits established by the WASHTO vehicle envelop for extra-legal operations includes:
o Weight
o 600 pounds per inch of tire width. o 21,500 pounds per axle. o 43,000 pounds per tandem axle. o 53,000 pounds per tridem (wheelbase more than 8 feet and less than 13 feet). o 160,000 pounds gross weight.
o Length:
Western Minnesota Regional Freight Study Final Report
106
o 110 feet overall. The Agreement does not authorize permits for a semi-trailer longer than 53 feet to carry more than one item, or for any unladen semi-trailer longer than 53 feet used in a truck-tractor and semi-trailer combination.
o Movement of unladen vehicles must comply with the limitations of the jurisdiction being
o traveled through (i.e. loading jeep and/or booster onto trailer when semi-trailer exceeds 62 feet in Oregon).
o Width: 14 feet o Height: 14 feet
In the past North Dakota has encouraged Minnesota to also enter such a compact. This would help create a routine permitting procedure to expedite freight movements from Minnesota to as far was the West Coast. During the study process, some carriers and shippers expressed interest in creating a uniform permitting procedure throughout the Upper Midwest states (MN, WI, ND, SD, IA) to maximize efficiency, and minimize paperwork and delays caused by the permitting process.
8. UNDERTAKE A NUMBER OF QUICK START PROJECTS (LESS THAN $50,000):
BACKGROUND Other state DOT’s and MPO’s that have worked to engage the private sector in their planning efforts have suggested that "quick start" type projects, can be invaluable to gaining and holding the interest and input of private sector carriers and shippers. Information about this regional freight study was broadly disseminated to the business community in Western MN via freight forum invitations and a Mn/DOT website. In addition, businesses were contacted and many took time out of their busy schedules to participate in the interview process. One of the difficulties that have been identified in getting the private sector to participate in public planning processes is the significant difference in planning horizons between the public and private sectors. Most businesses consider long term planning horizons to be 2-5 years. Most public sector transportation agencies consider long term planning to be 20-50 years. As a result, a common complaint of private sector entities invited to provide input to public processes, is: “We took the time to provide information, but never see any results.” During the public outreach efforts for this project a number of issues were raised that could be addressed through relatively inexpensive means and can be done in a relatively short period of time. These types of projects are sometimes referred to as “Quick Start Projects.” Completing a number of Quick Start projects in direct response to the input provided by the private sector for this project can help keep regional businesses involved in similar efforts in the future and provide tangible evidence of responsive government.
RECOMMENDATIONS FOR QUICK START PROJECTS The following are provided as examples of Quick Start Projects that could be addressed by Districts in the Western Study Region:
Western Minnesota Regional Freight Study Final Report
107
• Develop a regional marketing campaign aimed at businesses and carriers to inform them about agency resources. Many comments were received regarding web resources for presenting permitting, construction, and other route or regulatory information. Minnesota provides statewide information about road posting, permitting and construction. However, sometimes the information is presented on an agencies “home” website, and in other cases data may be presented on district websites. An effort could be undertaken to identify the most requested information from private sector stakeholders and seek ways to consolidate pertinent in formation in a single location, or provide links. This web site should then be advertized and links to it distributed to chambers of commerce and other business organizations.
• Conduct sketch-level engineering analysis for building left turn lanes at the intersection of TH-113 and TH 59
• Restripe the centerlines on TH-32 Center Lines between TH-11 and US-10.
• Development of advanced traffic signal warnings on rural routes
o Install additional intersection warning lights along TH 59 between the US Canadian Border & Interstate 94. Currently warning lights are provided along TH-59 at the intersections of TH-32 and County Rd 19. While there are additional controlled intersections the others do not have warning signals and the inconsistency is a safety concern because it leads to driver expectations that the second signal will be marked the same. A driver sees the flashing when approaching from the north or south and can anticipate the signal change, they expect the same for the second signal – and are surprised when the light unexpectedly changes. The Highway also curves along this segment.
o CSAH 7 & TH-23 – Flashing lights on CSAH 7 to alert drivers approaching TH 23
o Develop consistent warning lights at TH 59 & 23 from south and TH 19 & 23 from the north
• There were also many comments received during the outreach process regarding the addition of turn lanes on some routes, widening shoulders and redesigning some intersections. While most of these projects fall outside the existing resources for Mn/DOT to address, failure to respond in anyway will result in disengaged stakeholders who believe their comments have fallen on deaf ears. A communication effort should also be undertaken that stresses that everyone’s comments were considered and that where possible changes are being made. However, freight projects must also compete with a host of other projects and the lack of resources is likely to prevent some projects from being addressed.
Western Minnesota Regional Freight Study Final Report
108
BIBLIOGRAPHY 1 BEA News, “Gross Domestic Product by Industry for 2003” www.bea.doc.gov/bea/newsrel 2 Transportation Invest in Our Future: America's Freight Challenge. American Association of State Highway and
Transportation Officials (AASHTO) May 2007. 3 Developing Countries’ Goods Trade Share Surges to 50 Year Peak. World Trade Organization Press Release: April 14, 2005 4 NAFTA 10 Years Later. Overview. U.S. Department of Commerce, International Trade Administration, Office of Industry Trade Policy. 5 Ingrid E. Schneider, PhD, and Tony Schoenecker; All Terrain Vehicles in Minnesota: Economic Impact and Consumer Profile, University of Minnesota Tourism Center, 2005 http://www.tourism.umn.edu/research/ATVReport.pdf 6 http://www.ssesco.com/page/1/library-MN-wind-integration-studies.jsp 7 Wilbur Smith Associates and TranSystems Corporation for the North Dakota Department of Transportation, Regional Intermodal Freight Project, August 8, 2007. 8 Ibid. 9 2007 Peak Season Plans, Patrick Kinne, BNSF General Director of International Marketing, March 27, 2007. 10 http://www.bnsf.com/markets/intermodal/FOG.html 11 Upper Great Plains Transportation Institute, North Dakota State University, Feasibility of a Logistics Center Including Container/Trailer Intermodal Transportation in the Fargo/Moorhead Area, January 2005. 12 U.S. Grains Council, Market Perspectives, January 23,2009. 13 Wilbur Smith Associates for the Minnesota Department of Agriculture, Assessing Feasibility of Intermodal Transport of Agricultural and Related Products on Short Line and Regional Railroads, August 2008. As of May 28, 2009 the service is temporarily suspended while North Star Rail Intermodal due to an increase in ocean carrier rates which renders the service uneconomical. The company is negotiating with ocean carriers to restart the service. 14 American Transportation Research Institute, An Analysis of the Operational Costs of Trucking, December 2008. 15 Based upon an intermodal costing methodology outlined in Rail Short Haul Intermodal Corridor Case Studies: Industry Context and Issues, Foundation for Intermodal Research & Education, March 2003. 16 Wilbur Smith Associates and Transystems, Inc. for the North Dakota Department of Transportation, Regional Intermodal Freight Project, August 8, 2007. xvii Denver Tolliver and John Bitzan, Grain Transportation in the Great Plains Region in a Post-Rationalization Environment Vol. 1, Upper Great Plains Transportation Institute, 2005. pg. 2. xviii United States Department of Agriculture, Foreign Agricultural Service web site accessed at: http://www.fas.usda.gov/ustrade.asp xix Minnesota Department of Transportation, Minnesota Truck Size and Weight Project; Final Report. June 2006, pg. ES-4.