15
Minnesota State Grant Projections Fiscal Years 2020-2021 and 2022-2023 February 15, 2021

Minnesota State Grant Projections Fiscal Years 2020-2021 and 2022-2023 February 15, 2021


Author
Nicole Whelan Financial Aid Research Analyst Tel: 651-259-3967 [email protected]
Minnesota Office of Higher Education
1450 Energy Park Drive, Suite 350 Saint Paul, MN 55108-5227 Tel: 651.642.0567 or 800.657.3866 TTY Relay: 800.627.3529 Fax: 651.642.0675
Email: [email protected]
About the Minnesota Office of Higher Education
The Minnesota Office of Higher Education is a cabinet-level state agency providing students with financial aid programs and information to help them gain access to postsecondary education. The agency also serves as the state’s clearinghouse for data, research and analysis on postsecondary enrollment, financial aid, finance and trends.
The Minnesota State Grant Program is the largest financial aid program administered by the Office of Higher Education, awarding up to $208 million in need-based grants to Minnesota residents attending eligible colleges, universities and career schools in Minnesota. The agency oversees other state scholarship programs, tuition reciprocity programs, a student loan program, Minnesota’s 529 College Savings Plan, licensing and early college awareness programs for youth.
About This Report
This is a legislative-mandated report. As requested by Minnesota Statutes, section 3.197, this report cost approximately $820.70 to prepare, including staff time.

Correction:This report has been amended as follows:
1. 04/06/2021: On page 7, Table 7, the original report stated that the Pell Grant minimum award projected for fiscal years 2022 and 2023 has been corrected from $639 to $650. Also, the Pell Grant maximum award projected for fiscal years 2022 and 2023 has been corrected from $6,345 to $6,495. Finally, the Qualifying EFC projected for fiscal years 2022 and 2023 has been corrected from $5,711 to$5,846.

Contents Executive Summary 1
Fiscal Years 2020 and 2021 — Spending Projection 2
Fiscal Years 2022 and 2023 — Spending Projection 2
Assumptions 4
Federal Poverty Guidelines – Living and Miscellaneous Expense Allowance 5
Change in Wages 6
Enrollment Assumptions 6
Pell Grant Changes in Law 7
Tuition and Fee Increases 8
Federal Need Analysis 8
Next Report 9
Minnesota State Grant Projections, February 2021 1
Executive Summary This report presents projected spending for the Minnesota State Grant program for the 2020-2021 biennium and the 2022-2023 biennium as of February 15, 2021, as required by state law. Projections are the result of a full simulation of the State Grant model. This model projects state grant spending for fiscal years 2021-2023 using fiscal year 2020 actual spending data and award parameters in law as of February 15, 2021; information on enrollment and tuition and fee changes provided by institutional representatives; and the percent change in wages of tax filers estimated by Minnesota Management and Budget. Discussion of the assumptions used in the spending projections starts on page four of this report.
The results of the projections are:
• Fiscal years 2020-2021: State Grant spending totaled $207.937 million for fiscal year 2020. Spendingis projected to total $203.058 million for fiscal year 2021 for a biennial total of $410.995 million. Thiscompares to base resources of $416.194 million for the biennium ($414.874 base appropriation andtransfers of $1.32 million in unexpended funds from other programs). The difference between baseresources and total spending was positive $5.199 million or 1.2% below appropriations.
• Fiscal years 2022-2023: The spending projection for fiscal year 2022 is $192.089 million and is$200.574 million for fiscal year 2023 for a biennial total of $392.663 million. This compares to baseresources of $414.874 million for the biennium. The difference between base resources and totalspending was positive $22.211 million (5.4% below appropriations).
Note that projections for fiscal years 2022 and 2023 include the assumption that the Living and Miscellaneous Expense allowance will revert to the level specified in state law (106% of the poverty guideline) starting in fiscal year 2022. The cost to maintain LME at its current level (110%) is an estimated $20.747M over the biennium.
Projections for fiscal years 2021-2023 take into account an analysis of FAFSAs completed, which notes that the lower-income students experienced larger enrollment declines relative to middle- and higher-income students beginning July 2020. Projections are moderated to control for this shift.
COVID-19 impacts on State Grant spending projections
• Following the onset of the COVID-19 pandemic, fall 2020 enrollment declined across most sectors.The statewide enrollment decline averaged -3.2% across all sectors and impacts State Grantspending projections for fiscal years 2021-2023.
• For fiscal year 2023 projections, estimated changes in wages are derived from estimates provided byMMB following the onset of the COVID-19 pandemic. Current projections anticipate below averagewage growth for calendar year 2020 as compared to previous years. This impacts State Grantspending projections for fiscal year 2023. The Minnesota Office of Higher Education (OHE) willcontinue to monitor changes to wages.
Minnesota State Grant Projections, February 2021 2
Fiscal Years 2020 & 2021 - Spending Projection This report presents actual Minnesota State Grant program spending for fiscal year 2020 and spending projections for the State Grant program for fiscal years 2021, 2022, and 2023 as of February 15, 2021. The law requires spending projection updates to occur by November 1 and February 15 of each fiscal year. Information on enrollment and tuition and fee changes was provided by institutional representatives on February 5, 2021.
The projections contained in this report are the result of a full simulation of the State Grant model. This model projects State Grant spending for fiscal years 2021, 2022, and 2023 using fiscal year 2020 actual spending data and award parameters in law as of November 1, 2020; information on enrollment and tuition and fee changes provided by institutional representatives; and the percent change in wages of tax filers estimated by Minnesota Management and Budget. Discussion of the assumptions used in the spending projections starts on page four.
State Grant Program spending totaled $207.918 million for fiscal year 2020. This total is preliminary, pending final closeouts from FY2020. Spending is projected to total $202.482 million for fiscal year 2021 for a biennial total of $410.400 million. This compares to base resources of $416.194 million for the biennium ($414.874 base appropriation and transfers of $1.32 million in unexpended funds other programs). The difference between base resources and total spending was positive $5.794 million or 1.4% below appropriations.
Table 1: Spending versus Resources FY2020-2021 (in millions)
FY2020 FY2021 Biennium
Base resources $208.757 i $207.437 $416.194 Spending +(207.937) +(203.058) +(410.995)
Difference between resources and spending $0.820 $4.379 $5.199
1.2% below appropriations i Base resources for fiscal years 2020 and 2021 include unexpended funds from Tuition Reciprocity ($1.32 million).
The LME was increased to $10,530 for fiscal year 2021 under OHE’s statutory authority, per 136A.121 Subd. 7a. This amount is roughly equivalent to 110% of the poverty level in fiscal year 2021, prorated for a nine-month school year. A spending balance of $0.820M from fiscal year 2020 was carried forward to fiscal year 2021.
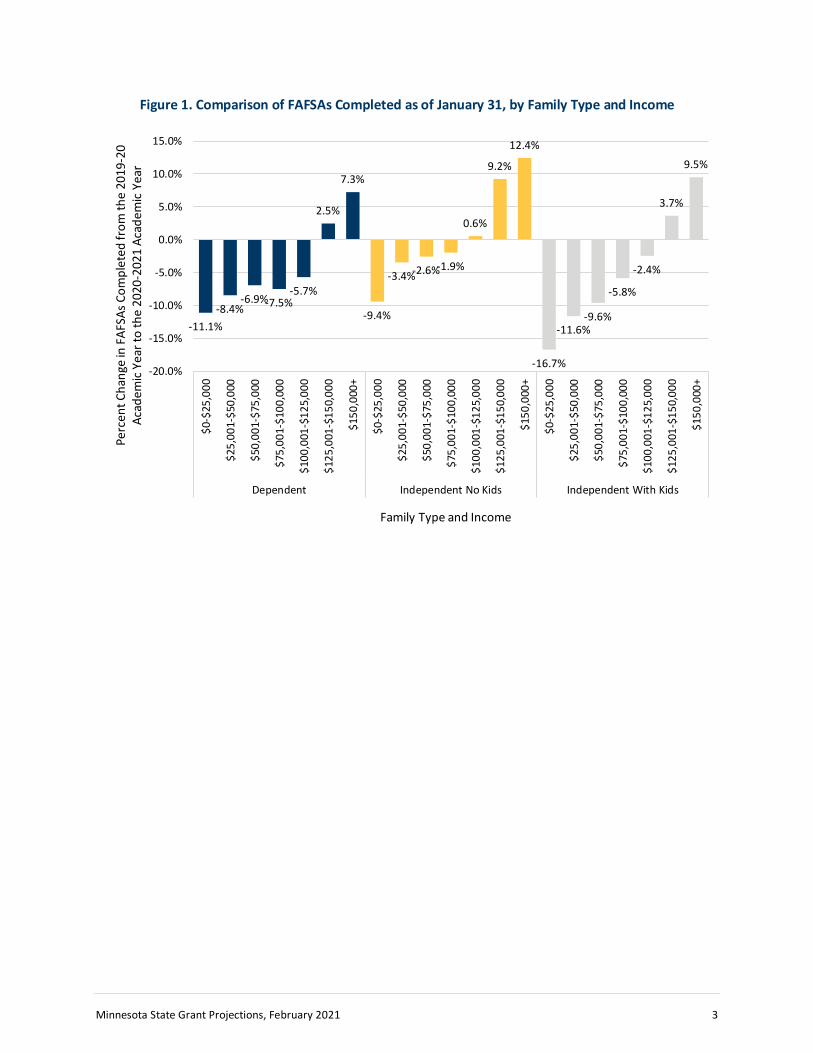
Projections for fiscal years 2021-2023 take into account an analysis of FAFSAs completed, which notes that the lower-income students experienced larger enrollment declines relative to middle- and higher-income students. Across all family types, the number of students completing a FAFSA declined at a higher rate at incomes $0-$25,000 as shown in Figure 1. Projections are moderated to control for this shift.
Minnesota State Grant Projections, February 2021 3
Figure 1. Comparison of FAFSAs Completed as of January 31, by Family Type and Income
-11.1%-8.4%
-6.9%-7.5%-5.7%
2.5%
7.3%
-9.4%
-3.4%-2.6%-1.9%
0.6%
9.2%
12.4%
-16.7%
-11.6%-9.6%
-5.8%
-2.4%
3.7%
9.5%
-20.0%
-15.0%
-10.0%
-5.0%
0.0%
5.0%
10.0%
15.0%
$0-$
25,0
00
$25,
001-
$50,
000
$50,
001-
$75,
000
$75,
001-
$100
,000
$100
,001
-$12
5,00
0
$125
,001
-$15
0,00
0
$150
,000
+
$0-$
25,0
00
$25,
001-
$50,
000
$50,
001-
$75,
000
$75,
001-
$100
,000
$100
,001
-$12
5,00
0
$125
,001
-$15
0,00
0
$150
,000
+
$0-$
25,0
00
$25,
001-
$50,
000
$50,
001-
$75,
000
$75,
001-
$100
,000
$100
,001
-$12
5,00
0
$125
,001
-$15
0,00
0
$150
,000
+
Dependent Independent No Kids Independent With Kids
Perc
ent C
hang
e in
FAF
SAs C
ompl
eted
from
the
2019
-20
Acad
emic
Yea
r to
the
2020
-202
1 Ac
adem
ic Y
ear
Family Type and Income
Minnesota State Grant Projections, February 2021 4
Fiscal Years 2022 & 2023 - Spending Projection The Office forecasts State Grant spending to total $192.089 million for fiscal year 2022 and $200.574 million for fiscal year 2023 for a biennial total of $392.663 million. This compares to base resources of $414.874 million for the biennium or positive $22.211 million (5.4% below appropriations), shown in Table 2.
The changes modeled are the Office’s best estimates as of February 15, 2021, and are subject to change, based on updated information on enrollment, tuition, and family incomes. Expense allowance will revert to the level specified in state law (106% of the poverty guideline) starting in fiscal year 2022.
Table 2: Spending Forecast versus Resources FY2022-2023 (in millions)
FY2022 FY2023 Biennium
Base resources $207.437 $207.437 $414.874
Spending projection +(192.089) +(200.574) +(392.663)
Difference between resources and spending $15.348 $6.863 $22.211
5.4% below appropriations
The cost to maintain LME at its current level (110%) is an estimated $20.747M over the biennium.

Minnesota State Grant Projections, February 2021 5
Assumptions The Minnesota State Grant spending forecast for each fiscal year relies on a series of adjustments and the program parameters shown in Table 3.
Table 3: Minnesota State Grant Award Parameters
FY2020 FY2021 FY2022 FY2023
ACTUAL ACTUAL PROJECTED PROJECTED
Living and Miscellaneous Expense Allowance $9,930 $10,530i $10,240 $10,418 ii Assigned Student Responsibility 50% 50% 50% 50% Tuition and Fee Maximums Students in Two-Year Programs $5,963 $6,113 $6,297 ii $6,486 ii Students in Four-Year Programs $15,142 $15,142 $15,369 ii $15,600 ii Federal Pell Grant Maximum $6,195 $6,345 $6,495 ii $6,495 ii Rationing Surcharge on Assigned Family Responsibility
0% 0% 0% 0%
Proration for the Assigned Family Responsibility Dependent Students (Parent Contribution) 82% 82% 82% 82% Independent Students with Dependents (Student Contribution)
74% 74% 74% 74%
Independent Students without Dependents (Student Contribution)
38% 38% 38% 38%
i Increased under OHE authority in statute (Minnesota Statute 136A.121 Subd7a); ii Estimated
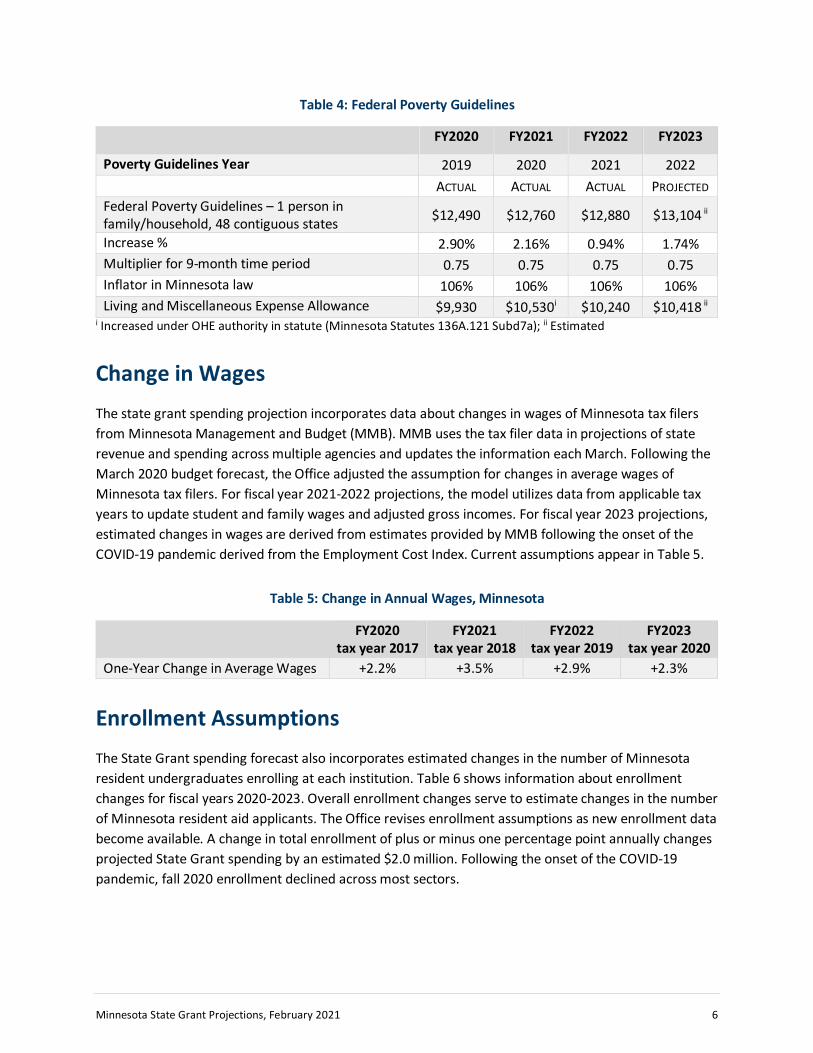
Federal Poverty Guidelines - Living and Miscellaneous Expense Allowance The Living and Miscellaneous Expense Allowance is set at an amount equal to the Federal Poverty Guidelines for a single person household living in the contiguous 48 states for a nine-month period. The U.S. Department of Health and Human Services issues Federal Poverty Guidelines annually on January 31. Under Minnesota law, the LME is equal to the Federal Poverty Guidelines plus six percent. Table 4 displays the annual figures for the Living and Miscellaneous Expense Allowance.
The Office projections the LME parameter to increase by 1.74% annually for fiscal years 2023, based on 10-year average changes to the Consumer Price Index. LME projections will be updated in the February 15, 2022 projections report following updates to the Federal Poverty Guidelines in January 2022.
Minnesota State Grant Projections, February 2021 6
Table 4: Federal Poverty Guidelines
FY2020 FY2021 FY2022 FY2023
Poverty Guidelines Year 2019 2020 2021 2022 ACTUAL ACTUAL ACTUAL PROJECTED Federal Poverty Guidelines – 1 person in family/household, 48 contiguous states $12,490 $12,760 $12,880 $13,104 ii
Increase % 2.90% 2.16% 0.94% 1.74% Multiplier for 9-month time period 0.75 0.75 0.75 0.75 Inflator in Minnesota law 106% 106% 106% 106% Living and Miscellaneous Expense Allowance $9,930 $10,530i $10,240 $10,418 ii
i Increased under OHE authority in statute (Minnesota Statutes 136A.121 Subd7a); ii Estimated
Change in Wages The state grant spending projection incorporates data about changes in wages of Minnesota tax filers from Minnesota Management and Budget (MMB). MMB uses the tax filer data in projections of state revenue and spending across multiple agencies and updates the information each March. Following the March 2020 budget forecast, the Office adjusted the assumption for changes in average wages of Minnesota tax filers. For fiscal year 2021-2022 projections, the model utilizes data from applicable tax years to update student and family wages and adjusted gross incomes. For fiscal year 2023 projections, estimated changes in wages are derived from estimates provided by MMB following the onset of the COVID-19 pandemic derived from the Employment Cost Index. Current assumptions appear in Table 5.
Table 5: Change in Annual Wages, Minnesota
FY2020 tax year 2017
FY2021 tax year 2018
FY2022 tax year 2019
FY2023 tax year 2020
One-Year Change in Average Wages +2.2% +3.5% +2.9% +2.3%
Enrollment Assumptions The State Grant spending forecast also incorporates estimated changes in the number of Minnesota resident undergraduates enrolling at each institution. Table 6 shows information about enrollment changes for fiscal years 2020-2023. Overall enrollment changes serve to estimate changes in the number of Minnesota resident aid applicants. The Office revises enrollment assumptions as new enrollment data become available. A change in total enrollment of plus or minus one percentage point annually changes projected State Grant spending by an estimated $2.0 million. Following the onset of the COVID-19 pandemic, fall 2020 enrollment declined across most sectors.

Minnesota State Grant Projections, February 2021 7
Table 6: Enrollment Assumptions
Fiscal Year FY2020 FY2021 FY2021 FY2022 FY2023 Fall 2019 Fall 2020 Fall 2020 Fall 2021 Fall 2022
System ACTUAL PROJECTED ACTUAL PROJECTED PROJECTED Minnesota State Colleges -2.1% 0.5% -7.1% 0.4% 1.7% Minnesota State Universities -3.0% -0.4% -3.7% -2.6% -1.0%
University of Minnesota Twin Cities 5.6% 0.08% 1.53%i 0% i 0% i
University of Minnesota Crookston, Duluth & Morris -0.6% 0.03% -6.74% 0% 0%
Private Not-for-Profit Institutions -0.5% 0.0% -2.4% 2.0% 1.0%
Private For-Profit Institutions -6.0% 4.0% -0.6% 2.0% 3.0%
i Includes data for UMN Rochester
Pell Grant Changes in Law For academic year 2019-2020 (fiscal year 2020), the Pell Grant maximum increased to $6,195. The 2019 federal appropriations bill included an increase to the Pell Grant, further raising the maximum award to $6,345 for fiscal year 2021, and a subsequent federal appropriations bill passed late in calendar year 2020 further raised the Pell Grant maximum to $6,495 for fiscal year 2022. Currently federal appropriations for the Pell Grant program for fiscal year 2023 has not been approved by Congress. The Office will continue to monitor Congressional activity regarding funding of the federal Pell Grant program, and future projections will include updated Pell Grant amounts.
The State Grant award formula maintains a dollar for dollar relationship with the student’s Pell Grant, and increases or reductions in the federal Pell Grant amounts will impact State Grant spending. Table 7 lists the current federal Pell Grant parameters.
Table 7: Federal Pell Grant Award Parameters
FY2020 FY2021 FY2022 FY2023
ACTUAL ACTUAL PROJECTED PROJECTED Pell Grant Minimum Award $650 $639 $650 $650 Pell Grant Maximum Award $6,195 $6,345 $6,495 $6,495
Award Formula: Expected Family Contribution (EFC)
Maximum Pell - EFC
Maximum Pell - EFC
Maximum Pell - EFC
Maximum Pell - EFC
Qualifying EFC $0 - $5,576 $0 - $5,711 $0 - $5,846 $0 - $5,846
Minnesota State Grant Projections, February 2021 8
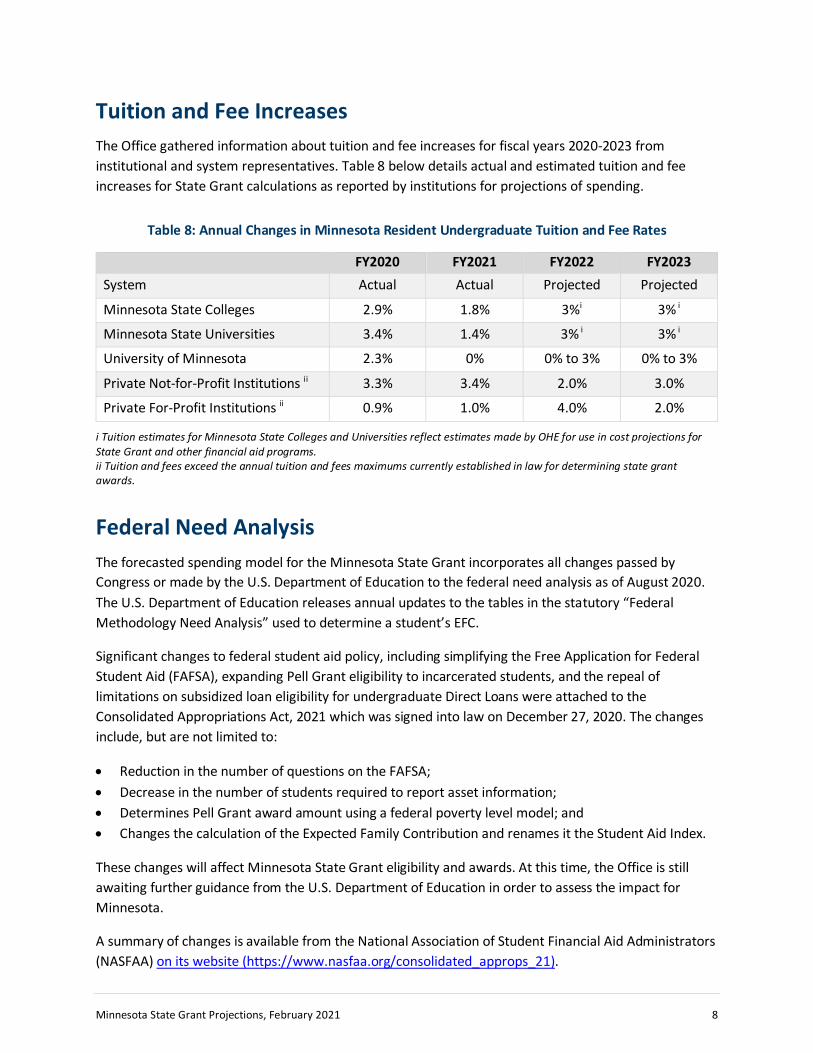
Tuition and Fee Increases The Office gathered information about tuition and fee increases for fiscal years 2020-2023 from institutional and system representatives. Table 8 below details actual and estimated tuition and fee increases for State Grant calculations as reported by institutions for projections of spending.
Table 8: Annual Changes in Minnesota Resident Undergraduate Tuition and Fee Rates
FY2020 FY2021 FY2022 FY2023 System Actual Actual Projected Projected
Minnesota State Colleges 2.9% 1.8% 3%i 3% i
Minnesota State Universities 3.4% 1.4% 3% i 3% i
University of Minnesota 2.3% 0% 0% to 3% 0% to 3%
Private Not-for-Profit Institutions ii 3.3% 3.4% 2.0% 3.0%
Private For-Profit Institutions ii 0.9% 1.0% 4.0% 2.0%
i Tuition estimates for Minnesota State Colleges and Universities reflect estimates made by OHE for use in cost projections for State Grant and other financial aid programs. ii Tuition and fees exceed the annual tuition and fees maximums currently established in law for determining state grant awards.
Federal Need Analysis The forecasted spending model for the Minnesota State Grant incorporates all changes passed by Congress or made by the U.S. Department of Education to the federal need analysis as of August 2020. The U.S. Department of Education releases annual updates to the tables in the statutory “Federal Methodology Need Analysis” used to determine a student’s EFC.
Significant changes to federal student aid policy, including simplifying the Free Application for Federal Student Aid (FAFSA), expanding Pell Grant eligibility to incarcerated students, and the repeal of limitations on subsidized loan eligibility for undergraduate Direct Loans were attached to the Consolidated Appropriations Act, 2021 which was signed into law on December 27, 2020. The changes include, but are not limited to:
• Reduction in the number of questions on the FAFSA; • Decrease in the number of students required to report asset information; • Determines Pell Grant award amount using a federal poverty level model; and • Changes the calculation of the Expected Family Contribution and renames it the Student Aid Index.
These changes will affect Minnesota State Grant eligibility and awards. At this time, the Office is still awaiting further guidance from the U.S. Department of Education in order to assess the impact for Minnesota.
A summary of changes is available from the National Association of Student Financial Aid Administrators (NASFAA) on its website (https://www.nasfaa.org/consolidated_approps_21).
Minnesota State Grant Projections, February 2021 9
Next Report The next report on Minnesota State Grant spending is due to the Legislature by November 1, 2021.
2021


