Hydrogeophysical Investigations at Hidden Dam, Raymond, California Burke J. Minsley 1 , Bethany L. Burton 1 , Scott Ikard 2 and Michael H. Powers 1 1 Crustal Geophysics and Geochemistry Science Center, U.S. Geological Survey, Denver, Colo. 80225 Email: [email protected]2 Colorado School of Mines, Department of Geophysics, Golden, Colo. 80401 ABSTRACT Self-potential and direct current resistivity surveys are carried out at the Hidden Dam site in Raymond, California to assess present-day seepage patterns and better understand the hydrogeologic mechanisms that likely influence seepage. Numerical modeling is utilized in conjunction with the geophysical measurements to predict variably-saturated flow through typical two-dimensional dam cross-sections as a function of reservoir elevation. Several different flow scenarios are investigated based on the known hydrogeology, as well as information about typical subsurface structures gained from the resistivity survey. The flow models are also used to simulate the bulk electrical resistivity in the subsurface under varying saturation conditions, as well as the self-potential response using petrophysical relationships and electrokinetic coupling equations. The self-potential survey consists of 512 measurements on the downstream area of the dam, and corroborates known seepage areas on the northwest side of the dam. Two direct- current resistivity profiles, each approximately 2,500 ft (762 m) long, indicate a broad sediment channel under the northwest side of the dam, which may be a significant seepage pathway through the foundation. A focusing of seepage in low-topography areas downstream of the dam is confirmed from the numerical flow simulations, which is also consistent with past observations. Little evidence of seepage is identified from the self-potential data on the southeast side of the dam, also consistent with historical records, though one possible area of focused seepage is identified near the outlet works. Integration of the geophysical surveys, numerical modeling, and observation well data provides a framework for better understanding seepage at the site through a combined hydrogeophysical approach. Introduction Geophysical field investigations, supported by coupled hydrogeophysical modeling, have been carried out at the Hidden Dam in Raymond, California for the purpose of better understanding the hydrogeology and seepage-related conditions at the site. Known seepage areas on the northwest right abutment area of the downstream side of the dam are documented by Cedergren (1980a, 1980b). Subsequent to the 1980 seepage study, a drainage blanket with a subdrain system was installed to mitigate downstream seepage. Flow net analysis provided by Cedergren (1980a, 1980b) suggests that the primary seepage mechanism involves flow through the dam foundation caused by normal reservoir pool elevations, which results in upflow that intersects the ground surface in several areas on the downstream side of the dam. In addition to the reservoir pool elevation and downstream surface topography, flow is also controlled by the existing foundation geology as well as the presence or absence of a horizontal drain within the downstream portion of the dam. The purpose of the current geophysical work is to (1) identify present-day seepage areas that may not be evident because of the effectiveness of the drainage blanket in redirecting seepage water, and (2) provide information about subsurface geologic structures that may control subsurface flow and seepage. These tasks are accomplished through the use of two complementary electrical geophysical methods, self-potentials (SP) and direct-current (DC) electrical resistivity, which have been commonly used in dam seepage and other integrated hydrogeologic studies (Berube, 2007; Bogo- slovsky and Ogilvy, 1970a, 1970b; Bole `ve et al., 2009; Corwin, 2007; Dahlin et al., 2008; Ogilvy et al., 1969; Panthulu et al., 2001; Sheffer, 2007; Sjo ¨ dahl et al., 2005, 2008; Titov et al., 2005). SP is a passive method that is Journal of Environmental and Engineering Geophysics eego-16-04-01.3d 12/10/11 13:23:11 145 Cust # 10018 145 JEEG, December 2011, Volume 16, Issue 4, pp. 145–164
Transcript
Hydrogeophysical Investigations at Hidden Dam, Raymond, California
Burke J. Minsley1, Bethany L. Burton1, Scott Ikard2 and Michael H. Powers1
1Crustal Geophysics and Geochemistry Science Center, U.S. Geological Survey, Denver, Colo. 80225
Email: [email protected] School of Mines, Department of Geophysics, Golden, Colo. 80401
ABSTRACT
Self-potential and direct current resistivity surveys are carried out at the Hidden Dam site
in Raymond, California to assess present-day seepage patterns and better understand the
hydrogeologic mechanisms that likely influence seepage. Numerical modeling is utilized in
conjunction with the geophysical measurements to predict variably-saturated flow through
typical two-dimensional dam cross-sections as a function of reservoir elevation. Several different
flow scenarios are investigated based on the known hydrogeology, as well as information about
typical subsurface structures gained from the resistivity survey. The flow models are also used to
simulate the bulk electrical resistivity in the subsurface under varying saturation conditions, aswell as the self-potential response using petrophysical relationships and electrokinetic coupling
equations.
The self-potential survey consists of 512 measurements on the downstream area of the
dam, and corroborates known seepage areas on the northwest side of the dam. Two direct-
current resistivity profiles, each approximately 2,500 ft (762 m) long, indicate a broad sediment
channel under the northwest side of the dam, which may be a significant seepage pathway
through the foundation. A focusing of seepage in low-topography areas downstream of the dam
is confirmed from the numerical flow simulations, which is also consistent with pastobservations. Little evidence of seepage is identified from the self-potential data on the
southeast side of the dam, also consistent with historical records, though one possible area of
focused seepage is identified near the outlet works. Integration of the geophysical surveys,
numerical modeling, and observation well data provides a framework for better understanding
seepage at the site through a combined hydrogeophysical approach.
Introduction
Geophysical field investigations, supported by
coupled hydrogeophysical modeling, have been carried
out at the Hidden Dam in Raymond, California for the
purpose of better understanding the hydrogeology and
seepage-related conditions at the site. Known seepage
areas on the northwest right abutment area of the
downstream side of the dam are documented by
Cedergren (1980a, 1980b). Subsequent to the 1980
seepage study, a drainage blanket with a subdrain
system was installed to mitigate downstream seepage.
Flow net analysis provided by Cedergren (1980a, 1980b)
suggests that the primary seepage mechanism involves
flow through the dam foundation caused by normal
reservoir pool elevations, which results in upflow that
intersects the ground surface in several areas on the
downstream side of the dam. In addition to the reservoir
pool elevation and downstream surface topography,
flow is also controlled by the existing foundation
geology as well as the presence or absence of a
horizontal drain within the downstream portion of the
dam.
The purpose of the current geophysical work is to
(1) identify present-day seepage areas that may not be
evident because of the effectiveness of the drainage
blanket in redirecting seepage water, and (2) provide
information about subsurface geologic structures that
may control subsurface flow and seepage. These tasks
are accomplished through the use of two complementary
electrical geophysical methods, self-potentials (SP) and
direct-current (DC) electrical resistivity, which have
subsurface pressures (several with a piezometric surface
higher than the ground surface) at a pool elevation of
484 ft (148 m) during the 1980 study. Flow nets
calibrated to the observation well data suggested that
very high uplift pressures could be expected at gross
pool, potentially leading to erosion in the foundation.
Flow nets also confirmed that low-topography areas on
the downstream side of the dam are focal points for
seepage through the foundation. Additional observation
wells and piezometers were installed at the site based
upon recommendations from the 1980 seepage study,
and have been monitored on a monthly basis. Also, a
drainage blanket with a sub-drain system was installed
over much of the right abutment area of the dam to
rapidly drain seepage in this area.
Figure 2 shows the reservoir elevation during
the past ten years, which tends to reach a minimum
in September–October, then begins to rise rapidly
around January, peaking in April-June before declining
again. Elevation gains in a typical year seem to be
approximately 40–50 ft (12–15 m), though gains of 90 ft
(27 m) and 10 ft (3 m) were seen in 2005 and 2007,
Journal of Environmental and Engineering Geophysics eego-16-04-01.3d 12/10/11 13:23:11 146 Cust # 10018
146
Journal of Environmental and Engineering Geophysics
respectively. Reduced seepage is expected between
September and January when the reservoir elevation
is typically near or below 470 ft (143 m), while higher
reservoir elevations, and increased seepage, are ob-
served throughout the remainder of the year. Elevations
from early 2005 to mid 2007 were atypical for this
period, with the minimum reservoir elevation near 500 ft
(152 m). The present geophysical survey was scheduled
for early May to coincide with the seasonal maximum
reservoir elevation, and therefore the greatest potential
for seepage, though the 2009 high pool reservoir
elevation only reached approximately 490 ft (149 m).
This elevation is relatively low, though still higher than
the 484 ft (147.5 m) level recorded during the 1980
seepage study. Because the self-potential method is
sensitive to active seepage, it is important to record
these data during a period when seepage is expected to
occur.
Geophysical Surveys
Self-potential
The self-potential method measures the naturally
occurring electrical potential on the earth surface caused by
subsurface current sources (Sill, 1983). One of the primary
sources of self-potential signals is fluid flow in porous
media, such as groundwater flow or seepage through a
dam. An excess positive charge that develops near grain
surfaces in saturated porous geologic media is transported
along with the fluid, creating a streaming current density.
This subsurface electrokinetic phenomenon generates a
balancing conduction current density, which flows through
the earth resistivity structure and is manifested as the
measurable self-potential on the earth surface (Ishido and
Mizutani, 1981; Morgan et al., 1989; Revil et al., 1999; Sill,
1983). The degree of coupling between fluid and electrical
flows varies with fluid and rock chemistry, but is generally
Journal of Environmental and Engineering Geophysics eego-16-04-01.3d 12/10/11 13:23:11 147 Cust # 10018
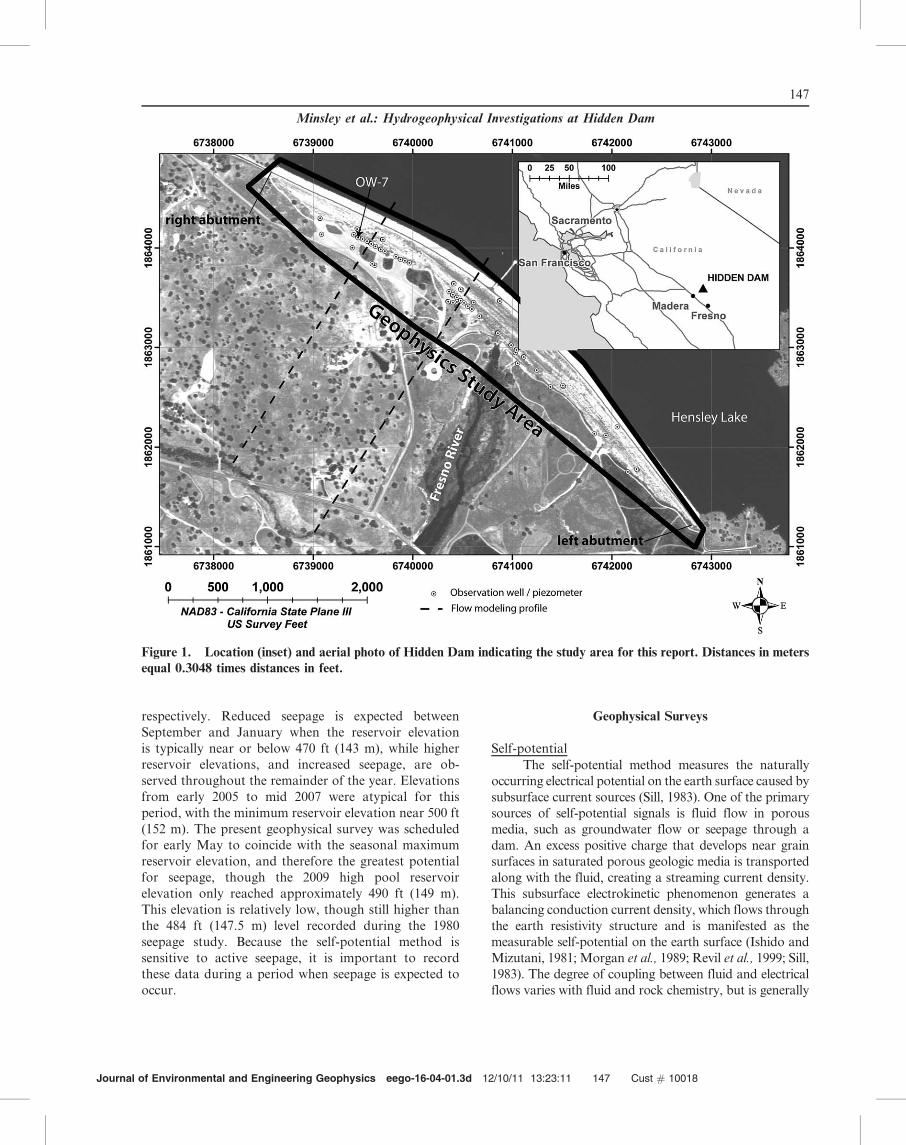
Figure 1. Location (inset) and aerial photo of Hidden Dam indicating the study area for this report. Distances in meters
equal 0.3048 times distances in feet.
147
Minsley et al.: Hydrogeophysical Investigations at Hidden Dam
such that the electrical potential gradient is in the opposite
direction of the hydraulic gradient. That is, increasingly
positive self-potentials are typically measured in the
direction of fluid flow (or decreasing hydraulic head). A
seepage-related self-potential signal would therefore be
positive in the downstream/outflow area, and more
negative in the upstream/infiltration area. In rare cases of
unusual rock-fluid chemistry, the hydraulic-electric cou-
pling can take on an opposite sign (Morgan et al., 1989),
but this is not expected at the Hidden Dam site, nor is it
supported by the measured data.
Self-potential measurements were made using the
reference electrode method, whereby the electrical poten-
tial is measured between a fixed base electrode and a roving
electrode connected to a long spool of wire (approximately
2,500 ft (762 m)). Non-polarizing lead/lead chloride
electrodes, fashioned after the Petiau electrode (Petiau,
2000), were used for all self-potential measurements. At
each station, three shallow holes were dug and filled with a
small amount of salted bentonite mud to improve electrical
contact with the earth in the generally dry and gravelly
conditions found at the site. Five self-potential measure-
ments were recorded in each of the three holes, for a total
of 15 measurements per station, using an Agilent U1252A1
high impedance digital voltmeter and laptop computerwith data logging software. Each station was assigned a
unique identifier to facilitate further processing, and
locations were recorded with a handheld global positioning
system (GPS) unit.
A total of 512 self-potential stations were ac-
quired, primarily along several lines that parallel the
downstream toe of the dam (Fig. 3), though several
other transects were also surveyed in areas of interestincluding one line in the reservoir on the upstream side
of the dam. Individual lines of data were collected by
spooling out the roving electrode at 40 ft (12 m) intervals
(nominal station spacing) along the line from the base
electrode location. A new base electrode location was
established for each line, and individual lines of data
have been tied together by measuring the self-potential
between base stations on adjacent lines, as well asoccupying the same station where lines intersected.
Electrode drift was checked at the beginning and end of
each line by placing both electrodes in a bucket of saline
water and measuring their potential difference, which
was generally less than 1 mV.
The use of salted bentonite mud in each hole has
been found to improve measurement quality in dry and
rocky locations such as Hidden Dam where poorelectrical contact with the ground can degrade signal
quality. This practice was used throughout the entire
survey, resulting in significantly lower contact resistanc-
Journal of Environmental and Engineering Geophysics eego-16-04-01.3d 12/10/11 13:23:12 148 Cust # 10018
Figure 2. Hidden Dam reservoir elevation from January 1999 through July 2009 from the California Department of
Water Resources Data Exchange Center (http://cdec.water.ca.gov/). Water levels during the 1980 seepage study
(Cedergren, 1980a) and the present geophysical survey are annotated. Elevations in meters equal 0.3048 times elevationin feet.
1Any use of trade, product, or firm names is for descriptivepurposes only and does not imply endorsement by the U.S.Government.
148
Journal of Environmental and Engineering Geophysics
es (typically less than 6 kohm with bentonite and often
greater than 15 kohm without) as well as less scatter
between measurements at a given station. The average
standard deviation of the 15 measurements at each
station was 1.7 mV, and 95 percent of the stations had a
standard deviation less than 4.0 mV. This statistic is
meant only to roughly describe the scatter in the
measurements, and does not imply that the data errors
follow a Gaussian distribution. In fact, self-potential
measurements are prone to outliers (Corwin, 1990), and
the processing strategies described below that are used
to produce the final self-potential map account for this
by incorporating a non-linear measure of data misfit
that is appropriate for outliers and heavy-tailed
distributions (Farquharson and Oldenburg, 1998; Mins-
ley et al., 2008)
Additionally, a telluric monitoring dipole was
installed to observe daily telluric variations that might
corrupt the self-potential data. The single telluric dipole
was installed in the same dam-parallel orientation as the
vast majority of self-potential measurements, as this is
the component of the telluric field that could affect the
self-potential data. The telluric dipole (triangles, Fig. 3)
consists of two non-polarizing electrodes installed in
holes approximately 2 ft (0.6 m) deep and 720 ft (219 m)
apart throughout the duration of the self-potential
survey. An MT–24LF magnetotelluric recording system
was used to record the telluric field at 6.25 Hz
throughout each day of the self-potential survey.
Telluric variations were typically less than 2 mV?ft21
(6.5 mV?m21), and were not considered to be a
significant component of the total error in the data.
The raw self-potential data consist of measure-
ments of the electrical potential between the base
electrode and roving electrode for each line, as well as
electrode drift measurements at the beginning and end
Journal of Environmental and Engineering Geophysics eego-16-04-01.3d 12/10/11 13:23:12 149 Cust # 10018
Figure 3. Self-potential survey stations (circles) and telluric dipole (triangles). Note that the reservoir elevation at the
time of the aerial photo was higher than during the self-potential survey; actual electrode locations on the upstream side of
the dam were immediately adjacent to the reservoir. Distances in meters equal 0.3048 times distances in feet.
149
Minsley et al.: Hydrogeophysical Investigations at Hidden Dam
of each line. These data are processed to produce a map
of the electrical potential at every station relative to a
survey-wide reference location, which is chosen as the
northwestern-most point in the survey next to the
downstream toe on the right abutment and is assigned
a value of zero mV. Measurements taken between the
base stations of adjacent lines, as well as locations where
two lines intersect, are critical in producing the final self-
potential map because these data provide information
needed to tie all of the individual lines together. The
final map was generated using the procedure discussed
in more detail by Minsley et al. (2008), which produces a
smoothly varying self-potential map that honors (1)
measurements along each line, (2) errors estimated from
the 15 measurements at each station, (3) electrode drift
corrections, (4) a unique potential value at line
intersection points, and (5) Kirchhoff’s law, which
requires that the total potential drop along any closed
loop equals zero.
Figure 4 shows the resulting self-potential map (in
mV) relative to the survey-wide reference location in the
northwest corner. An inverse-distance weighting func-
tion is used to generate the interpolated image from the
inverted station potentials. The upstream data are
omitted from this figure, and are displayed separately
because of the questionable quality of their tie-in values
Journal of Environmental and Engineering Geophysics eego-16-04-01.3d 12/10/11 13:23:13 150 Cust # 10018
Figure 4. Interpolated self-potential map over the downstream portion of the survey area. The survey-wide reference
electrode location is marked ‘‘Ref’’ in the northwest corner of the survey area. Locations A and B likely represent seepage
areas over the drainage blanket. Location C may indicate an area of more focused shallow seepage in the area immediately
around and above the fenced-in area surrounding the outlet works. Location D may represent relatively weak upwards
seepage that does not intersect the ground surface, and is approximately 700 ft upstream of a focused seepage area
previously identified by Cedergren (1980a), which is marked as location E. Distances in meters equal 0.3048 times
distances in feet.
150
Journal of Environmental and Engineering Geophysics
relative to the downstream data. This is likely due to
poor electrical contact on the riprap along the tie-line
collected over the crest of the dam, as well as differences
in oxidation-reduction (redox) and electrode diffusion
for the measurements where the roving electrode was
placed in the reservoir. Four likely seepage-related
locations are marked on Fig. 4 based on the positive
self-potential values in the vicinity of seepage outflow
areas:
— Locations A and B: These areas of elevated self-
potential are very well correlated with the known
seepage areas from the 1980 study (Cedergren,
1980a, 1980b), and therefore also with the location
of the drainage blanket. The positive anomalies, on
the order of 50–60 mV in amplitude, seem to be
focused in the areas of lower topography between
several mounds on the downstream side of the dam.
Lower self-potential values found on top of the
mounds may be caused by (1) seepage being directed
towards the relatively higher permeability drainage
blanket and (2) increased distance from the ground
surface to the seepage upflow, which can attenuate
the self-potential signal.
— Location C: A large (+170 mV) and spatially focused
(less than approximately 50 ft (15 m) wide) self-
potential anomaly is observed immediately around
and above the fenced-in area surrounding the outlet
works. The magnitude and peaked character of this
anomaly suggest relatively focused and shallow
outflow in this area. This, in addition to the fact
that it is located somewhat uphill from the toe of the
dam, supports the possibility that this could be
related to piping or internal seepage exiting through
the embankment rather than the foundation seepage
associated with the locations A and B seepage areas.
The proximity of this anomaly to the dam outlet
structure leads to some concern that it may be a
cultural-related artifact, which cannot be fully
discounted. However, arguments for seepage include
(1) noticeably wetter soil and greener vegetation in
the vicinity of the anomaly and (2) the fact that
metallic cultural sources are most often associated
with negative self-potential anomalies.
— Location D: A very broad, low amplitude positive
self-potential anomaly, approximately 20 mV in
magnitude, is observed in this location, which may
be related to relatively weak upwards seepage that
does not intersect the ground surface but continues
mostly to the southwest along the local hydraulic
gradient. A small area of focused seepage in a
topographic low approximately 700 ft (213 m)
downstream of location D was reported by Ceder-
gren (1980a), and is marked as location E.
In general, the self-potential variability on the
entire southeast (left) side of the dam is very weak
compared with the northwest (right) side, thus corrob-
orating the lack of observed seepage problems on the
left side. We do, however, observe a gradual trend of
increasing self-potentials from the ‘‘background’’ value
measured on both the right and left abutments towards
the dam centerline. This is illustrated in Fig. 5(A), which
shows the self-potential profile along line 5, which is
closest to the downstream toe on the left side of the dam.
This gradual increase towards a peaked value near the
centerline is expected for normal under-flow conditions
because there is a greater amount of flow under the
center portion of the dam due to a larger hydraulic
gradient than exists on the abutments where the
downstream elevation is similar to that of the reservoir.
The small (approximately 10 mV) positive excursions
from this trend between 800 and 1,200 ft (244 and 366 m)
represent the potentially weak upwards seepage areas
associated with location D in Fig. 4.
Figure 5(B) shows the self-potential profile col-
lected in the reservoir immediately adjacent to the riprap
on the upstream face of the dam on line 8. The base
electrode for this profile was located onshore next to the
reservoir near the right abutment, and the roving
electrode was placed in the water along the upstream
face. As mentioned previously, there is some concern
regarding the absolute value of self-potentials along this
line relative to the downstream data because of the
questionable quality of the tie line that crosses the dam
crest, as well as possible influences from different redox
conditions and diffusion related to having one electrode
in the water and one onshore. Regardless of these issues,
the self-potential trend in Fig. 5(B) is decreasing from
the abutment towards the centerline, which is the
opposite trend of the downstream line in Fig. 5(A)
(increasing towards the centerline). This is the expected
behavior on the upstream side of the dam, where greater
head near the middle of the dam results in increased
flow in the downstream direction, causing the self-
potentials in the upstream centerline area to be negative
relative to the abutments.
Direct Current (DC) Resistivity
DC resistivity is an effective geophysical tool in
dam-seepage studies because it is sensitive to changes in
lithology, water saturation, and water chemistry (Binley
and Kemna, 2005). Images of subsurface bulk electrical
resistivity can therefore be used to help assess geologic
units that may be more likely to conduct seepage
through foundation or embankment materials, or to
map regions of increased saturation. Numerous resis-
tivity studies have focused on both internal erosion
detection (Cho and Yeom, 2007; Kim et al., 2007;
Journal of Environmental and Engineering Geophysics eego-16-04-01.3d 12/10/11 13:23:25 151 Cust # 10018
151
Minsley et al.: Hydrogeophysical Investigations at Hidden Dam
Sjodahl et al., 2005, 2008) as well as identification of
seepage pathways associated with dam foundation
materials (Abu-Zeid, 1994; Di and Wang, 2010;
Panthulu et al., 2001).
The focus of the present resistivity study is on
imaging the subsurface beneath the downstream portion
on the right side of Hidden Dam where seepage is
known to have occurred. The survey objectives are (1)
identifying potential seepage areas associated with
changes in subsurface lithology and (2) determining
depth to bedrock. Individual joints and fractures are
particularly difficult targets to image, especially when
their depths approach several tens of feet, because they
are discrete features that involve a relatively small
volumetric contrast in electrical properties. Zones of
relatively high joint or fracture density, however, may
result in a larger bulk contrast in electrical properties
and are therefore more discernible geophysical targets.
Two two-dimensional (2-D) DC resistivity profiles
were acquired along the western half of the downstream
toe of the dam (Fig. 6). The data were acquired using a
SuperSting R8 resistivity/IP meter by Advanced Geo-
sciences, Inc. (AGI), which is an eight-channel multi-
electrode resistivity meter that uses a command file to
acquire measurements from pre-determined current and
potential electrode configurations. An ‘‘inverse Schlum-
berger’’ array geometry is utilized for this survey, which
allows for rapid data acquisition and provides a good
balance between lateral and depth resolution. The array
consisted of 120 electrodes spaced at 10-ft (3-m)
intervals along the line. For lines longer than the initial
120 electrode layout, continuous profiles were collected
by moving a group of electrodes from the start of the
line to the end, also known as the ‘‘roll-along’’ method.
Multiple roll-alongs of 16 or 24 electrodes each were
performed until the total desired line length was
Journal of Environmental and Engineering Geophysics eego-16-04-01.3d 12/10/11 13:23:25 152 Cust # 10018
Figure 5. (A) Self-potential profile along the line closest to the downstream toe on the left side (line 5) of the dam
illustrates a gradual increase towards the center of the dam expected during normal under-flow conditions. (B) Self-
potential profile along the line in the reservoir on the upstream side of the dam (line 8) illustrates a gradual decrease
towards the center of the dam, also expected during normal under-flow conditions caused by increased head in the deepercenter portion of the dam. Distances in meters equal 0.3048 times distances in feet.
152
Journal of Environmental and Engineering Geophysics
achieved for both lines. The survey parameters for both
lines are summarized in Table 1. Resistivity electrodes
were positioned using a real-time kinematic GPS system
with typical positioning accuracy of approximately 3 to
6 cm.
All electrodes are hammered into the ground as
deep as possible and then watered with a dilute saltwater
solution to minimize electrical contact resistance be-
tween the electrode and the ground. The observed
contact resistances were fairly high at this site, especially
Journal of Environmental and Engineering Geophysics eego-16-04-01.3d 12/10/11 13:23:26 153 Cust # 10018
Figure 6. Aerial view of the two DC resistivity lines acquired on the downstream right side of the dam. Distances inmeters equal 0.3048 times distances in feet.
Table 1. Summary of survey parameters for the direct current resistivity profiles.
Line number 1 2
Total line length 2,550 ft (777 m) 2,870 ft (875 m)
Line geometry one 120-electrode spread with five
24-electrode and one 16-electrode rolls
one 120-electrode spread with seven 24-electrode rolls
Total number of electrodes 256 288
Electrode spacing 10 ft (3 m)
Array type inverse Schlumberger
Measurement time
153
Minsley et al.: Hydrogeophysical Investigations at Hidden Dam
over the gravel drainage blanket where there were
relatively few fine-grained sediments. The contact
resistances ranged from 2 to 9 kohm along the gravel
drainage blanket areas and were less than 2 kohm in
areas off of the blanket that had soil on the surface. A
few short sections across the drainage blanket had
contact resistances greater than 10 kohm, which
required the addition of a bentonite mud to the base
of the electrodes to further decrease the contact
resistance (typically 4 to 7 kohm after the addition of
bentonite).
The resistivity data were inverted using AGI’s
EarthImager 2D software (AGI, 2008) using the
‘‘robust’’ inversion method, which is based on the
assumption of an exponential distribution of data errors
and performs well on noisy datasets. Topographic
information was incorporated into the inversion in
order to account for the influence of the irregular earth
surface on the distribution of subsurface electrical
currents, which is an important step towards determin-
ing a more accurate subsurface resistivity model. The
inversions were initially run for 10 iterations, then the
poorest-fit data points are removed using a percent data
misfit threshold. The misfit threshold used for this
survey is 30 percent and 40 percent, resulting in the
removal of 6.6 percent and 5.9 percent of the total
number of data points for lines 1 and 2, respectively.
The choice of a threshold value depends on the noise
levels of the data and on the overall percentage of data
that would be removed at those data misfit levels so as
not to remove too large a percentage of the data. The
inversion is then run a second time using the edited
dataset to provide more reliable estimates of the
resistivity structure.
Figure 7 shows the inverted sections for lines 1 and
2. On both lines, there is a moderately resistive (about 10
to 400 ohm-m; blue to yellow colors) upper layer that
varies in thickness from 0 to approximately 80 ft (24 m)
overlying a strongly resistive (greater than 800 ohm-m;
orange to red colors) layer. Based on the known geology
of the area, the upper layer is interpreted to be a
combination of alluvial overburden and decomposed, or
weathered, granitic bedrock. Without additional bore-
hole or lithologic information to compare directly with
the data, it is difficult to conclusively determine the
overburden/decomposed bedrock contact. Under satu-
rated conditions, both of these units can have similar
electrical properties. The deeper resistor is interpreted as
less weathered granitic bedrock, where the more highly
weathered/jointed sections are interpreted to have a lower
resistivity than the more competent bedrock. These
weathered sections in the competent bedrock represent
potential groundwater pathways. Several other notable
features annotated in Fig. 7 are described below:
Journal of Environmental and Engineering Geophysics eego-16-04-01.3d 12/10/11 13:23:26 154 Cust # 10018
Figure 7. Inverted sections for DC resistivity (A) line 1 and (B) line 2. Location E, observed on both lines, is interpreted
to be a deep alluvial valley between bedrock highs; locations F are highly resistive features that may represent competent
granitic highs with complex geometry; and locations G illustrate high near-surface resistivity associated with large granite
outcrops. Distances and elevations in meters equal 0.3048 times values in feet.
154
Journal of Environmental and Engineering Geophysics
— Location E: The most notable feature that is present
in both lines is a less resistive zone with a maximum
width of about 400 ft (122 m) interpreted as an
alluvial valley between bedrock highs. Based on the
trend between lines 1 and 2, the valley appears to
trend northeast-southwest and becomes shallower
and narrower on line 2. The shallow dark blue zones
on line 2 possibly indicate saturated areas of greater
porosity or increased concentrations of clay. The
source of the thin, shallow discontinuous resistor
about 30 ft (9 m) below the surface on both lines is
unknown. Although it is possible that it represents a
low porosity/permeability layer, this requires further
analysis to determine the robustness and structure of
this feature in the model. A similar thin resistor is
located between 1,880 and 2,000 ft (573 and 610 m)
downline distance on line 2.
— Locations F: There are several highly resistive
vertical features that begin about 30 ft (9 m) below
the surface. They tend to have a character indicative
of three-dimensional objects either along line or
offline improperly imaged with a two-dimensional
profile. These objects may represent competent
granitic highs, but their true three-dimensional
geometry may not be well-resolved.
— Locations G: The high near-surface resistivity
observed towards the southeastern end of both lines
corresponds with several large granite outcrops
observed in the field. Somewhat surprisingly, there
are only a few areas where the strong resistor reaches
the surface, despite the numerous outcrops observed
along both lines. The numerous topographically
high areas were originally thought to be more
resistive outcrops below the surface. The inversions,
however, indicate that most of these areas are of
only moderate resistivity, and although they may
still be granitic, are most likely decomposed and
potentially have clay-filled joints and fractures.
The large, low-resistivity valley observed at
locations E in Fig. 7 indicates a likely pathway for
increased groundwater seepage flow underneath the
dam. This conclusion is supported by the fact that this
location also corresponds very well with the self-
potential anomaly at location A in Fig. 4 that indicates
upward seepage flow in this location. In general, it is
likely that the geometry of the more competent (more
resistive) bedrock is a strong controlling factor for
subsurface flow paths. Regions of thicker alluvium and
(or) weathered granite will be preferential pathways for
flow. This subsurface structural geometry, in conjunc-
tion with the surface topography, is likely the largest
factor contributing to the observed seepage at Hidden
Dam.
Hydrogeophysical Simulations
Two-dimensional flow simulations that are repre-
sentative of likely hydrogeologic scenarios at Hidden
Dam are carried out to supplement information about
seepage provided by the geophysical surveys reported
here and historical piezometer and observation well
data. Hydrogeologic models for the flow simulations are
based on information from the dam foundation report
and known hydrogeology of the site (Cedergren, 1980a,
1980b; U.S. Army Corps of Engineers, 1977), and are
also guided by the geophysical results discussed above.
The finite element modeling package, COMSOL Multi-
physics, is utilized to solve the steady-state Richards
equation for variably saturated flow (Freeze and
Cherry, 1979), where the van Genuchten (van Genuch-
ten, 1980) parameterization is used to describe the
saturation-dependent hydraulic properties, as described
in the Appendix.
Additionally, bulk electrical resistivity is predicted
for the various flow scenarios by incorporating the
dynamically calculated saturation into Archie’s law
(Archie, 1942), and the self-potential response is
predicted by coupling the flow equations to the
governing equations for electrokinetic flow within
COMSOL, which is also described in the Appendix.
Dynamically coupling flow simulations with geophysical
responses can be a powerful survey design tool to test
the sensitivity of various geophysical measurements to
the expected subsurface behavior (Minsley et al., 2010),
and can also be used to evaluate the validity of the
assumed hydrogeologic model by comparing measured
data with predicted responses.
Figure 8 shows the basic model geometry used for
the flow simulations, where the geometry and hydraulic
properties of the various embankment units are derived
from the foundation report (U.S. Army Corps of
Engineers, 1977) as discussed in the Appendix. The
topography of the downstream surface is extracted from
a digital elevation model at the Hidden Dam site along
two different profiles (Fig. 1), and helps to provide a
realistic representation of topographic controls on
seepage. The relevant hydraulic properties for the
various units in Fig. 8 are summarized in Table 2.
For each of the five different modeling scenarios
outlined in Table 3, flow simulations are run for
reservoir elevations between 480 ft (146 m) and 540 ft
(165 m). These flow scenarios are meant to be re-
presentative of changes in internal structure and
foundation properties that are found along the length
of the dam. At each reservoir elevation, predictions can
be made for flow throughout the model, saturation,
seepage at the ground surface, subsurface pressure, bulk
electrical resistivity, or self-potential. Comparing the
Journal of Environmental and Engineering Geophysics eego-16-04-01.3d 12/10/11 13:23:27 155 Cust # 10018
155
Minsley et al.: Hydrogeophysical Investigations at Hidden Dam
predictions with piezometer and observation well data,
along with the results of the geophysical surveys,
provides useful insight into the likely conditions at the
dam.
Figure 9 shows the flow modeling results for flow
scenario 1 at simulated reservoir elevations 485 ft
(148 m) (A), 510 ft (155 m) (B), and 540 ft (165 m)
(C). There is a clear increase in seepage through the
upstream portion of the embankment and foundation,
as indicated by the flow arrows. Increased saturation in
the upstream embankment, as well as some of the
downstream high-topography areas, is also observed
with increasing reservoir elevation. The efficacy of the
downstream horizontal drainage fill (df) is evident in
this scenario compared with scenario 3 (not shown), as it
redirects potentially erosive upwards seepage away from
the embankment and out the toe of the dam. Addition-
ally, these modeling results illustrate the focusing effect
that the downstream low-topography areas have on
seepage patterns. This is consistent with the previous
observations of seepage at Hidden Dam (Cedergren,
1980a) and the need for the downstream drainage
blanket.
Figure 10 illustrates examples of several of the
quantitative predictions that can be made from the
coupled flow simulations. In Fig. 10(A), outward flux
through the surface of the downstream portion of the
dam and along the downstream topography is displayed
for the three different reservoir elevations shown in
Fig. 9. The sharp, large outward flux observed at
approximately 275 ft (84 m) coincides with the outlet of
the high-hydraulic conductivity drainage fill (df) that
drains the embankment material. The other spikes in
outward flux between 280–400 ft (85–122 m) and 900–
1,000 ft (274–305 m) are caused by seepage being focused
in the low-topography areas downstream of the dam.
Figure 10(B) shows the predicted self-potential
response for the same profile and reservoir elevations as
Journal of Environmental and Engineering Geophysics eego-16-04-01.3d 12/10/11 13:23:27 156 Cust # 10018
Figure 8. Model geometry and domains used for the scenario 1 flow model. Distances in meters equal 0.3048 times
distances in feet. Hydraulic conductivity in meters per day equals 0.3048 times hydraulic conductivity in feet per day.
Table 2. Baseline parameters for each Hidden Dam unit used in the variably saturated flow model.