824 VOLUME 22 NUMBER 10 OCTOBER 2015 nature structural & molecular biology
a r t i c l e s
microRNAs (miRs) are a class of small (~22-nt) genomically encoded molecules that inhibit translational initiation and stimulate decay of mRNA targets1,2. miRs are transcribed by RNA polymerase II and proc-essed by the RNase III enzymes—Dicer and Drosha with its binding partner, DGCR8—to produce short double-stranded RNAs in the nucleus. One strand associates with the Argonaute (Ago) protein, thus forming the miR-mediated silencing complex (miRISC). miRs guide the pairing of miRISC, with imperfect complementarity, to sequences in target mRNAs, thus resulting in their subsequent destabilization and translational repression of the target3. The ‘seed sequence’, at nucleotides 2–8, is a key determinant for miRISC-target recognition4,5. Recent data have shown that 35–40% of miR-binding sites are found in 3′ untranslated regions (UTRs), 40–50% in coding regions and <5% in 5′-UTR regions of mRNAs6,7. More than 60% of the human transcriptome has been predicted to be under miR regulation, thus making this post-transcriptional control pathway as important as protein pathways in the regulation of cell functions2. It is clear that miRs have essential roles in regulating diverse functions in normal and diseased cells8,9.
L1 belongs to the most abundant class of autonomous transposable elements10. Human L1 contains two open reading frames, ORF1 and ORF2, which encode a protein with RNA-binding and nucleotide acid–chaperone activity (ORF1)11 and a protein with endonuclease and reverse-transcriptase activities (ORF2)12–15, respectively. L1 mobilizes replicatively from one location in the genome to another by a ‘copy-and-paste’ mechanism, and it has been proposed to be a remnant of an ancient retrovirus12,16. Active and inactive L1s have been implicated in the evolution of mammalian genomes and are linked to cell-based diseases, including cancer17–19. In addition, somatic L1 insertions are biased toward regions of cancer-specific
DNA hypomethylation, thus suggesting that L1 insertions may provide a selective advantage during tumorigenesis20. Mechanisms that operate at different levels in gene-expression hierarchies have been selected to control transposition-mediated mutagenesis and mitigate the potential negative effects of newly inserted elements. In germ cells, a specific small-RNA subtype (piwi-interacting RNAs (piRNAs)) efficiently counteracts L1 activity, but these RNAs are not expressed in nongerm cells21,22. Somatic cells attenuate element mobi-lization by DNA methylation of the L1 promoter23. Other methods of regulation are mediated by APOBEC proteins24,25, microproces-sor interactions26 and Ago-mediated RNA interference in mouse embryonic stem cells27. L1-promoter silencing is greatly attenuated, and L1 transcription is reactivated in hypomethylated cells, such as cancer cells and tumor-initiating cells, and is also reactivated during reprogramming28–30. Because miRs act as regulators of gene expres-sion and in antiviral defense mechanisms, we posited that they may also protect nongerm cells from encoded pathogenic assaults, such as L1 retrotransposition.
Here we show that miRs indeed bind directly to L1 ORF2 RNA, thus leading to decreases in full-length (FL) L1 RNA as well as de novo retrotransposition and integration events. Thus, we have uncovered a new mechanism in which miRs restrict L1 mobiliza-tion and L1-associated mutations in cancer cells, cancer-initiating cells and iPSCs.
RESULTSiPSCsexpresselevatedL1ORF2levelsiPSCs and human embryonic stem cells (hESCs) are characterized by a global genomic hypomethylation state as well as the specific hypomethylation of the L1 promoter28. In order to assess L1 activity
1Department of Molecular Biology and Biochemistry, Francisco J. Ayala School of Biological Sciences, University of California, Irvine, Irvine, California, USA. 2Regulus Therapeutics, San Diego, California, USA. 3These authors contributed equally to this work. Correspondence should be addressed to I.M.P. ([email protected]).
Received 22 December 2014; accepted 19 August 2015; published online 14 September 2015; doi:10.1038/nsmb.3090
miR-128 represses L1 retrotransposition by binding directly to L1 RNAMatthias Hamdorf1,3, Adam Idica1,3, Dimitrios G Zisoulis2,3, Lindsay Gamelin1, Charles Martin1, Katie J Sanders1 & Irene M Pedersen1
nature structural & molecular biology VOLUME 22 NUMBER 10 OCTOBER 2015 825
in iPSC lines, we first developed an efficient RNA-only (miR and mRNA) reprogramming strategy, as a means to obtain iPSCs from skin fibroblasts (RNA-iPSCs) (Fig. 1a). In brief, RNA-iPSCs are repro-grammed from human skin fibroblasts by a single transfection of an miR cocktail (miR-200c, miR-302a–d and miR-369)31 and subsequent daily transfections of mature mRNA transcripts encoding Klf4, Oct4, Sox2, c-Myc and Lin28 for 10–12 d, until the formation of mature iPSC colonies32 (Fig. 1b). The RNA-iPSCs express the cell-surface proteins TRA-1-60 and SSEA4 and the mRNAs of the transcription-factor genes POU5F1 (here denoted OCT4), NANOG, LIN28A, SOX2, DNMT3B, FOXD3 and TERT, which are associated with pluripotency, at abundance levels similar to those found in hESCs (H9 cells) and commercially available iPSC lines (IMR-90) (Fig. 1b–d).
L1 activity in the generated iPSC lines (RNA-iPSCs) as well as IMR90, H9 and a teratoma cell line (Tera-1) was elevated, and all lines expressed L1 RNA at orders of magnitude higher than did parental skin (hBJ) cells (Fig. 1e). These results support the conclusion that reprogramming by different methodologies renders cells vulnerable to genomic instability caused by retrotransposition.
Identificationofretrotransposition-repressormiRsWe have shown previously that miRs can directly target hepatitis C viral RNA to repress viral replication33, thus raising the possibility that miRs could similarly repress L1 activity in hypomethylated somatic cells. Furthermore, depletion of three of the main proteins
involved in miR biogenesis and miR function (Dicer, DGCR8 and Ago) in different cell types results in significantly increased L1 activity26,27. To test whether miRs regulate L1 activity in somatic cells, we designed a lentiviral-based knockdown strategy in which libraries of expressed short hairpin RNAs (shRNAs) with anti-miR activity were used to neutralize endogenous miRs in HeLa cells. This approach favors a physiologically relevant response by avoiding potential arti-facts resulting from ectopic overexpression occurring in miR-mimic library screens. We used a reporter construct encoding FL L1 mRNA and a luciferase retrotransposition-indicator cassette to identify miRs involved in repressing L1 activity34 (Supplementary Data Set 1). The luciferase protein can be translated into a functional enzyme only after retrotransposition of a spliced L1 transcript, thus allowing the quantification of cells with new retrotransposition events in culture34. We used a cotransfected Renilla reporter construct to normalize for potential differences in cell proliferation. Transient transfec-tion of the reporter plasmids into the isolated shRNA anti-miR– transduced HeLa clones identified clones with significantly higher luciferase activity indicative of enhanced L1 retrotransposition activ-ity (Fig. 2a). Twice in independent clones, we identified a capacity of anti–miR-128 to derepress L1 activity at a significant level (Fig. 2a). We verified that HeLa cells express miR-128 (Supplementary Fig. 1), and we validated the primary screen data by generating anti–miR-128 shRNA lentiviruses at high titer, transducing them into HeLa cells and then selecting with puromycin. We observed a highly significant
2,000
8,000
4,000
0
hBJ H9
IMR90
-1
RNA-iPSC-1
RNA-iPSC-3
RNA-iPSC-2
RNA-iPSC-4
RNA-iPSC-5
RNA-iPSC-6
RNA-iPSC-7
SOX2 7,500
5,000
2,500
0
hBJ H9
IMR90
-1
RNA-iPSC-1
RNA-iPSC-3
RNA-iPSC-2
RNA-iPSC-4
RNA-iPSC-5
RNA-iPSC-6
RNA-iPSC-7
Rel
ativ
e m
RN
A le
vels
2,500
2,000
1,500
1,000
500
0
hBJ H9
IMR90
-1
RNA-iPSC-1
RNA-iPSC-3
RNA-iPSC-2
RNA-iPSC-4
RNA-iPSC-5
RNA-iPSC-6
RNA-iPSC-7
NANOGd OCT4
Fibroblasts
Day 3 Day 5 Day 8
Day 10Day 10
TRA-1-60 SSEA-4
Day 10
iPSCs
10–12 d
miRs mRNAsa
b
H9 IMR90
-1
RNA-iPSC
hBJ
H 2O
OCT4
NANOG
LIN28A
SOX2
DNMT3B
FOXD3
TERT
B2M
c
Rel
ativ
e le
vels
of L
1 O
RF
2 m
RN
A
200
150
100
50
0
hBJ
RNA-iPSC-3
RNA-iPSC-2
RNA-iPSC-1
IMR90
-1
hES-H
9
Tera-
1
e
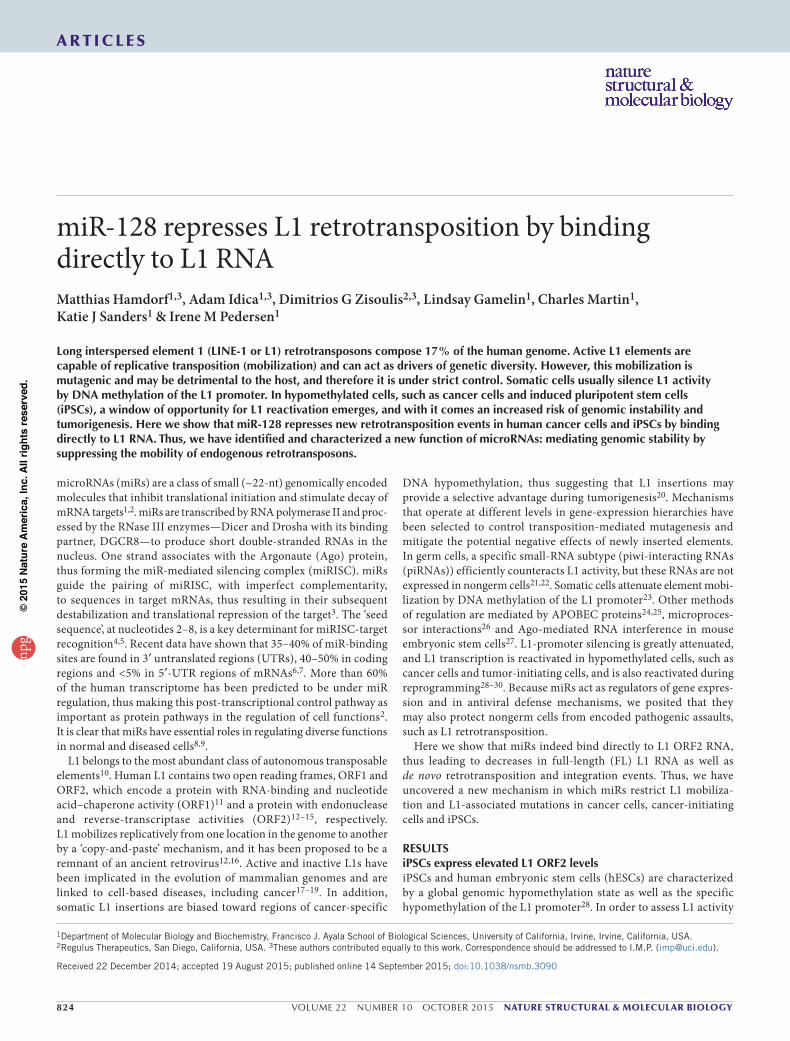
Figure 1 L1 activity is derepressed in hESCs, iPSCs and teratoma cells. (a) Schematic diagram of the RNA-only reprogramming protocol in human fibroblasts. Human BJ foreskin fibroblasts (hBJ) are reprogrammed into RNA-iPSCs by initial transfection with a cocktail of miRs (miR-200c, miR-302s and miR-369 family); this is followed by transfection of transcription-factor mRNAs (encoding Klf4, Oct4, Sox2, c-Myc and Lin28) for 10–12 d. (b) Phase-contrast images of RNA-iPSCs on days 3, 5, 8 and 10 of reprogramming. Immunofluorescence staining of RNA-iPSCs on day 10 for the surface pluripotency-associated markers TRA-1-60 and SSEA-4. Scale bars, 400 µm. (c) mRNA expression levels, determined by RT-PCR, of the pluripotency-associated genes OCT4, NANOG, LIN28A, SOX2, DNMT3B, FOXD3 and TERT relative to β-2-microglobulin (B2M) mRNAs in H9 hESCs, IMR90-1 iPSCs, RNA-iPSCs and hBJ fibroblasts. One representative experiment of three is shown. (d) Quantification of mRNA levels of NANOG, SOX2 and OCT4 in hBJ fibroblasts, H9 hESCs, IMR90-1 iPSCs and seven RNA-iPSC lines by qPCR, normalized to B2M. (n = 2 technical replicates; bars represent range of values). (e) Quantification of L1 ORF2 RNA in hBJ fibroblasts, Tera-1 teratoma cells, H9 hESCs, IMR90-1 iPSCs and three RNA-iPSC lines by qPCR, normalized to B2M (n = 2 technical replicates; bars represent range of values).
826 VOLUME 22 NUMBER 10 OCTOBER 2015 nature structural & molecular biology
a r t i c l e s
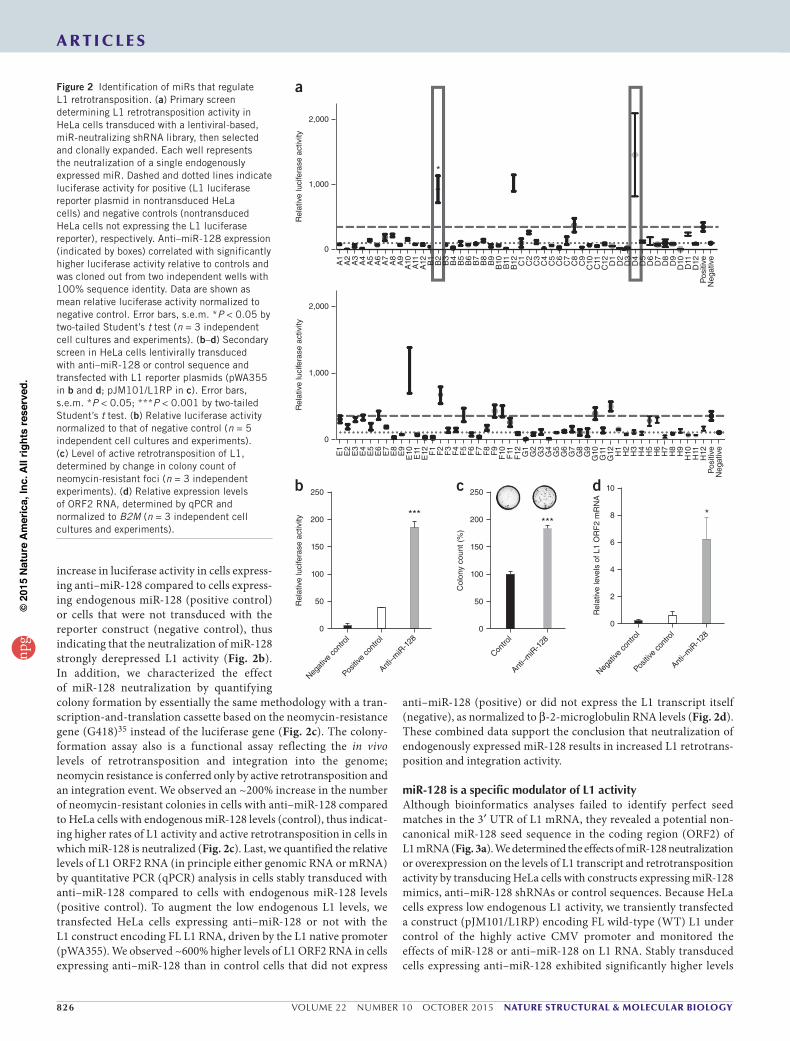
increase in luciferase activity in cells express-ing anti–miR-128 compared to cells express-ing endogenous miR-128 (positive control) or cells that were not transduced with the reporter construct (negative control), thus indicating that the neutralization of miR-128 strongly derepressed L1 activity (Fig. 2b). In addition, we characterized the effect of miR-128 neutralization by quantifying colony formation by essentially the same methodology with a tran-scription-and-translation cassette based on the neomycin-resistance gene (G418)35 instead of the luciferase gene (Fig. 2c). The colony- formation assay also is a functional assay reflecting the in vivo levels of retrotransposition and integration into the genome; neomycin resistance is conferred only by active retrotransposition and an integration event. We observed an ~200% increase in the number of neomycin-resistant colonies in cells with anti–miR-128 compared to HeLa cells with endogenous miR-128 levels (control), thus indicat-ing higher rates of L1 activity and active retrotransposition in cells in which miR-128 is neutralized (Fig. 2c). Last, we quantified the relative levels of L1 ORF2 RNA (in principle either genomic RNA or mRNA) by quantitative PCR (qPCR) analysis in cells stably transduced with anti–miR-128 compared to cells with endogenous miR-128 levels (positive control). To augment the low endogenous L1 levels, we transfected HeLa cells expressing anti–miR-128 or not with the L1 construct encoding FL L1 RNA, driven by the L1 native promoter (pWA355). We observed ~600% higher levels of L1 ORF2 RNA in cells expressing anti–miR-128 than in control cells that did not express
anti–miR-128 (positive) or did not express the L1 transcript itself (negative), as normalized to β-2-microglobulin RNA levels (Fig. 2d). These combined data support the conclusion that neutralization of endogenously expressed miR-128 results in increased L1 retrotrans-position and integration activity.
miR-128isaspecificmodulatorofL1activityAlthough bioinformatics analyses failed to identify perfect seed matches in the 3′ UTR of L1 mRNA, they revealed a potential non-canonical miR-128 seed sequence in the coding region (ORF2) of L1 mRNA (Fig. 3a). We determined the effects of miR-128 neutralization or overexpression on the levels of L1 transcript and retrotransposition activity by transducing HeLa cells with constructs expressing miR-128 mimics, anti–miR-128 shRNAs or control sequences. Because HeLa cells express low endogenous L1 activity, we transiently transfected a construct (pJM101/L1RP) encoding FL wild-type (WT) L1 under control of the highly active CMV promoter and monitored the effects of miR-128 or anti–miR-128 on L1 RNA. Stably transduced cells expressing anti–miR-128 exhibited significantly higher levels
***
2,000
Rel
ativ
e lu
cife
rase
act
ivity
Rel
ativ
e lu
cife
rase
act
ivity
Rel
ativ
e lu
cife
rase
act
ivity
Col
ony
coun
t (%
)
Rel
ativ
e le
vels
of L
1 O
RF
2 m
RN
A
1,000
0
*
2,000
1,000
0
250
****
200
150
100
50
0
Negat
ive co
ntro
l
Positiv
e co
ntro
l
Contro
l
Anti–m
iR-1
28
Negat
ive co
ntro
l
Positiv
e co
ntro
l
Anti–m
iR-1
28
Anti–m
iR-1
28
250 10
8
6
4
2
0
200
150
100
50
0
A1
A2
A3
A4
A5
A6
A7
A8
A9
A10
A11
A12 B1
B2
B3
B4
B5
B6
B7
B8
B9
B10
B11
B12 C1
C2
C3
C4
C5
C6
C7
C8
C9
C10
C11
C12 D1
D2
D3
D4
D5
D6
D7
D8
D9
D10
D11
D12
E1
E2
E3
E4
E5
E6
E7
E8
E9
E10
E11
E12 F1
F2
F3
F4
F5
F6
F7
F8
F9
F10 F11
F12 G1
G2
G3
G4
G5
G6
G7
G8
G9
G10
G11
G12 H1
H2
H3
H4
H5
H6
H7
H8
H9
H10
H11
H12
Pos
itive
Neg
ativ
eP
ositi
veN
egat
ive
a
b c d
Figure 2 Identification of miRs that regulate L1 retrotransposition. (a) Primary screen determining L1 retrotransposition activity in HeLa cells transduced with a lentiviral-based, miR-neutralizing shRNA library, then selected and clonally expanded. Each well represents the neutralization of a single endogenously expressed miR. Dashed and dotted lines indicate luciferase activity for positive (L1 luciferase reporter plasmid in nontransduced HeLa cells) and negative controls (nontransduced HeLa cells not expressing the L1 luciferase reporter), respectively. Anti–miR-128 expression (indicated by boxes) correlated with significantly higher luciferase activity relative to controls and was cloned out from two independent wells with 100% sequence identity. Data are shown as mean relative luciferase activity normalized to negative control. Error bars, s.e.m. *P < 0.05 by two-tailed Student’s t test (n = 3 independent cell cultures and experiments). (b–d) Secondary screen in HeLa cells lentivirally transduced with anti–miR-128 or control sequence and transfected with L1 reporter plasmids (pWA355 in b and d; pJM101/L1RP in c). Error bars, s.e.m. *P < 0.05; ***P < 0.001 by two-tailed Student’s t test. (b) Relative luciferase activity normalized to that of negative control (n = 5 independent cell cultures and experiments). (c) Level of active retrotransposition of L1, determined by change in colony count of neomycin-resistant foci (n = 3 independent experiments). (d) Relative expression levels of ORF2 RNA, determined by qPCR and normalized to B2M (n = 3 independent cell cultures and experiments).
nature structural & molecular biology VOLUME 22 NUMBER 10 OCTOBER 2015 827
a r t i c l e s
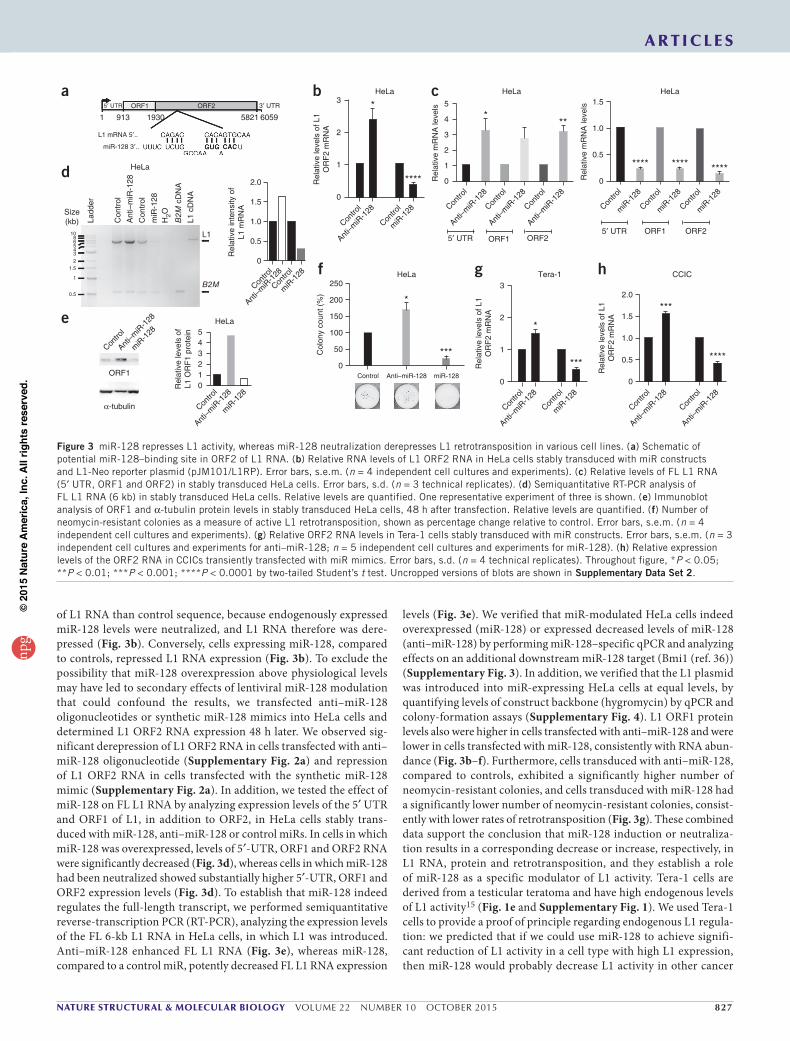
of L1 RNA than control sequence, because endogenously expressed miR-128 levels were neutralized, and L1 RNA therefore was dere-pressed (Fig. 3b). Conversely, cells expressing miR-128, compared to controls, repressed L1 RNA expression (Fig. 3b). To exclude the possibility that miR-128 overexpression above physiological levels may have led to secondary effects of lentiviral miR-128 modulation that could confound the results, we transfected anti–miR-128 oligonucleotides or synthetic miR-128 mimics into HeLa cells and determined L1 ORF2 RNA expression 48 h later. We observed sig-nificant derepression of L1 ORF2 RNA in cells transfected with anti– miR-128 oligonucleotide (Supplementary Fig. 2a) and repression of L1 ORF2 RNA in cells transfected with the synthetic miR-128 mimic (Supplementary Fig. 2a). In addition, we tested the effect of miR-128 on FL L1 RNA by analyzing expression levels of the 5′ UTR and ORF1 of L1, in addition to ORF2, in HeLa cells stably trans-duced with miR-128, anti–miR-128 or control miRs. In cells in which miR-128 was overexpressed, levels of 5′-UTR, ORF1 and ORF2 RNA were significantly decreased (Fig. 3d), whereas cells in which miR-128 had been neutralized showed substantially higher 5′-UTR, ORF1 and ORF2 expression levels (Fig. 3d). To establish that miR-128 indeed regulates the full-length transcript, we performed semiquantitative reverse-transcription PCR (RT-PCR), analyzing the expression levels of the FL 6-kb L1 RNA in HeLa cells, in which L1 was introduced. Anti–miR-128 enhanced FL L1 RNA (Fig. 3e), whereas miR-128, compared to a control miR, potently decreased FL L1 RNA expression
levels (Fig. 3e). We verified that miR-modulated HeLa cells indeed overexpressed (miR-128) or expressed decreased levels of miR-128 (anti–miR-128) by performing miR-128–specific qPCR and analyzing effects on an additional downstream miR-128 target (Bmi1 (ref. 36)) (Supplementary Fig. 3). In addition, we verified that the L1 plasmid was introduced into miR-expressing HeLa cells at equal levels, by quantifying levels of construct backbone (hygromycin) by qPCR and colony-formation assays (Supplementary Fig. 4). L1 ORF1 protein levels also were higher in cells transfected with anti–miR-128 and were lower in cells transfected with miR-128, consistently with RNA abun-dance (Fig. 3b–f). Furthermore, cells transduced with anti–miR-128, compared to controls, exhibited a significantly higher number of neomycin-resistant colonies, and cells transduced with miR-128 had a significantly lower number of neomycin-resistant colonies, consist-ently with lower rates of retrotransposition (Fig. 3g). These combined data support the conclusion that miR-128 induction or neutraliza-tion results in a corresponding decrease or increase, respectively, in L1 RNA, protein and retrotransposition, and they establish a role of miR-128 as a specific modulator of L1 activity. Tera-1 cells are derived from a testicular teratoma and have high endogenous levels of L1 activity15 (Fig. 1e and Supplementary Fig. 1). We used Tera-1 cells to provide a proof of principle regarding endogenous L1 regula-tion: we predicted that if we could use miR-128 to achieve signifi-cant reduction of L1 activity in a cell type with high L1 expression, then miR-128 would probably decrease L1 activity in other cancer
Rel
ativ
e le
vels
of L
1O
RF
2 m
RN
A
3
2
HeLa
*
****
1
0
Contro
l
Contro
l
Anti–m
iR-1
28
miR
-128
b
2.0
1.5
1.0R
elat
ive
inte
nsity
of
L1 m
RN
A0.5
0
Contro
l
Contro
l
Anti–m
iR-1
28
miR
-128
1 913
ORF1
α-tubulin
Rel
ativ
e le
vels
of
L1 O
RF
1 pr
otei
n 543210
Contro
l
Anti–m
iR-1
28
miR
-128
1930 5821 6059
5′ UTR 3′ UTR
HeLa
Contro
l
Anti–m
iR-1
28
miR
-128
ORF1 ORF2
L1 mRNA 5′..
miR-128 3′..
HeLa
10865432
1.5
1
0.5
Ladd
er
Con
trol
Con
trol
Ant
i–m
iR-1
28
miR
-128
H2O
B2M
cD
NA
L1 c
DN
A
L1
B2M
Size(kb)
a
d
e
Rel
ativ
e le
vels
of L
1O
RF
2 m
RN
A
Tera-1
*
***
3
2
1
0
Contro
l
miR
-128
Contro
l
Anti–m
iR-1
28
g
Rel
ativ
e le
vels
of L
1O
RF
2 m
RN
A
CCIC
***
****
1.5
2.0
1.0
0.5
0
Contro
l
Anti–m
iR-1
28
Contro
l
Anti–m
iR-1
28
h
Col
ony
coun
t (%
)
HeLa250
200
150
100
50
0Control Anti–miR-128 miR-128
*
***
f
Rel
ativ
e m
RN
A le
vels
5′ UTR ORF1 ORF2
HeLa1.5
1.0
0.5
0
Contro
l
miR
-128
Contro
l
miR
-128
Contro
l
miR
-128
**** **** ****
Rel
ativ
e m
RN
A le
vels
5′ UTR ORF1 ORF2
HeLa
5
4
3
2
1
0
***
Contro
l
Anti–m
iR-1
28
Contro
l
Anti–m
iR-1
28
Contro
l
Anti–m
iR-1
28
c
Figure 3 miR-128 represses L1 activity, whereas miR-128 neutralization derepresses L1 retrotransposition in various cell lines. (a) Schematic of potential miR-128–binding site in ORF2 of L1 RNA. (b) Relative RNA levels of L1 ORF2 RNA in HeLa cells stably transduced with miR constructs and L1-Neo reporter plasmid (pJM101/L1RP). Error bars, s.e.m. (n = 4 independent cell cultures and experiments). (c) Relative levels of FL L1 RNA (5′ UTR, ORF1 and ORF2) in stably transduced HeLa cells. Error bars, s.d. (n = 3 technical replicates). (d) Semiquantitative RT-PCR analysis of FL L1 RNA (6 kb) in stably transduced HeLa cells. Relative levels are quantified. One representative experiment of three is shown. (e) Immunoblot analysis of ORF1 and α-tubulin protein levels in stably transduced HeLa cells, 48 h after transfection. Relative levels are quantified. (f) Number of neomycin-resistant colonies as a measure of active L1 retrotransposition, shown as percentage change relative to control. Error bars, s.e.m. (n = 4 independent cell cultures and experiments). (g) Relative ORF2 RNA levels in Tera-1 cells stably transduced with miR constructs. Error bars, s.e.m. (n = 3 independent cell cultures and experiments for anti–miR-128; n = 5 independent cell cultures and experiments for miR-128). (h) Relative expression levels of the ORF2 RNA in CCICs transiently transfected with miR mimics. Error bars, s.d. (n = 4 technical replicates). Throughout figure, *P < 0.05; **P < 0.01; ***P < 0.001; ****P < 0.0001 by two-tailed Student’s t test. Uncropped versions of blots are shown in Supplementary Data Set 2.
828 VOLUME 22 NUMBER 10 OCTOBER 2015 nature structural & molecular biology
a r t i c l e s
cell lines as well. Stably transduced Tera-1 cells expressing anti–miR-128 shRNAs, com-pared to controls, significantly derepressed L1 ORF2 RNA expression, and miR-128 significantly repressed L1 ORF2 RNA expression (Fig. 3h). Transient transfec-tion of anti–miR-128 or miR-128 (Supplementary Fig. 2b) and quantification of FL L1 RNA (Supplementary Fig. 2c) confirmed these results. Furthermore, because tumor-initiating cells can drive tumor progression37, regulation of L1-induced mutagenesis of such cell types would be of importance. We found that transient trans-fection of colon cancer–initiating cells (CCICs) with miR-128 significantly reduced L1 RNA expression, whereas miR-128 neu-tralization by anti–miR-128 enhanced L1 RNA expression relative to that of controls (Fig. 3h). In addition, we analyzed the effect of miR-128 on L1 activity in two additional tumor cell lines (non–small cell lung cancer cells (H23) and transformed human embryonic kidney cells (HEK293T)). As expected, miR-128 regulated L1 RNA expression in H23 and HEK293T cells in a similar manner as that observed for HeLa, Tera-1 and CCIC cells (Supplementary Fig. 2d). In summary, these results support the conclusion that miR-128 is a specific modulator of induced as well as endogenous L1 RNA levels in cancer cells, teratoma cells and CCICs, and that miR-128 additionally regulates L1 ORF1 protein levels and de novo L1 retrotransposition and integration.
miR-128repressesL1activityiniPSCsFinally, we wished to test whether miR-128 could be used as a tool to decrease the high L1 activity, as determined by the high ORF2 expression levels observed in iPSCs (Fig. 1e). miR-128 significantly decreased L1 ORF2 RNA expression in four different iPSC lines (reprogrammed with KOSM factors or RNA transfections) compared to parental control-miR iPSC lines (Fig. 4a). In contrast, anti–miR-128 substantially enhanced L1 ORF2 RNA expression in all iPSC lines
compared to parental control-miR iPSCs (Fig. 4a). We verified endogenously expressed miR-128, as well as expression levels of miR-128 in miR-128-iPSCs and anti–miR-128-iPSCs as previously described (Supplementary Figs. 3–5). We next tested the effect of miR-128 modulation on FL L1 RNA degradation in iPSCs, as determined by expression levels of the 5′ UTR, ORF1 and ORF2 by qPCR, and found that miR-128 significantly decreased the expres-sion of FL L1 RNA (Fig. 4b), whereas anti–miR-128 substantially increased the expression of FL L1 RNA (Fig. 4b). In addition, miR-128 decreased L1 ORF1 protein expression, and anti–miR-128 increased ORF1 protein expression in iPSCs, as determined by immunoblot analysis (Fig. 4c). Finally we wished to determine de novo ret-rotransposition events in iPSCs. To this end, we generated stable miR-128, anti–miR-128 and control-miR iPSC lines, into which we introduced the neomycin-resistance L1 reporter cassette and meas-ured new retrotransposition and integration events of L1 in iPSCs. miR-128 significantly decreased retrotransposition and integra-tion of L1 into the genome of iPSCs (Fig. 4d), and neutralization of miR-128 strongly increased retrotransposition, as determined by colony-formation assays (Fig. 4d). These results suggest that miR-128 is a specific regulator of endogenous L1 RNA levels, regulating L1 ORF1 protein levels and de novo retrotransposition and the integration of L1 into the genome of iPSCs.
miR-128repressesL1activitybydirectbindingtoL1RNAmiR-128 could potentially regulate L1 expression by directly inter-acting with L1 RNA, regulating expression of other proteins that regulate L1, or both. To address the possibility that miR-128 directly
2.02.5
2.0
1.5
1.0
0.5
0
2.5
2.0
1.5
1.0
0.5
0
1.5
1.0
0.5
IMR90 IMR90
5′ UTR ORF1 ORF2
RNA-iPSC-1 RNA-iPSC
******
Contro
l
Anti–m
iR-1
28
Anti–m
iR-1
28
miR
-128
Contro
l Contro
l
Anti–m
iR-1
28
Contro
l
Anti–m
iR-1
28
Contro
l
Anti–m
iR-1
28
Contro
l
Anti–m
iR-1
28
Contro
l
Anti–m
iR-1
28
Contro
l
Anti–m
iR-1
28
miR
-128
Rel
ativ
e le
vels
of L
1 O
RF
2 m
RN
A
Rel
ativ
e le
vels
of L
1 O
RF
2 m
RN
A
Rel
ativ
e R
NA
leve
ls
Rel
ativ
e R
NA
leve
ls
*
*
* *** ***
5′ UTR ORF1 ORF2
0
3
2
1
0
*
1.5
1.0
0.5
0
1.5
1.0
0.5
0
2.0
1.5
1.0
0.5
0
IMR90
5′ UTR ORF1 ORF2 5′ UTR ORF1 ORF2
RNA-iPSC-3 RNA-iPSC-7 RNA-iPSC
*******
*
*
**
****
****
Contro
l
Anti–m
iR-1
28
miR
-128
Contro
l
Anti–m
iR-1
28
miR
-128 Con
trol
miR
-128
Contro
l
miR
-128
Contro
l
miR
-128
Contro
l
miR
-128
Contro
l
miR
-128
Contro
l
miR
-128
Rel
ativ
e le
vels
of L
1 O
RF
2 m
RN
A
Rel
ativ
e R
NA
leve
ls
Rel
ativ
e R
NA
leve
ls
***
3
2
1
0
Rel
ativ
e le
vels
of L
1 O
RF
2 m
RN
A
1.5 8.06.04.02.0
1.0
0.5
0
1.5
1.0
0.5
0
IMR90
ORF1
α-tubulin
ORF1
α-tubulin
IMR90
RNA-iPSC
RNA-iPSC
Anti–m
iR-1
28
Contro
l
Contro
l
Anti–m
iR-1
28
miR
-128
miR
-128
Contro
l
Contro
l
Anti–m
iR-1
28
miR
-128
Contro
l
Contro
l
Rel
ativ
e le
vels
of L
1 O
RF
1 pr
otei
n
Rel
ativ
e le
vels
of L
1 O
RF
1 pr
otei
n
500
400
300
200
100
0
IMR90
Anti–miR-128Control miR-128
Col
ony
coun
t (%
)
*
a b
c d
Figure 4 miR-128 represses L1 activity, whereas miR-128 neutralization derepresses L1 retrotransposition in iPSCs. (a) Relative expression levels of ORF2 RNA in IMR90 and RNA-iPSCs 1, 3 and 7, transiently transfected with miR mimics or inhibitors. Error bars, s.d. (n = 3 technical replicates). (b) FL L1 RNA expression levels determined in iPSCs transiently transfected with miR mimics or inhibitors by 5′-UTR, ORF1 and ORF2 qPCR analysis. Error bars, s.d. (numbers of technical replicates: n = 4 for RNA-iPSCs except miR- 128 ORF2, for which n = 3; n = 3 for IMR90, except anti–miR-128 ORF1 and anti–miR-128 ORF2, for which n = 4). (c) Immunoblot analysis of ORF1 and α-tubulin protein levels in iPSCs transduced with miR constructs, 48 h after L1-Neo reporter transfection. Relative levels are quantified. One representative example of two is shown. (d) Number of neomycin-resistant iPSC colonies transduced with miR constructs and transfected with the L1-Neo reporter plasmid, as a measure of active L1 retrotransposition, shown as percentage change relative to control. Error bars, s.e.m. (n = 3 independent experiments). Throughout figure, *P < 0.05; ***P < 0.001; ****P < 0.0001 by two-tailed Student’s t test. Uncropped versions of blots are shown in Supplementary Data Set 2.
nature structural & molecular biology VOLUME 22 NUMBER 10 OCTOBER 2015 829
a r t i c l e s
interacts with L1 RNA, we introduced a silent mutation into the putative miR-128–binding site in ORF2 of L1 RNA (Supplementary Fig. 6a). Luciferase activity was significantly lower than that of con-trols in HeLa cells transfected with the WT L1 construct and mature miR-128, thus supporting the conclusion that miR-128 can bind to the WT L1 RNA sequence and prevent retrotransposition (Fig. 5a). In contrast, HeLa cells transfected with the mutant L1 RNA-binding site and either mature miR-128 or control-miR mimics exhibited luciferase activity at the same levels as in the WT L1 and control-miR cells, consistently with miR-128 no longer binding and repressing reporter-gene expression. As expected, L1 RNA with a perfect match at the miR-128–binding site was strongly repressed by miR-128 (Fig. 5a). To extend the analysis, we mutated the miR-128– binding site in the L1 construct used in Figure 3 to increase the levels of L1 RNA in HeLa cells. The WT L1 expression construct and that with a mutated miR-128–binding site were transfected into HeLa cells stably transduced with miR-128, anti–miR-128 shRNA or control miR. Consistently with previous results, anti–miR-128 derepressed L1 ORF2 RNA expression levels, and miR-128 repressed L1 ORF2 RNA expression levels when the WT L1 plasmid was transfected into HeLa cells (Fig. 5b). In contrast, the construct with the mutated miR-128–binding site showed that expression of miR-128 or control miR failed to downregulate L1 ORF2 levels, thus supporting the conclusion that the introduced mutation at the miR-128–binding site abrogated interaction between miR-128 and the target site, thus resulting in higher levels of L1 RNA (Fig. 5b). The effect of the mutation of the miR–binding site on L1 retro-transposition activity also supported this conclusion: HeLa cells overexpressing miR-128 and the WT plasmid exhibited fewer neomycin-resistant colonies and lower retrotransposition relative to controls, as expected (Fig. 5c). However, when the mutated plasmid was transfected into HeLa cells overexpressing miR-128, or control miR, significantly higher numbers of neomycin-resistant colonies formed (Fig. 5c). Introduction of anti–miR-128, compared to con-trols, neutralized endogenously expressed miR-128 and enhanced L1 expression, as previously shown (Fig. 3b). In a similar manner, induced miR-128 and endogenously expressed miR-128 were inca-pable of binding and repressing mutant L1, thus resulting in two-fold-higher L1 expression levels than in controls. We verified the transfection and transduction efficiency of miR-modulated HeLa cells, as described previously (Supplementary Figs. 3 and 4). Because miR-128 is unable to bind to mutated L1 ORF2 RNA and repress
RNA active retrotransposition, these data support the conclusion that miR-128 represses L1 RNA retrotransposition and integra-tion via a direct interaction with the target site on the ORF2 RNA. L1 RNA in miR-128 mutant-site cells is higher than in controls because miR-128 (overexpressed or endogenously expressed) can-not bind and repress mutant L1 RNA.
miR-128interactswithL1RNATo directly test whether miR-128 binds to L1 RNA, we isolated Ago complexes containing miRs and target mRNAs by immunopurifica-tion from cells expressing miR-128 or anti–miR-128 and assessed relevant complex occupancy by L1 RNA. As expected, the relative level of total L1 RNA was lower in Tera-1 cells stably overexpressing miR-128 than in those expressing anti–miR-128 (Fig. 6a). Despite the lower levels of L1 RNA, Ago-bound L1 RNA was significantly higher in cells overexpressing miR-128 than in cells in which miR-128 was downregulated by anti–miR-128 (Fig. 6b). When we corrected for the higher levels of L1 ORF2 in Tera-1 cells treated with anti–miR-128, the difference in bound L1 RNA was even more significant (corrected anti–miR-128). These results provide direct evidence that miR-128 binds to L1 RNA. We repeated the Ago immunopurification experi-ments in HeLa cells stably transduced with anti–miR-128 or miR-128, which were transfected with L1 expression plasmids (encoding either WT L1 or L1 with a mutant miR-128–binding site). Overexpression of miR-128, compared to transduction with anti–miR-128, led to significantly lower levels of total WT L1 RNA, as observed previously (Fig. 6c). Also as expected, the relative level of total mutant L1 RNA was higher than that of WT L1 RNA in cells transduced with miR-128. The relative level of total L1 RNA was lower in HeLa cells stably overexpressing miR-128 than in those expressing anti–miR-128 (Fig. 6c,d). When we corrected for the higher levels of L1 ORF2 in HeLa cells treated with anti–miR-128, the difference was even more
1.5 4
3
2
1
0
WT +
cont
rol m
iR
WT +
miR
-128
Mut
ant s
ite +
miR
-128
Mut
ant s
ite +
cont
rol m
iR
Perfe
ct m
iR-1
28 si
te +
miR
-128
Mut
ant s
ite +
miR
-128
Mut
ant s
ite +
cont
rol m
iR
WT +
cont
rol m
iR
WT +
miR
-128
1.0
****
Rel
ativ
e lu
cife
rase
act
ivity
Rel
ativ
e L1
mR
NA
leve
ls
0.5
0
*
Contro
l
Anti–m
iR-1
28
miR
-128
miR
-128
+
mut
ant s
ite
Contro
l +
mut
ant s
ite
****
****
***
250
Col
ony
coun
t (%
) 200
150
100
50
0
a b
c
Figure 5 miR-128 represses L1 activity by binding directly to ORF2 RNA. (a) Relative luciferase levels in HeLa cells transfected with constructs expressing Gaussia luciferase fused to the predicted WT binding site of miR-128; a mutated binding site in the L1 open reading frame; positive-control sequence corresponding to the 22-nt perfect match of miR-128; and control or miR-128 constructs, in the combinations indicated, 48 h after transfection. Error bars, s.e.m. (n = 3 independent cell cultures and experiments). (b) Relative expression levels of ORF2 RNA in HeLa cells transduced with lentiviral constructs encoding a control miR or miR-128 and transfected with L1-Neo reporter WT plasmid or mutant L1-Neo reporter plasmid containing the mutated miR-128–binding site (n = 2 independent cell cultures and experiments; bars represent range of values). (c) Change in colony count in L1-transfected HeLa cells transduced with control-miR or miR-128 mimic constructs and transfected with the L1-Neo reporter plasmid encoding WT or mutated miR28–binding sites, as a measure of the level of active L1 retrotransposition. Results are shown as percentage change and are normalized to control miR–transfected cells. Error bars, s.e.m. (n = 3 independent cell cultures and experiments). Throughout figure, *P < 0.05; **P < 0.01; ****P < 0.0001 by two-tailed Student’s t test.
830 VOLUME 22 NUMBER 10 OCTOBER 2015 nature structural & molecular biology
a r t i c l e s
significant (Fig. 6d; corrected anti–miR-128). In addition, even though mutant L1 RNA was expressed at higher levels in cells transduced with miR-128 compared to WT L1, it immu-nopurified less efficiently than WT L1 RNA from miR-128–transduced cells (Fig. 6c,e). When we corrected for the higher levels of L1 ORF2 in mutant-treated HeLa cells, the difference was even more significant (Fig. 6e; corrected anti–miR-128). These results demonstrate that the putative miR-128–binding site in the ORF2 region of L1 RNA is indeed the functional binding site. A control, constitutively expressed transcript of the GAPDH gene did not show altered levels of total RNA in cells transduced with miR-128 or anti–miR-128, or relative differences in Ago immunopurification (Supplementary Fig. 2e).
DISCUSSIONOur findings complement previous work on L1 post-transcriptional regulation by Caceres and colleagues26,38, which identified multi-ple direct binding sites in the L1 5′ UTR for the microprocessor- complex subunit DGCR8 (ref. 38), which binds and cleaves L1 RNA26. Our results expand this work and suggest a scenario in which DGCR8 binds to double-stranded RNA structures of the 5′ UTR of L1 RNA and cleaves L1 in the nucleus; L1 transcripts that escape DGCR8-mediated control are transported out of the nucleus, where a second miR-mediated mechanism regulates their expres-sion levels and represses their effects in the cytoplasm. It is pos-sible that miR-128 also affects translational repression of L1 RNA and/or represses transcription of L1; however, our results indicate that RNA degradation is the main mechanism by which miR-128 represses L1 activity.
Genomic alignment analysis of human, chimpanzee, rat and mouse sequences interestingly shows that the miR-128–binding site in L1 ORF2 is 100% conserved between humans and chimpanzees,
and partly conserved (one or two mismatches) in mice and rats (Supplementary Fig. 6b). From our findings, we propose that miRs (miR-128) have adopted part of piRNAs’ role in nongerm cells21 by binding directly to the ORF2 of L1 RNA, thus resulting in L1 repression and decreasing the risk of genomic instability. These results suggest that miRs, in addition to being key regulatory molecules, have evolved to protect somatic cells (including cancer cells, cancer-initiating cells and iPSCs) from pathogenic RNA molecules originating from extracellular sources, such as RNA viruses, or from intracellular encoded sources, such as retrotransposons, thereby taking on an important function as protectors of genomic stability (Fig. 6f).
METHODSMethods and any associated references are available in the online version of the paper.
Note: Any Supplementary Information and Source Data files are available in the online version of the paper.
ACKnowLeDGMentSWe thank J. Moran (University of Michigan Medical School) and M. An (Washington State University) for generously sharing pJM101/L1RP and pWA355 plasmids, M. Waterman (University of California, Irvine) for sharing the CCICs and H. Fan and A. James (University of California, Irvine) for comments and critical reading of the manuscript. This work was supported by the University of California Cancer Research Coordinating Committee 55205 (I.M.P.), American Cancer Society Institutional Research Grant 98- 279-08 (I.M.P.), a University of California Irvine Institute for Memory Impairments and Neurological Disorders grant (I.M.P.), US National Institutes of Health T32 NS082174-02 (K.J.S.) and California Institute of Regenerative Medicine TG2-01152 (A.I.)
2.0
1.5
1.0
0.5
0
Tera
**
miR
-128
Anti–m
iR-1
28
1.5
1.0
0.5
0
***
***
Rel
ativ
e L1
lP fr
actio
n
miR
-128
Anti–m
iR-1
28
Corre
cted
anti–
miR
-128
Rel
ativ
e L1
RN
A le
vels
2.5
2.0
1.5
1.0
0.5
0
Rel
ativ
e L1
RN
A le
vels
*****
miR
-128
Anti–m
iR-1
28
Mut
ated
1.5
1.0
0.5
0
miR
-128
Anti-m
iR-1
28
Corre
cted
anti–
miR
-128
Rel
ativ
e L1
lP fr
actio
n
HeLa HeLa
******
1.5
1.0
0.5
0
miR
-128
Corre
cted
mut
ated
Mut
ated
Rel
ativ
e L1
lP fr
actio
n
miR-128–L1RNA complex
Translation
L1 miR–128–RISC
RibosomeL1ORF2p
L1 RNA
Nucleus
Transcription
Reversetranscriptionand integration
miR-128–Ago
Cytoplasm
miR–viral RNAcomplex
L1 ribonucleoprotein(RNP) complex
Nuclear importRNA virus
L1ORF1p
Tera HeLaa b c d e
f
Figure 6 miR-128 binds directly to L1 ORF2 RNA in cells. (a) Relative L1 ORF2 RNA levels in Tera-1 cells transduced with miR constructs, normalized to GAPDH. Error bars, s.e.m. (n = 3 independent cell cultures and experiments). (b) Relative fraction of L1 ORF2 transcripts associated with Ago complexes, from the same lysates as in a, normalized to input levels. L1 ORF2 immunopurified (IP) fractions normalized to the levels of L1 ORF2 in input are shown as ‘corrected’. Error bars, s.e.m. (n = 3 independent cell cultures and experiments). (c) Relative L1 RNA levels in HeLa cells transduced with miR constructs and L1 WT or mutant reporter plasmid, normalized to GAPDH. Error bars, s.e.m. (n = 3 independent cell cultures and experiments). (d,e) Relative fraction of L1 ORF2 transcripts associated with Ago complexes, from same lysates as in c, normalized to let-7 levels. L1 ORF2 immunopurified fractions normalized to the levels of L1 ORF2 in input are shown as corrected. In d, error bars represent s.e.m. (n = 3 independent cell cultures and experiments); in e, bars represent range (n = 2 independent cell cultures and experiments). Throughout figure, **P < 0.01; ***P < 0.001; ****P < 0.0001 by two-tailed Student’s t test. (f) Model of the multifaceted role of miRs in defense against assault to cellular RNA by agents from the extracellular environment (virus) or intracellular encoded parasites such as L1 retrotransposons.
nature structural & molecular biology VOLUME 22 NUMBER 10 OCTOBER 2015 831
a r t i c l e s
AUtHoR ContRIBUtIonSI.M.P. originally developed the concept, and M.H. further elaborated on it and designed the experiments together with I.M.P. and D.G.Z.; M.H., A.I., D.G.Z. and L.G. performed experiments and analyzed the data. C.M. established the RNA stem cell–reprogramming approach and carried out reprogramming of skin fibroblasts and characterization of iPSCs with A.I. and K.J.S.; I.M.P. wrote the paper with input from D.G.Z, M.H. and A.I., who contributed equally to this work.
COMPETING FINANCIAL INTERESTSThe authors declare no competing financial interests.
Reprints and permissions information is available online at http://www.nature.com/reprints/index.html.
1. Chekulaeva, M. & Filipowicz, W. Mechanisms of miRNA-mediated post-transcriptional regulation in animal cells. Curr. Opin. Cell Biol. 21, 452–460 (2009).
3. Friedman, R.C., Farh, K.K., Burge, C.B. & Bartel, D.P. Most mammalian mRNAs are conserved targets of microRNAs. Genome Res. 19, 92–105 (2009).
4. Sood, P., Krek, A., Zavolan, M., Macino, G. & Rajewsky, N. Cell-type-specific signatures of microRNAs on target mRNA expression. Proc. Natl. Acad. Sci. USA 103, 2746–2751 (2006).
8. Sayed, D. & Abdellatif, M. MicroRNAs in development and disease. Physiol. Rev. 91, 827–887 (2011).
9. Adams, B.D., Kasinski, A.L. & Slack, F.J. Aberrant regulation and function of microRNAs in cancer. Curr. Biol. 24, R762–R776 (2014).
10. Lander, E.S. et al. Initial sequencing and analysis of the human genome. Nature 409, 860–921 (2001).
11. Holmes, S.E., Singer, M.F. & Swergold, G.D. Studies on p40, the leucine zipper motif-containing protein encoded by the first open reading frame of an active human LINE-1 transposable element. J. Biol. Chem. 267, 19765–19768 (1992).
12. Hattori, M., Kuhara, S., Takenaka, O. & Sakaki, Y. L1 family of repetitive DNA sequences in primates may be derived from a sequence encoding a reverse transcriptase-related protein. Nature 321, 625–628 (1986).
13. Xiong, Y. & Eickbush, T.H. Origin and evolution of retroelements based upon their reverse transcriptase sequences. EMBO J. 9, 3353–3362 (1990).
14. Feng, Q., Moran, J.V., Kazazian, H.H. Jr. & Boeke, J.D. Human L1 retrotransposon encodes a conserved endonuclease required for retrotransposition. Cell 87, 905–916 (1996).
15. Fanning, T. & Singer, M. The LINE-1 DNA sequences in four mammalian orders predict proteins that conserve homologies to retrovirus proteins. Nucleic Acids Res. 15, 2251–2260 (1987).
16. Xiong, Y. & Eickbush, T.H. Similarity of reverse transcriptase-like sequences of viruses, transposable elements, and mitochondrial introns. Mol. Biol. Evol. 5, 675–690 (1988).
17. Beck, C.R., Garcia-Perez, J.L., Badge, R.M. & Moran, J.V. LINE-1 elements in structural variation and disease. Annu. Rev. Genomics Hum. Genet. 12, 187–215 (2011).
18. Cordaux, R. & Batzer, M.A. The impact of retrotransposons on human genome evolution. Nat. Rev. Genet. 10, 691–703 (2009).
19. Shukla, R. et al. Endogenous retrotransposition activates oncogenic pathways in hepatocellular carcinoma. Cell 153, 101–111 (2013).
20. Lee, E. et al. Landscape of somatic retrotransposition in human cancers. Science 337, 967–971 (2012).
21. Aravin, A.A., Sachidanandam, R., Girard, A., Fejes-Toth, K. & Hannon, G.J. Developmentally regulated piRNA clusters implicate MILI in transposon control. science 316, 744–747 (2007).
22. Bourc’his, D. & Bestor, T.H. Meiotic catastrophe and retrotransposon reactivation in male germ cells lacking Dnmt3L. Nature 431, 96–99 (2004).
23. Smith, Z.D. et al. A unique regulatory phase of DNA methylation in the early mammalian embryo. Nature 484, 339–344 (2012).
24. Muckenfuss, H. APOBEC3 proteins inhibit human LINE-1 retrotransposition. J. Biol. Chem. 281, 22161–22172 (2006).
25. Horn, A.V. et al. Human LINE-1 restriction by APOBEC3C is deaminase independent and mediated by an ORF1p interaction that affects LINE reverse transcriptase activity. Nucleic Acids Res. 42, 396–416 (2014).
26. Heras, S.R. et al. The Microprocessor controls the activity of mammalian retrotransposons. Nat. Struct. Mol. Biol. 20, 1173–1181 (2013).
27. Ciaudo, C. et al. RNAi-dependent and independent control of LINE1 accumulation and mobility in mouse embryonic stem cells. PLoS Genet. 9, e1003791 (2013).
28. Wissing, S. et al. Reprogramming somatic cells into iPS cells activates LINE-1 retroelement mobility. Hum. Mol. Genet. 21, 208–218 (2012).
29. Fabris, S. et al. Biological and clinical relevance of quantitative global methylation of repetitive DNA sequences in chronic lymphocytic leukemia. Epigenetics 6, 188–194 (2011).
30. Carreira, P.E., Richardson, S.R. & Faulkner, G.J. L1 retrotransposons, cancer stem cells and oncogenesis. FEBS J. 281, 63–73 (2014).
31. Miyoshi, N. et al. Reprogramming of mouse and human cells to pluripotency using mature microRNAs. Cell Stem Cell 8, 633–638 (2011).
32. Warren, L. et al. Highly efficient reprogramming to pluripotency and directed differentiation of human cells with synthetic modified mRNA. Cell Stem Cell 7, 618–630 (2010).
33. Pedersen, I.M. et al. Interferon modulation of cellular microRNAs as an antiviral mechanism. Nature 449, 919–922 (2007).
34. Xie, Y., Rosser, J.M., Thompson, T.L., Boeke, J.D. & An, W. Characterization of L1 retrotransposition with high-throughput dual-luciferase assays. Nucleic Acids Res. 39, e16 (2011).
35. Kimberland, M.L. et al. Full-length human L1 insertions retain the capacity for high frequency retrotransposition in cultured cells. Hum. Mol. Genet. 8, 1557–1560 (1999).
36. Godlewski, J. et al. Targeting of the Bmi-1 oncogene/stem cell renewal factor by microRNA-128 inhibits glioma proliferation and self-renewal. Cancer Res. 68, 9125–9130 (2008).
37. Sikandar, S.S. et al. NOTCH signaling is required for formation and self-renewal of tumor-initiating cells and for repression of secretory cell differentiation in colon cancer. Cancer Res. 70, 1469–1478 (2010).
38. Macias, S. et al. DGCR8 HITS-CLIP reveals novel functions for the Microprocessor. Nat. Struct. Mol. Biol. 19, 760–766 (2012).np
ONLINEMETHODSInduced pluripotent stem-cell reprogramming. iPSCs were generated from human foreskin fibroblasts (early-passage hBJ, discontinued, Stemgent) with an mRNA Reprogramming Kit (00-0071, Stemgent) in combination with a micro-RNA Booster Kit (00-0073, Stemgent). The resultant iPSCs are termed RNA-iPSCs. hBJ cells were plated at a density of 5 × 10⁴ cells per well of a six-well Matrigel-coated plate (354277, Corning) and incubated at 37 °C and 5% CO2 for 24 h. The oxygen tension was then decreased from ambient to 5%, before the start of the transfection schedule. Throughout the protocol, medium was changed daily with Pluriton (00-0070, Stemgent) preconditioned with inactivated newborn human foreskin fibroblasts (GSC-3006G, GlobalStem) containing 300 ng/mL B18R (34-8185, eBiosciences) and 1× Pluriton supplement (stock 2,500×). All RNA transfections were carried out with a Stemfect Transfection Kit (00-0069, Stemgent). On day 0 of reprogramming, 70 pmol of miR cocktail was trans-fected into the hBJ cells. 1 µg of mRNA cocktail (Oct4, Sox2, Klf4, c-Myc, Lin28, and nGFP at 3:1:1:1:1:1 stoichiometry) was transfected on days 1–3. On day 4, miR and mRNA cocktails were cotransfected. Daily mRNA-cocktail transfections continued from days 5–11. The time of appearance of the first colonies averaged from 10 to 14 d. RNA-iPSCs were maintained in Nutristem (01-0005, Stemgent).
Statistical analysis. Student’s t tests were used to calculate two-tailed P values. No multiple test correction was performed. Summary for P values: *P < 0.05; **P < 0.01; ***P < 0.001; ****P < 0.0001. Data are displayed as mean ± s.e.m. of biological replicates (n) as indicated. When number of experiments was <3, range of values is shown.
Cell culture. Human foreskin fibroblasts (hBJ, discontinued, Stemgent) were cul-tured in DMEM with 10% FBS. IMR-90-1 (iPS(IMR90)-1, WiCell) and RNA-iPSCs were cultured in Nutristem (01-0005, Stemgent) on ES-qualified matrigel (354277, Corning). Tera-1 cells (HTB-105, ATCC) were cultured in McCoy’s 5A (16600-082, Life Technologies) supplemented with 20% Cosmic Serum (SH3008702, Fisher Sci) and 1% Normocin (ant-nr-1, Invivogen). HeLa cells (CCL-2, ATCC) were cultured in EMEM (SH3024401, Hyclone) supplemented with 10% HI-FBS (FB-02, Omega Scientific), 5% Glutamax (35050-061, Life Technologies), 3% HEPES (15630-080, Life Technologies), and 1% Normocin (ant-nr-1, Invivogen). HEK293T cells (CRL-3216, ATCC) were cultured in DMEM supplemented with 10% HI-FBS (FB-02, Omega Scientific), 5% GlutaMAX (35050-061, Life Technologies) and 1% Normocin (ant-nr-1, Invivogen). Colon cancer-initiating cells (CCICs, a gift from M. Waterman) were verified and cultured as described in Sikandar et al.37. Briefly, CCICs were cultured as spheres in ultra–low attach-ment flasks in DMEM/F12, N2 supplement (17502-048, Life Technologies), B27 supplement (17504-044, Life Technologies), heparin (4 µg/mL, Sigma), epidermal growth factor (20 ng/mL), and basic fibroblast growth factor (20 ng/mL). H23 cells (CRL-5800, ATCC) were cultured in RPMI-1640 (11875, Life Technologies), 10% HI-FBS, 5% Glutamax, and 1% Normocin. All cells were cultured at 37 °C and 5% CO2 and routinely checked for mycoplasma. Cell lines were not independ-ently authenticated in our laboratory.
Derepression L1 anti-miR library screen. HeLa cells were transduced with miR-Zip Virus Library (MZIPPLVA, System Biosciences), selected with puromycin and split to single-cell dilutions. Luciferase reporter plasmids pWA355 (50 µg) as well as the normalization plasmid pGL4.74 (Renilla luciferase) were transfected with FuGENE HD (E2311, Promega), and results were read on a GloMax-multi reader (Promega) with the Dual-Glo Luciferase assay system (E2940, Promega).
RNA extraction and quantification of mRNAs. RNA was extracted with TRIzol, Zymogen Directzol, Qiagen RNeasy Kit or Qiagen miRNeasy Kit, according to the manufacturers’ instructions. mRNA levels were analyzed by qPCR with TaqMan One Step RT-PCR kit or SYBR Green (Life Technologies), relative to β-2-microglobulin (B2M), GAPDH or GUSB housekeeping genes and processed with the ∆∆Ct method. miR-128 levels were determined by miScript II RT and primer qPCR assay (Qiagen); miR-128 levels were normalized to RNU5A with the ∆∆Ct method.
RT-PCR. RNA was reverse transcribed into cDNA with a High-Capacity Reverse Transcriptase Kit with poly-dT primers (4368813, Life Technologies). cDNA was amplified with Q5 polymerase (M0494S, NEB) and specific primers for mRNA
targets (OCT4, NANOG, LIN28A, SOX2, DNMT3B, FOXD3, TERT and FL L1 relative to B2M) for 40 cycles according to the manufacturer’s protocol. PCR products were run on an 0.8% agarose gel and visualized with ethidium bromide. All uncropped RT-PCR gels can be found in Supplementary Data Set 2.
Plasmids and primers. Lists and details of plasmids and primers can be found in Supplementary Data Set 1.
Immunofluorescence staining. StainAlive TRA-1-60–specific antibody conjugated to DyLight 488 (09-0068, Stemgent) and StainAlive SSEA-4–specific antibody conjugated to DyLight 550 (09-0097, Stemgent) were used to iden-tify and verify RNA-iPSCs. Validation of these antibodies is available on the manufacturer’s website.
Immunoblotting. Rabbit anti-human L1 ORF1p, custom generated by Genscript and validated by ELISA, was used at 1:1,000. Anti–α-tubulin (ab4074, Abcam), used as a loading control, was diluted 1:5,000; validation can be found on the manufacturer’s website. All uncropped immunoblots can be found in Supplementary Data Set 2.
Transfection and transduction of miRs. OptiMEM (31985070, Life Technologies) and TransIT-X2 transfection reagent (MIR-6004, Mirus Bio) or Lipofectamine RNAiMAX (13778075, Life Technologies) were used to com-plex and transfect 20 µM miR-128 mimic or anti–miR-128 (C-301072-01 and IH-301072-02, Dharmacon) into HeLa (pJM101/L1RP cotransfected), Tera-1, HEK293T, H23 and iPSCs. VSVG-pseudotyped lentiviral vectors were made by transfection of 0.67 µg of pMD2-G (12259, Addgene), 1.297 µg of pCMV-DR8.74 (8455, Addgene), and 2 µg of mZIP-miR-128 or mZIP-anti–miR-128 (transfer plasmid) into HEK293T cells with Lipofectamine LTX with plus rea-gent (15338030, Life Technologies). Viral supernatant was concentrated with PEG-it virus-precipitation solution (LV810A-1, System Biosciences) accord-ing to the manufacturer’s instructions. Cells were transduced with viruses at high titer with polybrene (sc-134220, Santa Cruz Biotech) and spinoculation (800g at 32 °C for 30 min). Transduced cells were then selected and maintained with 3 µg/mL puromycin.
Colony-formation assay. Stable HeLa lines expressing miR-128, anti–miR-128 or scrambled control were transfected with pJM101/L1RP (containing a neomycin-resistance retrotransposition-indicator cassette) per well with X-treme gene HP DNA transfection reagent (06366236001, Roche) according to the manufacturer’s instructions. Cells were selected with 500 µg/mL G418 (ant-gn-1, Invivogen). Neomycin-resistant colonies were fixed with cold 1:1 methanol/acetone and then visualized with May-Grunwald (ES-3410, Fisher) and Jenner-Giemsa staining kits (ES-8150, Fisher) according to the manufacturer’s protocol. Stable iPSC lines expressing miR-128, anti–miR-128 or scrambled control were transfected with pJM101/L1RP with Xtreme gene HP DNA transfection reagent according to the manufacturer’s instructions. Selection began with 25 µg/mL G418 72 h after transfection and was maintained with daily medium changes until nega-tive-control (nontransfected) cells had died. Neomycin-resistant colonies were prepared as described above.
Mutation of the miR-128–binding site. For the mutation of the potential miR-128–binding site in ORF-2 of the L1 reporter, the complete L1 reporter cas-sette was excised from the pJM101/L1RP plasmid by SalI digest. The fragment was purified by gel extraction and inserted into the SalI-digested backbone of pcDNA3.1. The resultant plasmid pL1-Neo-Reporter was drastically reduced in size, thus allowing for the construction of a mutated fragment by fusion PCR and insertion into the pL1-Neo-Reporter. For the fusion PCR, the primers (sequences in Supplementary Data Set 1) were used to amplify the fragments with the Phusion PCR polymerase system (NEB). For the fusion, 2 µl of the first PCR was used as a template for the generation of the long fragment, with PCRI primer sense and PCRII primer antisense, and amplified by standard PCR with the Phusion PCR polymerase system (NEB). The fusion fragment includes the mutated miR-128, and it was purified by gel electrophoresis. The original ORF-2 sequence was replaced in the pL1-Neo-Reporter by the fusion fragment, by cutting the plasmid and the fusion fragment with restriction enzymes AfeI and EcoRI, and was then ligated.
Luciferase assays (for direct miR binding analysis). WT L1, mutated L1, or positive-control sequences (Supplementary Fig. 6) were cloned into a dual- luciferase reporter plasmid (pEZX-MT05, Genecopoeia). 3 × 10⁵ HeLa cells were forward-transfected with 0.8 µg of reporter plasmid (WT, mutated, Pos) and 20 nM miR-128 mimic (Dharmacon) or control mimic (Dharmacon) with Attractene transfection reagent (301005, Qiagen) according to the manufac-turer’s instructions. Relative Gaussia Luciferase and SEAP were determined with a Secrete-Pair Dual Luminescence Assay Kit (SPDA-D010, Genecopoeia). Luminescence was detected with a Tecan Infinite F200 Pro microplate reader.
Argonaute RNA immunopurifications (Ago RIPs). Immunopurification of Ago from HeLa and Tera cell extracts was performed with the 4F9 antibody (sc-53521, Santa Cruz Biotechnology), as described previously39,40. Briefly, 10-mm plates of 80% confluent cultured cells were washed with buffer A (20 mM Tris-HCl, pH 8.0, 140 mM KCl and 5 mM EDTA) and lysed in 200 µl of 2× buffer B (40 mM Tris-HCl pH 8.0, 280 mM KCl, 10 mM EDTA, 1% NP-40, 0.2% deoxycholate, 2× Halt protease-inhibitor cocktail (Pierce), 200 U/ml RNaseOUT (Life Technologies) and 1 mM DTT). Protein concentration was adjusted across samples with buffer
B (20 mM Tris-HCl, pH 8.0, 140 mM KCl, 5 mM EDTA, pH 8.0, 0.5% NP-40, 0.1% deoxycholate, 100 U/ml RNaseOUT (Life Technologies), 1 mM DTT and 1× Halt protease-inhibitor cocktail (Pierce)). Lysates were centrifuged at 16,000g for 15 min at 4 °C, and supernatants were incubated with 10–20 µg of 4F9 anti-body conjugated to epoxy magnetic beads (M-270 Dynabeads, Life Technologies) for 2 h at 4 °C with gentle rotation (nutator). After magnetic separation, the beads were washed three times for 5 min with 2 ml of buffer C (20 mM Tris-HCl, pH 8.0, 140 mM KCl, 5 mM EDTA, pH 8.0, 40 U/ml RNaseOUT (Life Technologies), 1 mM DTT and 1× Halt protease-inhibitor cocktail (Pierce)). After immunopu-rification, RNA was extracted with miRNeasy kits (Qiagen), according to the manufacturer’s recommendations, and qPCR was performed with commercially available TaqMan assays for GAPDH and the let-7 miRNA as well as custom probes and primers for the L1 mRNA transcript. Results were normalized to their inputs or to let-7 miRNA, as a proxy for Ago immunopurification efficiency.
39. Hunter, S.E. et al. Functional genomic analysis of the let-7 regulatory network in Caenorhabditis elegans. PLoS Genet. 9, e1003353 (2013).
40. Hogan, D.J. et al. Anti-miRs competitively inhibit microRNAs in Argonaute complexes. PLoS ONE 9, e100951 (2014).