Mirza, Hassan, Pham, Assaf and Stanshall __________________________________________________________________________________ The Effect of Wheel Loading on a Railway Bridge Olivia Mirza 1 , Md Kamrul Hassan 2 , Thy Hoang Pham 3 , Emile Assaf 3 and Guy Stanshall 3 1 Senior Lecturer, School of Computing, Engineering and Mathematics, Western Sydney University, Locked Bag 1797, Penrith NSW 2751; [email protected]2 Post-doctoral Research Fellow, Centre for Infrastructure Engineering, Western Sydney University, Locked Bag 1797, Penrith NSW 2751; [email protected]3 Honour Student, School of Computing Engineering & Mathematics, Western Sydney University, Penrith, NSW, Australia ABSTRACT Australia’s maturing locomotives and railways concerns with faster and heavier loads will have negative effects to the railway infrastructure. This will accelerate the deterioration of the railway system and increase the chance of cracking from the sleepers and/or damage to the rail and fastening system failure. The purpose of this research is to investigate the effect of wheel loading on the interaction between sleepers and railhead in the rail component system for Minnamurra Bridge in Kiama NSW. A finite element model was analysed for half of the existing bridge to simplify the model and analysis. The bridge was then analysed to determine the stress distribution and vertical displacement across the sleepers and railhead. The results showed a maximum stress of 320 MPa at the point of the wheel rail contact at each load location of the train and carriages. The maximum vertical displacement across the railway bridge was 3 mm. The critical component of the railway bridge was determined to be the rail of the bridge as it experiences high levels of stress. The stress on the rail is close to the yielding limit of the rail material. Keywords: Railway bridges; Sleeper-rail interaction; Wheel loading, Finite element analysis 1. INTRODUCTION Most existing railway bridges past their design life and require have much heavier loads during the design period. Chikermane [1] advocated that it is imperative to assess and predict the current conditions and safety of the remaining life on older railway bridges, as a result to increased loads on locomotives. Wheel loading, otherwise known as axle loading, is the total load impacted by the railway for all the wheels connected to a known axle. Extensive study had been conducted in the past, focusing on vertical vehicle-track interaction at pivotal points on railway bridge approaches and lateral misalignment issues associated with bridges located in sharp curves [2]. Due to the acceleration of railway velocities and the additional heavy axle loads, it is notable that the dynamic interaction between wheel and rail intensifies [3],
Transcript
Mirza, Hassan, Pham, Assaf and Stanshall __________________________________________________________________________________
The Effect of Wheel Loading on a Railway Bridge
Olivia Mirza1, Md Kamrul Hassan2, Thy Hoang Pham3, Emile Assaf3 and Guy
Stanshall3
1 Senior Lecturer, School of Computing, Engineering and Mathematics, Western
Sydney University, Locked Bag 1797, Penrith NSW 2751;
3 Honour Student, School of Computing Engineering & Mathematics, Western
Sydney University, Penrith, NSW, Australia
ABSTRACT
Australia’s maturing locomotives and railways concerns with faster and heavier loads will have negative effects to the railway infrastructure. This will accelerate the deterioration of the railway system and increase the chance of cracking from the sleepers and/or damage to the rail and fastening system failure. The purpose of this research is to investigate the effect of wheel loading on the interaction between sleepers and railhead in the rail component system for Minnamurra Bridge in Kiama NSW. A finite element model was analysed for half of the existing bridge to simplify the model and analysis. The bridge was then analysed to determine the stress distribution and vertical displacement across the sleepers and railhead. The results showed a maximum stress of 320 MPa at the point of the wheel rail contact at each load location of the train and carriages. The maximum vertical displacement across the railway bridge was 3 mm. The critical component of the railway bridge was determined to be the rail of the bridge as it experiences high levels of stress. The stress on the rail is close to the yielding limit of the rail material.
Keywords: Railway bridges; Sleeper-rail interaction; Wheel loading, Finite element analysis
1. INTRODUCTION
Most existing railway bridges past their design life and require have much heavier loads during the design period. Chikermane [1] advocated that it is imperative to assess and predict the current conditions and safety of the remaining life on older railway bridges, as a result to increased loads on locomotives. Wheel loading, otherwise known as axle loading, is the total load impacted by the railway for all the wheels connected to a known axle. Extensive study had been conducted in the past, focusing on vertical vehicle-track interaction at pivotal points on railway bridge approaches and lateral misalignment issues associated with bridges located in sharp curves [2]. Due to the acceleration of railway velocities and the additional heavy axle loads, it is notable that the dynamic interaction between wheel and rail intensifies [3],
Mirza, Hassan, Pham, Assaf and Stanshall __________________________________________________________________________________
particularly in the vertical direction. This known as vertical vehicle-track interaction. Transportation Technology Centre, Inc. has undertaken studies and experiments relating to vertical vehicle-track interaction. The investigations were made on the ballast deck concrete bridges with concrete ties, open deck steel bridges with wood ties and their approaches [2]. Li et al. [2], Li and Davis [4] concurred that heavy axle loads have negative impacts on railway bridges; this includes increased wear and tear on the bridge, track and locomotive components, and can decrease the train ride quality for fragile loads and passengers.
A bridge approach is usually referred to the track within 30 m of the end span of a
bridge. There are many different types of problems in relation to bridge approaches. Li et al. [2] had classified the main problems into three groups: rapid track geometry degradation, mud pumping and track component damage. The most common problem is the track geometry degradation (differential settlement). The show-tell signs for it are rough vertical surfaces and cross-levels. Track geometry degradation “can cause significant vehicle-track interaction or large dynamic wheel-rail forces” [2]. Railway bridge approaches are often in correspondence with increased maintenance costs and speed limitations. This is due to issues in vertical surface and lateral alignment, pumping ballast, swinging and/or hanging ties (gaps or slacks between ties and ballast), ballast breakdown, rail bettering, and/or concrete tie cracking. Li and Davis [4] concluded that these issues are the effects of increase dynamic axle loads. Li et al. [2] noted that misalignment and/or lateral track geometry issues can arise when a railway bridge is situated in a sharp curve where there is inconsistent track gauge strength and panel shift strength.
Track component damages are inevitable. Track components on railway bridges
and their approaches frequently degrade or fail more promptly. Over a course of time rail fastening components such as clips and insulators for concrete tie tracks, spikes and screws for wood tie tracks will become loose under heavy axle load. Although, Li et al. [2] had concerns about the railway track integrity or gauge restraining capability. The rail fastenings may have compromised as a consequence of unsuccessful or missing fastenings, and how distinctive parts of fastenings can affect the gauge restraining capability differently.
There is a current need for an improved and advanced infrastructure to meet the
demands of the Australian public. Due to the growing population in Australia using public transport, it has caused heavy loads and faster train speeds on the current rail infrastructure. Unfortunately, associated with Australia’s maturing locomotives and railways concerns with faster and heavier loads will have negative effects to the railway infrastructure. This will accelerate the deterioration of the railway system and increase the chance of cracking from the sleepers and/or damage to the rail and fastening system failure. The aim of this research is to study the effects of wheel loading on existing rail components. The objectives of this research are to: (1) Develop a finite element model of the existing bridge with geometric sizing; (2) Analyse and compare the rail components horizontal and vertical displacement and stress distribution against each wheel step load; (3) Check for the critical rail components in the design; and (4) Generate a report with adequate results, discussion and recommendations of the effect of wheel loading on the Minnamurra Railway Bridge.
Mirza, Hassan, Pham, Assaf and Stanshall __________________________________________________________________________________
2. DETAILS OF CASE STUDY
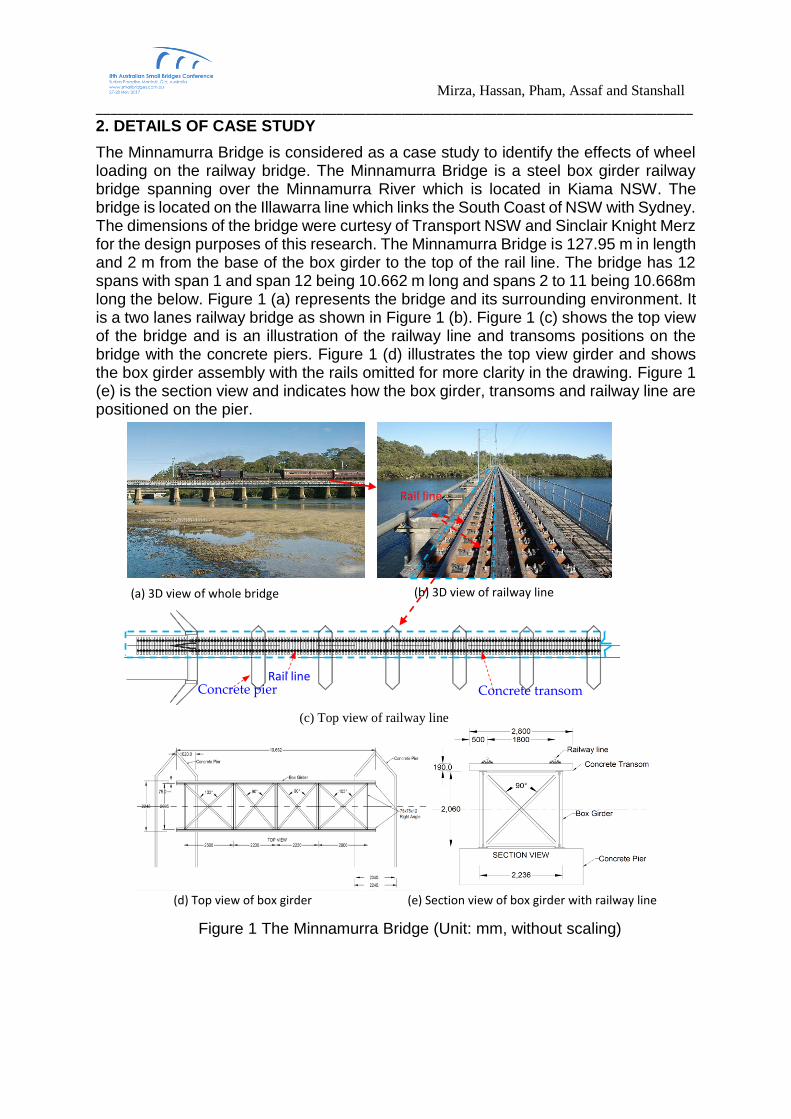
The Minnamurra Bridge is considered as a case study to identify the effects of wheel loading on the railway bridge. The Minnamurra Bridge is a steel box girder railway bridge spanning over the Minnamurra River which is located in Kiama NSW. The bridge is located on the Illawarra line which links the South Coast of NSW with Sydney. The dimensions of the bridge were curtesy of Transport NSW and Sinclair Knight Merz for the design purposes of this research. The Minnamurra Bridge is 127.95 m in length and 2 m from the base of the box girder to the top of the rail line. The bridge has 12 spans with span 1 and span 12 being 10.662 m long and spans 2 to 11 being 10.668m long the below. Figure 1 (a) represents the bridge and its surrounding environment. It is a two lanes railway bridge as shown in Figure 1 (b). Figure 1 (c) shows the top view of the bridge and is an illustration of the railway line and transoms positions on the bridge with the concrete piers. Figure 1 (d) illustrates the top view girder and shows the box girder assembly with the rails omitted for more clarity in the drawing. Figure 1 (e) is the section view and indicates how the box girder, transoms and railway line are positioned on the pier.
Figure 1 The Minnamurra Bridge (Unit: mm, without scaling)
Rail line
(a) 3D view of whole bridge (b) 3D view of railway line
Rail line Concrete pier Concrete transom
(d) Top view of box girder (e) Section view of box girder with railway line
(c) Top view of railway line
Mirza, Hassan, Pham, Assaf and Stanshall __________________________________________________________________________________
3. FINITE ELEMENT MODELLING OF MINNAMURRA RAILWAY BRIDGE
Three-dimensional (3D) detailed model of Minnimurra Railway Bridge is established as shown in Figure 2, using finite element analysis ABAQUS software to investigate the effect loading between the wheel and rail on the bridge.
3.1. Railway Bridge’s Components
The model is divided into major parts; sleepers/transoms, rail, concrete pier and equal angles, internal and external bracing (Figure 3). All parts are created using design specifications provided by Transport NSW. The research undertaken is to analyse the interaction between the wheel and the rail and the effect it has on the sleepers, both fixed and pinned, across the bridge. Ideally, a wheel will would be included in the model, created to the standard of Transport NSW to be used to accurately show the interaction between the wheel and rail. To simplify the project a set of point loads will be used across the bridge to simulate the downward pressure from each wheel on the rail, this 10-point load is provided from the Australian standards AS5100.2 Cl 8.2 [5].
Figure 2 Three-dimensional (3D) detailed model of Minnimurra Railway Bridge
(Half model)
Rail
Sleeper
Sleeper
Abutment
Concrete pier
Box girder
Bracing used in box girder
Abutment
Abutment
Concrete pier
T-sections at top and bottom
Mirza, Hassan, Pham, Assaf and Stanshall __________________________________________________________________________________
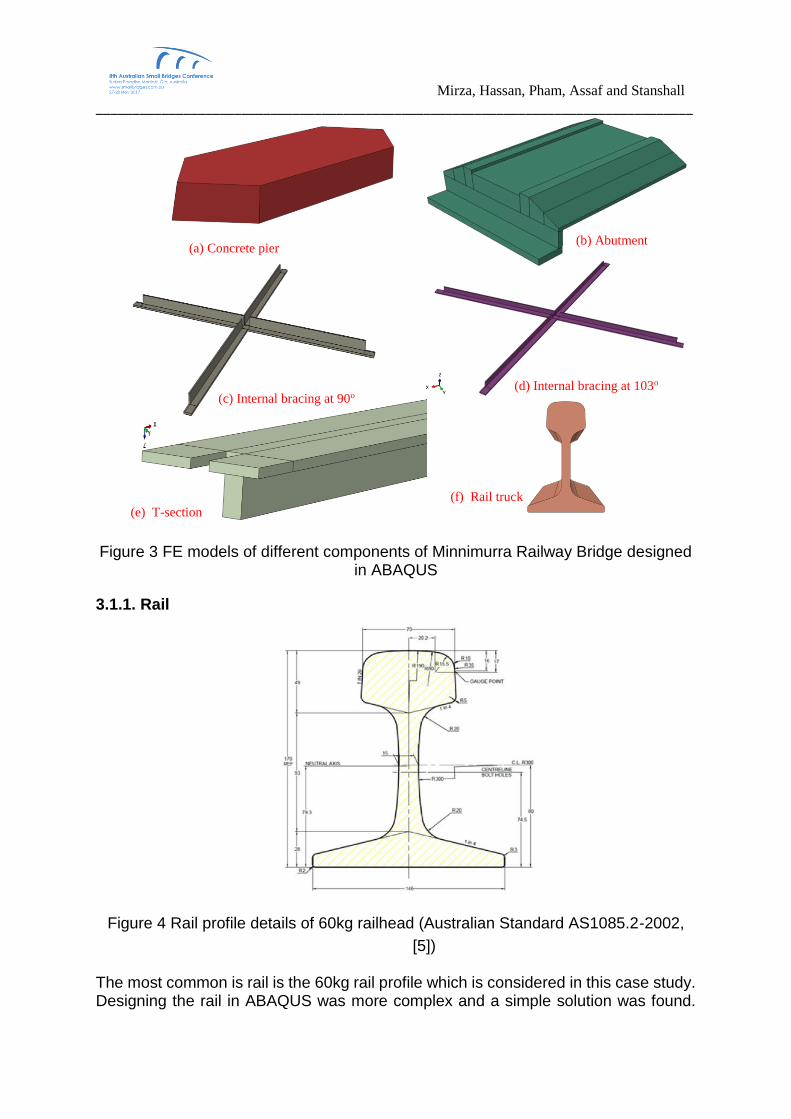
Figure 3 FE models of different components of Minnimurra Railway Bridge designed in ABAQUS
3.1.1. Rail
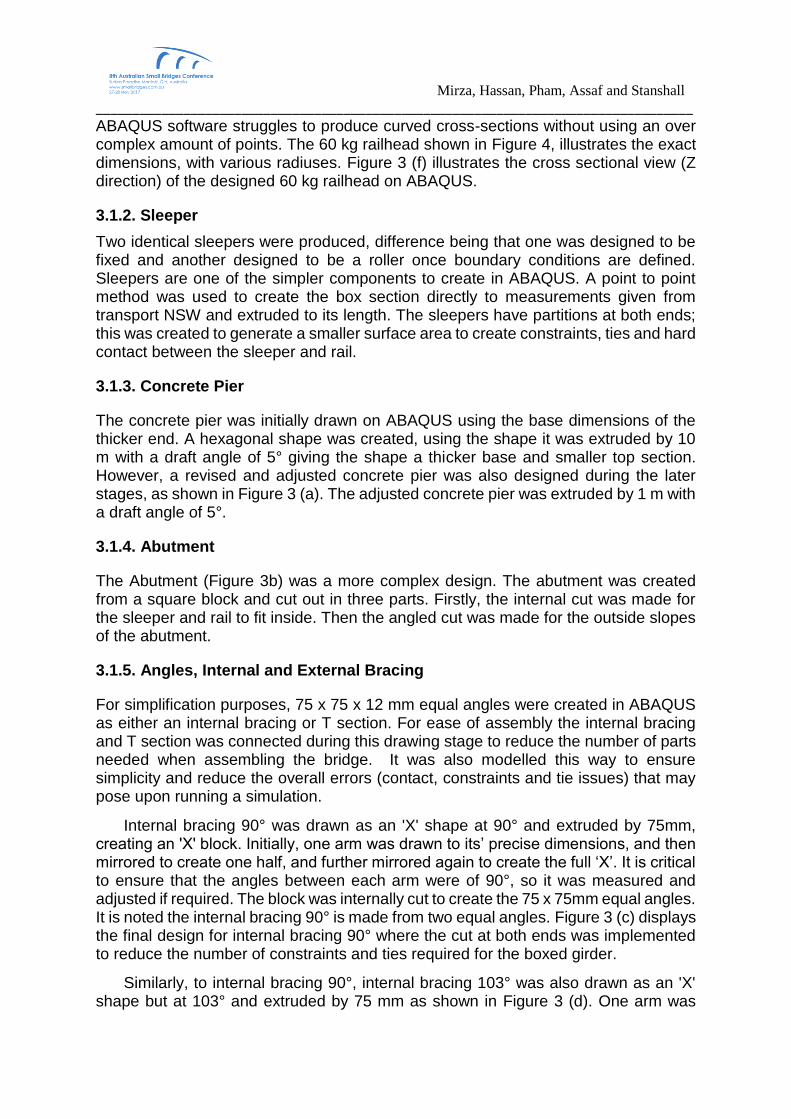
Figure 4 Rail profile details of 60kg railhead (Australian Standard AS1085.2-2002,
[5]) The most common is rail is the 60kg rail profile which is considered in this case study. Designing the rail in ABAQUS was more complex and a simple solution was found.
(c) Internal bracing at 90o (d) Internal bracing at 103o
(e) T-section
(a) Concrete pier (b) Abutment
(f) Rail truck
Mirza, Hassan, Pham, Assaf and Stanshall __________________________________________________________________________________
ABAQUS software struggles to produce curved cross-sections without using an over complex amount of points. The 60 kg railhead shown in Figure 4, illustrates the exact dimensions, with various radiuses. Figure 3 (f) illustrates the cross sectional view (Z direction) of the designed 60 kg railhead on ABAQUS.
3.1.2. Sleeper
Two identical sleepers were produced, difference being that one was designed to be fixed and another designed to be a roller once boundary conditions are defined. Sleepers are one of the simpler components to create in ABAQUS. A point to point method was used to create the box section directly to measurements given from transport NSW and extruded to its length. The sleepers have partitions at both ends; this was created to generate a smaller surface area to create constraints, ties and hard contact between the sleeper and rail.
3.1.3. Concrete Pier
The concrete pier was initially drawn on ABAQUS using the base dimensions of the thicker end. A hexagonal shape was created, using the shape it was extruded by 10 m with a draft angle of 5° giving the shape a thicker base and smaller top section. However, a revised and adjusted concrete pier was also designed during the later stages, as shown in Figure 3 (a). The adjusted concrete pier was extruded by 1 m with a draft angle of 5°.
3.1.4. Abutment
The Abutment (Figure 3b) was a more complex design. The abutment was created from a square block and cut out in three parts. Firstly, the internal cut was made for the sleeper and rail to fit inside. Then the angled cut was made for the outside slopes of the abutment.
3.1.5. Angles, Internal and External Bracing
For simplification purposes, 75 x 75 x 12 mm equal angles were created in ABAQUS as either an internal bracing or T section. For ease of assembly the internal bracing and T section was connected during this drawing stage to reduce the number of parts needed when assembling the bridge. It was also modelled this way to ensure simplicity and reduce the overall errors (contact, constraints and tie issues) that may pose upon running a simulation.
Internal bracing 90° was drawn as an 'X' shape at 90° and extruded by 75mm, creating an 'X' block. Initially, one arm was drawn to its’ precise dimensions, and then mirrored to create one half, and further mirrored again to create the full ‘X’. It is critical to ensure that the angles between each arm were of 90°, so it was measured and adjusted if required. The block was internally cut to create the 75 x 75mm equal angles. It is noted the internal bracing 90° is made from two equal angles. Figure 3 (c) displays the final design for internal bracing 90° where the cut at both ends was implemented to reduce the number of constraints and ties required for the boxed girder.
Similarly, to internal bracing 90°, internal bracing 103° was also drawn as an 'X' shape but at 103° and extruded by 75 mm as shown in Figure 3 (d). One arm was
Mirza, Hassan, Pham, Assaf and Stanshall __________________________________________________________________________________
initially drawn to its’ correct dimensions, and was then mirrored to create the full ‘X’ block. It is critical to ensure that the angles between each arm were of 103°, it was measured and adjusted if required. The block was internally cut to create the 75 x 75mm equal angles; this process was completed through the ‘Horizontal to the Top’ function. It is also noted the internal bracing 103° is made from two equal angles.
The T-section was one of the simpler designs on ABAQUS; it was a simple drawing of a 'T' drawn to the dimensions given by Transport for NSW. Once the 'T' was drawn it was extruded to length. To simply the plan, the ‘T’ section is actually composed of two 75 x 75 equal angles; this detail is shown more clearly in Figure 3 (e). They have been joined together to reduce the number of parts, connections and ties required in the final model. There were various different ‘T’ sections drawn, this was to simplify the model upon the assembly stages.
3.2. Contact Interactions Between Different Railway Bridge Components
Figure 5 Contact Interactions between different railway bridge components
Two types of contact interactions are considered, one is tie constraint and another is surface-to-surface hard contact. The details are illustrated in the below sub-sections. When two or more components are interconnected by welding, tie constraint is used. On the other hand, when one component comes into contact with other component, surface-to-surface hard contact is used.
2.2.1. Tie Constraints
‘Find contact pins’ finds possible connections within a defined distance between each component. Due to the accuracy used when assembling the model, the distance defined was 5 mm. ABAQUS was able to find every possible constraint with 5 mm or less spacing and auto tied them together. In total there were 1892 constraints created across the bridge, 65 interactions, 3916 surfaces and 836 sets created to define the ties and constraints of the bridge. To ensure constraints functioned correctly, master and slave parts had to be defined. As indicated in Figure 5(a), the master is red and
(a) Tie constraints
(b) Surface-to-surface hard contact
Sleepers used tie contact
Sleepers used hard contact
Mirza, Hassan, Pham, Assaf and Stanshall __________________________________________________________________________________
the slave is purple. Master components have to be the stronger material. In this case, steel is always the master, whereas the concrete component is the slave.
3.2.1. Surface to Surface Hard Contact
There are two types of constraint used for the sleepers, as there are pinned and fixed sleepers on the bridge. The fixed sleepers were tied by the assigning the top face of the steel T section (equal angles) as the master and the bottom face of the concrete piers as the slave. The pinned sleepers required a different type of constraint; they were created through hard surface contact. Hard surface contact allows two surfaces and/or materials to be flushed together, creating a pinned connection where the sleeper is constrained in the y-axis, but can still freely move in the x-axis. This hard surface contact between the two materials allows the stresses to transfer from one part to another. Figure 5(b) illustrates the tie constraint between a fixed sleeper and pinned sleeper, blue and grey sleeper respectively.
3.3. Load and Boundary Conditions
3.3.1. Loading Conditions
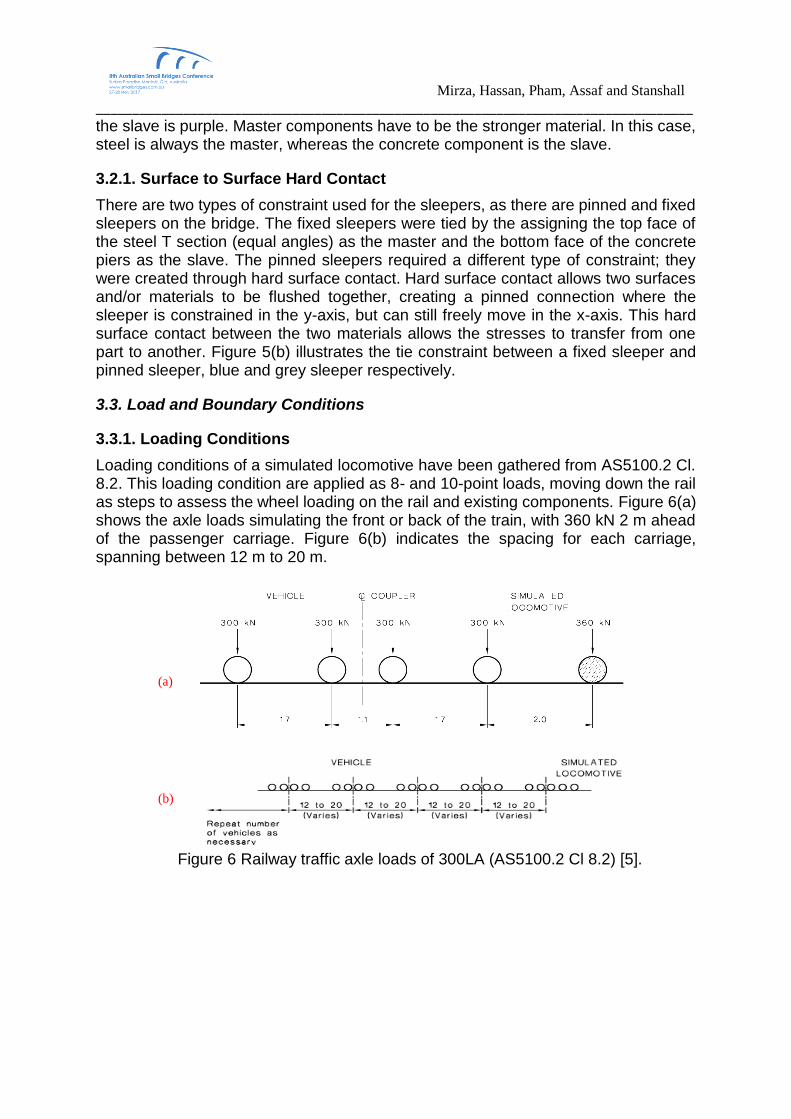
Loading conditions of a simulated locomotive have been gathered from AS5100.2 Cl. 8.2. This loading condition are applied as 8- and 10-point loads, moving down the rail as steps to assess the wheel loading on the rail and existing components. Figure 6(a) shows the axle loads simulating the front or back of the train, with 360 kN 2 m ahead of the passenger carriage. Figure 6(b) indicates the spacing for each carriage, spanning between 12 m to 20 m.
Mirza, Hassan, Pham, Assaf and Stanshall __________________________________________________________________________________
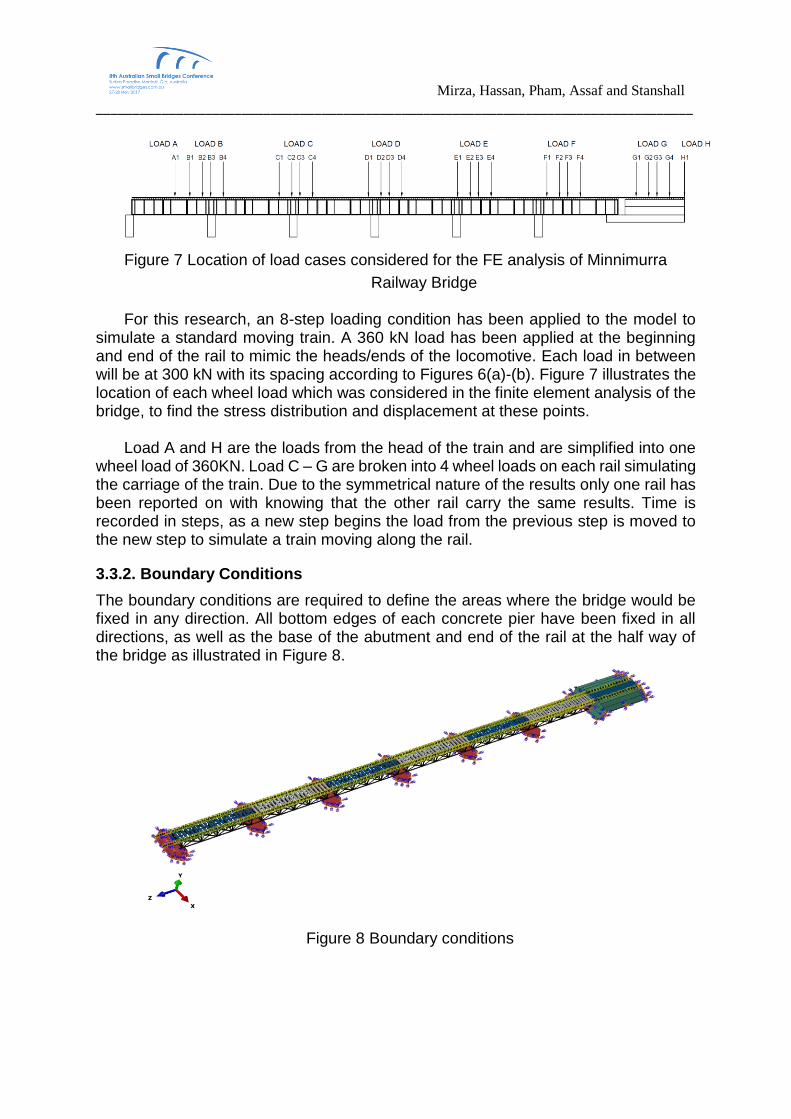
Figure 7 Location of load cases considered for the FE analysis of Minnimurra
Railway Bridge For this research, an 8-step loading condition has been applied to the model to
simulate a standard moving train. A 360 kN load has been applied at the beginning and end of the rail to mimic the heads/ends of the locomotive. Each load in between will be at 300 kN with its spacing according to Figures 6(a)-(b). Figure 7 illustrates the location of each wheel load which was considered in the finite element analysis of the bridge, to find the stress distribution and displacement at these points.
Load A and H are the loads from the head of the train and are simplified into one
wheel load of 360KN. Load C – G are broken into 4 wheel loads on each rail simulating the carriage of the train. Due to the symmetrical nature of the results only one rail has been reported on with knowing that the other rail carry the same results. Time is recorded in steps, as a new step begins the load from the previous step is moved to the new step to simulate a train moving along the rail.
3.3.2. Boundary Conditions
The boundary conditions are required to define the areas where the bridge would be fixed in any direction. All bottom edges of each concrete pier have been fixed in all directions, as well as the base of the abutment and end of the rail at the half way of the bridge as illustrated in Figure 8.
Figure 8 Boundary conditions
Mirza, Hassan, Pham, Assaf and Stanshall __________________________________________________________________________________
3.4. Material Properties
The Minnamurra Railway Bridge system is composed majority of steel and concrete, therefore the main materials are steel (rail, angle and framing) and concrete (pier and sleepers). The material properties of steel and concrete, which are considered in this analysis is given in Table 1. The modulus of elasticity (E), poison’s ratio (v), yield stress (fy) and ultimate strength (fu) are considered to define the material properties of steel, where in the ABAQUS material library.
Table 1: Material properties of steel and concrete used in analysis
Material Rail Steel Rail Steel concrete
E (MPa) 60, 000 200, 000 30, 000
v 0.3 0.3 0.3
fy or fc’ (MPa) 320 320 40
fu (MPa) 410 410 -
4. FE MODELLING RESULTS AND DISCUSSION
4.1. Behaviour of Railway Truck
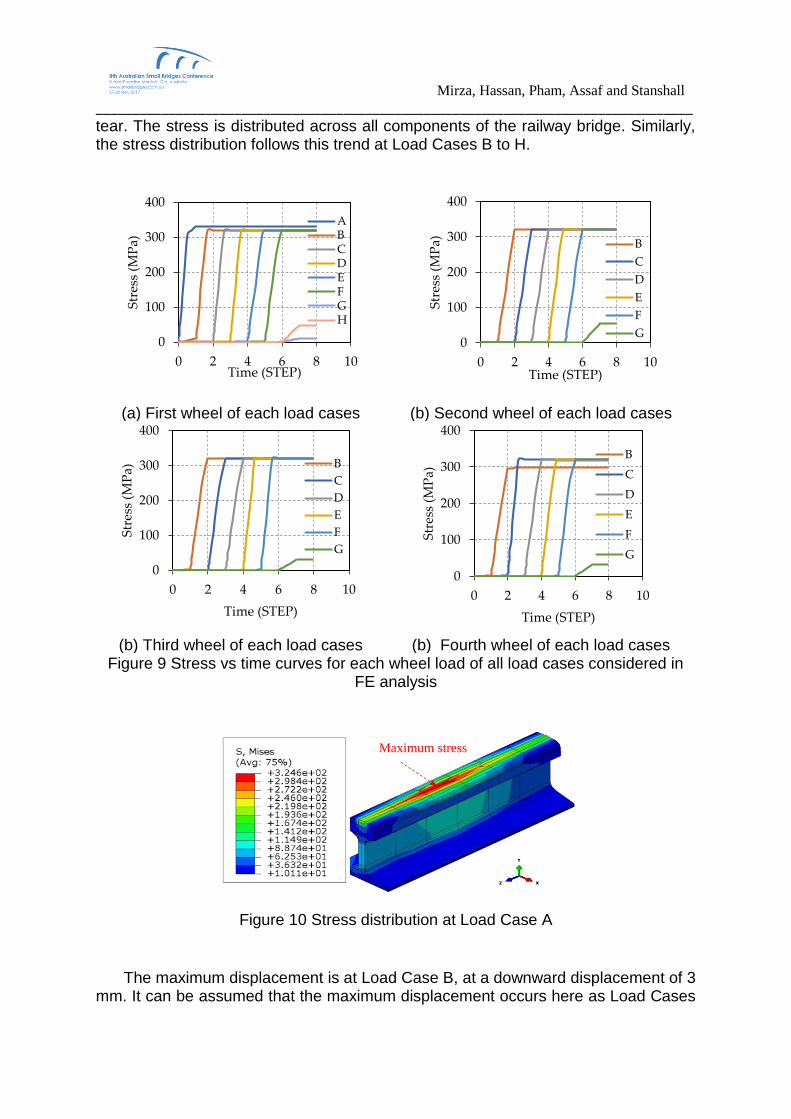
The behaviour of the railway track is assessed through its stress and displacement against time. It is evident in Figure 9 (a) that the maximum stress of 320 MPa is achieved at Load Case A. This is due to the greatest axial load of 360 kN generated at the head and/or end of the locomotive. It is indicative that the steel components have not yet yielded but is borderline within the acceptable range. However, the required increase in loading conditions would not be substantial for the rail to begin to yield. Where the wheel loads are generated as load cases on the railway track.
Throughout Load Cases B to E, as shown in Figure 9 (a), the stress distribution across the railway track is very similar as they are lying above the steel boxed girder, at 300 MPa. The stress in the rail can all see a rapid rise from 0 MPa to 320 MPa as the load cases move over to each other, followed by a drop as the subsequent load case is initiated. The stress remains constant as the locomotive continues down the railway track. Load Cases G and H are both located over the abutment of the railway bridge. Due to its location the stress produced in the rail are shown in Figure 9 (a), reflecting a significant decline relative to Load Cases A to F. The maximum stress at Load Case G and H are recorded at 10.95 MPa and 48.12 MPa, respectively.
The variance in the maximum stress at Load Case G and H are due to the difference in axial loads applied – Load Case G at 300 kN (midspan) and Load Case H at 360 kN (head/end of locomotive). The stresses in Figures 9 (b)-(d) all follow a similar trend to Figure 9 (a), where the maximum stresses are between 300 MPa to 320 MPa. Load Cases A and G are exclusive as they are singular loading conditions which lead and/or end the locomotive. The maximum stress distribution across the rail from Load Case A is illustrated in Figure 10. The greatest area of stress is on the rail at the point of contact with the simulated wheel load. It is assumed that the steel has not yet fully yielded at 319.6 MPa, from Figure 9 (a), but showing signs of wear and
Mirza, Hassan, Pham, Assaf and Stanshall __________________________________________________________________________________
tear. The stress is distributed across all components of the railway bridge. Similarly, the stress distribution follows this trend at Load Cases B to H.
(a) First wheel of each load cases (b) Second wheel of each load cases
(b) Third wheel of each load cases (b) Fourth wheel of each load cases Figure 9 Stress vs time curves for each wheel load of all load cases considered in
FE analysis
Figure 10 Stress distribution at Load Case A
The maximum displacement is at Load Case B, at a downward displacement of 3 mm. It can be assumed that the maximum displacement occurs here as Load Cases
0
100
200
300
400
0 2 4 6 8 10
Str
ess
(MP
a)
Time (STEP)
ABCDEFGH
0
100
200
300
400
0 2 4 6 8 10
Str
ess
(MP
a)
Time (STEP)
B
C
D
E
F
G
0
100
200
300
400
0 2 4 6 8 10
Str
ess
(MP
a)
Time (STEP)
B
C
D
E
F
G
0
100
200
300
400
0 2 4 6 8 10
Str
ess
(MP
a)
Time (STEP)
B
C
D
E
F
G
Maximum stress
Mirza, Hassan, Pham, Assaf and Stanshall __________________________________________________________________________________
A to and B lie on top of the steel boxed girder, supported by concrete piers. As Load Case A generates the maximum loading conditions at 360 kN, this load is then carried on and distributed at Load Case B, producing the highest displacement in the rail. It is also assumed that the results obtained at Load Cases C to F; some of the wheel loads were simulated directly on top of the concrete pier. The stress distribution will increase whereas the displacement distribution will decrease when the wheel load is simulated directly on top of the concrete pier, these acts as additional support to counteract the wheel load.
4.2. Horizontal Sleeper Movement
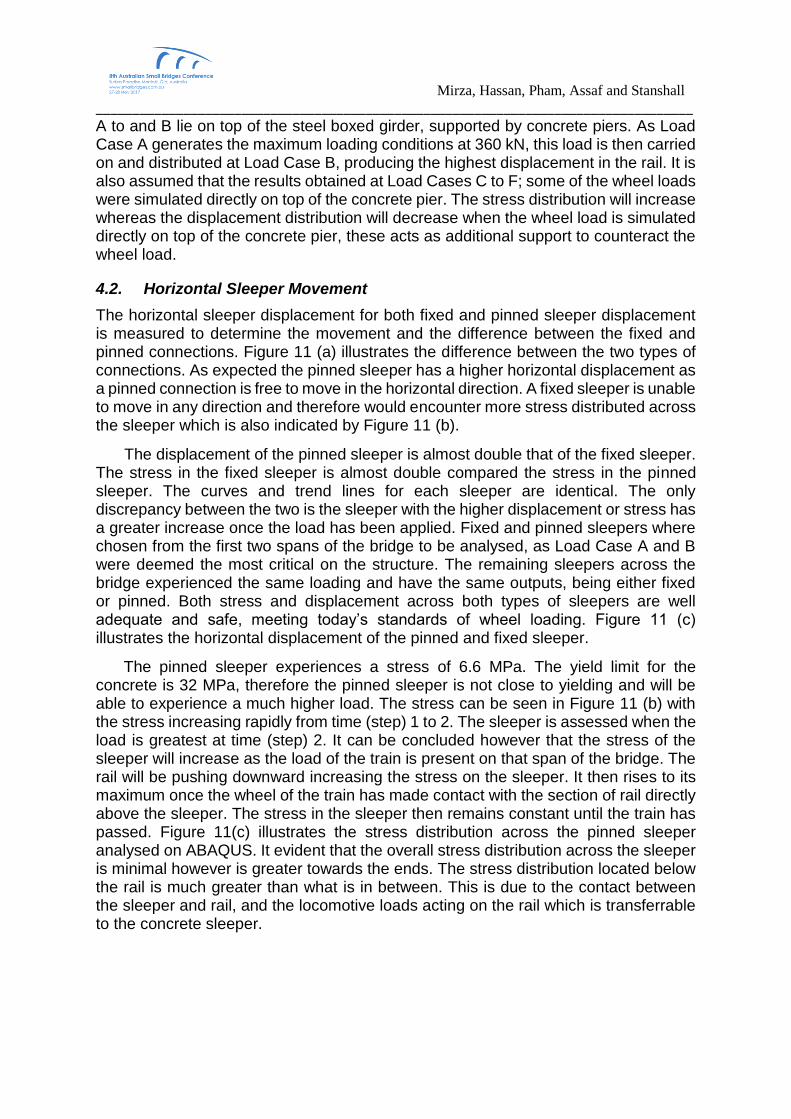
The horizontal sleeper displacement for both fixed and pinned sleeper displacement is measured to determine the movement and the difference between the fixed and pinned connections. Figure 11 (a) illustrates the difference between the two types of connections. As expected the pinned sleeper has a higher horizontal displacement as a pinned connection is free to move in the horizontal direction. A fixed sleeper is unable to move in any direction and therefore would encounter more stress distributed across the sleeper which is also indicated by Figure 11 (b).
The displacement of the pinned sleeper is almost double that of the fixed sleeper. The stress in the fixed sleeper is almost double compared the stress in the pinned sleeper. The curves and trend lines for each sleeper are identical. The only discrepancy between the two is the sleeper with the higher displacement or stress has a greater increase once the load has been applied. Fixed and pinned sleepers where chosen from the first two spans of the bridge to be analysed, as Load Case A and B were deemed the most critical on the structure. The remaining sleepers across the bridge experienced the same loading and have the same outputs, being either fixed or pinned. Both stress and displacement across both types of sleepers are well adequate and safe, meeting today’s standards of wheel loading. Figure 11 (c) illustrates the horizontal displacement of the pinned and fixed sleeper.
The pinned sleeper experiences a stress of 6.6 MPa. The yield limit for the concrete is 32 MPa, therefore the pinned sleeper is not close to yielding and will be able to experience a much higher load. The stress can be seen in Figure 11 (b) with the stress increasing rapidly from time (step) 1 to 2. The sleeper is assessed when the load is greatest at time (step) 2. It can be concluded however that the stress of the sleeper will increase as the load of the train is present on that span of the bridge. The rail will be pushing downward increasing the stress on the sleeper. It then rises to its maximum once the wheel of the train has made contact with the section of rail directly above the sleeper. The stress in the sleeper then remains constant until the train has passed. Figure 11(c) illustrates the stress distribution across the pinned sleeper analysed on ABAQUS. It evident that the overall stress distribution across the sleeper is minimal however is greater towards the ends. The stress distribution located below the rail is much greater than what is in between. This is due to the contact between the sleeper and rail, and the locomotive loads acting on the rail which is transferrable to the concrete sleeper.
Mirza, Hassan, Pham, Assaf and Stanshall __________________________________________________________________________________
(a) Displacement vs time (b) Stress vs time
(c) Stress distribution
(d) Horizontal displacement (z-direction) distribution
Figure 11 Displacement and stress generated on the fixed and pinned sleepers
The fixed sleeper as expected has a higher stress distribution and lower displacement as it is unable to move in any direction, whereas the pinned sleeper is free to move in the z-direction. The maximum stress shown in Figure 11(b) is 13 MPa. This stress present is well below the yield limit and can withstand much more load. Figure 11(c) illustrates the stress distribution across the fixed sleeper analysed on ABAQUS. It evident that the overall stress distribution across the sleeper is minimal however is greater towards the ends. The stress distribution located at below the rail is much greater than what is in between. This is due to the contact between the sleeper and rail, and the locomotive loads acting on the rail which is transferrable to the concrete sleeper. The maximum displacement in the fixed sleeper is 0.36 mm. This can be seen in the Figure 11(a). Figure 11(d) illustrates the horizontal displacement (z-direction) distribution across the fixed sleeper analysed on ABAQUS. It evident that the overall horizontal displacement across the sleeper isn’t as large as the pinned sleepers, as they are fixed in all directions resisting any movement. The vertical
0
0.1
0.2
0.3
0.4
0.5
0.6
0 2 4 6 8 10
Dis
pla
cem
ent
(mm
)
Time (STEP)
FIXED SLEEPER
PINNED SLEEPER
0
2
4
6
8
10
12
14
16
0 2 4 6 8 10
Str
ess
(MP
a)
Time (STEP)
FIXED SLEEPER
PINNED SLEEPER
Fixed sleeper Pinned sleeper
Fixed sleeper Pinned sleeper
Mirza, Hassan, Pham, Assaf and Stanshall __________________________________________________________________________________
loading conditions and horizontal friction loads are applied onto the rail and are transferred onto the sleeper causing larger displacements.
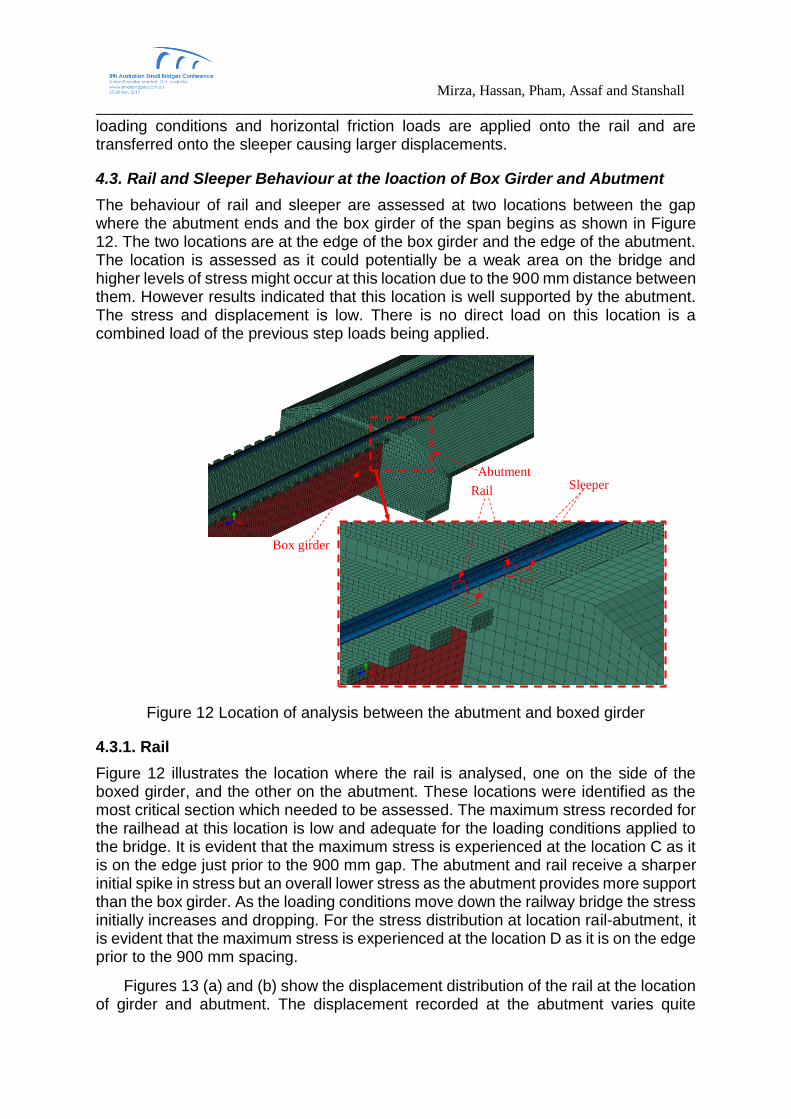
4.3. Rail and Sleeper Behaviour at the loaction of Box Girder and Abutment
The behaviour of rail and sleeper are assessed at two locations between the gap where the abutment ends and the box girder of the span begins as shown in Figure 12. The two locations are at the edge of the box girder and the edge of the abutment. The location is assessed as it could potentially be a weak area on the bridge and higher levels of stress might occur at this location due to the 900 mm distance between them. However results indicated that this location is well supported by the abutment. The stress and displacement is low. There is no direct load on this location is a combined load of the previous step loads being applied.
Figure 12 Location of analysis between the abutment and boxed girder
4.3.1. Rail
Figure 12 illustrates the location where the rail is analysed, one on the side of the boxed girder, and the other on the abutment. These locations were identified as the most critical section which needed to be assessed. The maximum stress recorded for the railhead at this location is low and adequate for the loading conditions applied to the bridge. It is evident that the maximum stress is experienced at the location C as it is on the edge just prior to the 900 mm gap. The abutment and rail receive a sharper initial spike in stress but an overall lower stress as the abutment provides more support than the box girder. As the loading conditions move down the railway bridge the stress initially increases and dropping. For the stress distribution at location rail-abutment, it is evident that the maximum stress is experienced at the location D as it is on the edge prior to the 900 mm spacing.
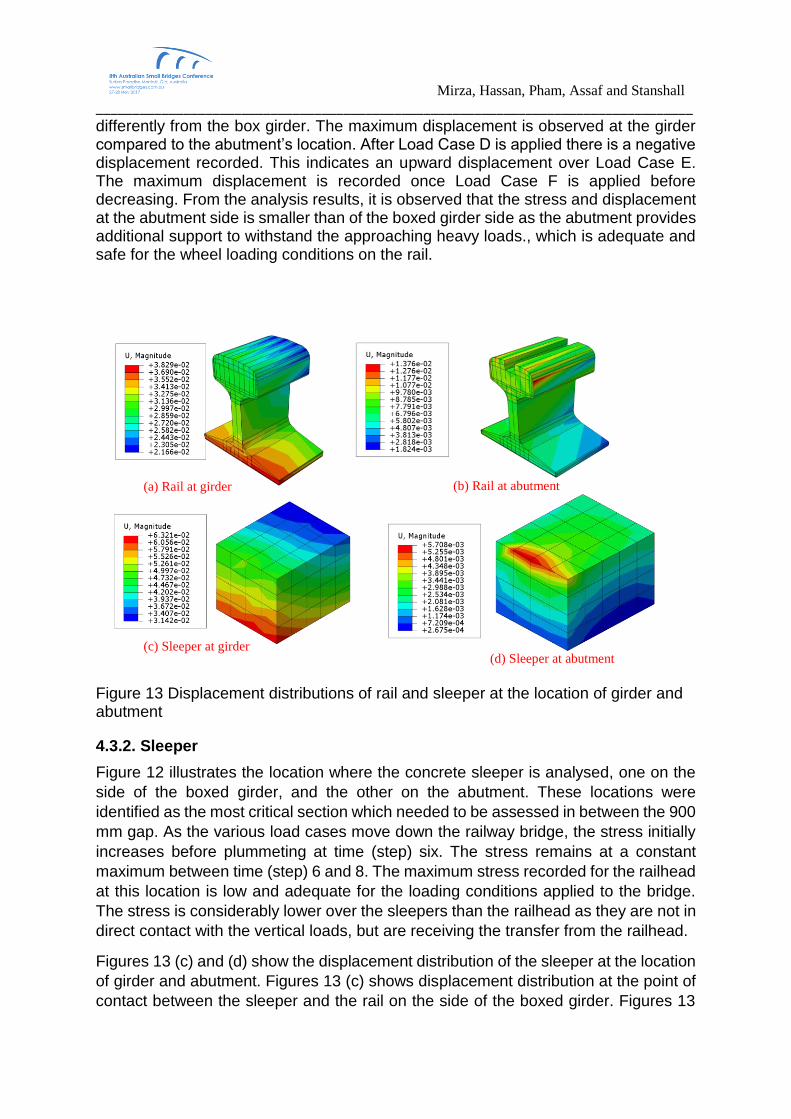
Figures 13 (a) and (b) show the displacement distribution of the rail at the location of girder and abutment. The displacement recorded at the abutment varies quite
Abutment
Box girder
Rail Sleeper
Mirza, Hassan, Pham, Assaf and Stanshall __________________________________________________________________________________
differently from the box girder. The maximum displacement is observed at the girder compared to the abutment’s location. After Load Case D is applied there is a negative displacement recorded. This indicates an upward displacement over Load Case E. The maximum displacement is recorded once Load Case F is applied before decreasing. From the analysis results, it is observed that the stress and displacement at the abutment side is smaller than of the boxed girder side as the abutment provides additional support to withstand the approaching heavy loads., which is adequate and safe for the wheel loading conditions on the rail.
Figure 13 Displacement distributions of rail and sleeper at the location of girder and abutment
4.3.2. Sleeper
Figure 12 illustrates the location where the concrete sleeper is analysed, one on the
side of the boxed girder, and the other on the abutment. These locations were
identified as the most critical section which needed to be assessed in between the 900
mm gap. As the various load cases move down the railway bridge, the stress initially
increases before plummeting at time (step) six. The stress remains at a constant
maximum between time (step) 6 and 8. The maximum stress recorded for the railhead
at this location is low and adequate for the loading conditions applied to the bridge.
The stress is considerably lower over the sleepers than the railhead as they are not in
direct contact with the vertical loads, but are receiving the transfer from the railhead.
Figures 13 (c) and (d) show the displacement distribution of the sleeper at the location
of girder and abutment. Figures 13 (c) shows displacement distribution at the point of
contact between the sleeper and the rail on the side of the boxed girder. Figures 13
(a) Rail at girder (b) Rail at abutment
(c) Sleeper at girder (d) Sleeper at abutment
Mirza, Hassan, Pham, Assaf and Stanshall __________________________________________________________________________________
(d) shows displacement distribution at the point of contact between the sleeper and
the rail on the side of the abutment. The displacement recorded at the abutment varies
differently from that of the box girder. It noted that once Load Case D is applied there
is a distinctive negative displacement recorded at -0.0027 mm. This is an upward
displacement over Load Case E. The maximum displacement is recorded once Load
Case F is applied at a maximum of 0.0043 mm before decreasing to 0.0039 mm. It is
evident that the displacement at the abutment is much smaller than of the boxed girder,
this is supporting as the abutment provides additional sustenance to endure approach
velocity and loads of a locomotive.
5. CONCLUSIONS
This research effectively studied the effects of wheel loading on the existing railway components of the Minnamurra Railway Bridge, using finite element software ABAQUS where included the current wheel loads according to the Australia Standard. The railway components over eight load cases with simulated a standard passenger train with locomotive and carriages. The components studied in detail were the railhead and the sleepers, both pinned and fixed connection types. The bridge was analysed to determine the stress distribution and horizontal and vertical displacement across the sleepers and railhead. The critical component of the railway bridge was determined to be the rail of the bridge as it experiences high levels of stress. The stress on the rail is close to the yielding limit of the rail material. Conclusive results were found to determine stress distribution and vertical and horizontal displacement across the rail and supporting components of railway bridge. The results showed a maximum stress of 320 MPa at the point of the wheel rail contact at each load location of the train and carriages. The maximum vertical displacement across the railway bridge was 3 mm. In conclusion an adequate and detailed investigation was conducted into the wheel rail contacted of the Minnamurra Railway Bridge and the effects wheel loading has on the existing components of the bridge. It was found that the rail will no longer be adequate to support increasing loads of future trains. 6. RECOMMENDATIONS From the results that were obtained from the analysis it is distinctively recommended that if the loads are to be increased in the future than the rail head must be upgraded from 60kg to 68kg. This will ensure that the rail can withstand faster and heavier locomotive and also to safeguard passengers and assets long into the future. Improvement to the materials properties or the cross sectional shape of the rail head is recommended. The rail head is approaching the yield limit for the material and if trains continue to increase load or speed the rail head has a high chance of passing its yielding limits. Increasing the width of the rail heads base, will reduce the likeliness of buckling. Due to the age of the Minnamurra Bridge, wear on the rail has likely occurred. The tip of the railhead will have worn down over time and due to the increasing loads from trains it has further accelerated such process. As the wheel loads in the simulation have shown the rail at yielding limit the assumption was made that the point loads were increasing the maximum stress at the point of the load. This indicates that the rails will undergo deformation at the tip of the rail head increasing the chance a wheel may slip or come off a rail causing catastrophe. Regular maintenance will be required to maintain full integrity of the rail.
Mirza, Hassan, Pham, Assaf and Stanshall __________________________________________________________________________________
ACKNOWLEDGMENTS
The technical support provided by Western Sydney University is gratefully acknowledged.
REFERENCES 1. Chikermane S. A. Structural Health Monitoring of a Steel Railway Bridge for
Increased Axle Loads. Structural Engineering International 2011, Volume 21, No. 2, pp. 210-216.
2. Li D.; Otter D.; Carr G. 'Railway Bridge Approaches under Heavy Axle Load Traffic: Problems, Causes, and Remedies. Proceedings of the Institution of Mechanical Engineers, Part F: Journal of Rail and Rapid Transit 2010, Volume 224, No. 5, pp. 383-390.
3. Zhai W.; Sun X. A Detailed Model for Investigating Vertical Interaction between Railway Vehicle and Track. International Journal of Vehicle Mechanics and Mobility 1994. Volume 23, pp. 603-15.
4. Li D.; Davis D. Transition of railroad bridge approaches. Journal of Geotechnical and Geoenvironmental Engineering 2005, Volume 131, No. 11, pp. 1392-1398.
5. Australian standards AS5100.2.2004. Bridge design—Design loads.
6. Mundrey J. Railway track engineering, Tata McGraw-Hill Education, 2009.
AUTHOR BIBIOGRAGHY Dr. Mirza worked as a structural engineer for eight years before pursuing her academic
career. She worked for Leighton Contractors, Australia Consulting Engineers and the
Cardno Group. She is currently the Chair for Engineers Australia Western Sydney
Regional Group and Representative for Women in Engineering Western Sydney
Region. She has many ongoing projects within the government sector including
Transport for New South Wales, Roads Maritime Services and in the private sectors
such as Rondo, Wagners, EPC,VSL and many more. One of her project recently was
nominated for 2017 Prime Minister’s Science Award. The project is related to