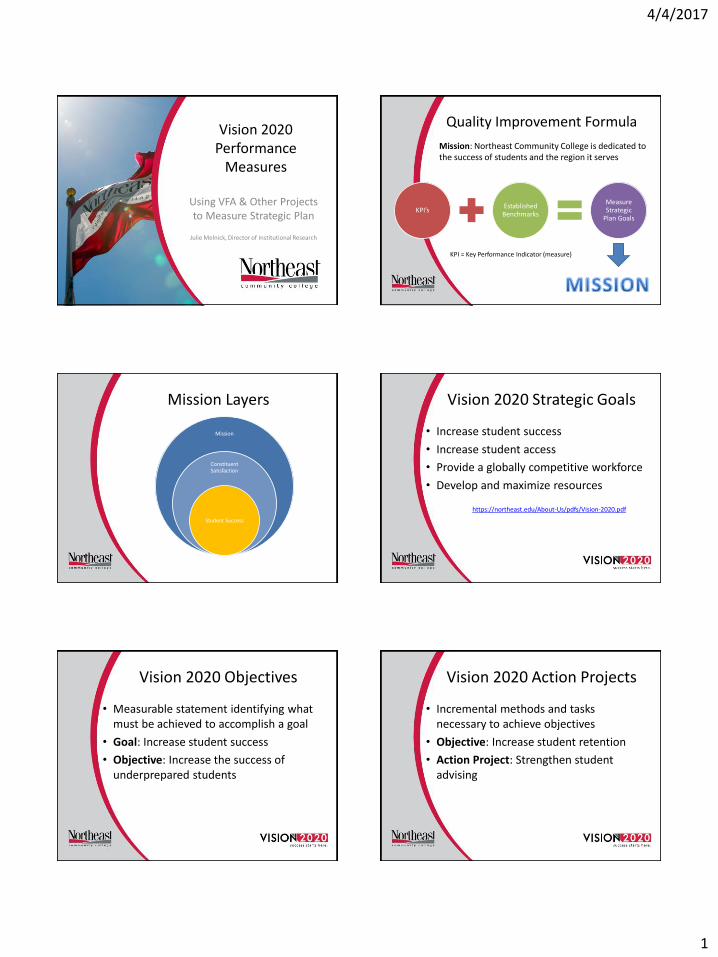
4/4/2017 1 Vision 2020 Performance Measures Using VFA & Other Projects to Measure Strategic Plan Julie Melnick, Director of Institutional Research KPI’s Established Benchmarks Measure Strategic Plan Goals Quality Improvement Formula Mission: Northeast Community College is dedicated to the success of students and the region it serves KPI = Key Performance Indicator (measure) Mission Constituent Satisfaction Student Success Mission Layers Vision 2020 Strategic Goals • Increase student success • Increase student access • Provide a globally competitive workforce • Develop and maximize resources https:// northeast.edu/About-Us/pdfs/Vision-2020.pdf Vision 2020 Objectives • Measurable statement identifying what must be achieved to accomplish a goal • Goal: Increase student success • Objective: Increase the success of underprepared students Vision 2020 Action Projects • Incremental methods and tasks necessary to achieve objectives • Objective: Increase student retention • Action Project: Strengthen student advising
Transcript
4/4/2017
1
Vision 2020 Performance
Measures
Using VFA & Other Projects to Measure Strategic Plan
Julie Melnick, Director of Institutional Research
KPI’sEstablished Benchmarks
Measure Strategic
Plan Goals
Quality Improvement Formula
Mission: Northeast Community College is dedicated to the success of students and the region it serves
* I attended the Benchmarking conference at JCCC in 2011, which gave me many great ideas towards measuring our strategic plan!
Dashboard Ideas
Vision 2020 Performance Measures Bubbles
• Five colors measuring amount of success towards reaching target
• Based off of “stoplight” colors
– Red: needs attention
– Yellow: needs improvement
– Light green: nearing expectations (target)
– Green: meeting expectations (target)
– Gray: if qualitative project, completed
Vision 2020 Performance Measures Scores
• Four scores designed to measure success
• Based off of “GPA” values
– Red: 1.0
– Yellow: 2.0 (average)
– Light green: 3.0
– Green, and then Gray: 4.0
* I got the idea of using GPA values when one of our HR staff used this method to describe our Climate survey outcomes People relate easily to these scores!!
4/4/2017
3
Vision 2020 Performance Measures Movement
• Four directions designed to measure success over time
• Direction– : up from last year
– : down from last year
–: stayed the same
– B: baseline year* (first year for collecting data) or percentage circles back to baseline value
* Baseline year or percentage is automatically yellow (or average)
Vision 2020 Performance Measures Movement & Color
• Where directions will appear
– : if up from last year and same color, appear in bubble; otherwise, next to score if color change occurred
– : down from last year, same as above
–: stayed the same, in bubble
– B: if percentage circles back to baseline value, appear in bubble, and arrow will display where appropriate
– : down from last year and same color – 0.1 (never to go below current color score)
• Example
– Last year, a score was 3.0 (light green). This year, the color is still light green, but the percentage improved. The new score is 3.1
Quantitative Measures
Benchmarking Sources
Institutional KPI’s
(Student Success &
Constituents)
NCCBP (Year 4)
VFA (ongoing)
WTBP (Year 4)
IPEDS (ongoing)
NACUBO (develop baseline)
VFA = Voluntary Framework of AccountabilityIPEDS = Integrated Postsecondary Education Data SystemNCCBP = National Community College Benchmarking ProjectWTBP = Workforce Training Benchmarking ProjectNACUBO = used for financial indicators (no data submission)
Benchmarking Sources
• Measures based on:
– Numerical measurements against a baseline value
– Some kind of benchmarking source*, such as IPEDS or VFA, for baseline and/or target calculations and values
– A history, if one exists and is relevant
* While only one benchmarking source was eventually chosen per measure, all relevant ones were taken into consideration when establishing baselines & benchmarks for that measure. For example, VFA was chosen as the BEST source to measure remedial outcomes, even though others measured it as well (like NCCBP)
4/4/2017
4
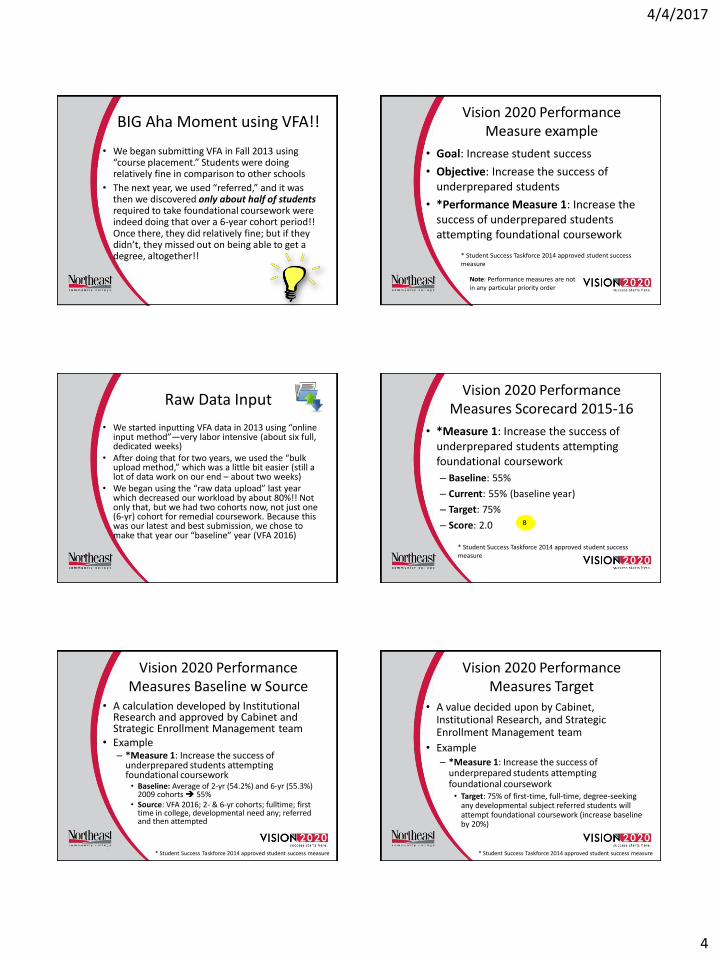
BIG Aha Moment using VFA!!
• We began submitting VFA in Fall 2013 using “course placement.” Students were doing relatively fine in comparison to other schools
• The next year, we used “referred,” and it was then we discovered only about half of students required to take foundational coursework were indeed doing that over a 6-year cohort period!! Once there, they did relatively fine; but if they didn’t, they missed out on being able to get a degree, altogether!!
Vision 2020 Performance Measure example
• Goal: Increase student success
• Objective: Increase the success of underprepared students
• *Performance Measure 1: Increase the success of underprepared students attempting foundational coursework
Note: Performance measures are not in any particular priority order
Raw Data Input
• We started inputting VFA data in 2013 using “online input method”—very labor intensive (about six full, dedicated weeks)
• After doing that for two years, we used the “bulk upload method,” which was a little bit easier (still a lot of data work on our end – about two weeks)
• We began using the “raw data upload” last year which decreased our workload by about 80%!! Not only that, but we had two cohorts now, not just one (6-yr) cohort for remedial coursework. Because this was our latest and best submission, we chose to make that year our “baseline” year (VFA 2016)
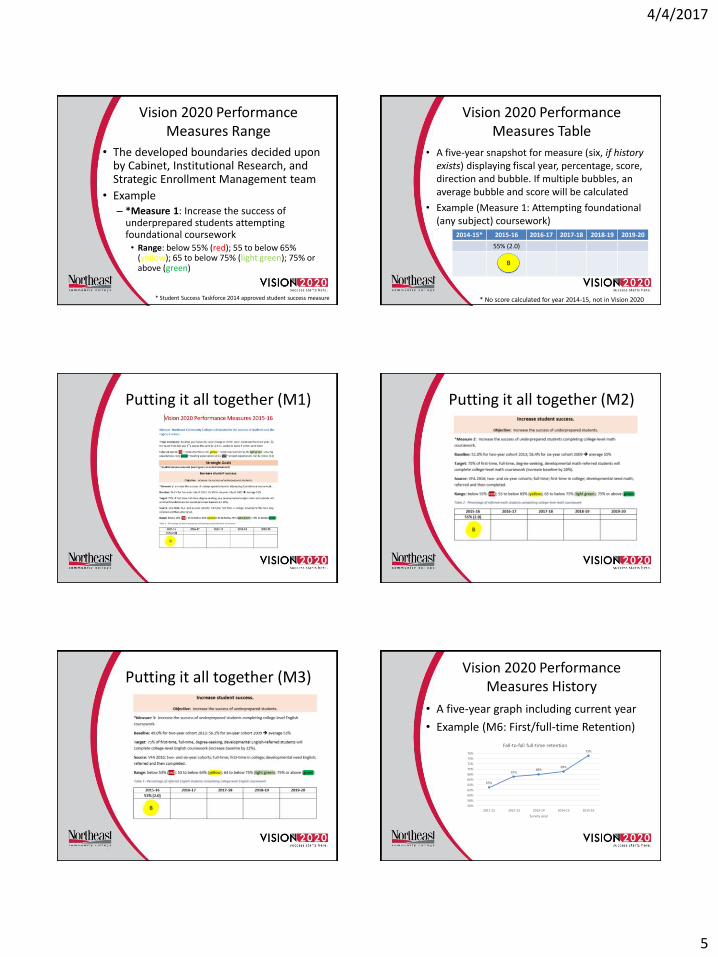
• A five-year snapshot for measure (six, if history exists) displaying fiscal year, percentage, score, direction and bubble. If multiple bubbles, an average bubble and score will be calculated
• Example (Measure 1: Attempting foundational (any subject) coursework)
2014-15* 2015-16 2016-17 2017-18 2018-19 2019-20
55% (2.0)
B
* No score calculated for year 2014-15, not in Vision 2020
Putting it all together (M1) Putting it all together (M2)
Putting it all together (M3)Vision 2020 Performance