+ All Categories
Home > Documents > Mississippi Mills Wastewater System · Mississippi Mills Wastewater System 2016 Annual Report ......

Mississippi Mills Wastewater System · Mississippi Mills Wastewater System 2016 Annual Report ......

Date post: 16-Apr-2018
Category:
Upload: duonghuong
View: 219 times
Download: 3 times
Share this document with a friend
62
Mississippi Mills Wastewater System 2016 Annual Report January 1, 2016 – December 31, 2016 Prepared By This report has been prepared to meet the requirements set out in the facility Certificate of Approval #42425-8DXR5U issued February 16, 2011 and Certificate of Approval #1637-AC8NT7.
Transcript

Mississippi Mills Wastewater System

2016 Annual Report

January 1, 2016 – December 31, 2016

Prepared By

This report has been prepared to meet the requirements set out in the facility Certificate of Approval #42425-8DXR5U issued February 16, 2011 and Certificate of Approval #1637-AC8NT7.

Ontario Clean Water Agency – Mississippi Mills Wastewater System – 2016 Annual Report

Contents

Compliance Report Card ..................................................................................... 1

System/Process Description ................................................................................ 2

Primary Treatment ...................................................................................................................... 2

Chemical Addition ....................................................................................................................... 2

Secondary Treatment .................................................................................................................. 2

Tertiary Treatment ...................................................................................................................... 2

Solids Handling ............................................................................................................................ 2

Septage Receiving ....................................................................................................................... 2

Proposed Alterations, Extensions, or Replacement to Works .................................................... 2

Effluent Quality Assurance or Control Measures ................................................. 2

Treatment Flows ................................................................................................. 4

Raw Flow (m3/d) ......................................................................................................................... 4

Annual Comparison (m3) ............................................................................................................ 4

Septage Volumes ......................................................................................................................... 5

Monthly Received ................................................................................................................................. 5

Monthly Processed ............................................................................................................................... 5

Raw Sewage Quality ........................................................................................... 5

Effluent Quality ................................................................................................... 6

Effluent Exceedance Summary .................................................................................................... 6

Limit ...................................................................................................................................................... 6

Other Effluent Sampling Issues ............................................................................................................. 6

Effluent Parameter Summary...................................................................................................... 7

CBOD5 ................................................................................................................................................... 7

Total Suspended Solids ......................................................................................................................... 8

Total Phosphorus .................................................................................................................................. 9

Total Ammonia Nitrogen..................................................................................................................... 10

E-coli .................................................................................................................................................... 11

pH ........................................................................................................................................................ 11

Acute Lethality .................................................................................................................................... 12

Septage Quality ................................................................................................ 12

Ontario Clean Water Agency – Mississippi Mills Wastewater System – 2016 Annual Report

Biosolids ........................................................................................................... 12

Biosolids Disposal Summary ...................................................................................................... 12

Annual Comparison ................................................................................................................... 12

Quality ....................................................................................................................................... 13

Summary of Complaints .................................................................................... 13

Summary of Bypass/Overflows ......................................................................... 13

Summary of Spills/Abnormal Discharges........................................................... 13

Maintenance..................................................................................................... 13

Maintenance Highlights ............................................................................................................ 14

Calibration ........................................................................................................ 15

Appendix

Facility Assessment Report ................................................................................ A

Septage Sample Data ......................................................................................... B

Biosolids Application Summary ........................................................................... C

Calibration Records ............................................................................................ D

Ontario Clean Water Agency – Mississippi Mills Wastewater Treatment System – 2016 Annual Report

Rev. 1 Issued: 24-Mar-2017 P a g e | 1

Compliance Report Card

Compliance Event # of Events Details

Ministry of Environment Inspections 1

Inspection completed in February 2016 Report received October 2016

Seven(7) required actions identified

Ministry of Labour Inspections 0

Effluent Parameter Exceedances 1 December 30, 2016 grab pH

Bypass/Overflows 1 Tertiary Filter By-Pass

Community Complaints 0

Spills 0

Ontario Clean Water Agency – Mississippi Mills Wastewater Treatment System – 2016 Annual Report

Rev. 1 Issued: 24-Mar-2017 P a g e | 2

System/Process Description

Primary Treatment

Flow enters the treatment and passes through screen channels which contain fine screens that lead to a

screw compactor. Grit is removed using circular vortex grit removal, air lift and grit classifier system units

Chemical Addition

Chemicals are added to the process for phosphorus control.

Secondary Treatment

The Mississippi Mills WPCP supports a Two (2) treatment train system using the extended aeration

activated sludge process. Each train is equipped with aeration tanks, anoxic tanks and a secondary

clarifier.

Tertiary Treatment

Five (5) filter trains with three (3) filtration cells in each. Disinfection is provided using Ultraviolet (UV)

lights. There is ability for chlorine disinfection in the event the UV units fail.

Solids Handling

Solids from the biological process are transferred from the waste tank to a rotary disk thickener. From

there the solids are processed through autothermic thermophilic aerobic digesters. The solids are then

pressed to a cake form.

Septage Receiving

The Mississippi Mills WWTP also consists of a septage receiving station consisting of a storage tank, two

(one duty and one standby) dry-pit pumps, and a grinder on the inlet piping

Proposed Alterations, Extensions, or Replacement to Works There are no proposed alterations, extensions or replacements that would affect the Certificate of

Approval.

Effluent Quality Assurance or Control Measures The Municipality of Mississippi Mills facilities are part of OCWA’s operational Mississippi Cluster. The

facilities are supported by regional and corporate resources. Operational Services are delivered by OCWA

staff that live and work in the community.

OCWA operates facilities in compliance with applicable regulations. The facility has comprehensive

manuals detailing operations, maintenance, instrumentation, and emergency procedures. All procedures

are treated as active documents, with annual reviews.

OCWA has additional “Value Added” and operational support services that the Municipality of Mississippi

Mills benefits from including:

Ontario Clean Water Agency – Mississippi Mills Wastewater Treatment System – 2016 Annual Report

Rev. 1 Issued: 24-Mar-2017 P a g e | 3

Access to a network of operational compliance and support experts at the regional and corporate

level, as well as affiliated programs that include the following:

o Quality & Environmental Management System, Occupational Health & Safety System and

an internal compliance audit system.

o Process Data Management (PDM) facility operating information repository, which

consolidates field data, online instrumentation, and electronic receipt of lab test results

for reporting, tracking and analysis.

o Work Management System (WMS) that tracks and reports maintenance activity, and

creates predictive and preventative reports.

o Outpost 5 wide-area SCADA system allows for process optimization and data logging,

process trending, remote alarming and optimization of staff time.

Client reporting which includes operational data, equipment inventory, financial statements,

maintenance work orders, and capital status reports

Site-Specific Contingency Plans and Standard Operating Procedures

Use of accredited laboratories

Additional support in response to unusual circumstances, and extra support in an emergency.

Use of sampling schedules for external laboratory sampling

Ontario Clean Water Agency – Mississippi Mills Wastewater Treatment System – 2016 Annual Report

Rev. 1 Issued: 24-Mar-2017 P a g e | 4

Treatment Flows

Raw Flow (m3/d)

Annual average flow for 2016 = 2816.59 m3/d

Flow spikes are associated to wet weather events such as rain and seasonal changes such as the spring

snow melt.

Annual Comparison (m3)

Jan Feb Mar Apr May Jun Jul Aug Sep Oct Nov Dec

Design Average (m3/d) 4700 4700 4700 4700 4700 4700 4700 4700 4700 4700 4700 4700

Average Daily Flow (m3/d) 2993 3205 6129 4388 2988 1454 1533 1959 1680 2189 2253 3027

500

1500

2500

3500

4500

5500

6500

Jan Feb Mar Apr May Jun Jul Aug Sep Oct Nov Dec

Peak Capacity (m3/d) 14100 14100 14100 14100 14100 14100 14100 14100 14100 14100 14100 14100

Maximum Daily Flow (m3/d) 8168 5512 11779 11971 5273 2112 1908 4536 3361 5342 2749 8555

5002500450065008500

10500125001450016500

2012 2013 2014 2015 2016

Total Annual Flow 308093 969878 1285551 884055 1031585

0

200000

400000

600000

800000

1000000

1200000

1400000

Ontario Clean Water Agency – Mississippi Mills Wastewater Treatment System – 2016 Annual Report

Rev. 1 Issued: 24-Mar-2017 P a g e | 5

Septage Volumes Average daily flow for 2016 = 5.905m3/d

Total Flow for 2016 = 2161 m3

Total Monthly Volume Received

Monthly Volumes Processed

Average Flow (m3/d) is the total sum of the volume of the loads received for the month which is then

divided by the days in the month.

Design Average (m3/d) sets the capacity limit based on the total sum of the volume of the loads received

for the month which is then divided by the days in the month.

Maximum Flow (m3/d) indicates largest single day volume received in the month.

Jan Feb Mar Apr May Jun Jul Aug Sep Oct Nov Dec

Volume (m3) 166 91 157 182 135 185 101 257 267 185 278 158

0

50

100

150

200

250

300

Jan Feb Mar Apr May Jun Jul Aug Sep Oct Nov Dec

Average Flow(m3/d) 5 3 5 6 4 6 3 8 9 6 9 5

Design Average (m3/d) 35 35 35 35 35 35 35 35 35 35 35 35

Maximum Flow (m3/d) 49 22 46 31 40 37 26 50 45 40 52 29

0

10

20

30

40

50

60

Ontario Clean Water Agency – Mississippi Mills Wastewater Treatment System – 2016 Annual Report

Rev. 1 Issued: 24-Mar-2017 P a g e | 6

Septage Capacity Utilization

Septage Capacity (%) is based on Average Flow (m3/d) over Design Average (m3/d).

Raw Sewage Quality Results of raw sewage concentrations and loadings are available in the Facility Performance Assessment

Report in Appendix A.

Effluent Quality The limits are based on current requirements in the facilities Environmental Compliance Approval.

Laboratory samples are submitted to an accredited laboratory for regulatory analysis.

The Federal Government also regulates certain sewage effluent parameters under the Federal Fisheries

Act. The results are submitted to Environment and Climate Change Canada’s Effluent Regulatory and

Reporting Information System (ERRIS) on a quarterly basis.

Effluent Exceedance Summary

Limit

Sample Date Parameter Exceedance of Limit Value Corrective Action

Final

Effluent

December

30, 2016 pH

Certificate of

Approval 6-9 5.7

Unknown reason for low level. All other residuals including the on-line show within compliance.

Other Effluent Sampling Issues

Sample Legislation Date Details Response

There were no other operational issues affecting effluent quality

0.0

5.0

10.0

15.0

20.0

25.0

30.0

Jan Feb Mar Apr May Jun Jul Aug Sep Oct Nov Dec

Ontario Clean Water Agency – Mississippi Mills Wastewater Treatment System – 2016 Annual Report

Rev. 1 Issued: 24-Mar-2017 P a g e | 7

Effluent Parameter Summary

CBOD5

Concentration (mg/L)

Loading (kg/d)

Jan Feb Mar Apr May Jun Jul Aug Sep Oct Nov Dec

Limit 25 25 25 25 25 25 25 25 25 25 25 25

Objective 10 10 10 10 10 10 10 10 10 10 10 10

Average 3 3 3 3 3 3 3 3 3 3 3 3

0

5

10

15

20

25

30

Jan Feb Mar Apr May Jun Jul Aug Sep Oct Nov Dec

Limit 117.5 117.5 117.5 117.5 117.5 117.5 117.5 117.5 117.5 117.5 117.5 117.5

Objective 47 47 47 47 47 47 47 47 47 47 47 47

Average 8 9 14 12 8 4 4 4 4 5 5 8

0

20

40

60

80

100

120

140

Ontario Clean Water Agency – Mississippi Mills Wastewater Treatment System – 2016 Annual Report

Rev. 1 Issued: 24-Mar-2017 P a g e | 8

Total Suspended Solids

Concentration (mg/L)

Loading (kg/d)

Jan Feb Mar Apr May Jun Jul Aug Sep Oct Nov Dec

Limit 15 15 15 15 15 15 15 15 15 15 15 15

Objective 10 10 10 10 10 10 10 10 10 10 10 10

Average 5 5 4 4 4 4 3 5 5 4 3 6

0

2

4

6

8

10

12

14

16

Jan Feb Mar Apr May Jun Jul Aug Sep Oct Nov Dec

Limit 70.5 70.5 70.5 70.5 70.5 70.5 70.5 70.5 70.5 70.5 70.5 70.5

Objective 47 47 47 47 47 47 47 47 47 47 47 47

Average 13 16 17 14 11 4 4 7 6 7 5 16

0

10

20

30

40

50

60

70

80

Ontario Clean Water Agency – Mississippi Mills Wastewater Treatment System – 2016 Annual Report

Rev. 1 Issued: 24-Mar-2017 P a g e | 9

Total Phosphorus

Concentration (mg/L)

Loading (kg/d)

Jan Feb Mar Apr May Jun Jul Aug Sep Oct Nov Dec

Limit 0.30 0.30 0.30 0.30 0.30 0.20 0.20 0.20 0.30 0.30 0.30 0.30

Objective 0.15 0.15 0.15 0.15 0.15 0.15 0.15 0.15 0.15 0.15 0.15 0.15

Average 0.04 0.04 0.06 0.04 0.06 0.04 0.02 0.06 0.06 0.04 0.06 0.06

0.00

0.05

0.10

0.15

0.20

0.25

0.30

0.35

Jan Feb Mar Apr May Jun Jul Aug Sep Oct Nov Dec

Limit 1.41 1.41 1.41 1.41 1.41 0.94 0.94 0.94 1.41 1.41 1.41 1.41

Objective 0.71 0.71 0.71 0.71 0.71 0.71 0.71 0.71 0.71 0.71 0.71 0.71

Average 0.10 0.12 0.26 0.17 0.16 0.05 0.03 0.08 0.08 0.06 0.09 0.16

0

0.2

0.4

0.6

0.8

1

1.2

1.4

1.6

Ontario Clean Water Agency – Mississippi Mills Wastewater Treatment System – 2016 Annual Report

Rev. 1 Issued: 24-Mar-2017 P a g e | 10

Total Ammonia Nitrogen

Concentration (mg/L)

Loading (kg/d)

Jan Feb Mar Apr May Jun Jul Aug Sep Oct Nov Dec

Limit 15.0 15.0 15.0 15.0 5.0 5.0 5.0 5.0 15.0 15.0 15.0 15.0

Objective 12.0 12.0 12.0 12.0 3.0 3.0 3.0 3.0 12.0 12.0 12.0 12.0

Average 0.0 0.0 0.0 0.0 0.0 0.0 0.0 0.0 0.0 0.0 0.0 0.0

0.0

2.0

4.0

6.0

8.0

10.0

12.0

14.0

16.0

Jan Feb Mar Apr May Jun Jul Aug Sep Oct Nov Dec

Limit 70.5 70.5 70.5 70.5 23.5 23.5 23.5 23.5 70.5 70.5 70.5 70.5

Objective 56.4 56.4 56.4 56.4 14.1 14.1 14.1 14.1 56.4 56.4 56.4 56.4

Average 0.0 0.0 0.0 0.0 0.0 0.0 0.0 0.0 0.0 0.0 0.0 0.1

0

10

20

30

40

50

60

70

80

Ontario Clean Water Agency – Mississippi Mills Wastewater Treatment System – 2016 Annual Report

Rev. 1 Issued: 24-Mar-2017 P a g e | 11

E-coli

Geometric Mean Average

All individual sample results were lower than the reportable value of <2.

pH

This parameter is tested in-house.

The minimum monthly pH for December was outside of the limits of 6-9. Details can be seen in the

Effluent Exceedance Summary section of this report.

Jan Feb Mar Apr May Jun Jul Aug Sep Oct Nov Dec

Limit 200 200 200 200 200 200 200 200 200 200 200 200

Objective 100 100 100 100 100 100 100 100 100 100 100 100

Geometric Mean Avg 2 2 2 2 2 2 2 2 2 2 2 2

0

50

100

150

200

250

Jan Feb Mar Apr May Jun Jul Aug Sep Oct Nov Dec

Max Monthly pH 7.75 7.41 7.69 7.66 7.56 7.36 7.35 7.46 7.16 7.11 7.5 7.47

Min Monthly pH 7.31 7.32 7.41 7.53 6.99 6.95 6.98 6.98 6.9 6.55 6.8 5.7

6

6.5

7

7.5

8

8.5

9

9.5

Ontario Clean Water Agency – Mississippi Mills Wastewater Treatment System – 2016 Annual Report

Rev. 1 Issued: 24-Mar-2017 P a g e | 12

Acute Lethality

There were four (4) samples collected in 2016 and tested for acute lethality (Rainbow Trout and Daphnia

Magna). Results are displayed as % mortality.

Quarter Rainbow Trout Daphnia Magna

1st Quarter 0% 0%

2nd Quarter 0% 0%

3rd Quarter 0% 0%

4th Quarter 0% 0%

Septage Quality Septage was tested when received. A summary of the results are attached in Appendix B. Grab samples

are collected from each load.

Biosolids Sludge generated from the treatment plant was spread on agricultural land during the spreading season as per the Nutrient Management Act O.Reg 267/03. This facility dewaters and biosolids are handled as cake. During the winter cake is stored on-site until certified sites are ready for spreading. During the spreading season the operating authority contracts cake haulage to Terratec Environmental. This company maintains a bank of available land for agricultrual disposal of biosolids. This information is included in Appendix C.

Biosolids Disposal Summary

The disposal summary is provided by Terratec (Waste Management #4400-4LBLXD) and is available in

Appendix C.

Annual Comparison

2014 2015 2016

Annual Sludge Volume (tonnes) 767.12 974.75 766.89

0

200

400

600

800

1000

1200

Ontario Clean Water Agency – Mississippi Mills Wastewater Treatment System – 2016 Annual Report

Rev. 1 Issued: 24-Mar-2017 P a g e | 13

It is anticipated that sludge volumes will remain constant based on the average treated volumes and past

years history since the upgrades.

Quality

The biosolids sampling results are summarized in Appendix C. All results met the established guidelines.

Summary of Complaints The following community complaints were received related to the operations of the Mississippi Mills WWTP.

Date Location Details Corrective Action Taken

There were no complaints received at the treatment plant

Summary of Bypass/Overflows On the March 29, 2016 the facilities filtrate holding tank which receives waste process water was

hydraulically overloaded. Both pumps were running at maximum capacity when the tank spilled over

using designed overflow pipe into the UV disinfection channel. The tanks high level alarm occurred at 9:58

am and the overflow occurred at 10:30 am, lasting 47 minutes. Plant was under high flow conditions at

the time but was below peak design flow.

Overflow was stopped when the operator noticed high level conditions during SCADA check. Processes

that sent water to the tank were shut down and plant flow was attenuated to lessen load on pumps. Level

began to drop and overflow stopped immediately. Flow to the tank was gradually reintroduced once level

had returned to normal.

Summary of Spills/Abnormal Discharges There were no spills or abnormal discharges reported in 2016.

Maintenance OCWA uses a risk-based preventative maintenance framework that ensures assets are maintained to manufacturer’s and/or industry standards. Maintenance is completed using various tools and operational supports. The Ottawa Valley Hub has specialized certified staff such as Millwrights, Electricians and Instrumentation Specialists to name a few. OCWA uses a Workplace Maintenance System (WMS). WMS is a maintenance tracking system that can generate work orders as well as give summaries of completed and scheduled work. During the year, the operating authority at the facility generates scheduled work orders on a weekly, monthly and annual basis. The service work is recorded in the work order history. This ensures routine and preventive

Ontario Clean Water Agency – Mississippi Mills Wastewater Treatment System – 2016 Annual Report

Rev. 1 Issued: 24-Mar-2017 P a g e | 14

maintenance is carried out. Emergency and capital repair maintenance is completed and added to the system. Capital projects are listed and provided to the Municipality of Mississippi Mills in the form of a “Capital Forecast”. This list is developed by facility staff and provides recommendations for facility components requiring upgrading or improvement.

Maintenance Highlights

WO # Summary

105147 Capital Gemmill’s Park heater to 600V 10 kW

171260 Capital UVT Sensor Service

171278 Capital Headworks Heater Failure

171490 Corrective Grit Vortex #1 and #2 Drive Motor Rebuild

171801 Capital Septage receiving modifications

190673 Capital Thermometer for glycol return

212845 Capital Septage receiving insulation

212852 Capital Seacan Air Conditioner Gemmills Bay SPS

105145 Capital E-stop cable for Fournier conveyor

105833 Capital Portable pH Probe

105973 Capital Transfer switch Condensation Gemmill’s Bay SPS

106375 Capital A/C unit for Transfer Switch Gemmill’s Bay SPS

125344 Capital loss of Comm's (3) Gemmill's Bay SPS

125366 Capital Headworks o2 sensor

146889 Capital Filtrate Tank Sand Removal/Cleanout

147638 Capital Filtrate Tank Clean Out

147898 Capital Pump Filtrate P751

28581 Capital require proper eyewash station for lab

29335 Capital backflow 6" filter area

29363 Capital Gemmill's Bay wetwell clean-out

35817 Capital Glass SPS lack of exterior lighting

35967 Capital SCADA loss of communication

36046 Capital Pumps 01&3 rebuild Gemmill’s Bay SPS

36674 Capital MAU 1 failure

36787 Capital Fire system repairs

36997 Capital HVAC MAU 01 & boilers

48605 Capital Backflow Gemmill’s Bay SPS

48686 Capital PLC loss of communication Gemmill's Bay SPS

48690 Capital UV system

49038 Capital - RMI Gas Detector, Purchase Calibration Supplies

49432 Capital atad solenoid failure

Ontario Clean Water Agency – Mississippi Mills Wastewater Treatment System – 2016 Annual Report

Rev. 1 Issued: 24-Mar-2017 P a g e | 15

WO # Summary

61027 Capital HVAC MAU 01 & boilers

61110 Capital sirens and alarms

61193 Capital tertiary filter material

61869 Capital back up alarm system cellular

73166 Capital Communication failure Gemmills Bay SPS

73452 Captial Seepex Pump Replacement Parts

73525 Capital Pump 03 Gemmill's Bay SPS

73816 Capital Handrail failure

87386 Capital Clarifier Maintenance

87839 Capital Seacan Air conditioner Repairs Gemmill’s Bay SPS

88049 Capital Effluent Sensor Electrodes

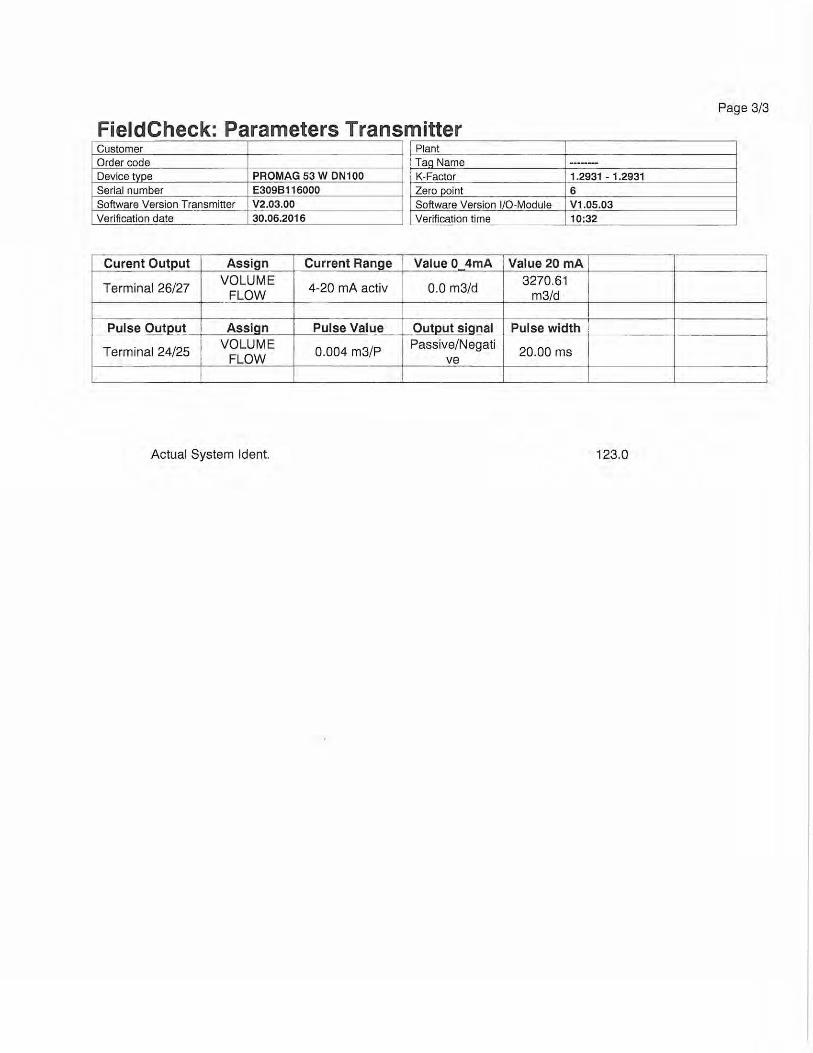
Calibration The flow meters were calibrated on January 19, 2016. Records are attached in Appendix D. Analyzers are

scheduled for monthly maintenance in the WMS program. Work is completed and logged in the logbook

and in the WMS.

Ontario Clean Water Agency – Mississippi Mills Wastewater Treatment System – 2016 Annual Report

Appendix A

Facility Assessment Report

Report extracted 03/03/2017 07:44 From:

Facility: [5678] MISSISSIPPI MILLS WASTEWATER TREATMENT FACILITY

Works: [5678] MISSISSIPPI MILLS WASTEWATER TREATMENT FACILITY01/2016 02/2016 03/2016 04/2016 05/2016 06/2016 07/2016 08/2016 09/2016 10/2016 11/2016 12/2016 <--Total--> <--Avg.--> <--Max.--> <--Criteria-->

Flows:

Raw Flow: Total - Raw Sewage (m³) 92775.69 92947.64 189999.34 131644.51 92637.27 43627.96 47519.87 60720.55 50385.35 67872.96 67603.43 93850.69 1031585.26

Raw Flow: Avg - Raw Sewage (m³/d) 2992.76 3205.09 6129.01 4388.15 2988.3 1454.27 1532.9 1958.73 1679.51 2189.45 2253.45 3027.44 2816.59

Raw Flow: Max - Raw Sewage (m³/d) 8168.48 5511.59 11778.64 11970.67 5272.79 2112.24 1908.28 4535.59 3360.91 5342.37 2749.31 8554.77 11970.67

Eff. Flow: Total - Final Effluent (m³) 81464.04 87565.23 140897.9 116688.49 84185.39 36440.68 39506.43 43013.56 38714.61 55824.46 49342.46 80847.3 854490.55

Eff. Flow: Avg - Final Effluent (m³/d) 2627.87 3019.49 4545.09 3889.62 2715.66 1214.69 1274.4 1387.53 1290.49 1800.79 1644.75 2607.98 2334.86

Eff. Flow: Max - Final Effluent (m³/d) 4199.55 4915.75 7830.78 6633.93 4832.17 1957.31 1626.85 3117.98 2271.74 4481.74 2528.87 6593.69 7830.78

Carbonaceous Biochemical Oxygen Demand: CBOD:

Raw: # of samples of cBOD5 - Raw Sewage (mg/L) 4 4 5 4 4 5 4 5 4 4 5 4 52

Eff: Avg cBOD5 - Final Effluent (mg/L) < 3 < 3 < 3 < 3 < 3 < 3.2 < 3 < 3.2 < 3 < 3 < 3 < 3 < 3.033 < 3.2 25.0

Eff: # of samples of cBOD5 - Final Effluent (mg/L) 4 4 5 4 4 5 3 5 4 4 5 4 51

Loading: cBOD5 - Final Effluent (kg/d) < 7.884 < 9.058 < 13.635 < 11.669 < 8.147 < 3.887 < 3.823 < 4.44 < 3.871 < 5.402 < 4.934 < 7.824 < 7.048 < 13.635 117.5

Percent Removal: cBOD5 - Raw Sewage (mg/L) 97.19 96.273 94.915 96.439 98.02 98.709 98.587 98.157 98.475 98.737 98.223 97.414 98.737

Biochemical Oxygen Demand: BOD5:

Raw: # of samples of BOD5 - Raw Sewage (mg/L) 4 4 5 4 4 5 4 5 4 4 5 4 52

Eff: Avg BOD5 - Final Effluent (mg/L) < 4 < 3 < 3 < 4.25 < 3.75 < 3.4 < 3 < 3.6 < 3 < 3 < 3 < 3.5 < 3.375 < 4.25 25.0

Loading: BOD5 - Final Effluent (kg/d) < 10.511 < 9.058 < 13.635 < 16.531 < 10.184 < 4.13 < 3.823 < 4.995 < 3.871 < 5.402 < 4.934 < 9.128 < 8.017 < 16.531

Percent Removal: BOD5 - Raw Sewage (mg/L) 96.537 97.235 97.263 96.647 98.113 98.756 99.063 98.258 98.646 98.894 98.684 98 99.063

Total Suspended Solids: TSS:

Raw: Avg TSS - Raw Sewage (mg/L) 115.5 129 141.6 98 209.75 195.2 496 153.6 206.5 301 226.8 127 199.996 496

Raw: # of samples of TSS - Raw Sewage (mg/L) 4 4 5 4 4 5 4 5 4 4 5 4 52

Eff: Avg TSS - Final Effluent (mg/L) < 5 < 5.25 < 3.8 < 3.5 < 4 < 3.6 < 3 4.8 < 5 < 3.75 < 3 < 6 < 4.225 6 15.0

Eff: # of samples of TSS - Final Effluent (mg/L) 4 4 5 4 4 5 3 5 4 4 5 4 51

Loading: TSS - Final Effluent (kg/d) < 13.139 < 15.852 < 17.271 < 13.614 < 10.863 < 4.373 < 3.823 6.66 < 6.452 < 6.753 < 4.934 < 15.648 < 9.949 17.271 70.5

Percent Removal: TSS - Raw Sewage (mg/L) 95.671 95.93 97.316 96.429 98.093 98.156 99.395 96.875 97.579 98.754 98.677 95.276 99.395

Total Phosphorus: TP:

Raw: Avg TP - Raw Sewage (mg/L) 2.742 2.7 3.636 2.135 3.93 5.406 12.3 4.784 5.738 6.08 5.386 4.605 4.953 12.3

Raw: # of samples of TP - Raw Sewage (mg/L) 4 4 5 4 4 5 4 5 4 4 5 4 52

Eff: Avg TP - Final Effluent (mg/L) 0.038 0.04 0.058 0.042 0.058 < 0.04 0.02 0.056 0.06 0.035 0.056 0.06 < 0.047 0.06 0.2 - 0.3

Eff: # of samples of TP - Final Effluent (mg/L) 4 4 5 4 4 5 3 5 4 4 5 4 51

Loading: TP - Final Effluent (kg/d) 0.099 0.121 0.264 0.165 0.156 < 0.049 0.025 0.078 0.077 0.063 0.092 0.156 < 0.112 0.264

Percent Removal: TP - Raw Sewage (mg/L) 98.633 98.519 98.405 98.009 98.537 99.26 99.837 98.829 98.954 99.424 98.96 98.697 99.837

Nitrogen Series:

Raw: Avg TKN - Raw Sewage (mg/L) 24.048 23.475 17.268 17.575 26 45.96 52.55 39.52 45.575 47.948 44.38 38.45 35.229 52.55

Raw: # of samples of TKN - Raw Sewage (mg/L) 4 4 5 4 4 5 4 5 4 4 5 4 52

Eff: Avg TAN - Final Effluent (mg/L) < 0.01 < 0.01 < 0.01 < 0.01 < 0.01 < 0.01 < 0.01 < 0.01 < 0.01 < 0.01 < 0.024 < 0.02 < 0.012 < 0.024 5.0 - 15.0

Eff: # of samples of TAN - Final Effluent (mg/L) 4 4 5 4 4 5 3 5 4 4 5 4 51

Loading: TAN - Final Effluent (kg/d) < 0.026 < 0.03 < 0.045 < 0.039 < 0.027 < 0.012 < 0.013 < 0.014 < 0.013 < 0.018 < 0.039 < 0.052 < 0.027 < 0.052 4.0

Disinfection:

Eff: GMD E. Coli - Final Effluent (cfu/100mL) 1.682 2 2 2 2 2 2 2 2 2 2 2 1.973 2 200.0

Eff: # of samples of E. Coli - Final Effluent (cfu/100mL) 4 4 5 4 4 5 3 5 4 4 5 4 51

Ontario Clean Water AgencyPerformance Assessment Report Wastewater/Lagoon

01/01/2016 to 31/12/2016

Ontario Clean Water Agency – Mississippi Mills Wastewater Treatment System – 2016 Annual Report

Appendix B

Septage Sample Data

Report extracted 03/06/2017 11:11 From:

Facility Org Number:Facility Works Number:Facility Name:Facility Owner:Facility Classification:Receiver:Service Population:Total Design Capacity:

01/2016 02/2016 03/2016 04/2016 05/2016 06/2016 07/2016 08/2016 09/2016 10/2016 11/2016 12/2016 Total Avg Max MinSeptage / Biochemical Oxygen Demand: BOD5 - mg/L Count Lab 4 6 6 4 2 10 2 8 12 17 20 15 106 Max Lab 862 50700 3210 939 5270 3050 690 9930 1770 4900 10700 5310 50700 Mean Lab 344 9808.333 937.667 537 5185 915.6 390.5 2775.625 957 1617.941 2731.6 1632.2 2171.596 Min Lab 66 296 135 123 5100 142 91 78 33 44 69 73 33Septage / Septage Processed - m³ Count IH 31 29 31 30 31 30 31 31 30 31 30 31 366 Total IH 163.96 105.71 153.79 177.81 135.27 191.436 106.24 263.38 273.07 153.05 250.04 156.65 2130.406 Max IH 48.01 29.99 46.84 30.7 40.4 36.53 31.88 54.28 48.68 33.65 45.74 28.59 54.28

Mean IH 5.289 3.645 4.961 5.927 4.364 6.381 3.427 8.496 9.102 4.937 8.335 5.053 5.821 Min IH 0 0 0 0 0 0 0 0 0 0 0 0 0Septage / Septage Received - m³ Count IH 31 29 31 30 31 30 31 31 30 31 30 31 366 Total IH 165.62 91.24 156.6 181.74 135.27 184.66 100.96 256.5 267.37 184.64 278.22 158.25 2161.07 Max IH 49.34 21.5 45.72 30.7 40.4 37.13 26.36 49.94 45.08 39.67 51.56 28.68 51.56 Mean IH 5.343 3.146 5.052 6.058 4.364 6.155 3.257 8.274 8.912 5.956 9.274 5.105 5.905 Min IH 0 0 0 0 0 0 0 0 0 0 0 0 0Septage / Total Kjeldahl Nitrogen: TKN - mg/L Count Lab 4 6 6 4 2 10 2 8 12 17 20 15 106 Max Lab 179 894 402 240 1530 467 900 1820 1330 2290 2580 1350 2580 Mean Lab 85.475 338.533 120.2 148.125 802.75 215.06 849.5 550.013 524.65 559.912 790.49 573.367 493.614 Min Lab 17 75.6 27.4 59 75.5 59.7 799 49.1 34.2 43 63.6 74.5 17Septage / Total Phosphorus: TP - mg/L Count Lab 4 6 6 4 2 10 2 8 12 17 20 15 106 Max Lab 21.7 245 55.5 30.1 85.3 74.3 77 148 98.2 193 287 160 287 Mean Lab 11.515 75.617 17.015 18.575 47.44 26.236 64 73.605 45.434 56.109 81.205 59.105 54.171 Min Lab 3.23 11 3.07 6.4 9.58 7.51 51 5.84 4.65 4.2 7 8.47 3.07Septage / Total Solids: TS - mg/L Count Lab 4 6 6 4 2 10 2 8 12 17 20 15 106 Max Lab 2390 224000 6020 1600 4550 9100 2700 65400 13700 20200 41500 12400 224000 Mean Lab 1292.5 43785 2730 1032.5 2605 3206 1620 11605 5055.833 5287.059 9754 4022.667 8346.968 Min Lab 350 1020 670 630 660 450 540 380 340 310 440 850 310Septage / Total Suspended Solids: TSS - mg/L Count Lab 4 6 6 4 2 10 2 8 12 17 20 15 106 Max Lab 980 193000 5360 700 1020 7430 660 65000 8500 13200 24800 3700 193000 Mean Lab 519.5 36676.67 1436.333 377.5 576 1720.2 408 10010.63 1913.333 3026.706 5918.9 928.267 5646.964 Min Lab 108 350 200 80 132 72 156 64 56 76 96 116 56Septage / pH - --- Count Lab 5 6 6 4 2 10 2 8 12 17 20 15 107 Max Lab 7.54 7.48 7.51 7.32 8.76 7.83 8.34 8.14 9.14 8.7 9.16 9.22 9.22 Mean Lab 7.246 6.903 6.973 7.03 7.85 7.307 7.645 7.143 7.851 7.572 7.938 7.822 7.527 Min Lab 6.95 6.19 6.45 6.82 6.94 6.91 6.95 5.88 6.91 6.56 6.63 6.63 5.88

Class 3 Wastewater TreatmentMississippi River

14100.0 m3/day

MISSISSIPPI MILLS WASTEWATER TREATMENT FACILITYMunicipality: Municipality of Mississippi Mills

Ontario Clean Water AgencyTime Series Info Report

01/01/2016 to 31/12/20165678110000873

Ontario Clean Water Agency – Mississippi Mills Wastewater Treatment System – 2016 Annual Report

Appendix C

Biosolids Application Summary

Mississippi Mills - Sites Applied with Biosolids 2016Date NASM# Lot Con Township Field Application Total Area 2016 # Method Dry Tonnes Spread

(t) (ha)May 25-26 Cochran - Giles Farm 20811 5 7 Pakenham 1 Incorporated 6hrs 361.68 11.65

2E 280.53 8.822W 124.68 3.79

TOTAL 766.89 24.26

Incorporated 6hrsOct 26

Farmer/ Landowner

Ramsay11622416Sunol Farms - James

Farmer Site Farm Name Lot Con Township Area Expiry Date# (ha)

Clayton Rd. 21 7 Ramsay 37.2Gavin Giles 5 7 Pakenham 22Home Farm 23 7 Ramsay 38.16John Steele - Bennie Rd 25 7 Ramsay 15.2John Steele - Home 22 7 Ramsay 30.4Lyle Reid North 4 7 Pakenham 16Lyle Reid South 4 7 Pakenham 11.2Peter Cochran Conc 7 23 6 Ramsay 26.8Peter Cochran Home 20 6 Ramsay 27.44Sharon Reid 3 7 Pakenham 15.2

Sunol Farms 22416 James 6 11 Ramsay 47.57 Dec 31 2020TOTAL 287.17

Town of Mississippi Mills Landbank

Don, Cathy & Adam Cochrane 20811 Dec 31 2016

Farmer/Landowner Lot Conc Municipality Ward AreaFarm Name (ha)Cochran - Lyle Reid North 4 7 Mississippi Mills Pakenham 16Sunol Farms - James North 6-7 11 Mississippi Mills Ramsay 53

TOTAL 69.0170.5 ac

Town of Carleton Place - Sites in Progress 2016

Maximum Acceptable 2016Concentration (mg/kg) Average

As 170 <2.0Cd 34 <0.60Co 340 1.59Cr 2800 22.05Cu 1700 465.59Hg 11 0.36Mo 94 2.45Ni 420 11.55Pb 1100 26.14Se 34 <2.27Zn 4200 357.68

Maximum Acceptable Concentration (CFU/g)

2,000,000 <352

2.692656023.040.09317.1

Ammonia+Ammonium (ppm)Nitrate+Nitrites (ppm)TKN (%)Potassium (%)Solids (%)

Total P (%)

Twelve Month Average: January 2016 - December 2016Mississippi Mills

Metals

E. Coli

Month dry tonnes (t) % of Total HaulageJanuary 0 0.0February 0 0.0

March 0 0.0April 0 0.0May 361.68 47.2June 0 0.0July 0 0.0

August 0 0.0September 0 0.0

October 405.21 52.8November 0 0.0December 0 0.0

Total: 766.89 100

Mississippi Mills - Monthly Haulage 2016

Ontario Clean Water Agency – Mississippi Mills Wastewater Treatment System – 2016 Annual Report

Appendix D

Calibration Records


Recommended