Volume 70 - Number 11 December 2012 ECONOMY AT A GLANCE e Mississippi Index of Coincident and Leading Indicators both rose for the month of October. Employment rose for the second consecutive month in October. Manufacturers are working longer hours and employing more people. Construction employment is rising as well. e Diesel Fuel Consumption Index, which had been trending down rose in October. e State’s economy is improving from the doldrums of summer but appears to be growing at a modest pace. We expect the State to end 2012 with a Real GDP growth rate of 0.5 percent. Growth is expected to rise to 1.0 percent in 2013. Historically, this is slow growth. e National economy has moderated in the fourth quarter. is is due in part due to technical issues. Much of the growth in the third quarter was driven by federal spending and inventory accumulation which is not recurring in the fourth quarter. However, the soſtening of the economy is apparent in other indicators as well. Retail sales fell in November, the ISM Manufacturing Index fell below 50 again, and confidence among small business has plummeted. Citing slower sales and earning and making fewer plans to hire or invest in capital equipment, small businesses registered their lowest Optimism Index since March 2009. In terms of the our outlook for improvement in the economy, they had their lowest rating in the history of the survey. Fear over the fiscal cliff probably factored into their pessimism as did the prospect of higher taxes and increased regulations. Despite these set-backs the National economy is expected to improve in 2013 as the housing sector and vehicle sales gain momentum. Growth in 2013 will likely be below 2.0 percent however. Mississippi’s Business Monitoring e State’s Economy A Publication of the University Research Center, Mississippi Institutions of Higher Learning State Economist Darrin Webb • 3825 Ridgewood Road, Jackson, MS 39211 • [email protected] • www.mississippi.edu/urc/economics.html 90.0 92.0 94.0 96.0 98.0 100.0 102.0 10/11 11/11 12/11 1/12 2/12 3/12 4/12 5/12 6/12 7/12 8/12 9/12 10/12 Index of Leading Indicators MS LI US LI e Mississippi Coincident Index is constructed by the Federal Reserve Bank of Philadelphia and re-indexed to 2004. e Index is based on changes in nonfarm em- ployment, the unemployment rate, average manufacturing workweek length and wage and salary disbursements. e Mississippi Leading Index is constructed by the Mississippi University Research Center. e U.S. Indices are both from the Conference Board. All series are indexed to a base year of 2004. IN THIS ISSUE: Economy at a Glance ..................................................................................................................................................................................... 1 Index of Leading Indicators for October 2012 .......................................................................................................................................... 2 Index of Coincident Indicators for October 2012 ...................................................................................................................................... 4 National Trends .............................................................................................................................................................................................. 5 Mississippi Employment Trends ................................................................................................................................................................. 9 100.0 101.0 102.0 103.0 104.0 105.0 106.0 10/11 11/11 12/11 1/12 2/12 3/12 4/12 5/12 6/12 7/12 8/12 9/12 10/12 Index of Coincident Indicators MS LI US LI
Transcript
Volume 70 - Number 11December 2012
ECONOMY AT A GLANCETh e Mississippi Index of Coincident and Leading Indicators both rose for the month of October. Employment rose for the second consecutive month in October. Manufacturers are working longer hours and employing more people. Construction employment is rising as well. Th e Diesel Fuel Consumption Index, which had been trending down rose in October. Th e State’s economy is improving from the doldrums of summer but appears to be growing at a modest pace. We expect the State to end 2012 with a Real GDP growth rate of 0.5 percent. Growth is expected to rise to 1.0 percent in 2013. Historically, this is slow growth.
Th e National economy has moderated in the fourth quarter. Th is is due in part due to technical issues. Much of the growth in the third quarter was driven by federal spending and inventory accumulation which is not recurring in the fourth quarter. However, the soft ening of the economy is apparent in other indicators as well. Retail sales fell in November, the ISM Manufacturing Index fell below 50 again, and confi dence among small business has plummeted. Citing slower sales and earning and making fewer plans to hire or invest in capital equipment, small businesses registered their lowest Optimism Index since March 2009. In terms of the our outlook for improvement in the economy, they had their lowest rating in the history of the survey. Fear over the fi scal cliff probably factored into their pessimism as did the prospect of higher taxes and increased regulations. Despite these set-backs the National economy is expected to improve in 2013 as the housing sector and vehicle sales gain momentum. Growth in 2013 will likely be below 2.0 percent however.
Mississippi’s BusinessMonitoring Th e State’s Economy
A Publication of the University Research Center, Mississippi Institutions of Higher Learning
State Economist Darrin Webb • 3825 Ridgewood Road, Jackson, MS 39211 • [email protected] • www.mississippi.edu/urc/economics.html
90.0
92.0
94.0
96.0
98.0
100.0
102.0
10/1
1
11/1
1
12/1
1
1/12
2/12
3/12
4/12
5/12
6/12
7/12
8/12
9/12
10/1
2
Index of Leading Indicators
MS LI US LI
Th e Mississippi Coincident Index is constructed by the Federal Reserve Bank of Philadelphia and re-indexed to 2004. Th e Index is based on changes in nonfarm em-ployment, the unemployment rate, average manufacturing workweek length and wage and salary disbursements. Th e Mississippi Leading Index is constructed by the Mississippi University Research Center. Th e U.S. Indices are both from the Conference Board. All series are indexed to a base year of 2004.
IN THIS ISSUE:Economy at a Glance ..................................................................................................................................................................................... 1Index of Leading Indicators for October 2012 .......................................................................................................................................... 2Index of Coincident Indicators for October 2012 ...................................................................................................................................... 4National Trends .............................................................................................................................................................................................. 5Mississippi Employment Trends ................................................................................................................................................................. 9
100.0
101.0
102.0
103.0
104.0
105.0
106.0
10/1
1
11/1
1
12/1
1
1/12
2/12
3/12
4/12
5/12
6/12
7/12
8/12
9/12
10/1
2
Index of Coincident Indicators
MS LI US LI
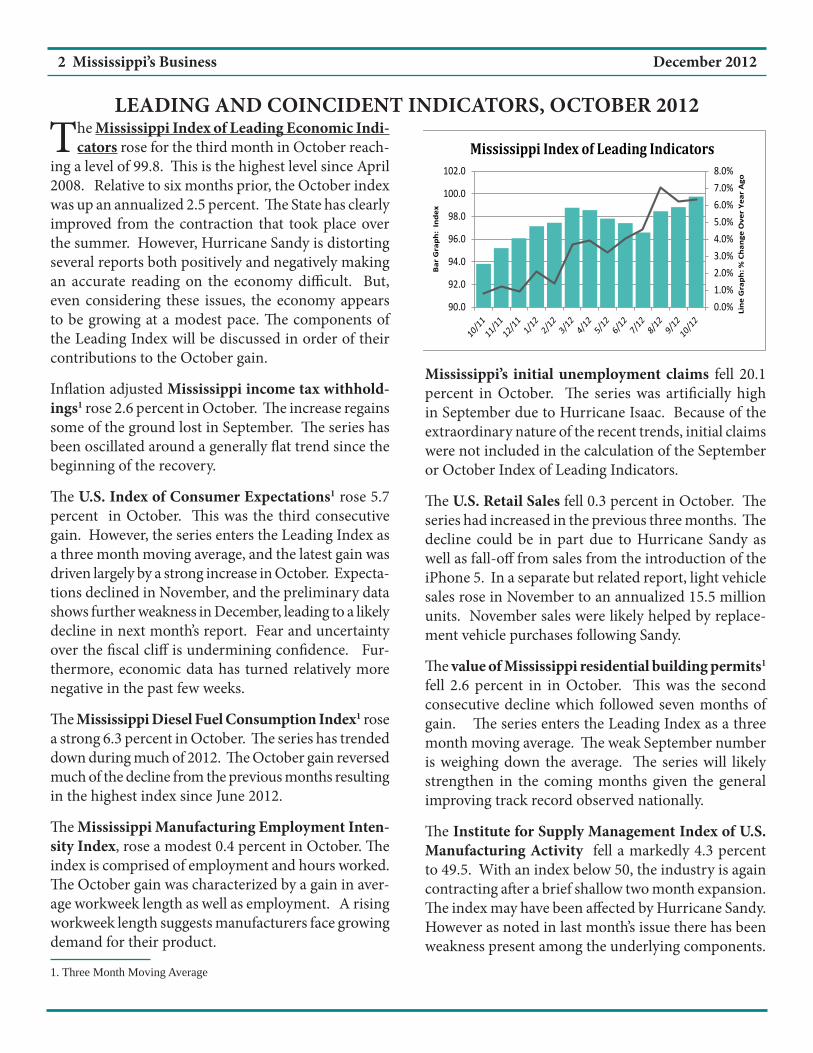
The Mississippi Index of Leading Economic Indi-cators rose for the third month in October reach-
ing a level of 99.8. Th is is the highest level since April 2008. Relative to six months prior, the October index was up an annualized 2.5 percent. Th e State has clearly improved from the contraction that took place over the summer. However, Hurricane Sandy is distorting several reports both positively and negatively making an accurate reading on the economy diffi cult. But, even considering these issues, the economy appears to be growing at a modest pace. Th e components of the Leading Index will be discussed in order of their contributions to the October gain.
Infl ation adjusted Mississippi income tax withhold-ings1 rose 2.6 percent in October. Th e increase regains some of the ground lost in September. Th e series has been oscillated around a generally fl at trend since the beginning of the recovery.
Th e U.S. Index of Consumer Expectations1 rose 5.7 percent in October. Th is was the third consecutive gain. However, the series enters the Leading Index as a three month moving average, and the latest gain was driven largely by a strong increase in October. Expecta-tions declined in November, and the preliminary data shows further weakness in December, leading to a likely decline in next month’s report. Fear and uncertainty over the fi scal cliff is undermining confi dence. Fur-thermore, economic data has turned relatively more negative in the past few weeks.
Th e Mississippi Diesel Fuel Consumption Index1 rose a strong 6.3 percent in October. Th e series has trended down during much of 2012. Th e October gain reversed much of the decline from the previous months resulting in the highest index since June 2012.
Th e Mississippi Manufacturing Employment Inten-sity Index, rose a modest 0.4 percent in October. Th e index is comprised of employment and hours worked. Th e October gain was characterized by a gain in aver-age workweek length as well as employment. A rising workweek length suggests manufacturers face growing demand for their product.
Mississippi’s initial unemployment claims fell 20.1 percent in October. Th e series was artifi cially high in September due to Hurricane Isaac. Because of the extraordinary nature of the recent trends, initial claims were not included in the calculation of the September or October Index of Leading Indicators.
Th e U.S. Retail Sales fell 0.3 percent in October. Th e series had increased in the previous three months. Th e decline could be in part due to Hurricane Sandy as well as fall-off from sales from the introduction of the iPhone 5. In a separate but related report, light vehicle sales rose in November to an annualized 15.5 million units. November sales were likely helped by replace-ment vehicle purchases following Sandy.
Th e value of Mississippi residential building permits1 fell 2.6 percent in in October. Th is was the second consecutive decline which followed seven months of gain. Th e series enters the Leading Index as a three month moving average. Th e weak September number is weighing down the average. Th e series will likely strengthen in the coming months given the general improving track record observed nationally.
Th e Institute for Supply Management Index of U.S. Manufacturing Activity fell a markedly 4.3 percent to 49.5. With an index below 50, the industry is again contracting aft er a brief shallow two month expansion. Th e index may have been aff ected by Hurricane Sandy. However as noted in last month’s issue there has been weakness present among the underlying components.
MS Income Tax WithholdingsThree Month Moving Average
-30%-20%-10%0%10%20%30%40%50%
30
35
40
45
50
55
60
Line
Gra
ph: %
Cha
nge
Ove
r Yea
r Ago
Bar G
raph
: M
illio
ns o
f 200
4 $
MS Value Of Residential Building PermitsThree Month Moving Average
-10
-8
-6
-4
-2
0
2
4647484950515253545556
Line
Gra
ph: C
hang
e O
ver Y
ear A
go
Bar G
raph
: In
dex
ISM Index of U.S. Manufacturing Activity
-2%-1%0%1%2%3%4%5%6%
72.073.074.075.076.077.078.079.080.081.0
Line
Gra
ph: C
hang
e O
ver Y
ear A
go
Bar G
raph
: In
dex
MS MFG Employment Intensity Index
-20%-10%0%10%20%30%40%50%60%
0.0
20.0
40.0
60.0
80.0
100.0
Line
Gra
ph: C
hang
e O
ver Y
ear A
go
Bar G
raph
: In
dex
199
6=10
0
U.S. Consumer Expectations IndexThree Month Moving Average
-10%
-5%
0%
5%
10%
80.0
85.0
90.0
95.0
100.0
105.0
110.0
115.0
Line
Gra
ph:%
Cha
nge
Ove
r Yea
r Ago
Bar G
raph
: In
dex
MS Diesel Fuel Consumption IndexThree Month Moving Average
0%1%2%3%4%5%6%7%8%9%
385,000
390,000
395,000
400,000
405,000
410,000
415,000
Line
Gra
ph: %
Cha
nge
Ove
r Yea
r Ago
Bar G
raph
: M
illio
ns o
f $
U.S. Retail Sales
LEADING ECONOMIC INDICATORS
Source: Mississippi Department of Employment Security
Source: Bureau of the Census
Source: URC using data from Bureau of Labor Statistics
Source: URC using Data from Mississippi Department of Revenue Source: Bureau of the Census
Source: University Of Michigan
Source: Institute For Supply Management
Source: Mississippi Department of Revenue
4 Mississippi’s Business December 2012
The Mississippi Index of Coincident Indicators continued to improve in October, reaching a level
of 102.7, the highest level since February 2009. Th is marked the third monthly increase. Th e strong 0.4 per-cent October gain is remarkable given the sluggishness of the past year. It will be interesting if this strength continues in the coming months. It does appear that the employment situation is improving aft er deteriorating greatly during the summer months. Th e unemployment rate has fallen and average manufacturing work week length is improving as well. Th ese are three of the four components of the Coincident Index. Th e lower fi gure to the right puts the index into perspective of the great recession and the recovery period. Th e level of activity remains greatly below the pre-recession peak. Th e recov-ery, including the recent gains, has been relatively fl at.
Th e fi gure below shows a comparison of the October Index to the pre-recession peak for the 12 Southeastern States and the Nation. States that reach 100 percent of peak have fully recovered from the “Great Recession”. Mississippi was at 95.9 percent of the peak. Mississippi is further along the road to recovery than Alabama, Florida, North Carolina and South Carolina, as mea-sured by the Coincident Index. Th ese other states were hit harder in the Great Recession than Mississippi.
Th e Map on page 5 shows the October index for each state compared to the level three months prior. Mis-
0.0%
0.2%
0.4%
0.6%
0.8%
1.0%
101.0
101.5
102.0
102.5
103.0
Line
Gra
ph: %
Cha
nge
Ove
r Ye
ar A
go
Bar
Gra
ph:
Inde
x
Mississippi Index of Coincident Indicators
91.6%
95.9%
89.0%
96.5% 97.4%99.8%
95.9% 94.9%
100.4%
94.9%
99.2%
104.5%
101.8%
85%
90%
95%
100%
105%
110%Coincident Index: October 2012 Percentage of Pre recession Peak
sissippi’s index rose 0.65 percent. Th is was ahead of Arkansas and Louisiana but behind other southeastern states. Th e National index rose a similar 0.6 percent. Th e map shows more improvement among the states than was evident during the summer months.
96.0
98.0
100.0
102.0
104.0
106.0
108.0
Jan-
07
Jul-0
7
Jan-
08
Jul-0
8
Jan-
09
Jul-0
9
Jan-
10
Jul-1
0
Jan-
11
Jul-1
1
Jan-
12
Jul-1
2
MS Coincident Index, Jan. 2007 to Present
5 Mississippi’s Business December 2012
DC
-2.18%WV
-1.44%MI
-0.63%NM
-0.56%AK
-0.45%LA
-0.35%DE
-0.30%MA
-0.25%VT
-0.23%CT
-0.23%PA
-0.12%NH
0.02%IA
0.02%NC
0.06%MS
0.11%VA
0.16%AL
0.17%SD
0.18%WI
0.20%OK
0.21%ME
0.33%FL
0.37%NV
0.39%WA
0.40%KY
0.41%TN
0.44%AR
0.46%MD
0.46%OR
0.47%NJ
0.56%MN
0.57%MO
0.65%WY
0.65%NE
0.67%IL
0.74%NY
0.74%CO
0.79%GA
0.79%KS
0.82%IN
0.86%AZ
0.87%OH
0.91%UT
0.94%RI
1.03%TX
1.09%CA
1.14%SC
1.18%MT
1.22%ND
1.42%ID
1.46%HI
US 0.6%
Less than -0.5%Between -0.5% to 0.0%No changeBetween 0.1% to 0.5%Greater than 0.5%
Th ree Month Growth in Th e Index of Coincident Economic Indicators, October 2012
National Trends Th e U.S. Index of Leading Indicators increased 0.2 percent in October while the Coincident Index rose 0.1 percent. Th e Conference Board expects continued slow growth in the coming months.
Growth has soft ened in the fourth quarter relative to the third. IHS Global Insight expects a meager 0.5 percent gain. Th e third quarter was revised up to 2.7 percent. Much of this growth however was due to federal spending and inventory accumulation. Th is will not be duplicated in the fourth quarter. Housing continues to show improvement and auto sales were especially strong in November. However real income less transfer payments has declined for three consecu-tive months and retail sales declined in November.
Growth is expected to be slightly slower in 2013 than in 2012 as the uncertainty over the fi scal cliff dampens growth early in the year. While economists still expect an agreement on the fi scal cliff , it will not come soon enough or be comprehensive enough to avoid casting a shadow over early 2013 growth. IHS Global Insight
expects growth for 2013 to be 1.9 percent compared to an expected 2.2 percent for 2012. Growth is expected to accelerate as we move through the year and into 2014 as housing and vehicle sales gain momentum.
Th e Optimism Index by the National Federation of Independent Businesses plunged in November. Th e index of 87.5 is the lowest since March 2009. Th is index refl ects attitudes of small businesses, many of whom fi le their business income as personal income. Many of these will likely fall into the highest tax brackets and therefore expect their tax burden to rise. Respondents also reported slowing earnings, sales and plans for hir-ing. Th e share of respondents expecting the economy to improve in the coming months reached the lowest level since the survey began. Th is survey reveals the growing concern that many have over the economy. Th e Consumer Sentiment Index has likewise declined recently.
Risk of recession remains at 20 percent. Th is assumes the fi scal cliff is avoided. If the across-the-board tax rates increase then a recession is probable.
6 Mississippi’s Business December 2012
-30%-25%-20%-15%-10%-5%0%5%10%
80
90
100
110
120
130
140
150
Line
Gra
ph: C
hang
e O
ver Y
ear A
go
Bar G
raph
: Th
ousa
nds
MS Continued Unemployment Claims
-20%
-15%
-10%
-5%
0%
5%
0.0
2.0
4.0
6.0
8.0
10.0
12.0
Line
Gra
ph: C
hang
e O
ver Y
ear A
go
Bar G
raph
: Ra
te
MS Unemployment Rate
0%
2%
4%
6%
8%
10%
12%
480.0
500.0
520.0
540.0
560.0
580.0
600.0
620.0
Line
Gra
ph: C
hang
e O
ver Y
ear A
go
Bar G
raph
: 20
04 D
olla
rs
Real Average MFG Weekly Earnings in MS
-20%
-10%
0%
10%
20%
30%
40%
0.0
50.0
100.0
150.0
200.0
250.0
Line
Gra
ph: C
hang
e O
ver Y
ear A
go
Bar G
raph
: M
illio
ns o
f Do
llars
MS Gaming Revenue
Coast River Growth of Total
3.5% 3.4%
3.0% 2.9% 2.9%2.7%
2.3%
1.7% 1.7%1.4%
1.7%2.0%
2.2%
0.0%0.5%1.0%1.5%2.0%2.5%3.0%3.5%4.0%
Inflation: Price Growth over Prior Year
-10%-8%-6%-4%-2%0%2%4%6%
49.050.051.052.053.054.055.056.057.058.0
Line
Gra
ph: C
hang
e O
ver Y
ear A
go
Bar G
raph
: Ra
te
ISM Index of Nonmanufacturing Activity
-2%-1%0%1%2%3%4%5%6%
88.0
89.0
90.0
91.0
92.0
93.0
94.0
95.0
Line
Gra
ph: C
hang
e O
ver Y
ear A
go
Bar G
raph
: In
dex
U.S. Business Optimism Index
13.313.5 13.6
13.9
14.414.1 14.1
13.9
14.314.0
14.514.9
14.2
15.5
0%
5%
10%
15%
20%
25%
12.012.513.013.514.014.515.015.516.0
Line
Gra
ph: C
hang
e O
ver Y
ear A
go
Bar G
raph
: M
illio
ns o
f Uni
ts
U.S. Light Vehicle Sales
MISCELLANEOUS ECONOMIC INDICATORS
Source: Mississippi Department of Employment Security; Seasonally Adjusted
Source: U.S. Bureau of Labor Statistics; Nonseasonally Adjusted
Source: U.S. Bureau of Labor Statistics
Source: National Federation of Independent Businesses Source: Bureau of Economic Analysis; Seasonally Adjusted Annual Rate
Source: Institute For Supply Management
Source: MS Department of Revenue; Nonseasonally Adjusted
Source: U.S. Bureau of Labor Statistics; Seasonally Adjusted
7 Mississippi’s Business December 2012
SELECTED ECONOMIC INDICATORS
October September OctoberIndicator 2012 2012 2011 Last Month Last Year
US Index of Coincident Indicators 104.8 104.7 103 0.1% 1.7%
MS Index of Coincident Indicators 102.7 102.3 101.8 0.4% 0.9%
US Index of Leading Indicators 96.0 95.9 93.8 0.1% 2.3%
MS Index of Leading Indicators 99.8 98.8 93.8 1.0% 6.4%
MS Initial Unemployment Claims 14,121 17,678 12,388 20.1% 14.0%
MS Value Of Res. Building Permits 51.3 52.7 45.0 2.6% 13.9%
MS Income TaxWithholdings 104.40 101.79 102.53 2.6% 1.8%
MSMFG Emp. Intensity Index 80.4 80.1 77.1 0.4% 4.3%
MS Diesel Fuel Consumption Index 97.2 91.5 94.2 6.3% 3.2%
US Index of Consumer Expectations 76.7 72.5 52.2 5.7% 46.9%
US ISM Index of MFG Activity 49.5 51.7 50.8 4.3% 2.6%
US Retail Sales 411,591 412,869 396,407 0.3% 3.8%
US Consumer Price Index 122.5 122.5 119.9 0.0% 2.2%
MS Unemployment Rate 8.9% 9.2% 10.7% 0.3% 1.8%
MS Continued Unemp. Claims 110,166 128,559 139,123 14.3% 20.8%
US Mortgage Rates 3.5% 3.6% 4.2% 0.1% 0.7%
MS Avg. Hourly Wage for MFG 54.20 55.10 52.90 1.6% 2.5%
MS Avg. Wkly Earnings for MFG 591.1 599.5 534.2 1.4% 10.6%
Government 22.6% 244,900 245,200 247,700 (300) 0.1% (2,800) 1.1%
Change fromPrior Month
Change fromPrior Year
Sector
Mississippi Employment TrendsMississippi employment rose for the second consecutive month in October. Gains were seen in construction, manufacturing and professional and business services.
Despite the gains, the average em-ployment for 2012 was 0.2 percent below the same period in 2011. For 2012, Mississippi has the same number of people employed as in 1996.
Th e fi gure to the right shows that the current jobs contraction is con-siderably worse than that observed in the 1980s or the 2000s. The graph shows employment indexed to the peak level of the cycle. Th e X-axis shows the months relative to the peak, with peak employment occurring in month 0. An index of 100 is full recovery.
In the 1980s, employment followed a V-shaped recovery and full recovery occurred within 68 months of the peak. In 2000 full recovery took 92 months. We are in the 56th month of the current cycle, and employment is at 94 percent of peak. In both of the prior cycles employment was closer to 98 percent of peak. Th e State appears to be years from full recovery.
88.0
90.0
92.0
94.0
96.0
98.0
100.0
102.0
-6 0 6 12 18 24 30 36 42 48 54 60 66 72 78 84 90
EMpl
oym
ent I
ndex
ed to
Pea
k Em
ploy
mne
t
Months Relative To Peak
MS Employment During Contractions
Jan 1980 - Sep 1985 May 2000-Dec 2007 Feb 2008 - Present