48
Missouri Demonstration Project: The Use of High-Friction Surface Treatments on Missouri Highways Final Report March 2015

Missouri Demonstration Project:
The Use of High-Friction Surface
Treatments on Missouri Highways
Final Report
March 2015

FOREWORD
The purpose of the Highways for LIFE (HfL) pilot program is to accelerate the use of
innovations that improve highway safety and quality while reducing congestion caused by
construction. LIFE is an acronym for Longer-lasting highway infrastructure using Innovations
to accomplish the Fast construction of Efficient and safe highways and bridges.
Specifically, HfL focuses on speeding up the widespread adoption of proven innovations in the
highway community. “Innovations” is an inclusive term used by HfL to encompass technologies,
materials, tools, equipment, procedures, specifications, methodologies, processes, and practices
used to finance, design, or construct highways. HfL is based on the recognition that innovations
are available that, if widely and rapidly implemented, would result in significant benefits to road
users and highway agencies.
Although innovations themselves are important, HfL is as much about changing the highway
community’s culture from one that considers innovation something that only adds to the
workload, delays projects, raises costs, or increases risk to one that sees it as an opportunity to
provide better highway transportation service. HfL is also an effort to change the way highway
community decision makers and participants perceive their jobs and the service they provide.
The HfL pilot program, described in Safe, Accountable, Flexible, Efficient Transportation Equity
Act: A Legacy for Users (SAFETEA-LU) Section 1502, includes funding for demonstration
construction projects. By providing incentives for projects, HfL promotes improvements in
safety, construction-related congestion, and quality that can be achieved through the use of
performance goals and innovations. This report documents one such HfL demonstration project.
Additional information on the HfL program is at www.fhwa.dot.gov/hfl.
NOTICE
This document is disseminated under the sponsorship of the U.S. Department of Transportation
in the interest of information exchange. The U.S. Government assumes no liability for its
contents or use thereof. This report does not constitute a standard, specification, or regulation.
The U.S. Government does not endorse products or manufacturers. Trade and manufacturers’
names appear in this report only because they are considered essential to the object of the
document.

1. Report No. 2. Government Accession No
3. Recipient’s Catalog No
3. Title and Subtitle
Missouri Demonstration Project: The Use of High-Friction Surface Treatments
on Missouri Highways
5. Report Date
March 2015
6. Performing Organization Code
7. Authors
Jay Bledsoe
8. Performing Organization Report No.
9. Performing Organization Name and Address
Applied Research Associates, Inc.
100 Trade Centre Drive, Suite 200
Champaign, IL 61820
10. Work Unit No. (TRAIS) C6B
11. Contract or Grant No.
12. Sponsoring Agency Name and Address
Office of Infrastructure
Federal Highway Administration
1200 New Jersey Avenue, SE
Washington, DC 20590
13. Type of Report and Period Covered
Final Report
14. Sponsoring Agency Code
15. Supplementary Notes
Contracting Officer’s Representative: Julie Zirlin
Contracting Officer’s Task Manager: Ewa Flom
16. Abstract
As part of a national initiative sponsored by the Federal Highway Administration under the Highways for LIFE program,
the Missouri Department of Transportation was awarded a $120,000 grant to demonstrate the use of high-friction surfaces
as a durable and cost-effective method to increase safety on Missouri highways. This report documents the placement of
high-friction surfaces at four locations around the State. A study of the crash history in these areas indicated a need to
improve friction to reduce the number of incidents that could be related to friction. This report details the innovation used
to rehabilitate two segments of I-44 in Phelps County, one segment of US 54 in Cole County, and several locations on MO
179 near the intersection with US 54, also in Cole County.
Although not directly comparable in terms of benefits, the cost of the four HFST projects was substantially greater than
would have been the case with traditional ultra-thin bonded asphalt wearing surface. Costs for the installed HFST ranged
from $17 to $21.5 per square yard compared to a cost of $4.12 per square yard for a traditional ultra-thin bonded asphalt
wearing surface, resulting in additional cost of more than $520,000 for all four locations. However, the additional costs
were significantly less compared to costs associated with realigning the section of the roadway to address run-off-road ROR
crashes.
The friction numbers obtained with this innovation far exceeded those that would be expected with the ultra-thin bonded
asphalt wearing surface, which translates to fewer post-construction accident rates. Using crash data from the first year
following one of the four projects, the reduction of 27 crashes during the period at just this one location results in a savings
of about $966,300, or nearly twice the additional cost of HFST placement all four locations combined. Using present worth
cost of crashes and MODOT’s target of 20 percent reduction in accidents results in a minimum savings of $4,136,000, over
the 9-year life of the treatment.
The use of high-friction surfaces resulted in extremely high friction numbers, far above those generally recorded for
traditional surface treatments. The experience gained on these successful projects will help Missouri use high-friction
surfaces more routinely on future projects.
17. Key Words
High-Friction Surface, safety
18. Distribution Statement
No restriction. This document is available to the public
through the Highways for LIFE website:
http://www.fhwa.dot.gov/hfl/
Security Classif.(of this report)
Unclassified
19. Security Classif. (of this page)
Unclassified
20. No. of Pages
45
21. Price

SI* (MODERN METRIC) CONVERSION FACTORS
APPROXIMATE CONVERSIONS TO SI UNITS Symbol When You Know Multiply By To Find Symbol
LENGTH (none) mil 25.4 micrometers μm
in inches 25.4 millimeters mm
ft feet 0.305 meters m
yd yards 0.914 meters m
mi miles 1.61 kilometers km
AREA in2 square inches 645.2 square millimeters mm2
ft2 square feet 0.093 square meters m2
yd2 square yards 0.836 square meters m2
ac acres 0.405 hectares ha
mi2 square miles 2.59 square kilometers km2
VOLUME
fl oz fluid ounces 29.57 millimeters mL
gal gallons 3.785 liters L
ft3 cubic feet 0.028 cubic meters m3
yd3 cubic yards 0.765 cubic meters m3
NOTE: volumes greater than 1000 L shall be shown in m3
MASS oz ounces 28.35 grams g
lb pounds 0.454 kilograms kg
T short tons (2000 lb) 0.907 megagrams (or "metric ton") Mg (or "t")
TEMPERATURE (exact degrees)
°F Fahrenheit 5 (F-32)/9
or (F-32)/1.8
Celsius °C
ILLUMINATION
fc foot-candles 10.76 lux lx
fl foot-Lamberts 3.426 candela per square meter cd/m2
FORCE and PRESSURE or STRESS lbf poundforce 4.45 Newtons N
lbf/in2 (psi) poundforce per square inch 6.89 kiloPascals kPa
k/in2 (ksi) kips per square inch 6.89 megaPascals MPa
DENSITY lb/ft3 (pcf) pounds per cubic foot 16.02 kilograms per cubic meter kg/m3
APPROXIMATE CONVERSIONS FROM SI UNITS Symbol When You Know Multiply By To Find Symbol
LENGTH μm micrometers 0.039 mil (none)
mm millimeters 0.039 inches in
m meters 3.28 feet ft
m meters 1.09 yards yd
km kilometers 0.621 miles mi
AREA mm2 square millimeters 0.0016 square inches in2
m2 square meters 10.764 square feet ft2
m2 square meters 1.195 square yards yd2
ha hectares 2.47 acres ac
km2 square kilometers 0.386 square miles mi2
VOLUME mL milliliters 0.034 fluid ounces fl oz
L liters 0.264 gallons gal
m3 cubic meters 35.314 cubic feet ft3
m3 cubic meters 1.307 cubic yards yd3
MASS g grams 0.035 ounces oz
kg kilograms 2.202 pounds lb
Mg (or "t") megagrams (or "metric ton") 1.103 short tons (2000 lb) T
TEMPERATURE °C Celsius 1.8C+32 Fahrenheit °F
ILLUMINATION lx lux 0.0929 foot-candles fc
cd/m2 candela per square meter 0.2919 foot-Lamberts fl
FORCE and PRESSURE or STRESS N Newtons 0.225 poundforce lbf
kPA kiloPascals 0.145 poundforce per square inch lbf/in2 (psi)
MPa megaPascals 0.145 kips per square inch k/in2 (ksi)

TABLE OF CONTENTS
INTRODUCTION......................................................................................................................... 1 HIGHWAYS FOR LIFE DEMONSTRATION PROJECTS ................................................................ 1
REPORT SCOPE AND ORGANIZATION ........................................................................................ 3 PROJECT OVERVIEW AND LESSONS LEARNED ............................................................. 4
PROJECT OVERVIEW .................................................................................................................. 4 HFL PERFORMANCE GOALS ...................................................................................................... 4 ECONOMIC ANALYSIS ................................................................................................................ 5
LESSONS LEARNED ..................................................................................................................... 6 CONCLUSIONS ............................................................................................................................. 6
PROJECT DETAILS - GENERAL ............................................................................................ 7
BACKGROUND ............................................................................................................................. 7 HIGH-FRICTION SURFACE TREATMENTS .................................................................................. 7
PROJECT DETAILS – US 54, COLE COUNTY.................................................................... 10
BACKGROUND ........................................................................................................................... 10 PROJECT DESCRIPTION ............................................................................................................ 10 DATA ACQUISITION AND ANALYSIS ......................................................................................... 15
ECONOMIC ANALYSIS .............................................................................................................. 18 PROJECT DETAILS – I-44, PHELPS COUNTY................................................................... 20
BACKGROUND ........................................................................................................................... 20 PROJECT DESCRIPTION ............................................................................................................ 22
PROJECT CONSTRUCTION ........................................................................................................ 23 DATA ACQUISITION AND ANALYSIS ......................................................................................... 25
ECONOMIC ANALYSIS .............................................................................................................. 27 PROJECT DETAILS – MO 179, COLE COUNTY ................................................................ 29
BACKGROUND ........................................................................................................................... 29
PROJECT DESCRIPTION ............................................................................................................ 30 PROJECT CONSTRUCTION ........................................................................................................ 30
DATA ACQUISITION AND ANALYSIS ......................................................................................... 33 USER SATISFACTION ................................................................................................................ 35
ECONOMIC ANALYSIS .............................................................................................................. 35 ECONOMIC ANALYSIS .......................................................................................................... 37
SAVINGS BASED ON CRASH DATA TO DATE ............................................................................. 37 SAVINGS BASED ON MODOT’S GOAL OF 20 PERCENT REDUCTION ....................................... 38
REFERENCES ............................................................................................................................ 39

LIST OF FIGURES
Figure 1. Map. General project locations........................................................................................ 7
Figure 2. Photo. US 54, Jefferson City, Missouri near Madison Street Exit (courtesy: Google
Earth)............................................................................................................................................. 10
Figure 3. Diagram. Cross section of HFST used on US 54, Cole County. ................................... 11
Figure 4. Photo. Surface prior to application. ............................................................................... 12
Figure 5. Photo. Workers cover existing lane markings before application of HFST. ................. 12
Figure 6. Photo. Application of epoxy to road surface. ................................................................ 13
Figure 7. Photo. Epoxy spread using notched squeegee. .............................................................. 13
Figure 8. Photo. Dump truck supplying surface to distribution trailer. ........................................ 14
Figure 9. Photo. Surface material blown onto recently placed epoxy binder. .............................. 14
Figure 10. Photo. Final HFST texture. .......................................................................................... 15
Figure 11. Map. I-44, Phelps County Missouri, general project locations (courtesy: Google
Maps). ........................................................................................................................................... 20
Figure 12. Photo. I-44 project location near MO J (courtesy: Google Earth). ............................. 21
Figure 13. Photo. I-44 project location at MO V (courtesy: Google Earth). ................................ 21
Figure 14. Diagram. Typical section for I-44 HFST placement at MO J. .................................... 22
Figure 15. Diagram. Typical section for I-44 HFST placement at MO V. ................................... 22
Figure 16. Photo. Surface prior to application (near MO J). ........................................................ 23
Figure 17. Photo. Workers fill distressed area with epoxy material prior to HFST application. . 24
Figure 18. Photo. Machine used to place HFST. .......................................................................... 24
Figure 19. Photo. Bauxite chips dropped onto surface following application of epoxy resin. ..... 25
Figure 20. Photo. MO 179, Cole County, general project location (courtesy: Google Earth). .... 29
Figure 21. Photo. Specific locations of HFST application. .......................................................... 30
Figure 22. Photo. Epoxy material spread using notched squeegee. .............................................. 31
Figure 23. Photo. Bauxite material blown onto surface of previously installed epoxy binder. .... 32
Figure 24. Photo. Workers apply epoxy material near previously installed pavement markings. 32
LIST OF TABLES
Table 1. Epoxy binder specifications. ............................................................................................. 9
Table 2. Calcined bauxite aggregate specifications. ....................................................................... 9
Table 3. Pre-construction crash rates on US 54. ........................................................................... 16
Table 4. Pre-construction crash rates on I-44 eastbound. ............................................................. 26
Table 5. Pre-construction crash rates on MO 179......................................................................... 33
Table 6. Average comprehensive cost of injury by severity (National Safety Council 2012). ... 37
Table 7. Pre-construction crash history at all project locations combined. .................................. 38

ABBREVIATIONS AND SYMBOLS
AADT annual average daily traffic
AASHTO American Association of State Highway and Transportation Officials
dB(A) A-weighted decibel
DOT Department of Transportation
FHWA Federal Highway Administration
HfL Highways for LIFE
HFST high friction surface treatment
IRI International Roughness Index
MODOT Missouri Department of Transportation
OBSI onboard sound intensity
OSHA Occupational Safety and Health Administration
PDO property damage only
ROR run-off-road
SAFETEA-LU Safe, Accountable, Flexible, Efficient Transportation Equity Act: A
Legacy for Users
UBAWS ultra-thin bonded asphalt wearing surface

1
INTRODUCTION
HIGHWAYS FOR LIFE DEMONSTRATION PROJECTS
The Highways for LIFE (HfL) pilot program, the Federal Highway Administration (FHWA)
initiative to accelerate innovation in the highway community, provides incentive funding for
demonstration construction projects. Through these projects, the HfL program promotes and
documents improvements in safety, construction-related congestion, and quality that can be
achieved by setting performance goals and adopting innovations.
The HfL program—described in the Safe, Accountable, Flexible, Efficient Transportation Equity
Act: A Legacy for Users (SAFETEA-LU)—has provided incentives to a maximum of 15
demonstration projects a year. The funding amount may total up to 20 percent of the project cost,
but not more than $5 million. Also, the Federal share for an HfL project may be up to 100
percent, thus waiving the typical State-match portion. At the State’s request, a combination of
funding and waived match may be applied to a project.
To be considered for HfL funding, a project must involve constructing, reconstructing, or
rehabilitating a route or connection on an eligible Federal-aid highway. It must use innovative
technologies, manufacturing processes, financing, or contracting methods that improve safety,
reduce construction congestion, and enhance quality and user satisfaction. To provide a target for
each of these areas, HfL has established demonstration project performance goals.
The performance goals emphasize the needs of highway users and reinforce the importance of
addressing safety, congestion, user satisfaction, and quality in every project. The goals define the
desired result while encouraging innovative solutions, raising the bar in highway transportation
service and safety. User-based performance goals also serve as a new business model for how
highway agencies can manage the highway project delivery process.
HfL project promotion involves showing the highway community and the public how
demonstration projects are designed and built and how they perform. Broadly promoting
successes encourages more widespread application of performance goals and innovations in the
future.
Project Solicitation, Evaluation, and Selection
FHWA issued open solicitations for HfL project applications in fiscal years since 2006. State
highway agencies submitted applications through FHWA Divisions. The HfL team reviewed
each application for completeness and clarity, and contacted applicants to discuss technical
issues and obtain commitments on project issues. Documentation of these questions and
comments was sent to applicants, who responded in writing.
The project selection panel consisted of representatives of the FHWA’s Offices of Infrastructure,
Safety, and Operations; the Resource Center Construction and Project Management Team; the
Division offices; and the HfL team. After evaluating and rating the applications and

2
supplemental information, panel members convened to reach a consensus on the projects to
recommend for approval. The panel gave priority to projects that accomplish the following:
Address the HfL performance goals for safety, construction congestion, quality, and user
satisfaction.
Use innovative technologies, manufacturing processes, financing, contracting practices,
and performance measures that demonstrate substantial improvements in safety,
congestion, quality, and cost-effectiveness. An innovation must be one that the applicant
State has never or rarely used, even if it is standard practice in other States.
Include innovations that will change administration of the State’s highway program to
more quickly build long-lasting, high-quality, cost-effective projects that improve safety
and reduce congestion.
Will be ready for construction within 1 year of approval of the project application. For
the HfL program, FHWA considers a project ready for construction when the FHWA
Division authorizes it.
Demonstrate the willingness of the applicant department of transportation (DOT) to
participate in technology transfer and information dissemination activities associated with
the project.
HfL Project Performance Goals
The HfL performance goals focus on the expressed needs and wants of highway users. They are
set at a level that represents the best of what the highway community can do, not just the average
of what has been done. States are encouraged to use all applicable goals on a project:
Safety o Work zone safety during construction—Work zone crash rate equal to or less than
the preconstruction rate at the project location.
o Worker safety during construction—Incident rate for worker injuries of less than
4.0, based on incidents reported via Occupational Safety and Health
Administration (OSHA) Form 300.
o Facility safety after construction—At least 20 percent reduction in fatalities and
injuries in 3-year average crash rates, using preconstruction rates as the baseline.
Construction Congestion o Faster construction—At least 50 percent reduction in the time highway users are
impacted, compared to traditional methods.
o Trip time during construction—Less than 10 percent increase in trip time
compared to the average preconstruction speed, using 100 percent sampling.
o Queue length during construction—A moving queue length of less than 0.5 miles
in a rural area or less than 1.5 miles in an urban area (in both cases at a travel
speed 20 percent less than the posted speed).
Quality o Smoothness—International Roughness Index (IRI) measurement of less than 48
inches per mile.
o Noise—Tire-pavement noise measurement of less than 96.0 A-weighted decibels
(dB(A)), using the onboard sound intensity (OBSI) test method.

3
User Satisfaction
o User satisfaction—An assessment of how satisfied users are with the new facility
compared to its previous condition and with the approach used to minimize
disruption during construction. The goal is a measurement of 4-plus on a 7-point
Likert scale.
REPORT SCOPE AND ORGANIZATION
This report documents the Missouri DOT’s HfL demonstration project, which involved the
application of high-friction surface treatments at four locations around the State. The report
presents project details relevant to the HfL program, including safety and construction
congestion. HfL performance metrics and economic analysis lessons learned are also discussed.

4
PROJECT OVERVIEW AND LESSONS LEARNED
PROJECT OVERVIEW
Safety is the Missouri DOT’s number one priority. From 2005 to 2013, the Missouri DOT
reduced the number of fatalities on the 33,700 centerline miles of roads they maintain from 1,257
to 757. This reflects a nearly 40 percent reduction in fatalities over an 8-year period and
demonstrates a commitment to improving the safety of Missouri highways.
Since 2005, the DOT has implemented several innovative technologies intended to improve
safety. Many, such as median guard cable and rumble strips, have become standard
improvements applied across the State. Other programs that have contributed to improved safety
include the replacement of 802 bridges that were either structurally deficient or functionally
obsolete through the Safe and Sound Bridge Program, as well as the increased use of diverging
diamond interchanges, J-turns, and roundabouts.
The HfL project undertaken by the Missouri DOT involved a single innovative technology: the
application and use of high-friction surface treatments (HFST). The experience gained through
this project is expected to better enable the Missouri DOT to provide a long-term solution to the
challenges related to maintaining the safety of their highway facilities. All of the projects let for
the application of HFST were contracted using traditional contracting methods. HFST was bid
per square yard, installed, as would have been the case for the traditional ultra-thin bonded
asphalt wearing surface (UBAWS). HFST will expand the alternatives available in Missouri
with respect to providing a safer transportation system to the traveling public.
HFL PERFORMANCE GOALS
The successful implementation of an HfL project was assessed with respect to how safety,
construction congestion, and quality were addressed during the construction of the project. On
most HfL projects, data are collected before, during, and after construction, as appropriate, to
demonstrate that the featured innovations can be deployed while simultaneously meeting the HfL
performance goals in these areas:
Safety o Work zone safety during construction—No motorist incidents were reported during
construction. The Missouri DOT exceeded the HfL requirements for work zone
safety.
o Worker safety during construction—No worker injuries occurred during construction,
which exceeded the goal of less than a 4.0 rating on the OSHA 300 form.
o Facility safety after construction—The installation of the HFST is expected to
dramatically improve the safety of the facility after construction. Preliminary
indications support this conclusion.
Construction Congestion
o Faster construction—Three of the four locations included in this HfL project
consisted of only the application of the HFST. In these cases, the construction

5
time was approximately the same as would have been required for the
construction of the most likely alternative, the application of a microsurfacing or
UBAWS. The fourth project involved the application of HFST to several small
areas of a larger overlay project. Compared to these alternatives, the goal of
reducing the construction time by 50 percent was not achieved. However,
compared to realignments, which is more comparable with meeting the post-
construction safety goals of the project, the HFST was constructed in a
significantly shorter time and achieving the goal of reducing the construction time
by 50 percent.
o Trip time during construction—The length of the work zones used on these
projects was very short, and in general the work was performed at night when
traffic volume was low. The only restriction to the public was the delay
introduced by lowered speed limits within the work zone itself. Due to the short
nature of the work zone, it can be assumed that the goal less than 10 percent
increase in trip time compared to the average preconstruction speed was met.
o Queue length during construction—Given the capacity of roadways included in
these projects and the lower traffic levels experienced during nighttime
construction, no queue length greater than 0.5 miles was observed.
Quality
o Due to the extremely short nature of the projects, no goal was established for
noise or smoothness.
o Durability of the surface was a definite consideration. The aggregate used on
these projects was considered the best available and should outperform the
traditional UBAWS in terms of retaining its frictional properties.
User Satisfaction
o User satisfaction—No user satisfaction survey was conducted on these projects
due to the relative short length and short duration of the construction.
ECONOMIC ANALYSIS
The costs of delivering this HfL project were compared to the most likely traditional alternative
technique, in this case a UBAWS. The cost of the four HFST projects was substantially greater
than would have been the case with traditional solutions. Costs for the installed HFST ranged
from $17 to $21.5 per square yard compared to a cost of $4.12 per square yard for a traditional
UBAWS (based on statewide average bid costs). If we assume that the quantities of materials
would remain the same for either treatment, the additional cost was more than $520,000 for all
four locations.
The additional costs of HFST were significantly less compared to costs associated with
realigning the section of the roadway to address run-off-road (ROR) crashes. While UBAWS is
the closest treatment for comparison analysis, the friction numbers obtained with HFST far
exceed those that would be expected with the traditional UBAWS, and there is an expectation of
a greater service life as well. These two factors offset some of the high initial cost. HFST is a
treatment that is most suited for locations where you need a friction demand above and beyond
what can be provided with UBAWS and the costs associated with realignment to improve safety
are prohibitive.

6
Using crash data from the first year following one of the four projects, the reduction of 27
crashes during the period at just this one location results in a savings of about $966,300, or
nearly twice the additional cost of HFST placement all four locations combined. Using present
worth cost of crashes and MODOT’s target of 20 percent reduction in accidents results in a
minimum savings of $4,136,000, over the 9-year life of the treatment.
LESSONS LEARNED
There were several issues identified that could help provide for more successful application of
this technology in the future:
There are many specifications in use around the country with respect to the application of
high-friction surfaces. This leads to issues, as contractors, material suppliers, equipment
developers, etc. attempt to shape specifications in each State. It should be noted that there
now is an American Association of State Highway and Transportation Officials
(AASHTO) Provisional Specification for HFST, PP 79-14.
It is important to gain knowledge from as many subject matter experts as possible before
entertaining such projects to avoid issues with contracting and construction. FHWA
proved to be an invaluable resource in this area, acting as a clearinghouse for national
experience.
Temperature at the time of HFST placement is critical. All projects were originally slated
for night work, but delaying some of the construction into the fall months resulted in
difficulty obtaining the required nighttime temperatures.
Placement of an HFST over new asphalt requires a minimum 30-day cure before
application of the surface to ensure desired bonding.
While the most common binder in use in Missouri is epoxy, some new polymeric resins
that can be applied over a wider range of temperatures should be investigated. Projects let
in Missouri after the completion of the HfL projects have this as an option.
CONCLUSIONS
In spite of the significant additional cost, there are locations where the application of an HFST is
appropriate because of the geometrics and crash history of the area. Much of the additional cost
can be attributed to the use of the epoxy resin used as a binder and the extremely high-quality
aggregate used. Also, at this time, there are a limited number of contractors in the area with the
knowledge and equipment necessary to perform the work.
The friction numbers resulting from the application of HFST technology show a level of friction
not achieved with any previous treatment used by Missouri DOT and should result in a
measurable increase in safety for the locations selected.

7
PROJECT DETAILS - GENERAL
BACKGROUND
The Missouri DOT HfL demonstration project consisted of the application of HFST at four
locations around the State. One project included two separate locations, both on I-44 in Phelps
County. The remaining two locations were in Cole County, on US 54 and MO 179. Three of the
locations were on the mainline of four-lane divided highways, and the fourth was composed of
several critical locations near the intersection of US 54 and MO 179. Figure 1 shows a map of all
the project locations.
Figure 1. Map. General project locations.
The projects selected had a history of wet-weather crashes, and MoDOT believed that increased
friction would provide a major benefit with regards to reducing wet-weather crashes. The
projects ranged in length from a few hundred feet to about 0.9 miles.
HIGH-FRICTION SURFACE TREATMENTS
Maintaining sufficient friction has always been considered critical with respect to minimizing
certain types of highway crashes. It is particularly critical in horizontal curves and in areas of

8
heavy breaking, such as intersections. FHWA data indicate that while horizontal curves account
for only about 5 percent of the nation’s mileage, these locations are responsible for nearly 25
percent of fatal crashes.(1) HFSTs provide exceptional friction characteristics when compared to
most traditional surface treatments. Because of the high initial cost, HFSTs are generally applied
to short sections of highway using resin or polymer binders and extremely high-quality
aggregates. This provides a very durable surface much less likely to wear or polish than
traditional overlay materials.
Because of the thickness and required bond, HFSTs should only be applied to pavements in good
condition. Research indicates that, under these conditions, a service life of 7 – 12 years can be
expected.(2) A report commissioned by Transit New Zealand showed 30 percent reduction in wet
crashes following the application of HFST.(3)
HFST are composed of two materials, a thermosetting polymer resin binder (usually epoxy,
modified polyester, or urethane) and a very hard, durable aggregate. Bauxite is the most
commonly used material.
Bauxite is the principal ore from which aluminum is obtained. Although several aggregates have
been tested for their durability, at this time, only calcined bauxite has met the conditions
necessary to be considered a high-friction surface. Calcined bauxite has a rating of about 9 on the
Mohs hardness scale. There are limited sources in the US, and much of the supply comes from
either China or India. In this case, the calcined bauxite originated in China and was obtained
through a regional distributer.
Missouri DOT expects to use the lessons learned under this demonstration project to
systematically address other locations in the State that could benefit from additional pavement
friction. The material used for all four locations was identical, and specified in a job special
provision developed specifically for the HfL projects. The specification for the epoxy binder is
shown in table 1. Specifications for the aggregate were listed in the same job special provision
and are shown in table 2.

9
Table 1. Epoxy binder specifications.
Property Test Method Requirements
Epoxy Resin MMA
Ultimate Tensile
Strength AASHTO M-235 2,000 – 5,000 psi 1,500 – 5,000 psi
Elongation at break
point AASHTO M-235 30 – 70 % 30 – 70 %
Compressive
Strength ASTM C-579 1,600 psi minimum 1,600 psi minimum
Compressive
Strength AASHTO M-235
1,000 psi min.at 3
hours.
5,000 psi min. at 7
days.
1,000 psi min.at 3
hours.
2,000 psi min. at 7
days.
Water Absorption AASHTO M-235 1 % max. 1 % max.
Durometer ASTM D-2240 60 – 80 40 - 75
Hardness (Shore D)
Viscosity ASTM D-2556 Class C: 30 – 70
poises
Class C: 12 – 20
poises
Gel Time AASHTO M-235 Class C: 10 minutes
minimum
Class C: 10 minutes
minimum
Cure Rate (dry
through time) ASTM D-1640 3 hour max. 3 hour max.
Adhesive Strength
at 24 hours ASTM C-1583
250 psi min. or 100%
substrate failure
250 psi min. or 100%
substrate failure
Table 2. Calcined bauxite aggregate specifications.
Property Test Method Requirement
Polish Stone Value AASHTO T-279 65 min.
Resistance to Degradation AASHTO T-96 20% max.
Aggregate Grading AASHTO T-27
No. 4 Passing 100% min.
No. 6 Passing 95% min.
No. 16 Percent Passing 5%
max.
Moisture Content AASHTO T-255 0.2% max.
Aluminum Oxide ASTM C-25 87% min.

10
PROJECT DETAILS – US 54, COLE COUNTY
BACKGROUND
The first of the HFST projects completed under this HfL project was placed near the Madison
Street exit from US 54 in Jefferson City. The location is shown in figure 2. The project spans a
distance of only about 0.2 miles and is concentrated at a curve with a history of road departure
crashes.
Figure 2. Photo. US 54, Jefferson City, Missouri near Madison Street Exit (courtesy: Google
Earth).
At this location, US 54 is a 4-lane divided facility carrying nearly 30,000 vehicles per day. The
existing pavement was an asphalt pavement with paved shoulders in good condition. The HFST
was applied over a UBAWS that had been applied approximately 5 years earlier.
PROJECT DESCRIPTION
The improvement was limited to the application of the HFST on both the driving and passing
lanes, in both the eastbound and westbound directions of travel. The HFST was composed of an
epoxy binder followed by the application of a very hard, durable aggregate, in this case, calcined
bauxite. Figure 3 shows the cross section for the innovation at the US 54 location.

11
Figure 3. Diagram. Cross section of HFST used on US 54, Cole County.
The project was awarded in September 2013 at a cost of $84,333. The HFST component of the
bid was $77,435, with the remainder used for mobilization, striping removal, and lighting for
nighttime operations.
Construction began on October 13, 2013, and was completed on October 17, 2013. It was
originally estimated that the construction would take only 2 days, but cold weather at night
prevented continuous work. Before the HFST was applied, the roadway was broomed to remove
any loose material that might affect the bond of the HFST. The surface of the roadway prior to
application of the HFST is shown in figure 4.
Any wide cracks or small potholes were air blasted and filled with epoxy material prior to
application of the HFST. Duct tape was used to cover existing lane markings as protection from
the epoxy, eliminating the need to restripe immediately after surfacing (see figure 5). The actual
surfacing consisted of the application of the epoxy resin to the surface by use of a handheld wand
(figure 6). The epoxy material was then spread over the entire surface to be treated using a
notched squeegee (figure 7).
Once the epoxy was applied, the aggregate was blown onto the surface. Specially equipped dump
trucks provided surface material to a trailer that both mixed and delivered the epoxy and
distributed the bauxite through a large hose using compressed air (see figures 8 and 9). The rate
of application was not critical, as any material that did not sink into the epoxy was recovered for
later use. The critical factor was making sure that the entire surface was covered. If necessary,
hand application supplemented the initial application. The HFST was allowed to cure overnight

12
to ensure stability before brooming and opening to traffic. Figure 10 shows the texture of the
final surface.
Figure 4. Photo. Surface prior to application.
Figure 5. Photo. Workers cover existing lane markings before application of HFST.

13
Figure 6. Photo. Application of epoxy to road surface.
Figure 7. Photo. Epoxy spread using notched squeegee.

14
Figure 8. Photo. Dump truck supplying surface to distribution trailer.
Figure 9. Photo. Surface material blown onto recently placed epoxy binder.

15
Figure 10. Photo. Final HFST texture.
DATA ACQUISITION AND ANALYSIS
As appropriate, safety, construction congestion, and quality data were collected before and
during the project construction to determine if this project met the HfL performance goals. The
primary objective of this data acquisition and analysis was to quantify the project performance,
to provide an objective basis to determine the feasibility of the project innovations, and to
demonstrate that the innovations can be used to do the following:
Achieve a safer work environment for the traveling public and workers.
Reduce construction time and minimize traffic interruptions.
Produce a high-quality project and gain user satisfaction.
This section discusses how well the Missouri DOT project met the specific HfL performance
goals related to these areas.
Safety
The HfL performance goals for safety include satisfying the following criteria:
Meeting worker and motorist safety goals during construction.
Reduction in fatalities and injuries after construction.
Table 3 shows the crash history and rate calculations for the eastbound and westbound segments
for a 3-year period prior to construction.

16
Table 3. Pre-construction crash rates on US 54.
Route Reference Length
(miles)
No. of crashes
10/13/2010 to 10/13/2013
Crash Rate (crashes/ 100
million vehicle miles
traveled)
Fatal Injury PDO Total 3-Year
Rate
3-Year Rate
(Statewide)
US 54 E
Log mile 167.21
to
Log mile 167.421
0.211 0 13 32 45 1,552 N/A
US 54 W
Log mile 104.456
to
Log mile 104.627
0.17 0 18 33 51 1,978 N/A
PDO = property damage only
The HFST was applied between two other geometric features, the ramp to and from Madison
Street and another horizontal curve to the east of the project, resulting in a very short segment
(~0.2 mi) to be evaluated. Because of the short length of the segment, although accident rates
before construction can be compared to accident rates following construction for the segment, it
is not appropriate to compare it to statewide rates, which are based on entire classes of roadways
that span much longer distances of the order of several miles.
There were four crashes initially reported within the project limits between the date the
construction began and the date of final completion of the HFST. However, none occurred
during the actual existence of the work zone. All occurred during daytime hours when no
workers were present. Because the project limits were so short, and given the nature of crash
reporting, further review of the crashes was conducted. The individual crash reports indicate that
only one crash occurred within the limits of the surfacing, a rear end crash resulting from traffic
backed up westbound attempting to exit to Jefferson Street. Of the other three crashes, two
occurred at the eastbound exit to Jefferson Street just before the application started and one
initiated in the horizontal curve before the treatment in the westbound direction, with the vehicle
coming to rest within the project limits. Since none of the crashes occurred during construction,
the HfL goal of a work zone crash rate less than or equal to the preconstruction rate is considered
to be achieved.
Because there was more than a year between the completion of this project and construction of
the remaining three locations included in this HfL demonstration project, some data were
available on postconstruction crashes. Using the data presented above, in the 3-year period prior
to construction there were 96 crashes within the project limits, or about 32 per year. At the time
of this report only five crashes have been reported during the first year after construction. While
these data are preliminary, it would appear that the HFST has contributed to a dramatic reduction
in crashes at this location.
17
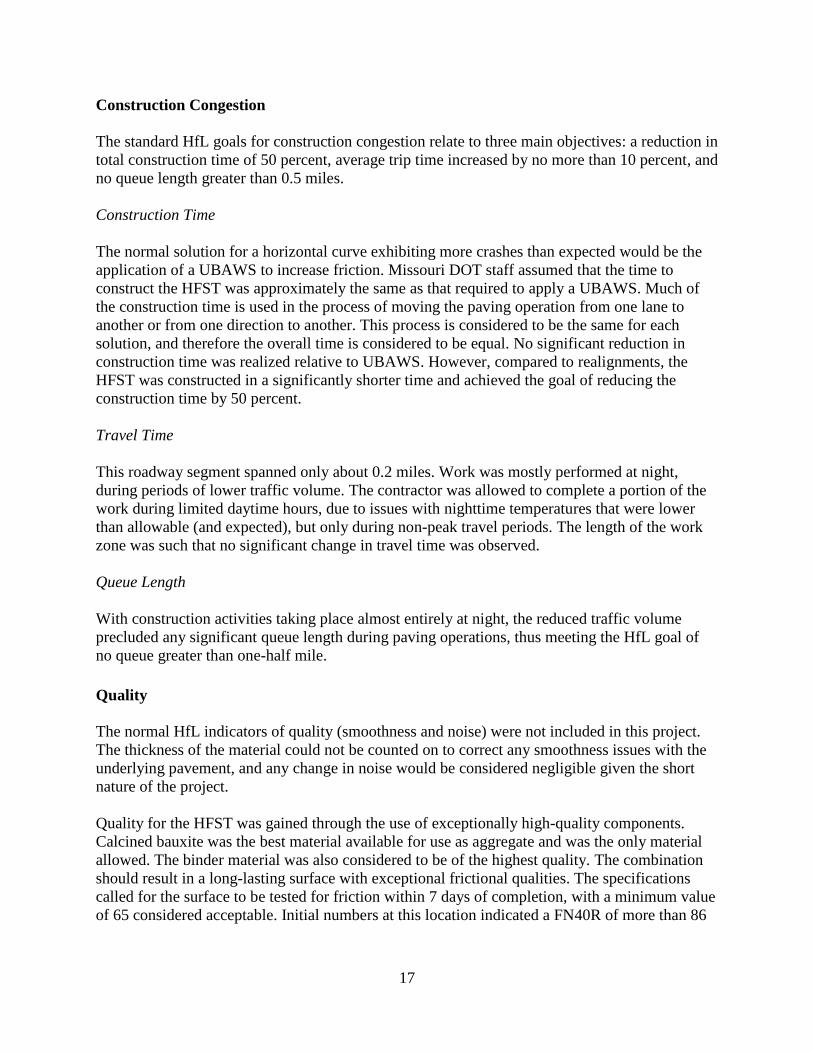
Construction Congestion
The standard HfL goals for construction congestion relate to three main objectives: a reduction in
total construction time of 50 percent, average trip time increased by no more than 10 percent, and
no queue length greater than 0.5 miles.
Construction Time
The normal solution for a horizontal curve exhibiting more crashes than expected would be the
application of a UBAWS to increase friction. Missouri DOT staff assumed that the time to
construct the HFST was approximately the same as that required to apply a UBAWS. Much of
the construction time is used in the process of moving the paving operation from one lane to
another or from one direction to another. This process is considered to be the same for each
solution, and therefore the overall time is considered to be equal. No significant reduction in
construction time was realized relative to UBAWS. However, compared to realignments, the
HFST was constructed in a significantly shorter time and achieved the goal of reducing the
construction time by 50 percent.
Travel Time
This roadway segment spanned only about 0.2 miles. Work was mostly performed at night,
during periods of lower traffic volume. The contractor was allowed to complete a portion of the
work during limited daytime hours, due to issues with nighttime temperatures that were lower
than allowable (and expected), but only during non-peak travel periods. The length of the work
zone was such that no significant change in travel time was observed.
Queue Length
With construction activities taking place almost entirely at night, the reduced traffic volume
precluded any significant queue length during paving operations, thus meeting the HfL goal of
no queue greater than one-half mile.
Quality
The normal HfL indicators of quality (smoothness and noise) were not included in this project.
The thickness of the material could not be counted on to correct any smoothness issues with the
underlying pavement, and any change in noise would be considered negligible given the short
nature of the project.
Quality for the HFST was gained through the use of exceptionally high-quality components.
Calcined bauxite was the best material available for use as aggregate and was the only material
allowed. The binder material was also considered to be of the highest quality. The combination
should result in a long-lasting surface with exceptional frictional qualities. The specifications
called for the surface to be tested for friction within 7 days of completion, with a minimum value
of 65 considered acceptable. Initial numbers at this location indicated a FN40R of more than 86

18
in both directions. One year later, follow-up testing indicated that the FN40R number remained
nearly 75.
User Satisfaction
Due to the short construction time and the night work involved in this project, it was assumed
that there would be little or no impact to the public, so no survey was conducted.
ECONOMIC ANALYSIS
A key aspect of HfL projects is quantifying, as much as possible, the value of the innovation
deployed. This entails comparing the benefits and costs associated with the innovative project
delivery approach to the more traditional methods.
The only innovation employed on the Missouri projects was the use of HFST. The comparison
made here looks at only this innovation versus a traditional application of a UBAWS as
described previously.
Construction Time
Missouri DOT estimated that there was no significant change in construction time between the
innovation and the traditional UBAWS solution. However, compared to realignments, the HFST
was constructed in a significantly shorter time and achieved the goal of reducing the construction
time by 50 percent.
Construction Capital Costs
There was a significant increase in capital costs associated with the application of HFST. If it is
assumed that mobilization, lighting required for nighttime construction, and pavement marking
would be the same for both the innovative and traditional solutions, the only difference would be
the material itself and the placement of the materials.
Missouri DOT estimates that the cost of traditional UBAWS would be $4.12 per square yard, in
place. The HFST used here was bid at $77,435 for 4,555 square yards, or $17 per square yard in
place. This indicates an increased cost of $58,668 for application of the HFST as compared to the
UBAWS. However, the additional costs were significantly less compared to costs associated
with realigning the section of the roadway to address ROR crashes. The friction numbers
obtained with this innovation far exceeded those that would be expected with the traditional
alternative, which translates to fewer post-construction accident rates.
User Cost
Generally there are three categories of user costs used in an economic/life cycle analysis: vehicle
operating costs, delay cost, and safety-related costs.
In the case of US 54, there was no detour, and the work zone speed reduction of 10 mph applied

19
to less than one-half mile of total travel. In addition, most work was completed at night, where
substantially less traffic volume was affected. With no change of estimated construction time
between the two alternatives, it is concluded that there were no differences in user costs between
the traditional and innovative solutions.
Safety
It was estimated that the total time to construct this project was the same with HFST as would
have been the case with traditional construction methods. Given this assumption and the fact that
there were no crashes reported within the project limits during construction, it can be assumed
that the safety cost differential for the innovation compared to traditional construction was zero
for the actual construction period.
However, as discussed previously, initial data indicate that there was a significant decrease in
crashes during the year after construction. During that year, there were only 5 crashes in this
location, compared to an average of 32 per year prior to construction—a reduction of about 84
percent.

20
PROJECT DETAILS – I-44, PHELPS COUNTY
BACKGROUND
The second project to be constructed under the HfL program was located in Phelps County.
This project included two locations. The first section was located west of Rolla near the
Pulaski County line, and the second section was located just east of Rolla. Figure 11 is a map
identifying the project locations. Figure 12 is an aerial photo showing the limits of the
westernmost section.
The westernmost section (MO J) is a four-lane divided facility. The HFST was placed only on
the eastbound lanes, where traffic averages about 12,900 vehlcles per day. The project spans a
distance of only about 0.56 miles and is concentrated at a curve with a history of road departure
crashes. The application started just past the exit ramp from I-44 to MO J.
The easternmost segment, near MO V, is also a four-lane divided facility carrying approximately
14,500 vehicles per day in the eastbound direction. The project length is 0.84 miles, starting just
before the exit ramp to MO V, as shown in figure 13.
Figure 11. Map. I-44, Phelps County Missouri, general project locations (courtesy: Google
Maps).
Project Locations

21
Figure 12. Photo. I-44 project location near MO J (courtesy: Google Earth).
Figure 13. Photo. I-44 project location at MO V (courtesy: Google Earth).

22
PROJECT DESCRIPTION
The improvements were limited to the application of the HFST on the driving and passing lanes,
in the eastbound directions of travel. The HFST was composed of an epoxy binder followed by
the application of a very hard, durable aggregate, calcined bauxite.
Figure 14 and 15 shows the cross section for the innovation at the MO J and MO V locations,
respectively.
The project was awarded in March 2014 at a cost of $568,777. The HFST component of the bid
was $465,840, with the remainder used for mobilization, traffic control, striping removal, and
lighting for nighttime operations.
Figure 14. Diagram. Typical section for I-44 HFST placement at MO J.
Figure 15. Diagram. Typical section for I-44 HFST placement at MO V.

23
PROJECT CONSTRUCTION
The duration of the project ran from May 17, 2014, until May 30, 2014. Construction on the west
section near MO J started on May 17 and was completed by May 27. However, actual
construction work only occurred on 6 of the 11 days at this location. Construction of the eastern
section started on May 20, 2014, and ended on May 27, 2014, with actual construction work
occurring on only 3 of those days.
Before the HFST was applied, the roadway was broomed to remove any loose material that
might affect the bond of the HFST. The surface at the MO J location had been longitudinally
grooved in the past to try and improve friction and provide drainage. The surface of the roadway
prior to application of the HFST at this location is shown in figure 16. The surface at the MO V
location had not been grooved.
Any wide cracks, small potholes, or distressed areas were air blasted and filled with epoxy
material prior to application of the surface (see figure 17).
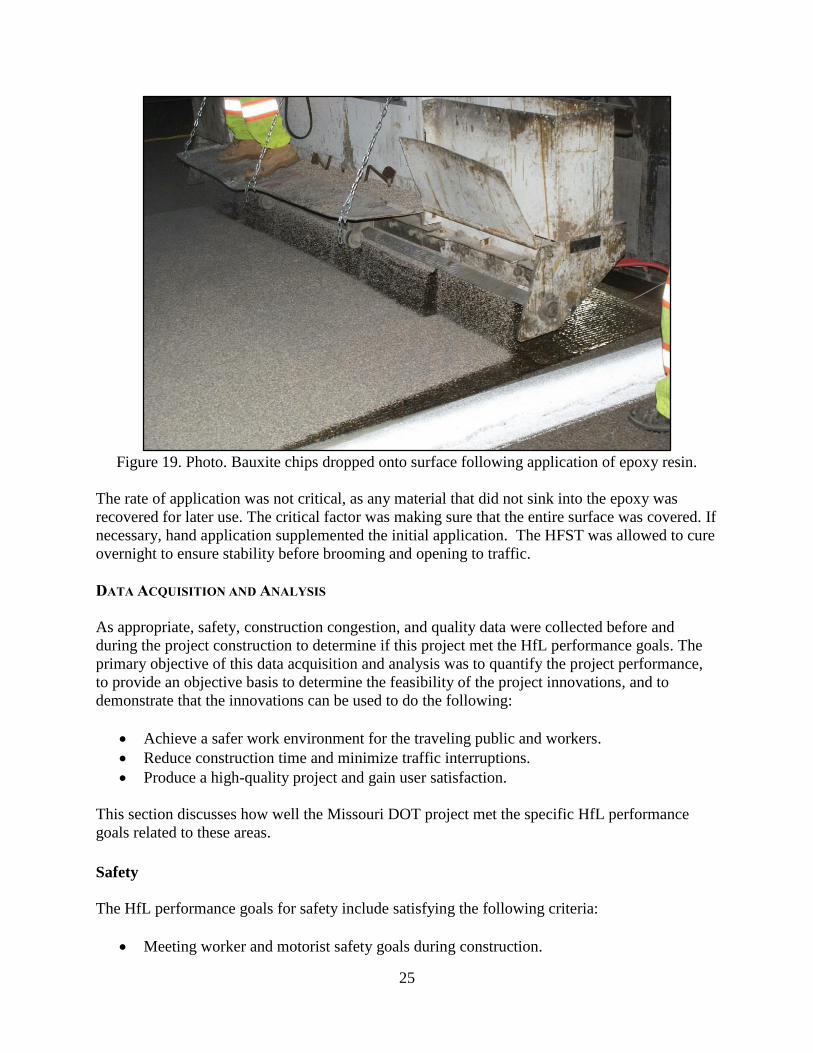
Application of the HFST on the Phelps County locations differed significantly from the US 54
location. In this case, a single vehicle carried both the epoxy material and the chips (see figure
18). The epoxy material was sprayed onto the surface by means of a distribution head under the
vehicle, with chips dropped onto the wet surface immediately behind the distributer bar (see
figure 19).
Figure 16. Photo. Grooved pavement surface prior to application (near MO J).

24
Figure 17. Photo. Workers fill distressed area with epoxy material prior to HFST application.
Figure 18. Photo. Machine used to place HFST.
25
Figure 19. Photo. Bauxite chips dropped onto surface following application of epoxy resin.
The rate of application was not critical, as any material that did not sink into the epoxy was
recovered for later use. The critical factor was making sure that the entire surface was covered. If
necessary, hand application supplemented the initial application. The HFST was allowed to cure
overnight to ensure stability before brooming and opening to traffic.
DATA ACQUISITION AND ANALYSIS
As appropriate, safety, construction congestion, and quality data were collected before and
during the project construction to determine if this project met the HfL performance goals. The
primary objective of this data acquisition and analysis was to quantify the project performance,
to provide an objective basis to determine the feasibility of the project innovations, and to
demonstrate that the innovations can be used to do the following:
Achieve a safer work environment for the traveling public and workers.
Reduce construction time and minimize traffic interruptions.
Produce a high-quality project and gain user satisfaction.
This section discusses how well the Missouri DOT project met the specific HfL performance
goals related to these areas.
Safety
The HfL performance goals for safety include satisfying the following criteria:
Meeting worker and motorist safety goals during construction.
26
Reduction in fatalities and injuries after construction.
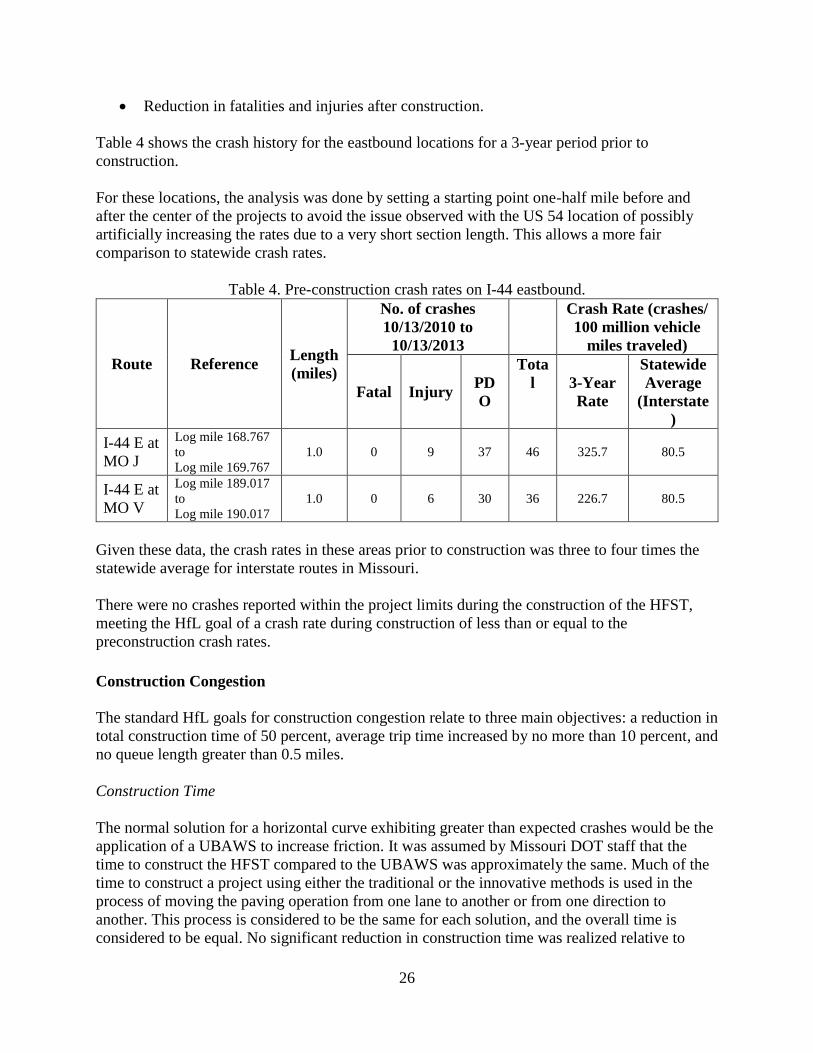
Table 4 shows the crash history for the eastbound locations for a 3-year period prior to
construction.
For these locations, the analysis was done by setting a starting point one-half mile before and
after the center of the projects to avoid the issue observed with the US 54 location of possibly
artificially increasing the rates due to a very short section length. This allows a more fair
comparison to statewide crash rates.
Table 4. Pre-construction crash rates on I-44 eastbound.
Route Reference Length
(miles)
No. of crashes
10/13/2010 to
10/13/2013
Crash Rate (crashes/
100 million vehicle
miles traveled)
Fatal Injury PD
O
Tota
l 3-Year
Rate
Statewide
Average
(Interstate
)
I-44 E at
MO J
Log mile 168.767
to
Log mile 169.767
1.0 0 9 37 46 325.7 80.5
I-44 E at
MO V
Log mile 189.017
to
Log mile 190.017
1.0 0 6 30 36 226.7 80.5
Given these data, the crash rates in these areas prior to construction was three to four times the
statewide average for interstate routes in Missouri.
There were no crashes reported within the project limits during the construction of the HFST,
meeting the HfL goal of a crash rate during construction of less than or equal to the
preconstruction crash rates.
Construction Congestion
The standard HfL goals for construction congestion relate to three main objectives: a reduction in
total construction time of 50 percent, average trip time increased by no more than 10 percent, and
no queue length greater than 0.5 miles.
Construction Time
The normal solution for a horizontal curve exhibiting greater than expected crashes would be the
application of a UBAWS to increase friction. It was assumed by Missouri DOT staff that the
time to construct the HFST compared to the UBAWS was approximately the same. Much of the
time to construct a project using either the traditional or the innovative methods is used in the
process of moving the paving operation from one lane to another or from one direction to
another. This process is considered to be the same for each solution, and the overall time is
considered to be equal. No significant reduction in construction time was realized relative to

27
UBAWS. However, compared to realignments, the HFST was constructed in a significantly
shorter time and achieved the goal of reducing the construction time by 50 percent.
Travel Time
The westernmost and easternmost segments of this HfL project spanned only about 0.56 and 0.82
miles, respectively. Work was mostly done at night, during periods of lower traffic volume. The
length of the work zone was such that no significant change in travel time was observed.
Queue Length
With construction activities taking place almost entirely at night, the reduced traffic volume
precluded any significant queue length during paving operations, thus meeting the HfL goal of
no queue greater than one-half mile.
Quality
The normal HfL indicators of quality (smoothness and noise) were not included in this project.
The thickness of the material could not be counted on to correct any smoothness issues with the
underlying pavement, and any change in noise would be considered negligible given the short
nature of the project.
Quality for the HFST was gained through the use of exceptionally high-quality components.
Calcined bauxite was the best material available for use as aggregate and was the only material
allowed. The binder material was also considered to be of the highest quality. The combination
should result in a long-lasting surface with exceptional frictional qualities. The specifications
called for the surface to be tested for friction within 7 days of completion, with a minimum value
of 65 considered acceptable. Initial numbers at this location indicated a FN40R between 82.6 and
84.1 for both directions.
User Satisfaction
Due to the short construction time and the night work involved in this project, it was assumed
that there would be little or no impact to the public, so no survey was conducted.
ECONOMIC ANALYSIS
A key aspect of HfL projects is quantifying, as much as possible, the value of the innovation
deployed. This entails comparing the benefits and costs associated with the innovative project
delivery approach to the more traditional methods.
The only innovation employed on the Missouri projects was the use of HFST. The comparison
made here looks at only this innovation versus a traditional application of a UBAWS as
described previously.
28
Construction Time
Missouri DOT estimated that there was no significant change in construction time between the
innovation and the traditional solution.
Construction Capital Costs
There was a significant increase in capital costs associated with the application of HFST. If it is
assumed that mobilization, lighting required for nighttime construction, and pavement marking
would be the same for both the innovative and the traditional solutions, the only difference
would be the material itself and the placement of the materials.
Missouri DOT estimates that the cost of traditional UBAWS would be $4.12 per square yard, in
place. The HFST used here was bid at $465,840 for 21,667 square yards, or $21.5 per square
yard in place. This indicates an increased cost of $376,572 for application of the HFST.
However, the additional costs were significantly less compared to costs associated with
realigning the section of the roadway to address ROR crashes. The friction numbers obtained
with this innovation far exceeded those that would be expected with the traditional alternative,
which translates to fewer post-construction accident rates.
User Cost
Generally there are three categories of user costs used in an economic/life cycle analysis: vehicle
operating costs, delay cost, and safety-related costs.
In the case of I-44, there was no detour, and the work zone speed reduction of 10 mph applied to
less than 1 mile of total travel. In addition, most work was completed at night, where
substantially less traffic volume was affected. With no change of estimated construction time
between the two alternatives, it is concluded that there were no differences in user cost between
the traditional and innovative solutions.
Safety
It was estimated that the total time to construct this project was the same with HFST as would
have been the case with traditional construction methods. Given this assumption and the fact that
there were no crashes reported within the project limits during construction, it can be assumed
that the safety cost differential for the innovation compared to traditional construction was zero
for the actual construction period.
While only limited time has passed since the application of the HFST, there have been no
crashes reported within the project limits at the time of this report.

29
PROJECT DETAILS – MO 179, COLE COUNTY
BACKGROUND
The final project to be constructed under the HfL program was located on MO 179 at the
intersection with US 54 in Cole County (see figure 20).
At this location, MO 179 is a four-lane divided facility carying about 15,850 vehicles per day.
The HFST was added to an existing resurfacing project on MO 179 that stretched from US 50 to
just south of US 54. The original plans called for cold milling and the application of a Superpave
surface for a length of about 4.7 miles. There had been a history of crashes near the south end of
this project, especially on ramps from eastbound US 54 to MO 179 and at southbound stop bar
locations on MO 179 (see figure 21). For this reason, it was decided to add the HFST at these
specific locations after completion of the overlay.
Figure 20. Photo. MO 179, Cole County, general project location (courtesy: Google Earth).

30
Figure 21. Photo. Specific locations of HFST application.
PROJECT DESCRIPTION
The improvements were limited to the application of the HFST on the driving and passing lanes,
in the southbound direction of travel just prior to stop bar locations and at the ramp from
eastbound US 54 to MO 179. A downhill grade at the two mainline locations also contributed to
the need for improved friction, while travelers stopped at the top of the exit ramp experienced
traction issues when making the turn onto MO 179, especially northbound.
The HFST was composed of an epoxy binder followed by the application of a very hard, durable
aggregate, calcined bauxite.
The project was awarded in November 2014 at a cost of $880,908. The HFST component of the
bid was $111,078, with the remainder used for traditional resurfacing of the remaining 4+ miles
of the project and the associated mobilization, traffic control, striping removal, and lighting for
nighttime operations.
PROJECT CONSTRUCTION
The duration of the entire project ran from August 21, 2014, until October 27, 2014. However,
construction work for the HFST only occurred between October 7 and October 21. Within this
time period, only 6 days were used for actual placement of the HFST.
Most work was completed at night; however, the contractor was allowed to perform some hand
work during the day, when other construction activities were already being conducted.

31
Whereas on the previous HFST projects the underlying pavement had been in service for years,
in this case, the HFST was applied to a new pavement. Specifications called for a waiting period
of 30 days before the HFST could be applied. While the contractor suggested waiving or
reducing this waiting period (due to the early advent of cold weather), discussions with FHWA
staff and other technology experts recommended that the 30-day period be maintained. This was
mainly required to allow any surface oil to be tracked off the surface to ensure proper bond.
Before the HFST was applied, the roadway was broomed to remove any loose material that
might affect the bond of the HFST.
The process used at this location was the same as used at the Cole County location: application
of the epoxy through a wand, spreading the epoxy with a notched squeegee, and then applying
the aggregate through an air driven blower system (see figures 22 and 23).
Pavement markings (stop bars, turn arrows, etc.) that had been previously installed were taped
off to avoid contact with the epoxy before application of the aggregate (see figure 24). The rate
of application was not critical, as any aggregate that did not sink into the epoxy was recovered
for later use. The critical factor was making sure that the entire surface was covered. If
necessary, hand application supplemented the initial application. The HFST was allowed to cure
overnight to ensure aggregate adhesion before brooming and opening to traffic.
Figure 22. Photo. Epoxy material spread using notched squeegee.

32
Figure 23. Photo. Bauxite material blown onto surface of previously installed epoxy binder.
Figure 24. Photo. Workers apply epoxy material near previously installed pavement markings.

33
DATA ACQUISITION AND ANALYSIS
As appropriate, safety, construction congestion, and quality data were collected before and
during the project construction to determine if this project met the HfL performance goals. The
primary objective of this data acquisition and analysis was to quantify the project performance,
to provide an objective basis to determine the feasibility of the project innovations, and to
demonstrate that the innovations can be used to do the following:
Achieve a safer work environment for the traveling public and workers.
Reduce construction time and minimize traffic interruptions.
Produce a high-quality project and gain user satisfaction.
This section discusses how well the Missouri DOT project met the specific HfL performance
goals related to these areas.
Safety
The HfL performance goals for safety include satisfying the following criteria:
Meeting worker and motorist safety goals during construction.
Reduction in fatalities and injuries after construction.
In the case of MO 179, the HFST was applied at spot locations within the footprint of the MO
179/US 54 interchange. Stop/start and turning movement locations where crash history indicated
improved friction may be required were the primary targets. Because of the spot nature of the
improvements, the crash analysis for this HfL location was treated slightly differently than a
normal range analysis. Data were drawn from crash records 0.5 miles each side of the center of
the project along MO 179. Any crashes associated with any of the interchange ramps were also
included. Turning movements to or from MO 179 were considered part of the MO 179 traffic
volume, so ramp volumes were not considered in this analysis. Table 5 shows the crash history
and rates at this location for a 3-year period prior to construction.
Table 5. Pre-construction crash rates on MO 179.
Route Referen
ce
Length
(miles)
No. of crashes
10/13/2010 to
10/13/2013
Crash Rate (crashes/
100 million vehicle
miles traveled)
Fatal Injury PD
O
Tota
l 3-Year
Rate
Statewide
Average
(Interstate
)
MO 179/US
54 Interchange
Log mile
2.92 to
Log mile
3.92
1.0 0 16 22 38 218.9 N/A

34
There were no crashes reported within the project limits during the construction of the HFST,
meeting the HfL goal of a crash rate during construction of less than or equal to the
preconstruction crash rates.
Construction Congestion
The standard HfL goals for construction congestion relate to three main objectives: a reduction in
total construction time of 50 percent, average trip time increased by no more than 10 percent, and
no queue length greater than 0.5 miles.
Construction Time
The traditional solution for a location exhibiting more crashes than expected due to reduced
friction would be the application of a UBAWS. Missouri DOT staff assumed that the time to
construct the HFST was approximately the same as would be required to apply a UBAWS. Much
of the time to construct either scenario is used in the process of moving the paving operation
from one lane to another or from one direction to another. This process is considered to be the
same for each solution, so the overall time is considered to be equal. No significant reduction in
construction time was realized.
Travel Time
Construction of the HFST spanned only a few hundred feet at a time. Work was mostly
conducted at night, during periods of lower traffic volume. The length of the work zone was such
that no significant change in travel time was observed.
Queue Length
With construction activities taking place almost entirely at night, the reduced traffic volume
precluded any significant queue length during paving operations, thus meeting the HfL goal of
no queue greater than one-half mile.
Quality
The normal HfL indicators of quality (smoothness and noise) were not included in this project.
The thickness of the material could not be counted on to correct any smoothness issues with the
underlying pavement, and any change in noise would be considered negligible given the short
nature of the project.
Quality for the HFST was gained through the use of exceptionally high-quality components.
Calcined bauxite was the best material available for use as aggregate and was the only material
allowed. The binder material was also considered to be of the highest quality. The combination
should result in a long-lasting surface with exceptional frictional qualities. The specifications
called for the surface to be tested for friction within 7 days of completion, with a minimum value
of 65 considered acceptable. Initial numbers at this location indicated a FN40R of about 86.7.
35
USER SATISFACTION
Due to the short construction time and the night work involved in this project, it was assumed
that there would be little or no impact to the public, so no survey was conducted.
ECONOMIC ANALYSIS
A key aspect of HfL projects is quantifying, as much as possible, the value of the innovation
deployed. This entails comparing the benefits and costs associated with the innovative project
delivery approach to the more traditional methods. The only innovation employed on the
Missouri projects was the use of HFST. The comparison made here looks at only this innovation
versus a traditional application of a UBAWS as described previously.
Construction Time
Missouri DOT estimated that there was no significant change in construction time between the
innovation and the traditional solution.
Construction Capital Costs
There was a significant increase in capital costs associated with the application of HFST. If it is
assumed that mobilization, lighting required for nighttime construction, and pavement marking
would be the same for both the traditional and the innovative solutions, the only difference
would be the material itself and the placement of the materials.
Missouri DOT estimates that the cost of traditional UBAWS would be $4.12 per square yard, in
place. The HFST used here was bid at $111,078 for 6,171 square yards, or $18 per square yard in
place. This indicates an increased cost of $85,653 for application of the HFST. However, the
additional costs were significantly less compared to costs associated with realigning the section
of the roadway to address ROR crashes. The friction numbers obtained with this innovation far
exceeded those that would be expected with the traditional alternative, which translates to fewer
post-construction accident rates.
User Cost
Generally there are three categories of user costs used in an economic/life cycle analysis: vehicle
operating costs, delay cost, and safety-related costs.
In the case of MO 179, there was no detour, and the work zone speed reduction of 10 mph
applied to less than one-half mile of total travel. In addition, most work was completed at night,
where substantially less traffic volume was affected. With no change of estimated construction
time between the two alternatives, it is concluded that there were no differences in user cost
between the traditional and innovative solutions.
Safety

36
It was estimated that the total time to construct this project was the same with HFST as would
have been the case with traditional construction methods. Given this assumption and the fact that
there were no crashes reported within the project limits during construction, it can be assumed
that the safety cost differential for the innovation compared to traditional construction was zero
for the actual construction period.
While only limited time has passed since the application of the HFST, there have been no
crashes reported within the project limits at the time of this report.

37
ECONOMIC ANALYSIS
There was a significant increase in initial cost for use of the HFST on this project as compared to
UBAWS. The use of HFST on the four locations added an estimated $520,893 above the cost of
the traditional solution. While no savings were realized in construction time or safety during
construction activities, it is assumed that there will be major savings with respect to future safety
on these roadways. MODOT’s HfL application indicates that one of the goals of HFST at these
locations is to reduce fatalities and injuries at test site locations by 20 percent.
While most of the sections completed are too new to have postconstruction safety data available,
the US 54 location has been in place more than a year, and some initial data are available. As
discussed previously, the 3-year crash history indicated that there was an average of 32 crashes
per year occurring at that location. In the year since construction of the HFST, there have been
only 5 crashes. Based on this limited initial data from one of the projects, MODOT’s goal of 20
percent reduction in accident rates seems achievable.
MoDOT believes that, even in times of reduced funding and limited resources, the higher initial
cost of the HFST is a worthwhile investment for locations that exhibit a similar crash history.
While comparison with UBAWS was used for the economic analysis, UBAWS is not directly
comparable with HFST in terms of long-term safety and durability performance. A long term
durable solution includes realignment of portions of the roadway to reduce ROR crashes. HFST
is substantially more cost effective that the realignment options.
The National Safety Council has published the average cost of crashes by severity. Table 6
shows a breakdown of these costs.
Table 6. Average comprehensive cost of injury by severity (National Safety Council 2012).
Severity Cost (dollars)
Fatal 4,538,000
Incapacitating
Injury 230,000
Injury 58,700
Possible Injury 28,000
PDO 2,500
SAVINGS BASED ON CRASH DATA TO DATE
Using the data from the 3-year period prior to construction, the percentage of crash severity is
calculated to be 0.0 percent fatal, 32.3 percent injury, and 67.7 percent PDO. This equates to an
average crash cost for this location of $35,790 (assuming an equal distribution of incapacitating
injury, injury, and possible injury crashes).
The reduction of 27 crashes during the first year at just this one location results in a savings of
about $966,300, or nearly twice the additional cost of HFST placement all four locations
combined.

38
SAVINGS BASED ON MODOT’S GOAL OF 20 PERCENT REDUCTION
Table 7 shows the number of crashes for the four project locations over a period of 3 years prior
to construction. Assuming no substantial increase in traffic volume or change in traffic patterns,
this trend can be expected to continue for the traditional scenario. Using HFST, MODOT is
targeting a 20 percent reduction in crashes. Assuming a treatment life of 9 years for the HFST;
in the 9 years following construction, the number of injury crashes can be expected to be reduced
by at least 37 and the number of PDO crashes can be expected to be reduced by at least 92. The
total reduction in crashes is expected to be at least 129 at the four locations over the 9-year
period.
Table 7. Pre-construction crash history at all project locations combined.
Route
No. of crashes
10/13/2010 to 10/13/2013
Fatal Injury PD
O
Tota
l
All
Combin
ed
0 62 154 216
Using present worth cost of crashes as shown in table 6, this 20 percent reduction in accidents,
results in a minimum savings of $4,136,000, over the 9-year life of the treatment (assuming an
equal distribution of incapacitating injury, injury, and possible injury crashes).

39
REFERENCES
1. EDC 2012 Initiatives. High Friction Surface Treatment. Federal Highway Administration,
Washington, DC, (accessed December 15, 2014),
https://www.fhwa.dot.gov/everydaycounts/edctwo/2012/friction.cfm
2. Frequently Asked Questions about High Friction Surface Treatments (HFST). FHWA-CAI-
14-019. Federal Highway Administration, Washington, DC, (accessed December 15, 2014).
https://www.fhwa.dot.gov/everydaycounts/edctwo/2012/pdfs/fhwa-cai-14-
019_faqs_hfst_mar2014_508.pdf
3. High Friction Surface Treatments: A Road Surface Treatment for Critical Safety Spot
Locations that Helps Vehicles Stay in Their Lane. Federal Highway Administration,
Washington, DC, (accessed December 15, 2014).
https://www.fhwa.dot.gov/everydaycounts/edctwo/2012/pdfs/hfst_brochure.pdf
40
ACKNOWLEDGMENTS
The project team would like to acknowledge the invaluable insights and guidance of Federal
Highway administration (FHWA) Highways for Life (HfL) Team Leader Byron Lord,
Contracting Officer’s Representative Julie Zirlin, and Program Managers Ewa Flom, Mary Huie,
and Kathleen Bergeron, who served on the technical panel on the demonstration project.
The team also is indebted to Marc Thornsberry and Mike McGee of the FHWA Missouri
Division for their effective coordination effort and to Missouri Department of Transportation
Research Engineer Jen Harper, Construction and Materials Liaison Engineer John Donahue,
Transportation Management Systems Administrator Myrna Tucker and Traffic Safety Engineer
John Miller for their efforts and cooperation on this project. The project team was instrumental in
making this project a success and provided the information that helped shape this report.


