51
Comprehensive Summaries of Uppsala Dissertations from the Faculty of Medicine 1288 Mitochondria and Human Evolution BY MAX INGMAN ACTA UNIVERSITATIS UPSALIENSIS UPPSALA 2003

Comprehensive Summaries of Uppsala Dissertationsfrom the Faculty of Medicine 1288
Mitochondria and Human Evolution
BY
MAX INGMAN
ACTA UNIVERSITATIS UPSALIENSISUPPSALA 2003

i
Dissertation presented at Uppsala University to be publicly examined in Rudbecksalen,Rudbeck Laboratory, Uppsala on 11th October 2003 at 09:15 for the Degree of Doctor ofPhilosophy (Faculty of Medicine) in Medical Genetics.
ABSTRACT
Ingman, M. 2003. Mitochondria and Human Evolution. Acta Universitatis Upsaliensis.Comprehensive Summaries of Uppsala Dissertations from the Faculty of Medicine 1288.50pp. Uppsala. ISBN 91-554-5738-X.
Mitochondrial DNA (mtDNA) has been a potent tool in studies of the evolution ofmodern humans, human migrations and the dynamics of human populations over time.The popularity of this cytoplasmic genome has largely been due to its clonal inheritance(in Man) allowing the tracing of a direct genetic line. In addition, a comparatively highrate of nucleotide substitution facilitates phylogenetic resolution among relativelyclosely related individuals of the same species.In this thesis, a statistically supported phylogeny based on complete mitochondrialgenome sequences is presented which, for the first time, unambiguously places the rootof modern human mitochondrial lineages in Africa in the last 200 thousand years. Thisconclusion provides strong support for the “recent African origin” hypothesis. Also, thecomplete genome data underline the problematic nature of traditional approaches toanalyses of mitochondrial phylogenies.The dispersal of anatomically modern humans from the African continent is examinedthrough single nucleotide polymorphism (SNP) and sequence data. These data imply anexpansion from Africa about 57 thousand years ago and a subsequent populationdispersal into Asia. The dispersal coincides with a major population division that may bethe result of multiple migratory routes to East Asia.Also investigated is the question of a common origin for the indigenous peoples ofAustralia and New Guinea. Previous studies have been equivocal on this question withsome presenting evidence for a common genetic origin and other proposing separatehistories. Our data reveal an ancient genetic link between Australian Aborigines and thepeoples of the New Guinea highlands.
Key words: mitochondria, hominidae, population genetics, human evolution.
Max Ingman, Department of Genetics and Pathology, Section of Medical Genetics,Rudbeck Laboratory, SE-751 85 Uppsala, Sweden
Max Ingman 2003
ISSN 0282-7476ISBN 91-554-5738-X
Printed in Sweden by Eklundshofs Grafiska AB, Uppsala, 2003
ii
MAIN REFERENCES
This thesis is based on the following papers:
I. Ingman, M., Kaessmann, H., Pääbo, S. and Gyllensten, U. Mitochondrialgenome variation and the origin of modern humans. Nature 408: 708-713 (2000).
II. Ingman, M. and Gyllensten, U. Analysis of the complete mtDNA genome:methodology and inferences for human evolution. J Hered 92: 454-461 (2001).
III. Ingman, M. and Gyllensten, U. Mitochondrial Genome Variation andEvolutionary History of Australian and New Guinean Aborigines. Gen Res 13:1600-1606 (2003).
IV. Ingman, M. and Gyllensten, U. Mitochondrial haplotype distribution and ancienthuman migrations. In preparation.
These papers are reproduced in the appendices at the back of this thesis.Reprints were made with permission from the publishers.

iii

iv
ABBREVIATIONS
bp base pairsCI confidence intervalD-loop displacement loop (mitochondrial control region)DNA deoxyribonucleic acidkb kilobase (thousand base pairs)kya thousand years agoMb megabase (million base pairs)MRCA most recent common ancestormtDNA mitochondrial DNAMya million years agoNRY non-recombining region of the Y chromosomePCR polymerase chain reactionRFLP restriction fragment length polymorphismRNA ribonucleic acidrRNA ribosomal RNASNP single nucleotide polymorphismTMRCA time to most recent common ancestortRNA transfer RNAUEP unique event polymorphism

v

vi
CONTENTS
ABSTRACT
MAIN REFERENCES
ABBREVIATIONS
CONTENTS
INTRODUCTION
BackgroundAnthropologyEarly molecular studies
Molecular Population GeneticsNeutral theory of molecular evolutionSources of genetic variationEstimation of genetic distanceNucleotide substitution ratePhylogenetic reconstructionPopulation size
MITOCHONDRIA AND HUMAN EVOLUTION
BackgroundWhat are mitochondria?Why use mitochondria?Mitochondrial evolutionRecombination in mitochondriaNatural selection
Inferences on Human EvolutionRFLPD-loop sequencingWhat about the Y?Out of Africa
i
ii
iv
vi
1
112
3366
101114
17
171718191919
2020212122

vii
THESIS WORK
Paper I – African origin and “mitochondrial Eve”Paper II – Heteroplasmy and selection in mtDNAPaper III – Evolutionary history of Aboriginal AustraliansPaper IV – Ancient human migrations
Concluding Remarks
ACKNOWLEDGEMENTS
REFERENCES
APPENDICES
Appendix 1 – Paper IAppendix 2 – Paper IIAppendix 3 – Paper IIIAppendix 4 – Paper IV
24
24262830
32
34
35

viii

ix
It has been confidently asserted that man’s origin cannever be known: but ignorance more frequentlybegets confidence than does knowledge: it is thosewho know little, and not those who know much, whoso positively assert that this problem or that problemwill never be solved by science.
Charles DarwinThe Descent of Man
1871

1
INTRODUCTION
Background
AnthropologyAnthropology is defined as “the study of the human race, its culture, society andphysical development”. Both cultural and physical anthropology have provided a widerange of starting points for genetic studies of human evolution and migration. Theseinclude not only specific data on the cultural and physical history of particular humanpopulations, but also help in understanding general concepts relating to the evolutionand spread humans and proto-humans. For example, the biological and behaviouraladvances that allowed Homo ergaster to become the first hominid species to coloniseall of Africa and ultimately exit Africa altogether. Figure 1 represents two possiblescenarios for the evolution of modern humans based on fossil finds. Both parts of thisfigure show an origin of Homo sapiens in Africa in the last 200 thousand years andsubsequent dispersal across the world. An alternative to this view is that modernhumans evolved in parallel from Homo erectus in multiple locations in both Africa andAsia. Proponents of this “multiregional” view maintain that the similarities seenbetween extant modern humans from different regions are the result of admixturebetween populations.
Figure 1. Geographical and temporal distribution of hominid populations, based on fossilfinds, using different taxonomic schemes. Scenario a) reflects the view that bothNeanderthals and modern humans derived from a widespread ancestral species calledHomo heidelgergensis. Scenario b) represents the alternative stance that Neanderthals havedeep roots in Europe and might extend back over 400 kya and that the ancestor of modernhumans was a separate African species called Homo rhodesiensis (redrawn after Stringer2003).

2
In recent years, paleoanthropologists have discovered human fossils antedating 4million years ago that show the ape origins of the human family ever more clearly andhave discovered archaeological sites that imply a complex history of branching eventswithin the genus Homo. Of key importance to genetic data, is the discovery of a fossilof the oldest known hominid (australopithecines) in Africa in 1924 (Dart 1925). Sincethen, more of these fossils have been uncovered but knowledge about theaustralopithecines remains sparse. Of particular interest is that they lived between 5and 1.2 million years ago and had a morphology that was intermediate between apesand humans. These fossils place the timeframe for the spilt between apes(chimpanzees) and humans at 5 to 7 million years ago (Klein 1999).Emerging theories on the route and timeframe for a modern human exodus fromAfrica are based on physical evidence such as the discoveries of artefacts which implythe human colonisation of Ethiopia in East Africa at least 125 kya (Walter et al 2000).These coastal people probably took advantage of marine food resources, whichsuggests a major change in the human ability to adapt to local environments. Thiswould also have equipped early Homo sapiens with the necessary technology to enablethem to migrate from Africa following a coastal route, and eventually adapt their toolsand society to enable them to exploit new environments (Stringer 2000). This modelhas a particular impact on early migration to Australia. The discovery of burial sites atLake Mungo, variously estimated to be 40-50 kya (Bowler et al 2003) and 62 kya(Thorne et al 1999) corroborates the assertion that Australia has been colonised for atleast 50 thousand years (Roberts et al 1990). Since there were no land bridges fromSouth East Asia to Australia, colonisation must have required the use of boats to crossstretches of open sea of up to 100 km wide, implying the expertise of a coastalcommunity.
Early molecular studiesFrom the time of Charles Darwin, it has been the dream of many biologists toreconstruct the evolutionary history of all organisms on Earth and express it in theform of a phylogenetic tree. Lacking a complete fossil record, many investigators haveemployed the methods of comparative morphology and comparative physiology.However, the evolutionary change of morphological and physiological characters iscomplex and somewhat subjective so phylogenetic trees reconstructed from these datahave often been controversial. Advances in molecular biology changed this situationand have allowed scientists to study the genetic variation between species.Prior to the advent of methods for rapid DNA sequencing in 1977 (Maxam and Gilbert1977; Sanger et al 1977), most studies of molecular evolution were conducted usingamino acid sequence data. Although amino acid sequencing was time consuming anderror prone, some important principles of molecular evolution, such as geneduplication and the molecular clock, were discovered. Currently, most molecularstudies employ DNA sequencing and, if an amino acid sequence is required, it can bededuced from the DNA sequence.The first attempt at reconstructing human evolution on the basis of genetic data fromliving populations was undertaken in 1964 (Cavalli-Sforza and Edwards 1964). This

3
study presented genetic distances between pairs of selected populations for as manygenes as knowledge at the time permitted. During the 1970s more genes were addedand HLA data were used to confirm the results of the first investigation (Piazza et al1975).The first DNA polymorphisms studied in humans for evolutionary purposes were frommitochondrial DNA (mtDNA). In this study, Brown (1980) proposed the existence ofpopulation specific patterns of restriction enzyme cleavage and, using an estimatedmitochondrial substitution rate (Brown et al 1979), suggested that the observedamount of sequence heterogeneity could have been generated from a smallmitochondrially monomorphic population that existed about 180 thousand years ago.A groundbreaking study in 1987 extended on this proposal. Cann et al (1987)presented genetic evidence that the last shared ancestor of all contemporary humansexisted in Africa no more than 200 thousand years ago. This lead to the suggestion thata woman existed in Africa about 200 thousand years ago who was the ancestor of allextant humans (“mitochondrial Eve”). This is a misnomer as there is no evidence thatthe human population went through a bottleneck that reduced its number to one (or afew) women. This study has been criticised for a lack of statistical support for the treetopology and for an incorrectly applied statistical analysis (Templeton 1992; Nei1992). Remedial analyses produced many tree topologies, some with an African rootand some rooted elsewhere (Hedges et al 1992). Lacking sufficiently strong empiricaldata, it is impossible to confidently place the root of modern human mtDNA lineagesin sub-Saharan Africa.
Molecular Population Genetics
Neutral theory of molecular evolutionUp until the 1960s, it was believed that natural selection was the primary driving forceof molecular evolution.
The consensus is that completely neutral genes or alleles must be very rareif they exist at all. To an evolutionary biologist, it therefore seems highlyimprobable that proteins, supposedly fully determined by genes, shouldhave nonfunctional parts, that dormant genes should exist over periods ofgenerations, or that molecules should change in a regular but nonadaptiveway ... [natural selection] is the composer of the genetic message and DNA,RNA, enzymes, and other molecules in the system are successively itsmessengers.(Simpson 1965)
There were two schools of thought at this time. The “Classical School” maintainedthat polymorphism was relatively rare and that evolution consisted mainly of mutation.Mutations were thought to be mostly deleterious and quickly lost through purifyingselection but, if advantageous, the effect of positive selection would lead to fixation ofthe new allele in the population. The “Balance School” was lead by a few people suchas Dobzhansky who contested that polymorphisms were quite common and important

4
in evolution. They believed and showed that morphological and chromosomalpolymorphisms were retained because of heterozygous advantage or other forms ofbalancing selection. When scientists began to measure directly, they were surprised tofind large amounts of genetic variation in natural populations, which was at odds withthe expectation under the selectionist (or classical) view.In 1968, Motoo Kimura suggested that most of the polymorphisms observed at themolecular level are selectively neutral, so that their dynamics in a population aredetermined by genetic drift (Kimura 1968). This would apply to most nucleotide oramino acid substitutions that occur within a molecule within the course of evolution.The neutral theory models the fate of mutations that are so nearly selectively neutralthat their destiny is determined mainly through random genetic drift. If a population ofsize N contains a neutral mutation with allele frequency p0, then the probability thatthe mutation reaches fixation in that population equals p0. A new mutation willoriginally exist as a single copy so the initial allele frequency will be p0 = 1/(2N). Thisis also the probability of eventual fixation of the allele. Therefore, where thepopulation size is small, the new allele will have a greater chance of reaching fixation.The rate at which new mutations are fixed in the population equals µ, where µ is theneutral mutation rate. The rate of fixation depends only on mutation rate and not onpopulation size as it is determined by the product of the probability of fixation of anew neutral mutation and the average number of new mutations in each generation(2Nµ),
1 2 2/( ) ( )N N× =µ µ .
If the rate of fixation is µ per unit time, then the average length of time betweensubstitutions will be 1/µ. Therefore, a higher mutation rate will decrease the timeinterval between fixations. The mutation rate of mammalian mitochondrial DNA isabout 5 to 10 times higher than in the nuclear genome (Brown et al 1979; Brown et al1982) and consequently, the time between fixations of new neutral mutations will beshorter.For each new neutral mutation that is fixed, the average time taken to reach fixation is4Ne generations (where Ne is the effective population size). This means that in a smallpopulation, not only will there be a higher chance of fixation, but it will also occurmore quickly than in a larger population. Since mitochondria are haploid and areuniparentally inherited, their population size is a quarter of that of the autosomes sothe chance of fixation of a new neutral mutation will not only be higher but it willproceed to fixation more quickly.If the probability of fixation of a neutral allele by drift, 1/(2N), is greater than selectionpressure, then drift will outweigh selection. Therefore, regions of the genome that areless constrained by selection should have a higher rate of sequence evolution. In mostcases this is true as synonymous substitutions generally occur in a population muchmore frequently than nonsynonymous substitutions. This means that the majority ofsequence evolution is through mutational changes that have little or no effect onphenotype or fitness.
5
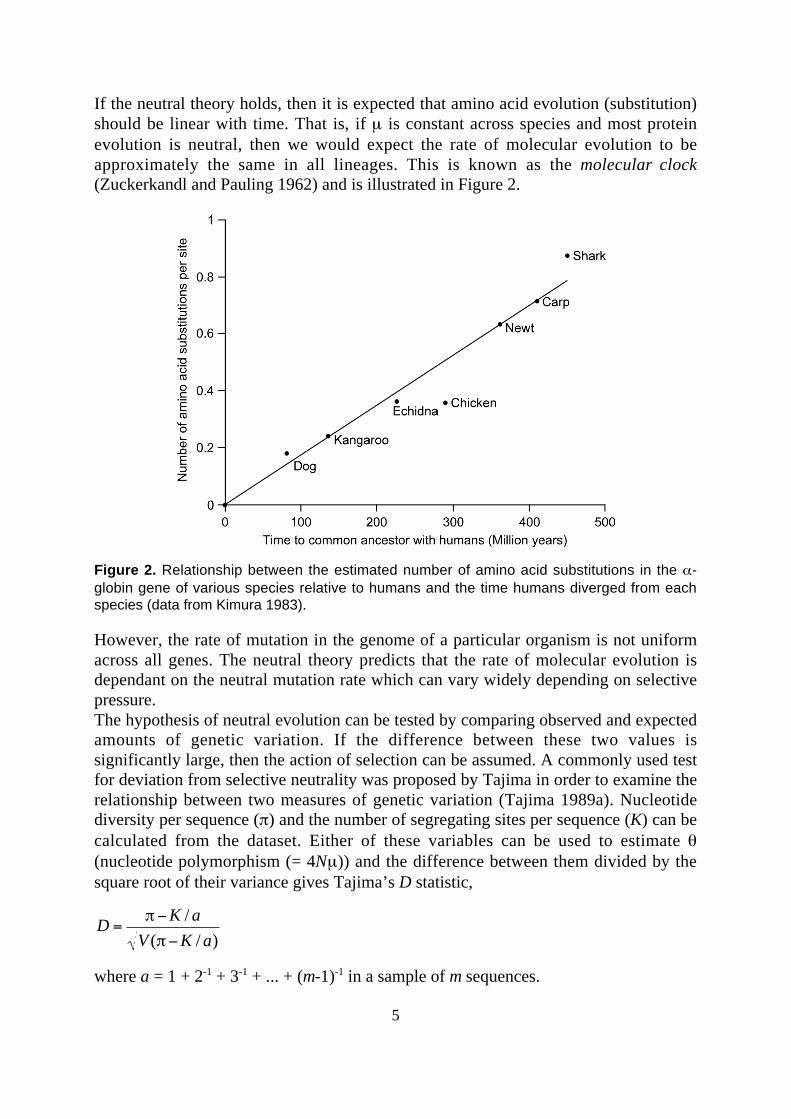
If the neutral theory holds, then it is expected that amino acid evolution (substitution)should be linear with time. That is, if µ is constant across species and most proteinevolution is neutral, then we would expect the rate of molecular evolution to beapproximately the same in all lineages. This is known as the molecular clock(Zuckerkandl and Pauling 1962) and is illustrated in Figure 2.
Figure 2. Relationship between the estimated number of amino acid substitutions in the α-globin gene of various species relative to humans and the time humans diverged from eachspecies (data from Kimura 1983).
However, the rate of mutation in the genome of a particular organism is not uniformacross all genes. The neutral theory predicts that the rate of molecular evolution isdependant on the neutral mutation rate which can vary widely depending on selectivepressure.The hypothesis of neutral evolution can be tested by comparing observed and expectedamounts of genetic variation. If the difference between these two values issignificantly large, then the action of selection can be assumed. A commonly used testfor deviation from selective neutrality was proposed by Tajima in order to examine therelationship between two measures of genetic variation (Tajima 1989a). Nucleotidediversity per sequence (π) and the number of segregating sites per sequence (K) can becalculated from the dataset. Either of these variables can be used to estimate θ(nucleotide polymorphism (= 4Nµ)) and the difference between them divided by thesquare root of their variance gives Tajima’s D statistic,
DK a
V K a=
−
−
π
π
/
( / )
where a = 1 + 2-1 + 3-1 + ... + (m-1)-1 in a sample of m sequences.

6
Since K ignores the frequency of variants, it is strongly affected by the existence oflow frequency deleterious alleles. In contrast, π is dependent on the frequencies ofvariants and is therefore not particularly affected by the presence of deleterious allelessince they have only a small overall contribution compared to higher frequency neutralalleles. If the alleles in the sample are selectively neutral and the population is inmutation-drift equilibrium, then these two estimations will not be significantlydifferent and D will be close to zero. Under purifying selection, θ estimated from Kwill be inflated whereas θ estimated from π will not be affected and a negative D valuewill result. If the region is under positive selection, the converse will be evident.However, if the population passes through a bottleneck, D may become significantlynegative as nucleotide diversity is more strongly affected relative to the number ofsegregating sites (Tajima 1989b). This is because many variants with low frequencymight still be observed in the population. Also, if a population experiences rapidexpansion, a significantly negative D value can result due to an increase in the numberof segregating sites with little increase in nucleotide diversity. In addition,significantly negative D values can result from a range expansion where there is a highrate of emigration between demes (Ray et al 2003). Although this test should not beused indiscriminately, it can be useful for inferring something about a population’shistory.
Sources of genetic variationThe processes that produce genetic variation in mitochondrial DNA (mtDNA) aresomewhat more limited than those that affect nuclear DNA. For example,recombination mixes paternal and maternal nuclear DNA into the chromosomes oftheir progeny. All nuclear chromosomes experience this effect to some degree with theexception of the majority of the Y chromosome which is inherited only from thefather†. Mitochondria have also been shown to be inherited uniparentally but from thematernal line (Giles et al 1980).Mutation is the single most important factor in producing genetic variation in mtDNA.There are three basic types of mutational changes: substitution of one nucleotide foranother nucleotide, deletion of one or more nucleotides, and insertion of one or morenucleotides. If insertions or deletions occur in a protein-coding region, they arereferred to as frameshift mutations since they alter the reading frame downstream ofthe mutation (unless 3x nucleotides are inserted/deleted). Nucleotide substitution is theprimary source of mitochondrial polymorphism that is employed in studying geneticrelationships between individuals and can be subdivided into two classes: transitionsand transversions. A transition is the substitution of a purine (adenine or guanine) foranother purine or a pyrimidine (thymine or cytosine) for another pyrimidine.Substitution of a purine for a pyrimidine or vice versa is referred to as a transversion.If the substitution occurs in a protein-coding region then it can be eithernonsynonymous or synonymous. Nonsynonymous or replacement substitutions arethose that result in an amino acid replacement at that codon (a triplet of three bases † the non-recombining region of the human Y chromosome (NRY) comprises 95% of the chromosomeand does not undergo sexual recombination.

7
that codes for an amino acid). Synonymous or silent substitutions do not result in anamino acid change. This is due to codon degeneracy which relates to the fact that thereare 61 possible sense codons (a codon that doesn’t result in protein translationtermination) that code for only 20 amino acids. This means that different combinationsof 3 nucleotides can code for the same amino acid so a nucleotide substitution will notnecessarily result in an amino acid substitution. In addition, there are nonsensemutations which are nonsynonymous mutations that result in a stop codon, terminatingprotein translation. A comparison of the number of synonymous substitutions per site(ks) with the number of nonsynonymous substitutions per site (ka) conveysinformation regarding the type of selection that could be acting on a sequence. In thepresence of selection that is preserving the integrity of the gene product throughfunctional constraints (purifying selection), ks is expected to be significantly largerthan ka. Often this is represented as a ratio of ka/ks where a value of less than 1indicates the action of purifying selection.
Estimation of genetic distanceAlthough nucleotide substitutions may accumulate in a genome at a regular rate, formost organisms the rate is too slow to measure within an individual. For this reason,nucleotide substitutions are usually detected by comparing sequences that havederived from a common ancestral sequence. The descendant sequences graduallydiverge by nucleotide substitution. Analysis of the number of differences that haveaccrued between the sequences is the basis for the reconstruction of phylogenetic treesand allows the rate of substitution to be calculated. However, estimation of the numberof nucleotide substitutions between a pair of sequences is rarely a straightforward task.The simplest measure of sequence divergence is referred to as the p distance and iscalculated by dividing the number of observed substitutions between a pair of alignedsequences ( K̂ ) by the number of nucleotide sites examined (the sequence length). Thismeasure gives the number of nucleotide substitutions per site assuming that every sitein the sequence is equally likely to undergo substitution and be replaced by any othernucleotide. As discussed earlier, there are two classes of substitution: transitions andtransversions. In most DNA sequences, transitions occur much more frequently thantransversions so it becomes necessary to introduce an extra parameter to account forthis. The ratio of transitions to transversions is about 0.5 to 2 in nuclear genes but canbe as high as 25 in mitochondrial DNA (Excoffier and Yang 1999). In addition, if thevalue for p is very high, there is a likelihood that the same site may have undergonesubstitution more than once (multiple substitution). If this occurs in a single lineage itis referred to as a back mutation since the most likely outcome is that the site will bereturned to its original state (eg. A→G then G→A at the same site). Anotherconfounding factor coupled to a high p value is parallel substitution where the samesite undergoes the same nucleotide substitution in multiple lineages independently. Ineither case, two substitutions have occurred but neither will be observed in a pairwisecomparison. Both of these situations will lead to underestimation of the geneticdistance between the sequences and will affect the calculation of the time at whichthey diverged. In a sample of 53 mitochondrial control region sequences, it was found

8
that some sites had undergone parallel substitution in up to ten separate lineages(Ingman and Gyllensten 2001). This means that at some loci, a large percentage ofsequences share polymorphisms by chance rather than by descent.The problem of multiple substitutions is illustrated in Figure 3. While the substitutionrate has remained relatively constant, the accumulation of substitutional changes overtime between these species is not linear. In fact, the rate of accumulation of pairwisesynonymous substitutions ranges from 17 per million years in species that diverged 2million years ago to 4.5 per million years in species that diverged 20 million years ago(Janecek et al 1996). This is due to a saturation of mutations, making multiplesubstitutions more common. In agreement with the molecular clock hypothesisrepresented in Figure 2, the rate of accumulation of nonsynonymous substitutions (andtherefore amino acid replacements) remained fairly constant.
Figure 3. Total nucleotide substitutions between pairs of mitochondrial cytochrome c oxidasesubunit II gene (684 bp) from various bovid taxa versus time since divergence (from Janeceket al 1996).
Of course, this is an extreme example and, because there is considerably less timedepth, the problem is not so pronounced amongst human mitochondrial DNAs.Nevertheless, due to these complications, it is necessary to use a mathematical modelto estimate the number of nucleotide substitutions between pairs of sequences.

9
Figure 4. Estimates of the number of nucleotide substitutions obtained by different distancemeasures (Tamura 1992; Kimura 1980; Jukes and Cantor 1969) when actual nucleotidesubstitution follows the Tamura-Nei model (Tamura and Nei 1993). The higher thecomplexity of the model, the more accurately it tracks the actual distribution as the number ofnucleotide substitutions increases (from Nei and Kumar 2000).
These models vary in their complexity and their estimates diverge dramatically as pincreases. As Figure 4 shows, more complex models perform better when p is largeand certainly all models outperform the p distance. More complex models typicallyallow for extra parameters such as unequal nucleotide frequencies, unequal transitionaland transversional substitution rates and transition/transversion ratio. Unfortunately,increasing the complexity of the model also increases the variance that the modelproduces. This means that the choice of model should be dependent on the dataset towhich it is to be applied. Therefore, when p is small a simple model is best and itbecomes necessary to employ successively more complex models as p increases.These calculations of genetic distance assume that the rate of nucleotide substitution isuniform across all sites in the sequence. This is rarely the case and the rate is known tovary widely between coding and non-coding regions as well as at different codonpositions within coding regions. Adding to this increasingly complicated picture is thepresence of “hotspots” and “coldspots” for mutation. These are sites that areundergoing substitution at a rate that is much higher or much lower than thesurrounding sites. Since the hotspot sites have a much higher mutation rate, it is morelikely that they will have undergone a parallel or back mutation. The substitution ratesin the human mitochondrial D-loop are known to be highly heterogenous (Maddison et
10
al 1992; Tamura and Nei 1993; Wakeley 1993) and can vary by as much as a factor of6 between adjacent sites (Meyer et al 1999). Some of these substitution models canaccept an extra parameter, gamma, which allows each site to be binned into a ratecategory for more accurate estimation of genetic distance in regions with extreme rateheterogeneity.
Nucleotide substitution rateInitially, the neutral theory of molecular evolution was based on observations of therate of amino acid replacement in proteins. The rate of substitution in nucleotidesequences can be analysed in much the same manner as amino acid sequences and is abasic quantity in the study of molecular evolution. Comparisons of substitution ratesbetween genes and among different regions of a gene can assist in understanding themechanism of nucleotide substitution in evolution. Nucleotide substitution rate canalso be used to date evolutionary events such as species divergence or the time sincemembers of the same species shared a common ancestor. In these instances, theassumption of a molecular clock is of utmost importance.The rate of nucleotide substitution can be defined as the number of substitutions persite per year. Given the genetic distance (K) between two homologous DNA sequencesand the time that has elapsed since divergence (T), the rate of divergence (r) of the twosequences can be easily calculated,
rK
T=
2.
The reason the genetic distance is halved is because nucleotide substitutions haveoccurred on both lineages independently since their divergence and it is assumed thatthe substitutions that have occurred on each lineage will be half this value. Eventhough genetic divergence typically precedes population divergence, the divergencetime for the two sequences is often assumed to be the same as the time of divergenceof the two species inferred from palaeontological data.When the genetic distance between sequences is small, long sequences are required inorder to minimise stochastic error. If the time since divergence of the two sequences issmall, then a slight error in estimation of T can lead to a substantial error in the rate ofsubstitution. Due to this, it is necessary to estimate substitution rates with sequencesthat are not closely related. However, as discussed previously, it is difficult to estimategenetic distance when the divergence occurred a very long time ago due to the effectof multiple substitutions. Deciding on the optimal species for this comparison becomesof high importance but the choice is often made on the basis of what palaeontologicaldata are available. For example, the closest living relatives to humans are chimpanzees(Saitou and Nei 1986) and paleoanthropologists have dated their divergence on thebasis of a restricted number of australopithecine fossils at 5 to 7 million years ago(Klein 1999). It is this estimate, along with the average genetic distance betweenhumans and a chimpanzee sequence that is commonly used to estimate substitutionrates for various human genes. Of course, the substitution rate will vary depending onthe time that is used for the species split and depending on the problems in estimating
11
genetic divergence described in the preceding section. In addition, it is necessary toassume that both species have the same neutral mutation rate or the substitution rateestimate will fall midway between the rates for the two species. This situation canarise if the two species have, for example, different generation times.Another confounding factor in the estimation of nucleotide substitution rates is rateheterogeneity. This refers to the situation where the rate of substitution is not uniformalong the length of the sequence. Failure to take rate variation among sites intoaccount can lead to a severe underestimation of the amount of sequence divergence.However, it is possible to roughly verify estimates of substitution rates directly usingdata from mutations in pedigrees. This has been calculated for mitochondrial DNA andthe results affirm that the substitution rate that has been derived from phylogeneticstudies is at least approximately correct (Parsons et al 1997; Sigur› ardóttir et al 2000).
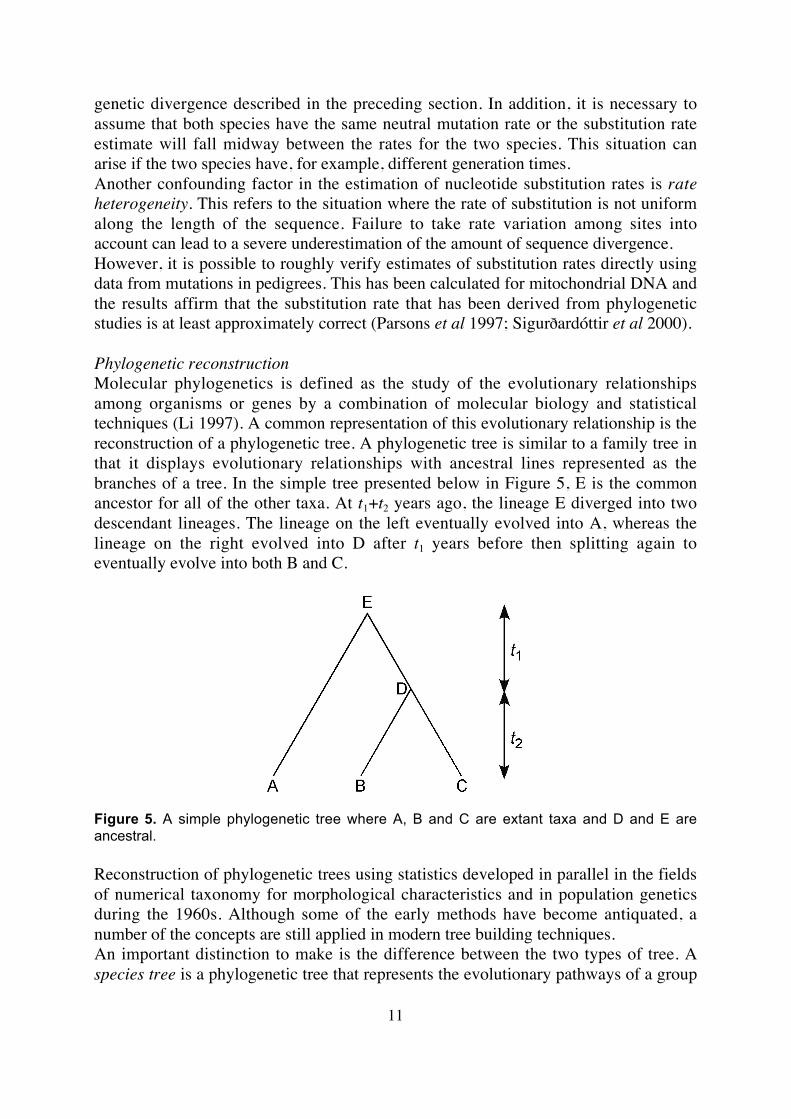
Phylogenetic reconstructionMolecular phylogenetics is defined as the study of the evolutionary relationshipsamong organisms or genes by a combination of molecular biology and statisticaltechniques (Li 1997). A common representation of this evolutionary relationship is thereconstruction of a phylogenetic tree. A phylogenetic tree is similar to a family tree inthat it displays evolutionary relationships with ancestral lines represented as thebranches of a tree. In the simple tree presented below in Figure 5, E is the commonancestor for all of the other taxa. At t1+t2 years ago, the lineage E diverged into twodescendant lineages. The lineage on the left eventually evolved into A, whereas thelineage on the right evolved into D after t1 years before then splitting again toeventually evolve into both B and C.
Figure 5. A simple phylogenetic tree where A, B and C are extant taxa and D and E areancestral.
Reconstruction of phylogenetic trees using statistics developed in parallel in the fieldsof numerical taxonomy for morphological characteristics and in population geneticsduring the 1960s. Although some of the early methods have become antiquated, anumber of the concepts are still applied in modern tree building techniques.An important distinction to make is the difference between the two types of tree. Aspecies tree is a phylogenetic tree that represents the evolutionary pathways of a group

12
of species whereas a gene tree is reconstructed from a gene from each species or agene each from several members of the same species. One of the main differencesbetween the two is illustrated below in Figure 6. Since genetic divergence willnormally precede population divergence, dates based on a gene tree will usuallypredate than those based on a species tree by an amount that reflects the level ofpolymorphism in the ancestral species (Takahata and Nei 1985). In the presence ofpolymorphism, it becomes necessary to reconstruct a tree based on sequence data frommultiple independent loci (Saitou and Nei 1986). When more than two genes aresampled from each population, it is possible to make a correction for the effect ofancestral polymorphism. The number of nucleotide substitutions (net substitutions), d,that have occurred since population splitting can be estimated by subtracting thenumber of within-population differences (Nei and Li 1979).
Figure 6. Diagram showing the time of gene splitting (gs) is usually earlier than the time ofpopulation splitting (ps) when polymorphism exists (from Takahata and Nei 1985).
Secondly, the pathway of genetic divergence is not always the same as that for speciesdivergence. That is, the topology of the two trees can be considerably different. In thethree examples in Figure 7, all of the species trees are the same but the gene treesshow different topologies (A and B versus C) and different genetic time depth (Aversus B and C). This is because nucleotide and amino acid substitutions occurstochastically so to avoid topological errors, it is necessary to examine a large numberof nucleotides or amino acids. Ideally, a gene tree should contain sequence data fromseveral independent loci since a tree reconstructed from a single gene may still differfrom the species tree even if a large number of nucleotides are used (Saitou and Nei1986).

13
Figure 7. Three possible relationships between species trees and gene trees for the case ofthree species in the presence of polymorphism. The times of the first and second splitting aret0 and t1, respectively (from Nei 1987).
Because many amino acid substitutions won’t cause a phenotypic change, moleculardata offer more information for evolutionary studies than morphological orphysiological data and, since many nucleotide substitutions won’t cause an amino acidchange, nucleotide data contain more information that protein data. Since nucleotidesubstitutions occur randomly, to minimise stochastic errors long DNA sequences arerequired.Part of the problem of inferring the correct branching topology is that the number ofpossible bifurcating trees increases very rapidly as additional taxa are added. Forexample, for five taxa there are 105 possible trees and for ten taxa there are34,459,425. Clearly, computers have made this task easier but even the fastestcomputer could not examine every topology for a dataset of more than thirty taxa.Because of this, many tree building algorithms try to eliminate classes of trees that aredependent on each other based on the observed data. There are three main groups ofmethods that are commonly used for the reconstruction of phylogenetic trees usingnucleotide data: distance, maximum parsimony and maximum likelihood methods.Estimation of branch lengths is relatively easy compared to the problems faced withattempting to reconstruct the topology of the true tree from a dataset of aligned DNAsequences and each of these groups of methods uses a different basic principle toattempt this. Distance methods use estimates of genetic distance between all pairs ofsequences in the dataset and the tree is reconstructed using an algorithm based onfunctional relationships among the distance values. Maximum parsimony is concernedwith finding the best tree, which is the tree with the shortest evolutionary pathway tovariant sites that are shared by two or more sequences (parsimony informative sites).Maximum likelihood methods calculate the likelihood of the dataset being derivedfrom each possible tree and choses the highest value as the best tree.Homoplasy is when two or more sequences in a dataset have the same variant at thesame site through parallel mutation. When this occurs in a dataset, the reliability of a

14
reconstructed tree declines (Saitou and Nei 1986). Parsimony methods are moresensitive to homoplasy since they are only utilising shared variant sites and attemptingto explain the distribution of these in the simplest possible manner. While bothparsimony and likelihood methods will often produce more than one best tree(sometimes thousands with the same tree score), the distance method will produce justone. It should be remembered that this one tree is still just an estimation of the truetree and statistical tests are required to analyse the stability of the topology.Nevertheless, distance methods have become commonly used for phylogeneticreconstruction from nucleotide data, particularly in human population genetics. Themost common tree building algorithms that employ distance matrices are UPGMA(Sokal and Michener 1958) and Neighbor-Joining (Saitou and Nei 1987).
Population sizeIn a natural population, population size is not constant over time and it is unlikely thatall individuals contribute gametes to the next generation with equal probability. Theeffective population size (Ne) of an actual population is defined as the number ofindividuals in a theoretically ideal population having the same magnitude of randomgenetic drift as the actual population. Wright (1931) first calculated the effectivepopulation size by considering the effective degree of inbreeding in various situationsand this is the concept that is currently most commonly used. Simply, effectivepopulation size is just the number of individuals in a population that can contributegenetically to the next generation at any one time. In general, Ne is considerablysmaller than the actual population size (N). This is largely due to the incidence ofoverlapping generations where at any one time, a population will contain individualsin pre-reproductive, reproductive and post-reproductive stages. Another importantcontributing factor is differential male and female reproductive probability due topolygamy (polyandry or polygyny) or uneven numbers of the sexes. Also, in humansonly a male can pass on a Y chromosome and only a female can contribute amitochondrion so the Ne for these loci will be the effective population size of malesand of females, respectively.As mentioned above, population size will rarely remain constant but will generallyfluctuate over time and therefore the effective population size will also fluctuate. Apopulation bottleneck is indicated by a dramatic decrease in population size and resultsin marked loss of heterozygosity and nucleotide diversity, and increased levels oflinkage disequilibrium. This often occurs when a small group of emigrants leaves apopulation and founds a new subpopulation. Because of the small size, random geneticdrift will have a strong influence in this new population and this is referred to asfounder effect. Bottlenecks followed by founder effects in human populations couldcontribute to regional differentiation in morphology and the high incidence of anotherwise rare genetic disease in a population.As noted previously, a bottleneck can be detected by tests of selective neutrality. Thisis indicated by a significantly negative Tajima’s D statistic due to a reduction innucleotide diversity relative to the number of segregating sites. A rapid increase inpopulation size can also be detected in this way due to an increase in the number of
15
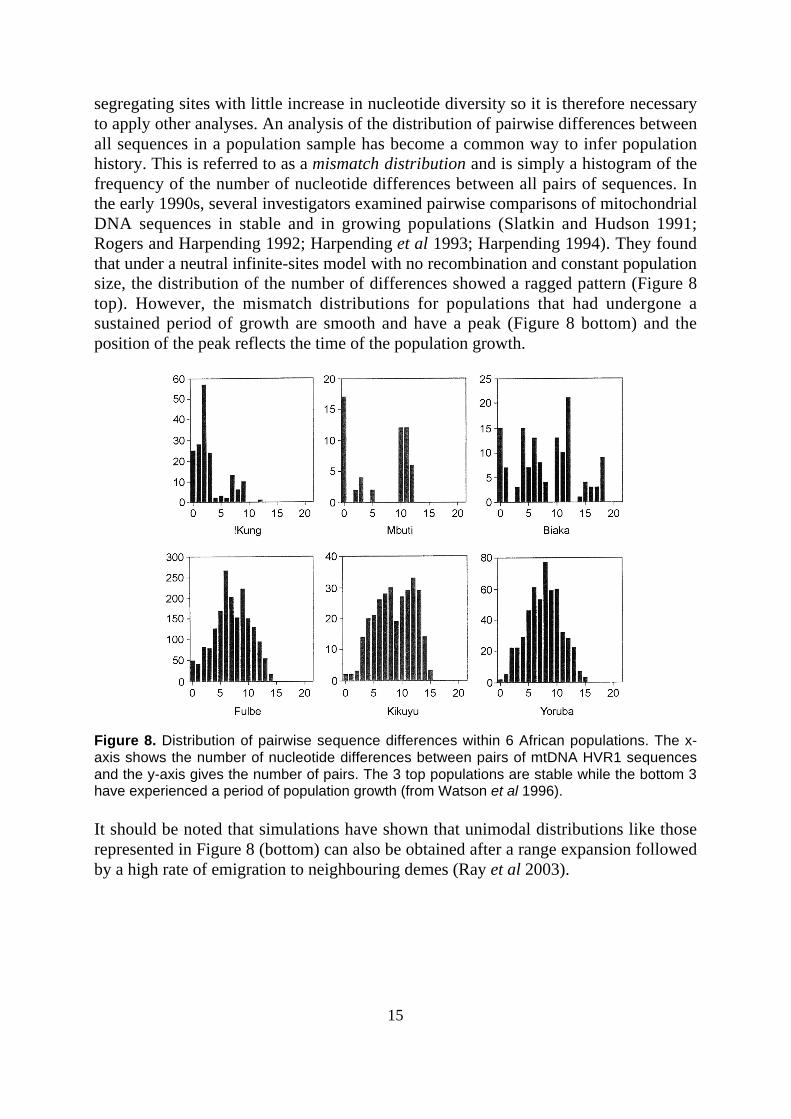
segregating sites with little increase in nucleotide diversity so it is therefore necessaryto apply other analyses. An analysis of the distribution of pairwise differences betweenall sequences in a population sample has become a common way to infer populationhistory. This is referred to as a mismatch distribution and is simply a histogram of thefrequency of the number of nucleotide differences between all pairs of sequences. Inthe early 1990s, several investigators examined pairwise comparisons of mitochondrialDNA sequences in stable and in growing populations (Slatkin and Hudson 1991;Rogers and Harpending 1992; Harpending et al 1993; Harpending 1994). They foundthat under a neutral infinite-sites model with no recombination and constant populationsize, the distribution of the number of differences showed a ragged pattern (Figure 8top). However, the mismatch distributions for populations that had undergone asustained period of growth are smooth and have a peak (Figure 8 bottom) and theposition of the peak reflects the time of the population growth.
Figure 8. Distribution of pairwise sequence differences within 6 African populations. The x-axis shows the number of nucleotide differences between pairs of mtDNA HVR1 sequencesand the y-axis gives the number of pairs. The 3 top populations are stable while the bottom 3have experienced a period of population growth (from Watson et al 1996).
It should be noted that simulations have shown that unimodal distributions like thoserepresented in Figure 8 (bottom) can also be obtained after a range expansion followedby a high rate of emigration to neighbouring demes (Ray et al 2003).

16
From the pairwise mismatch distributions in Figure 8, stark differences in populationhistory are seen among hunter-gatherer populations like !Kung, Mbuti pygmies andBiaka pygmies, when compared to other African populations that experienced a periodof rapid expansion due to a transition to agricultural economies. If the substitution rateis known for the sequences to be compared, then the time to the modal number ofdifferences can easily be calculated. This peak would correspond to the period ofhighest population growth.A common method of calculating the time to when this population expansion peakoccurred is from an estimate of the parameter Tau (τ). Tau is described as the time thathas passed since the population growth or decline measured in units of mutationaltime,
τ = 2µt
where µ is the substitution rate (per sequence per generation) and t is the number ofgenerations (Rogers and Harpending 1992). Tau can be estimated from the dataset andwhen the substitution rate for the DNA sequence is known, the time since thepopulation growth or decline can be calculated.

17
MITOCHONDRIA AND HUMAN EVOLUTION
Background
What are mitochondria?Mitochondria are organelles that exist in the cytoplasm, outside the cell nucleus, andare therefore completely separate from the nuclear DNA. Each cell in the bodycontains 10 to 100 mitochondrial compartments with each of these housing between 0and 11 copies of the mitochondrial genome (Cavelier et al 2000). Even though thereare a large number of copies per cell, the presence of mitochondrial copies differing byone or more nucleotide substitutions in the same individual (heteroplasmy) is notcommon. Mitochondria function in the cell as a centre for oxidative phosphorylation(OXPHOS) which is the pathway that produces adenosine triphosphate (ATP), whichis used as cellular energy for work and body temperature maintenance.The mitochondrial genome is circular and consists of approximately 16500 base pairs(bp) of double stranded DNA encoding 13 polypeptides, as well as the 22 transferRNA (tRNA) genes and 2 ribosomal RNA (rRNA) genes necessary for thetranscription and translation of the genome (Figure 9). The control region, oftenreferred to as the D-loop (Displacement loop), is about 1,100 bp long (about 7% of thegenome) and contains the origin of replication as well as various control elements.Animal mitochondria also contain several hundred enzymes that are used in metabolicfunctions but these are encoded by nuclear genes and transported to the mitochondria.
Figure 9. Schematic overview of the genetic arrangement of the mitochondrial genome.Genes which contribute to the 5 protein complexes are indicated with shades of grey.

18
In mammals, mitochondria are usually inherited from the mother through the eggcytoplasm. In humans, the egg cytoplasm contains a large number of mitochondrialparticles whereas the sperm head only carries 5 to 10. During fertilisation, thesepaternal mitochondria are labelled for degradation through the ubiquitin pathway,resulting in an exclusively maternal inheritance pattern (Sutovsky et al 1999). Thisuniparental mode of inheritance means that recombination between maternal andpaternal mitochondria cannot occur.
Why use mitochondria?The analysis of mitochondrial DNA (mtDNA) has been heavily utilised for studies ofhuman evolution. This is largely due to a handful of appealing features that setmtDNA apart from nuclear DNA. Possibly the most important factor is that, like the Ychromosome, mitochondria are uniparentally inherited. While the lack of apparentrecombination means that only the history of women in a population can beinvestigated, it allows the tracing of a direct genetic line, where all polymorphism isdue to mutation. The high substitution rate in the mitochondrial genome compoundsthis advantage and allows for phylogenetic resolution of more closely relatedindividuals than is possible with nuclear DNA sequences of similar length. If mtDNAis evolving 5 to 10 times faster than nuclear DNA, then 5 to 10 times the amount ofnuclear sequence data would be required to give the same amount of phylogeneticdata. Also, as the mitochondrial genome is of an immediately finite length (~16,500bp), a wealth of data from the same locus is available for comparison. In fact, over 10thousand human mitochondrial hypervariable region sequences (from themitochondrial D-loop) have been produced to date, many for the purpose of forensicanalyses. The D-loop is an important source of information for forensic scientists formany of the same reasons that it appeals to population geneticists, as well as someother salient factors. It can be possible to extract mtDNA from sources when thenuclear DNA is degraded beyond use. This is partly because the circular configurationof the genome makes it more stable in nature and partly because many more copies ofthe mitochondrial genome exist in each cell. In fact, mtDNA has been extracted,amplified and sequenced from the fossilised remains of Neanderthal bones at least30,000 years old (Krings et al 1997).
Mitochondrial evolutionThe substitution rate in the mitochondrial genome is typically 5 to 10 times higherthan that of nuclear DNA (Brown et al 1979; Brown et al 1982). The reason for thishigh rate of substitution is thought to be due to either a high rate of nucleotidemisincorporation or low DNA polymerase repair efficiency (Lansman and Clayton1975). Studies on the reliability of mitochondrial DNA replication have shown that thenet average fidelity of the human mitochondrial DNA polymerase (pol γ) is about 1error per 1-20 million base pairs, a rate that is 1000-fold higher than the errorfrequency expected for the replication of nuclear DNA (Johnson and Johnson 2001a;Johnson and Johnson 2001b). Also, the high turnover rate of mitochondria in tissues(Rabinowitz and Swift 1970) would provide more rounds of replication during which

19
errors could be generated. Compounding these factors is an enhanced chance offixation of new mutations due to low functional constraints on mitochondrial products(Brown et al 1979). In addition to the high mutation rate in the mitochondrial genome,the control region of the genome has been estimated to evolve at a rate of 5 times tonearly 20 times faster (Sigur› ardóttir et al 2000) than that of the coding region (theother 93% of the genome).
Recombination in mitochondriaAs early as 1980, Giles and colleagues demonstrated maternal inheritance in humanmitochondrial DNA (Giles et al 1980). This was confirmed in intraspecific mousecrosses, while in interspecific crosses paternal contribution was observed (Gyllenstenet al 1991). However, on the basis of phylogenetic analysis (Eyre-Walker et al 1999)and linkage disequilibrium (LD) studies (Awadalla et al 1999), evidence ofrecombination has been claimed among paternal and maternal human mitochondrialDNA. The results of these studies have been heavily criticised, particularly the latter(Kivisild and Villems 2000; Jorde and Bamshad 2000; Kumar et al 2000; Parsons andIrwin 2000). The comments centred on the small number of sites that had beenanalysed, a biased dataset, as well as the use of the LD measure, r2, that is oversensitive to allele frequency variation. Reanalyses of the dataset using the standard LDmeasure D´ show that there is no association of linkage disequilibrium with physicaldistance. Regardless, Awadalla and colleagues have responded to the criticisms andleft the issue of recombination an open question (Awadalla et al 2000). They concede,however, that if recombination does occur in human mitochondria, it is infrequent.
Natural selectionA key assumption in estimating evolutionary distances between mitochondrial lineagesis that observed pattern of polymorphism is the result of random genetic drift. Thisimplies that natural selection does not play a part in shaping regional mtDNAvariation. However, there are several examples of non-neutrality of mtDNA mutationssuch as cytoplasmic male sterility in plants (reviewed in Budar et al 2003) and inhumans, a class of muscle disease known as mitochondrial myopathy (reviewed inOldfors and Tulinius 2003). Effects of natural selection in mitochondrial codingregions are also evident in the discordance between the numbers of synonymous andnonsynonymous substitutions (Ingman and Gyllensten 2001). Also, whenmitochondrial lineages are subdivided into groupings that are thought to reflect theirhistorical habitat, a larger proportion of nonsynonymous substitutions are seen amongthe “arctic” lineages relative to the “tropical” and “temperate” lineages in the ATPase6 gene (Mishmar et al 2003). In fact, the “arctic” populations show a two-fold increasein ka/ks ratio (the number of nonsynonymous substitutions per nonsynonymous sitedivided by the number of synonymous substitutions per synonymous site) averagedover all 13 mitochondrial protein coding genes compared to those from “temperate”locations which in turn show double the ka/ks ratio of the “tropical” populations ofAfrica (Ingman and Gyllensten, in preparation). This could be due to changing

20
environmental pressures on mitochondrial lineages as humans moved from the Africanclimate to exploit new habitats.
There can, however, be no doubt that changed conditions induce an almostindefinite amount of fluctuating variability, by which the whole organism isrendered in some degree plastic.(Darwin 1871)
This may be especially important in cold environments as mitochondrial oxidativephosphorylation (OXPHOS) employs dietary calories to produce ATP, which can beutilised to generate heat for body temperature maintenance. Mitochondrial lineagesmay therefore vary functionally depending on their long-term environment and the rateof evolution of lineages from different habitats could be quite different, invalidatingthe assumption of a molecular clock. While this does not appear to be a major problemsince the numbers of non-synonymous substitutions are relatively small, these factorsshould be kept in mind when interpreting mitochondrial population genetics data.
Inferences on human evolutionAs discussed above, mitochondrial DNA has been an important source of phylogeneticinformation for studies of human evolution, migration and population differentiation.To date, few studies have presented phylogenetic analyses based on the completemitochondrial genome but rather have focussed on particular sites that are thought tobe variable, or the rapidly evolving mitochondrial control region (D-loop).
RFLPOne of the human population genetics studies that stands out above all othersemployed mtDNA genetic variation to study the evolutionary relationships betweenindividuals of diverse origins. In 1987, a group of researchers at the University ofCalifornia campus at Berkley presented data that indicated a recent African origin ofmodern humans (Cann et al 1987). This landmark study was based on restrictionfragment length polymorphism (RFLP) variation among the mtDNA of 147 humansfrom five populations. In this study, 12 restriction enzymes were used to cut themtDNA of each of these individuals at an average of 370 positions. These restrictionenzymes recognise a particular DNA sequence and cleave the strand at a specific sitewithin that sequence. The length of the fragments can then be estimated so the positionof the site and the nucleotide sequence at the restriction site can be inferred. Using thistechnique, Cann and colleagues assayed a total of about 9% of the mtDNA of eachindividual and identified 195 polymorphic sites. The 147 individuals included in thestudy yielded 133 distinct mitochondrial haplotypes which were assembled into aphylogenetic tree using the maximum parsimony method. The oldest group (clade) onthe tree was comprised of mtDNA types derived from African people and, given thenumber of differences between the two most divergent mtDNA types, the commonancestor of all the haplotypes was estimated to have existed (in Africa) between 140and 280 thousand years ago.

21
The RFLP technique continued to be popular through much of the 1990s but, althoughsome researchers still employ this method, improvements in rapid sequencingtechnology it has made it somewhat antiquated.
D-loop sequencingThe mitochondrial D-loop comprises about 1,100 bp which make up less than 7% ofthe complete mitochondrial genome. The D-loop contains two hypervariable regions(HVR1 and HVR2) which account for much of the high substitution rate in thissequence. Sequencing the D-loop for use in molecular population genetics has beenpopular due to the high degree of polymorphism that can be found in this relativelyshort sequence. The advantage of copious amounts of published data from the humanD-loop continues to make it an attractive source of phylogenetic information. Many ofthe methods used for analysing sequence data for phylogenetic inference have beenspecifically developed for dealing with the particular complications specific to the D-loop. The main problem stems from extensive rate heterogeneity that results from anextreme rate of substitution at some sites (Maddison et al 1992; Wakeley 1993). Theconsequence of this is a high frequency of multiple substitutions and, as a result,specific algorithms for estimating genetic distance have appeared in an attempt to takethis into account (eg. Tamura and Nei 1993). However, the pattern of polymorphism inthis region is still not well understood and studies continue to be plagued withstatistical problems due to the high level of homoplasy in the datasets. Nevertheless,information gleaned from D-loop sequences has added significantly to our level ofunderstanding of human evolution and the genetic relationships among populations.
What about the Y?Like the mitochondrial genome, the non-recombining region of the Y chromosome(NRY) is uniparentally inherited and therefore has the advantage of following thegenetic line of males in a population without recombination. Its recent origin, coupledwith high geographic differentiation (Jobling and Tyler-Smith 1995), make the Ychromosome an important tool in the study of modern human migrations. Since 1995,Y chromosome markers have been employed increasingly in studies of humanevolution (Hammer 1995; Jobling and Tyler-Smith 1995). Rather than completesequencing, data are generally gathered from microsatellite loci and SNP sites.Although SNPs on the Y chromosome are rare (Hammer 1995; Jobling and Tyler-Smith 1995) the NRY is about 35 Mb long and with a pairwise difference on averageevery 3 to 4000 bases (Stumpf and Goldstein 2001), it represents an almost unlimitedsource of phylogenetic information. In addition, since the Y chromosome is evolvingat a much slower rate than mtDNA, the Y mutations are considered to be unique eventpolymorphisms (UEPs) which reflects the fact that parallel or back mutations areextremely unlikely. In fact, a study based on the analysis of 167 NRY polymorphismsin 1062 individuals produced 116 haplotypes that could be parsimoniously assembledinto a single genealogy (Underhill et al 2000). The human Y chromosome also offersgreater geographic variability than mtDNA since women have had a considerablyhigher migration rate than men due to the predominance of patrilocality in human
22
populations (Seielstad et al 1998). Perhaps the only key ingredient missing in studiesof the Y chromosome is a full characterisation of variability within that locus allowinggreater resolution for more closely related lineages. Presumably, that will not be toofar in the future.
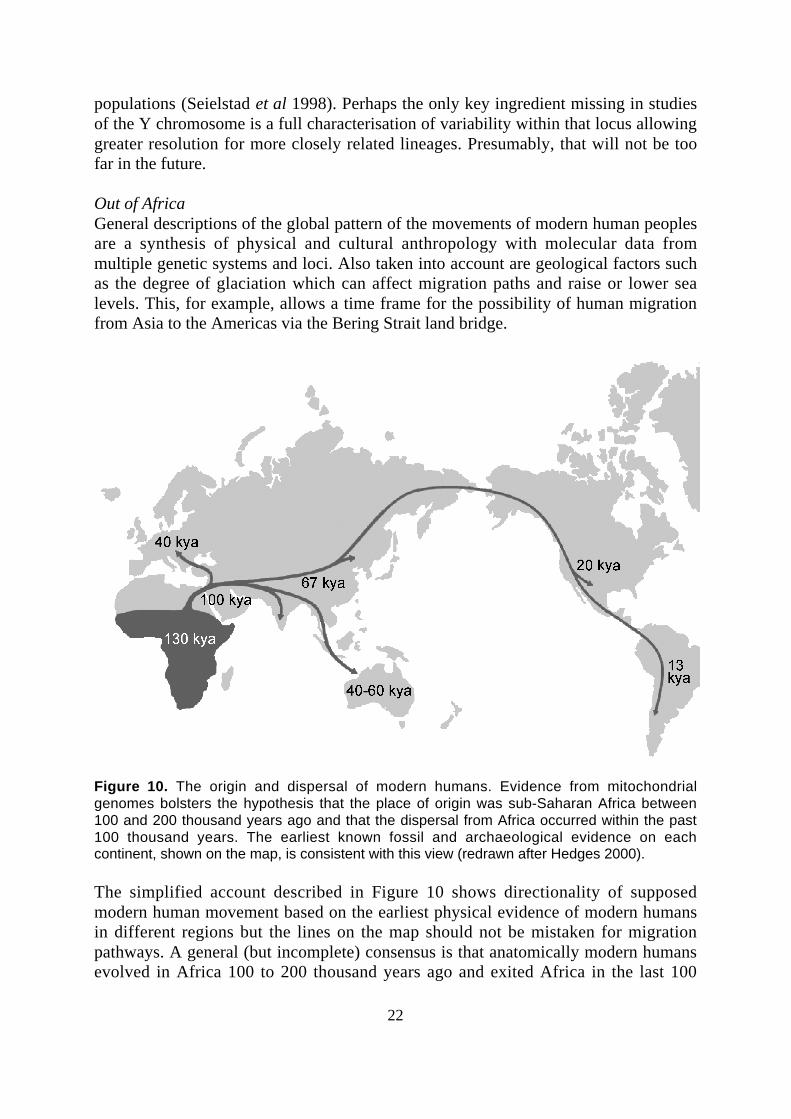
Out of AfricaGeneral descriptions of the global pattern of the movements of modern human peoplesare a synthesis of physical and cultural anthropology with molecular data frommultiple genetic systems and loci. Also taken into account are geological factors suchas the degree of glaciation which can affect migration paths and raise or lower sealevels. This, for example, allows a time frame for the possibility of human migrationfrom Asia to the Americas via the Bering Strait land bridge.
Figure 10. The origin and dispersal of modern humans. Evidence from mitochondrialgenomes bolsters the hypothesis that the place of origin was sub-Saharan Africa between100 and 200 thousand years ago and that the dispersal from Africa occurred within the past100 thousand years. The earliest known fossil and archaeological evidence on eachcontinent, shown on the map, is consistent with this view (redrawn after Hedges 2000).
The simplified account described in Figure 10 shows directionality of supposedmodern human movement based on the earliest physical evidence of modern humansin different regions but the lines on the map should not be mistaken for migrationpathways. A general (but incomplete) consensus is that anatomically modern humansevolved in Africa 100 to 200 thousand years ago and exited Africa in the last 100

23
thousand years to the Levant, the Mediterranean region between Turkey and Egypt.From there, they radiated toward East Asia, Europe, Australia and eventually to theAmericas. As modern humans advanced across the world, they must have encounteredarchaic humans that were resident in their new range. A key question is whether therewas total replacement of these previous occupants or if admixture between modernand archaic forms has contributed to the contemporary human gene pool. Whilebarriers to fertility are slow to develop, making admixture a biological possibility,cultural and social barriers were likely to be of greater significance (Cavalli-Sforza etal 1996). Fossil and archaeological evidence suggest that the modern human formevolved prior to the evolution of the modern human facility for culture (Klein 1999),which implies that archaic human forms would have had a somewhat lower dispositionfor complex cultural expression and a lower level of language skills. It has beenpostulated that the latter would have imparted modern humans with greater fitness andprovided the strongest barrier to admixture (Cavalli-Sforza et al 1988).

24
THESIS WORK
Paper I – African origin and “mitochondrial Eve”The two competing hypotheses on the origin of modern humans agree that Homoerectus evolved in Africa about 2 million years ago and subsequently colonised muchof Asia and Europe†. The “recent African origin” hypothesis then states that modernhumans later evolved in Africa some 100 to 200 thousand years ago and eventuallyspread to the rest of the world, systematically replacing Homo erectus without geneticmixing. Proponents of “multi-regional” evolution maintain that the transformationfrom Homo erectus to modern humans occurred in parallel in several differentlocations outside of Africa. The challenge for molecular anthropologists has been todetermine whether the common ancestor of all living humans was in Africa 2 millionyears ago or 200 thousand years ago. Previous work conducted on human origins hasestimated a date for the coalescence of all human mitochondrial lineages of about 200thousand years ago, however these studies contained some irregularities. An importantpiece of evidence that was missing from the work of Cann et al (1987) and thosestudies that followed, was statistical support for the topology of the phylogenetic trees,particularly in the deep African branches. The amount of data collected during theseanalyses of partial mitochondrial sequences simply wasn’t sufficient to confidentlyplace the root of all living people in Africa. Compounding this lack of data were theproblems created by the high degree of homoplasy in D-loop datasets. Followingstudies of RFLP data (Maddison 1991) and D-loop sequence data (Vigilant et al1991), Alan Templeton commented that both datasets gave phylogenetic trees withgeographically mixed basal clades, thereby invalidating the original rationale for anAfrican origin (Templeton 1992). A reanalysis of the Vigilant dataset using theNeighbor-Joining tree building algorithm revealed that only 6 nodes on the tree werestatistically supported and those only defined small clusters of 2 to 6 individuals(Hedges et al 1992). Furthermore, the support for the African branches was very low,a problem that continued through the 1990s.To address this issue, we obtained complete mtDNA sequences from 53 humans ofdiverse origins and built a tree using the Neighbor-Joining method (Saitou and Nei1987). As can be seen in Figure 2 (Appendix 1), the tree reconstructed using ourmtDNA sequences has a strongly supported basal branching pattern. The three deepestbranches lead exclusively to mtDNA sequences derived from individuals from sub-Saharan Africa, providing compelling evidence for a human mtDNA origin in Africa.The date of the most recent common ancestor (MRCA) of all the mtDNA sequences is171 ± 50 kya, a timeframe that fits with the hypothesis of a recent African origin ofmodern humans. This date is compatible with a date for the common ancestral humanY chromosome of 188 kya (51 to 411 kya, 95% CI) (Hammer 1995). A study of about10 kb of non-coding DNA in 69 individuals from a region of low recombination atXq13.3 presented a date for the MRCA of 535 ± 119 kya (Kaessmann et al 1999).Since the population size of the X chromosome is 3 times larger than that of mtDNA † many researchers now believe that early Homo erectus was a separate species, Homo ergaster, andHomo erectus evolved from Homo ergaster after their exodus from Africa.

25
or the Y chromosome, a date of about three times older is expected. This difference inpopulation size is due to the fact that at each mating there are three X chromosomesbut only one mtDNA type and one Y chromosome (and four of each of the autosomes)that can be passed to the progeny. In line with this, the TMRCA for an autosomallocus is found to be about four times older (750 kya (400 to 1,300 kya, 95% CI)) thanthat for mtDNA or Y chromosomes (Harding et al 1997). In this manner, the commongenetic ancestor of all extant human lineages depends on which locus is examined.Clearly, the process of becoming human did not happen overnight but rather was agradual process of accumulation of genotypic and phenotypic changes in all geneticsystems over many thousands of years.Since we were in possession of an extensive mitochondrial dataset, we were also ableto use these sequences to address the issue of recombination among maternal andpaternal mitochondria. We examined linkage disequilibrium (LD) among our completeset of mitochondrial genomes using the LD measure D´ and found no correlationbetween D´ and nucleotide distance. We concluded that, at least in our dataset,recombination was not a contributing factor to the evolution of mtDNA.Also, through application of Tajima’s D statistic and analysis of pairwise mismatchdistributions, we identified that non-African sequences had experienced a period ofpopulation expansion. From an estimate of Tau we were able to date this to 38,500years ago, a time that coincides with a period of cultural change.

26
Paper II – Heteroplasmy and Selection in mtDNAIn Paper I, we removed the D-loop sequences from the dataset in all phylogeneticanalyses. The reason given was that it did not behave in a “clock-like” manner andwas therefore unsuitable for phylogenetic inference. This conclusion was drawnbecause a test of relative rates between gorilla, chimpanzee and human D-loopsequences showed that the overload of multiple substitutions in that region voided theassumption of a molecular clock, whereas the mitochondrial genomes excluding theD-loop were found to evolve at roughly constant rates. In this manuscript, we took thisa step further and compared the D-loop to the coding region of the genome in anattempt to determine the extent to which the D-loop was affected by homoplasyresulting from multiple substitutions. Considering the amount of polymorphic sites inthe D-loop (30% of the complete genome total) it should be possible to reconstruct aninformative tree using this region. Figure 3 (Appendix 2) shows the contrast inresolution between trees reconstructed using the coding region (a) and using the D-loop (b). This difference is particularly pronounced when branches with low statisticalsupport are collapsed (right trees).Strong evidence exists for mutational “hot spots” in the mitochondrial control regionthat affect phylogenies reconstructed using these data (Maddison et al 1992; Wakeley1993; Meyer et al 1999; Stoneking 2000). However, it is possible that some errantsites are causing this effect and their removal from the dataset might result in a vastimprovement in branching support. To identify these sites, we assumed the treereconstructed with coding region sequences was the “true tree” and estimated howmany individual substitutions would need to occur at each site in the D-loop datasetfor the data to fit this tree. In this way, we worked backward and inferred the sites andsequences where parallel and back mutations must have occurred. We found that ofthe 80 parsimony informative sites (variants that are present in more than onesequence) in the D-loop dataset, 57 of these were present independently in multiplelineages. This means that the same substitution has occurred at the same site more thanonce in the dataset at over 70% of the informative sites. Therefore, the majority of thepolymorphism found in the mitochondrial D-loop is not useful in inferring geneticrelationships between sequences.With the removal of the 44 sites from the D-loop dataset that were most stronglyaffected by homoplasy, the D-loop is forced to behave in a clock-like manner(Appendix 2, Figure 5). However, this does not result in a tree with better branchingsupport as there are no longer sufficient polymorphic sites in that region with which tobuild an informative tree. When these 44 sites are removed from the dataset ofcomplete mitochondrial genomes, some improvement is seen relative to the branchingsupport of trees reconstructed with the coding region sequences or with the completemitochondrial sequences (Appendix 2, Figure 6).Although RFLP data provide genotypic information for sites in both the D-loop andthe mitochondrial coding region, these data are also based on fragmentary information.In an attempt to assess the influence of building mtDNA phylogenies based on RFLPdata alone, we inferred the nucleotide position at which the commonly used restrictionenzymes would cleave the mtDNA strands. This information allowed us to catalogue
27
all polymorphism that could theoretically be identified using restriction enzymes. Wefound that in general, RFLP sites that have been identified as lineage specific onlyrepresent a portion of the informative sites that can be identified with completesequence data and will therefore provide less support for tree topology. While RFLPdata can define some major clades, the complete genome data provide moretopological support and also distinguish a number of additional clades.Also, the availability of a dataset of complete mitochondrial genomes has allowed amore detailed analysis of the pattern of selection across the mitochondrial codingregion. All protein coding genes showed an excess of synonymous substitutionscompared to nonsynonymous substitutions consistent with the action of purifyingselection (Appendix 2, Figure 2). Analysis of the substitution rate in the rRNA andtRNA genes reveals that the action of purifying selection is also preserving theirstructure and function.

28
Paper III – Evolutionary history of Aboriginal AustraliansDue to lower sea levels, mainland Australia, Tasmania and New Guinea have beenjoined several times over the last 70 thousand years, creating a landmass called Sahul.At the same times, Borneo, Sumatra and Java have been connected to the mainland ofSouth East Asia forming the Sunda peninsula. These periods of low sea level wouldfacilitate human migration from Southeast Asia to Sahul. If Australia and New Guineawere joined at the time of colonisation, it is possible that there would be geneticsimilarities between their native populations. Previous studies of mitochondrial D-loopvariation (Redd and Stoneking 1999; van Holst Pellekaan et al 1998) and RFLP data(Stoneking et al 1990) have returned mixed results on the question of common origin.An analysis of Y chromosome data from Australia and Melanesia has suggestedseparate origins of Australian and New Guinean aborigines (Kayser et al 2001), whichis in conflict with a study of autosomal loci (Roberts-Thomson et al 1996). In Papers Iand II, we showed that superior data quantity and quality can be obtained fromcomplete mitochondrial sequences, relative to the mitochondrial D-loop, and thiscould provide the basis for a stronger conclusion on the origin of AboriginalAustralians.We obtained complete mitochondrial genome sequence data for 20 AustralianAborigines and 21 New Guineans, as well as 60 complete sequences from the peoplesof Africa, India, Europe, Asia, Melanesia and Polynesia†. A Neighbor-Joining tree(Saitou and Nei 1987) reconstructed with the 101 coding region sequences shows awell-supported topology (Appendix 3, Figure 2). Non-African sequences arerepresented on two branches, indicated in the figure by dashed lines. All but one of theAustralian sequences are present on branch 1, together with more than half the NewGuinean sequences, all the European and Polynesian sequences and several Asiansequences. Our data indicate that some Australian sequences do show a closerrelationship to some New Guinean sequences, particularly to those from the NewGuinea highlands. This result is in line with the theory that the highlands of NewGuinea became a refuge for the original inhabitants of that region when new colonistsarrived and inhabited the coastal areas (Bellwood 1990). Because genetic divergenceis expected to precede population divergence, modern humans must have arrived inSahul since the time at which all the lineages on branch 1 diverged (71± 12 kya). Apairwise mismatch distribution for the Australian sequences shows a pattern indicativeof a period of population growth (Appendix 3, Figure 3a), confirmed by tests ofselective neutrality (Fu and Li 1989; Tajima 1989). The time that has passed since thisexpansion is dated from an estimate of Tau to be about 40 kya. Significantly negativeTajima’s D values and unimodal mismatch distributions can result after a rangeexpansion followed by a high rate of emigration to neighbouring demes (Ray et al2003). It is therefore possible that this evidence of population expansion may insteadindicate a spatial expansion as a relatively small number of people moved into a vastand unpopulated continent. Since it is unlikely that Australia was colonised by a verylarge heterogenous population, this expansion would have presumably taken place † of these 101 sequences, 49 were generated as part of a previous study (Ingman et al 2000) and 52were sequenced for this study.

29
after the migration. In this way, we can frame the timing of human arrival in Australiabetween the coalescence date and the expansion date: 40 to 70 thousand years ago.This is in agreement with archaeological evidence which dates two human occupationsites in northern Australia (Roberts et al 1990; Roberts et al 1994) and one in thesoutheast region of Australia (Thorne et al 1999; Bowler et al 2003) at 50 to 60 kya,and evidence of animal extinctions across the continent, presumably as a result ofhunting, about 46 kya (Roberts et al 2001).Consistent with previous investigations of mitochondrial sequence data (van HolstPellekaan et al 1998; Redd and Stoneking 1999), our study revealed high geneticdiversity within both Australian and New Guinean populations. This is, however,disparate to the level of genetic diversity reported for the Y chromosome. Previousstudies have found a unique Australia-specific Y chromosome haplotype in about 50%of Australian Aboriginal males (Kayser et al 2001; Redd et al 2002). Kayser andcolleagues (2001) suggested that the high frequency of this haplotype in Australiacould be the result of a relatively recent population expansion. However, thebottleneck among other lineages that must have accompanied such a scenario is notevident among mitochondrial sequences. The relatively high genetic diversity amongmitochondrial genomes could be attributed to a combination of high substitution rate(Brown et al 1979), patrilocality (Seielstad et al 1998; Oota et al 2001) and polygyny(Birdsell 1993).

30
Paper IV – Ancient human migrationsWhile the broad outline of modern human origins has been established throughanalysis of physical and molecular data, important details, such as migrations and therelationships of global populations, remain to be fixed. Many population geneticsstudies suffer from the complexities of human populations, partly due to admixture.Large-scale population based analyses allow greater resolution than those based onsmall numbers of sequences and may yield valuable information on the history ofhuman populations. In this manuscript we have analysed large SNP and sequence datasets in order to increase our understanding of the fundamental associations of extantpeoples.The general phylogenetic structure of a global selection of complete humanmitochondrial genomes has been established (Ingman et al 2000). The deepestbranches are reserved for sub-Saharan African lineages and all non-African sequencesare present on two main branches that diverged from African lineages in the last 100thousand years (Appendix 1, Figure 2). The sequences on these two non-Africanbranches are delineated by 7 nucleotide substitutions. In order to study the evolutionand spread of non-Africans, we typed these SNPs in a global selection of DNA from1759 individuals. The human genome diversity panel (HGDP) consists of 1064 DNAsamples from 52 world populations (Cann et al 2002) and we supplemented thisnumber with extra samples obtained separately to better represent African and Asiandiversity.These 7 SNPs identify 14 haplotypes among these samples (Appendix 4, Figure 1).While 7 of these 14 haplotypes are found in Africa, only two major haplotypes arefound in all African populations at high frequencies. These two haplotypes are absentin all the non-African populations examined except the Middle East (Israel) and SouthAsia (Pakistan) (Appendix 4, Table 1). In Europe, East Asia, Australia and theAmericas, two different haplotypes predominate with very few other haplotypespresent at appreciable frequencies. The presence of only two major mtDNAhaplotypes in most non-African populations can be attributed to a populationbottleneck associated with the exodus of modern humans from Africa and their spreadthroughout the world. The presence of African haplotypes in the Middle East andPakistan is evidence of a genetic connection between these populations possiblythrough repeated human movements.In order to add information to the scenario outlined by the SNP data, we havesequenced more than 300 mitochondrial coding region sequences of 6300 base pairs inlength. These sequences derive from samples in the CEPH human genome diversitypanel (China, Pakistan, Israel, Mexico, Japan and Yakut) as well as our own samplecollection (Thai hill tribes, Japan and Yakut). A population tree reconstructed withthese and other published sequences shows a basal split between East Asian and SouthAsian populations. Using various standard tests (Tajima 1989, Fu and Li 1993),significant departures from neutrality were detected in several of the populations. Thiscan be interpreted as changes in the pattern of polymorphism in a population due to ademographic or spatial expansion. The amount of time that has passed since eachexpansion occurred was calculated. The oldest expansion (52,5 kya) is among the
31
lineages of present day Chinese people with other closely related populations havingmore recent expansions (Appendix 4, Table 2). This could indicate that the Chinaregion was colonised first and a subsequent demographic or spatial expansion seededmigrations to other regions. The expansion times on the other non-African branch aremore recent. The population tree and expansion analyses indicate that peoples of Israeland Europe are younger than their South Asian contemporaries. The data areconsistent with a recolonisation of the Middle East by a back migration from SouthAsia and a subsequent migration to Europe.The evidence of population expansions, whether they are demographic or spatial,could be associated with the founding of new populations in uninhabited territories.However, while the cause of these expansions can never definitely be known, it is alsopossible that some sort of cultural adaptation occurred that allowed human settlementsto support higher population densities or facilitated dispersal to new territories.
32
Concluding remarksAnalysis of mitochondrial DNA has been a potent tool in the understanding of humanevolution and migration. The data, analyses and conclusions we have presented inthese publications reveal the importance of complete mitochondrial DNA sequences inthis domain. Paper I shows that the use of mitochondrial genomes can provideincreased phylogenetic resolution and cleaner analyses than had previously beenpublished using partial mtDNA sequences. Although other genetic data have alreadyindicated that a recent African origin of modern humans was likely, the recognition ofthis within the bounds of statistical significance adds weight to the hypothesis that allliving humans share a common ancestor within the last 200 thousand years.Paper II discusses the extensive variation in substitution rate found in themitochondrial D-loop and what effect the resultant homoplasy may have onphylogenetic inference. The results show that complete mitochondrial genome analysiswill add important information to studies of human evolution when used exclusively,or in conjunction with other datasets. While the analyses presented in this manuscriptconvey damning evidence against the inherent problems with D-loop analysis, oneshould remember that even though those studies have not achieved many statisticallysound results, they have still provided important information. It is expected that manyresults based on D-loop data will be verified in the future by other means.Paper III provides evidence of a genetic link between Australian Aborigines and theindigenous people of the New Guinea highlands. The date put forward for the initialcolonisation of Australia is between 40 and 70 thousand years ago, in concert witharchaeological evidence. There may be substantial genetic variation betweenregions/tribal groups and any future comprehensive study should involve hundreds ifnot thousands of samples from a wide range of locales and typing from multiplegenetic systems.Paper IV examines an array of SNPs in a global set of 1759 DNA samples. The patternof diversity underlines the genetic bottleneck associated with the African exodus andmodern human migration throughout the rest of the world. An ancient connectionbetween African populations and those nearby is also indicated. A study of more than800 mitochondrial sequences points to a divergence among non-African peoplesbeginning more than 50 thousand years ago, possibly associated with differentialmigrations. The data indicate that the contemporary peoples of the Middle East andEurope could result from a back migration from South Asia.
The course of evolution to modern humans is complex. The fossil record is incompleteand, unfortunately, technical problems with time travel currently exist. The best wecan do is to integrate the various evidence as well as possible and try to keep an openmind. Becoming human was a gradual process of accumulation of genotypic andphenotypic changes in all genetic systems as well as behavioural and cultural advancesover many thousands of years. Because the different genetic systems can havedifferent effective population sizes, the time to the common genetic ancestor of allextant human lineages varies with the locus in question. If we can assume that thephenotypic change that tipped the balance occurred sometime between the estimates

33
for the most recent common ancestor of the different loci, then we can only guess thatthis happened sometime in the last million years. The mitochondrial genome is onlyone locus and can only reflect the history of females in a population. In the future,many studies will be presenting both mitochondrial and nuclear data together for abalanced view of human evolution and population histories. The Human GenomeProject, coupled with studies of sequence data from regions with low recombinationon autosomes and on the X chromosome, and in-depth analyses of genetic variation onthe paternally inherited Y chromosome, are uncovering a large amount ofpolymorphism that is of vital importance in the study of human evolution. With newtechnology regularly surpassing previous methods, the small size of the mitochondrialgenome that so attracted researchers in the beginning will become a significantlimiting factor. It is now possible to examine many thousands of sites for variants in asingle assay rendering the data available from mitochondria insignificant incomparison to the vast nuclear genome. In view of the fact that more SNPs areconstantly becoming available, the greater geographic variability coupled to thestability of binary polymorphisms in the Y chromosome will see this locus rise to theforefront, offering a finer resolution of human population history. As humanpopulation genetics becomes an important cornerstone in the field of medical genetics,the immediate limiting factor will be methods of analysis rather than data production.

34
ACKNOWLEDGEMENTS
First I would like to thank Ulf, my supervisor, who had enough faith to hand me thereins and the acumen to know when to take them back.
The girls of the Uppsala Genome Centre (Inger, Jenny and Ann-Sofi) provided vitalhelp and, for the most part, allowed me to use their equipment without restriction.Thanks for putting up with me and helping me though this.
I also want to thank Per-Ivan who was never too busy to provide invaluable computerhelp that I’m sure came at a cost to his own work.
Thank you to everyone at Medical Genetics for helping to make these years happy andproductive.
I have not forgotten the early tolerance and encouragement from James and Mandythat allowed me to follow this path.
This work was supported by grants from the Swedish Natural Sciences ResearchCouncil and the Beijer Foundation.

35
REFERENCES
Awadalla, P., Eyre-Walker, A. and Smith, J. M. Linkage disequilibrium andrecombination in hominid mitochondrial DNA. Science 286, 2524-2525 (1999).
Awadalla, P., Eyre-Walker, A. and Maynard Smith, J. Questioning evidence forrecombination in human mitochondrial DNA. Science 288, 1931a (2000).
Budar, F., Touzet, P. and De Paepe, R. The nucleo-mitochondrial conflict incytoplasmic male sterilities revisited. Genetica 117, 3-16 (2003).
Bellwood, P. S. The colonization of the Pacific: some current hypotheses. In Thecolonization of the Pacific: a genetic trail (eds Hill, A. V. S. and Serjeantson, S.W.) 1-59 (Oxford University Press, New York, 1990).
Birdsell, J. B. Microevolutionary patterns in Aboriginal Australia: a gradient analysisof clines (Oxford University Press, New York, 1993).
Bowler, J. M., Johnston, H., Olley, J. M., Prescott, J. R., Roberts, R. G., Shawcross,W. and Spooner, N. A. New ages for human occupation and climatic change atLake Mungo, Australia. Nature 421, 837-840 (2003).
Brown, W. M., George, M., Jr. and Wilson, A. C. Rapid evolution of animalmitochondrial DNA. Proc Natl Acad Sci USA 76, 1967-1971 (1979).
Brown, W. M., Prager, E. M., Wang, A. and Wilson, A. C. Mitochondrial DNAsequences of primates: tempo and mode of evolution. J Mol Evol 18, 225-239(1982).
Cann, H. M., de Toma, C., Cazes, L., Legrand, M. F., Morel, V., Piouffre, L., Bodmer,J., Bodmer, W. F., Bonne-Tamir, B., Cambon-Thomsen, A., Chen, Z., Chu, J.,Carcassi, C., Contu, L., Du, R., Excoffier, L., Ferrara, G. B., Friedlaender, J. S.,Groot, H., Gurwitz, D., Jenkins, T., Herrera, R. J., Huang, X., Kidd, J., Kidd, K.K., Langaney, A., Lin, A. A., Mehdi, S. Q., Parham, P., Piazza, A., Pistillo, M.P., Qian, Y., Shu, Q., Xu, J., Zhu, S., Weber, J. L., Greely, H. T., Feldman, M.W., Thomas, G., Dausset, J. and Cavalli-Sforza, L. L. A human genome diversitycell line panel. Science 296, 261-261 (2002).
Cann, R. L., Stoneking, M. and Wilson, A. C. Mitochondrial DNA and humanevolution. Nature 325, 31-36 (1987).
Cavalli-Sforza, L. L. and Edwards, A. W. F. Analysis of human evolution. Proc 11thIntl Cong Genet 2, 923-933 (1964).
Cavalli-Sforza, L. L., Piazza, A., Menozzi, P. and Mountain, J. Reconstruction of humanevolution; bringing together genetic, archaeological, and linguistic data. Proc NatlAcad Sci USA 85, 6002-6006 (1988).
Cavalli-Sforza, L. L., Menozzi, P. and Piazza, A. The history and geography of humangenes (Princeton University Press, Princeton, 1996).
Cavelier, L., Johannisson, A. and Gyllensten, U. Analysis of mtDNA copy number andcomposition of single mitochondrial particles using flow cytometry and PCR. ExpCell Res 259, 79-85 (2000).
Dart, R. A. Australopithecus africanus: The man-ape of South Africa. Nature 115, 195-199 (1925).
Darwin, C. The descent of man (John Murray, London, 1871).
36
Excoffier, L. and Yang, Z. Substitution rate variation among sites in mitochondrialhypervariable region I of humans and chimpanzees. Mol Biol Evol 16, 1357-68(1999).
Eyre-Walker, A., Smith, N. H. and Smith, J. M. How clonal are human mitochondria?Proc R Soc Lond B Biol Sci 266, 477-483 (1999).
Fu, Y. X. and Li, W. H. Statistical tests of neutrality of mutations. Genetics 133, 693-709 (1993).
Giles, R. E., Blanc, H., Cann, H. M. and Wallace, D. C. Maternal inheritance of humanmitochondrial DNA. Proc Natl Acad Sci USA 77, 6715-6719 (1980).
Gyllensten, U., Wharton, D., Josefsson, A. and Wilson, A. C. Paternal inheritance ofmitochondrial DNA in mice. Nature 352, 255-257 (1991).
Hammer, M. F. A recent common ancestry for human Y chromosomes. Nature 378,376-378 (1995).
Harding, R. M., Fullerton, S. M., Griffiths, R. C., Bond, J., Cox, M. J., Schneider, J.A., Moulin, D. S. and Clegg, J. B. Archaic African and Asian lineages in thegenetic ancestry of modern humans. Am J Hum Genet 60, 772-789 (1997).
Harpending, H. C., Sherry, S. T., Rogers, A. R. and Stoneking, M. The genetic structureof ancient populations. Curr Anthropol 34, 483-496 (1993).
Harpending, H. C. Signature of ancient population growth in a low-resolutionmitochondrial DNA mismatch distribution. Hum Biol 66, 591-600 (1994).
Hedges, S. B. A start for population genomics. Nature 408, 652-653 (2000).Hedges, S. B., Kumar, S., Tamura, K. and Stoneking, M. Human origins and analysis of
mitochondrial DNA sequences. Science 255, 737-9 (1992).Ingman, M., Kaessmann, H., Pääbo, S. and Gyllensten, U. Mitochondrial genome
variation and the origin of modern humans. Nature 408, 708-713 (2000).Ingman, M. and Gyllensten, U. Analysis of the complete human mtDNA genome:
methodology and inferences for human evolution. J Hered 92, 454-461 (2001).Janecek, L. L., Honeycutt, R. L., Adkins, R. M. and Davis, S. K. Mitochondrial gene
sequences and the molecular systematics of the Artiodactyl subfamily Bovinae.Mol Phylogenet Evol 6, 107-119 (1996).
Jobling, M. A. and Tyler-Smith, C. Fathers and sons: the Y chromosome and humanevolution. Trends Genet 11, 449-456 (1995).
Johnson, A. A. and Johnson, K. A. Exonuclease proofreading by human mitochondrialDNA polymerase. J Biol Chem 276, 38097-38107 (2001a).
Johnson, A. A. and Johnson, K. A. Fidelity of nucleotide incorporation by humanmitochondrial DNA polymerase. J Biol Chem 276, 38090-38096 (2001b).
Jorde, L. B. and Bamshad, M. Questioning evidence for recombination in humanmitochondrial DNA. Science 288, 1931a (2000).
Jukes, T. H. and Cantor, C. R. Evolution of protein molecules. In Mammalian proteinmetabolism (ed Munro, H. N.) 21-132 (Academic Press, New York, 1969).
Kaessmann, H., Heissig, F., von Haeseler, A. and Pääbo, S. DNA sequence variationin a non-coding region of low recombination on the human X chromosome. NatGenet 22, 78-81 (1999).

37
Kayser, M., Brauer, S., Weiss, G., Schiefenhovel, W., Underhill, P. A. and Stoneking,M. Independent histories of human Y chromosomes from Melanesia and Australia.Am J Hum Genet 68, 173-190. (2001).
Kimura, M. Evolutionary rate at the molecular level. Nature 217, 624-626 (1968).Kimura, M. A simple method for estimating evolutionary rates of base substitutions
through comparative studies of nucleotide sequences. J Mol Evol 16, 111-120(1980).
Kimura, M. The neutral theory of molecular evolution (Cambridge University Press,Cambridge, 1983).
Kivisild, T. and Villems, R. Questioning evidence for recombination in humanmitochondrial DNA. Science 288, 1931a (2000).
Klein, R.G. The human career: human biological and cultural origins (University ofChicago Press, Chicago, 1999).
Krings, M., Stone, A., Schmitz, R. W., Krainitzki, H., Stoneking, M. and Paabo, S.Neandertal DNA sequences and the origin of modern humans. Cell 90, 19-30(1997).
Kumar, S., Hedrick, P., Dowling, T. and Stoneking, M. Questioning evidence forrecombination in human mitochondrial DNA. Science 288, 1931a (2000).
Lansman, R. A. and Clayton, D. A. Selective nicking of mammalian mitochondrialDNA in vivo: photosensitization by incorporation of 5-bromodeoxyuridine. J MolBiol 99, 761-776 (1975).
Li, W. H. Molecular evolution (Sinauer Associates, Inc., Sunderland Massachusetts,1997).
Maddison, D. African origin of human mitochondrial DNA reexamined. Syst Zool 40,355-363 (1991).
Maddison, D., Ruvolo, M. and Swofford, D. Geographic origins of humanmitochondrial DNA: phylogenetic evidence from control region sequences. SystBiol 41, 111-124 (1992).
Maxam, A. M. and Gilbert, W. A new method for sequencing DNA. Proc Natl Acad SciUSA 74, 560-564 (1977).
Meyer, S., Weiss, G. and von Haeseler, A. Pattern of nucleotide substitution and rateheterogeneity in the hypervariable regions I and II of human mtDNA. Genetics152, 1103-10 (1999).
Mishmar, D., Ruiz-Pesini, E., Golik, P., Macaulay, V., Clark, A. G., Hosseini, S.,Brandon, M., Easley, K., Chen, E., Brown, M. D., Sukernik, R. I., Olckers, A.,Wallace D. C. Natural selection shaped regional mtDNA variation in humans.Proc Natl Acad Sci USA 100, 171-176 (2003).
Nei, M. Molecular evolutionary genetics (Columbia University Press, New York,1987).
Nei, M. Age of the common ancestor of human mitochondrial DNA. Mol Biol Evol 9,1176-1178 (1992).
Nei, M. and Li, W. H. Mathematical model for studying genetic variation in terms ofrestriction endonucleases. Proc Natl Acad Sci USA 76, 5269-5273 (1979).

38
Nei, M. and Kumar, S. Molecular evolution and phylogenetics (Oxford UniversityPress, New York, 2000).
Oldfors, A. and Tulinius, M. Mitochondrial encephalomyopathies. Neuropathol ExpNeurol 62, 217-227 (2003).
Oota, H., Settheetham-Ishida, W., Tiwawech, D., Ishida, T. and Stoneking, M. HumanmtDNA and Y-chromosome variation is correlated with matrilocal versuspatrilocal residence. Nat Genet 29, 20-21 (2001).
Parsons, T. J., Muniec, D. S., Sullivan, K., Woodyatt, N., Alliston-Greiner, R., Wilson,M. R., Berry, D. L., Holland, K. A., Weedn, V. W., Gill, P. and Holland, M. M.A high observed substitution rate in the human mitochondrial DNA controlregion. Nat Genet 15, 363-368 (1997).
Parsons, T. J. and Irwin, J. A. Questioning evidence for recombination in humanmitochondrial DNA. Science 288, 1931a (2000).
Piazza, A., Sgaramella-Zonta, L., Gluckman, P. and Cavalli-Sforza, L. L. Fifthhistocompatibility workshop gene-frequency data – phylogenetic analysis. TissueAntigens 5, 445-463 (1975).
Rabinowitz, M. and Swift, H. Mitochondrial nucleic acids and their relation to thebiogenesis of mitochondria. Physiol Rev 50, 376-427 (1970).
Ray, N., Currat, M. and Excoffier, L. Intra-deme molecular diversity in spatiallyexpanding populations. Mol Biol Evol 20, 76-86 (2003).
Redd, A. J. and Stoneking, M. Peopling of Sahul: mtDNA variation in AboriginalAustralian and Papua New Guinean populations. Am J Hum Genet 65, 808-828(1999).
Redd. A. J., Roberts-Thomson, J., Karafet, T., Bamshad, M., Jorde, L. B., Naidu, J.M., Walsh, B. and Hammer, M. F. Gene flow from the Indian subcontinent toAustralia: evidence from the Y chromosome. Curr Biol 12, 673-677 (2002).
Roberts, R. G., Jones, R., and Smith, M. A. Thermoluminescence dating of a 50,000-year-old human occupation site in northern Australia. Nature 345, 153-156(1990).
Roberts, R. G., Jones, R., Spooner, N. A., Head, M. J., Murray, A. S. and Smith, M. A.The human colonisation of Australia: optical dates of 53,000 and 60,000 yearsbracket human arrival at Deaf Adder Gorge, Northern Territory. Quat Sci Rev 13,575-586 (1994).
Roberts, R. G., Flannery, T. F., Ayliffe, L. K., Yoshida, H., Olley, J. M., Prideaux, G.J., Laslett, G. M., Baynes, A., Smith, M. A., Jones, R. and Smith, B. L. New agesfor the last Australian megafauna: continent-wide extinction about 46,000 yearsago. Science 292, 1888-1892 (2001).
Roberts-Thomson, J. M. Martinson, J. J., Norwich, J. T., Harding, R. M., Clegg, J. B.and Boettcher, B. An ancient common origin of Aboriginal Australians and NewGuinea highlanders is supported by alpha-globin haplotype analysis. Am J HumGenet 58, 1017-1024. (1996).
Rogers, A. R. and Harpending, H. Population growth makes waves in the distributionof pairwise genetic differences. Mol Biol Evol 9, 552-569 (1992).

39
Saitou, N. and Nei, M. The number of nucleotides required to determine the branchingorder of three species, with special reference to the human-chimpanzee-gorilladivergence. J Mol Evol 24, 189-204 (1986).
Saitou, N. and Nei, M. The neighbor-joining method: a new method for reconstructingphylogenetic trees. Mol Biol Evol 4, 406-425 (1987).
Sanger, F., Air, G. M., Barrell, B. G., Brown, N. L., Coulson, A. R., Fiddes, C. A.,Hutchison, C. A.,Slocombe, P. M. and Smith, M. Nucleotide sequence ofbacteriophage ΦX174 DNA. Nature 265, 687-695 (1977).
Seielstad, M. T., Minch, E. and Cavalli-Sforza, L. L. Genetic evidence for a higherfemale migration rate in humans. Nat Genet 20, 278-280 (1998).
Sigur› ardóttir, S., Helgason, A., Gulcher, J. R., Stefansson, K. and Donnelly, P. Themutation rate in the human mtDNA control region. Am J Hum Genet 66, 1599-609 (2000).
Simpson, G. G. The geography of evolution (Chilton Books, Philadelphia, 1965).Slatkin, M. and Hudson, R. R. Pairwise comparisons of mitochondrial DNA sequences
in stable and exponentially growing populations. Genetics 129, 555-562 (1991).Sokal, R. R. and Michener, C.D. A statistical method for evaluating systematic
relationships. University of Kansas Sci Bull 28, 1409-38 (1958).Stoneking, M., Jorde, L. B., Bhatia, K. and Wilson, A. C. Geographic variation in
human mitochondrial DNA from Papua New Guinea. Genetics 124, 717-733.(1990).
Stoneking, M. Hypervariable sites in the mtDNA control region are mutationalhotspots. Am J Hum Genet 67, 1029-1032 (2000).
Stringer, C. Coasting out of Africa. Nature 405, 24-27 (2000).Stumpf, P. H. and Goldstein, D. B. Genealogical and evolutionary inference with the
human Y chromosome. Science 291, 1738-1742 (2001).Sutovsky, P., Moreno, R. D., Ramalho-Santos, J., Dominko, T., Simerly, C. and
Schatten, G. Ubiquitin tag for sperm mitochondria. Nature 402, 371-372 (1999).Tajima, F. Statistical method for testing the neutral mutation hypothesis by DNA
polymorphism. Genetics 123, 585-595 (1989a).Tajima, F. The effect of change of population size on DNA polymorphism. Genetics
123, 597-601 (1989b).Takahata, N. and Nei, M. Gene genealogy and variance of interpopulational nucleotide
difference. Genetics 110, 325-344 (1985).Tamura, K. The rate and pattern of nucleotide substitution in Drosophila
mitochondrial DNA. Mol Biol Evol 9, 814-825 (1992).Tamura, K. and Nei, M. Estimation of the number of nucleotide substitutions in the
control region of mitochondrial DNA in humans and chimpanzees. Mol Biol Evol10, 512-526 (1993).
Templeton, A. R. Human origins and analysis of mitochondrial DNA sequences.Science 255, 737 (1992).
Thorne, A., Grun, R., Mortimer, G., Spooner, N. A., Simpson, J. J., McCulloch, M.,Taylor, L. and Curnoe, D. Australia’s oldest human remains: age of the LakeMungo 3 skeleton. J Hum Evol 36, 591-612 (1999).

40
Underhill, P. A., Shen, P., Lin, A. A., Jin, L., Passarino, G., Yang, W. H., Kauffman,E., Bonne-Tamir, B., Bertranpetit, J., Francalacci, P., Ibrahim, M., Jenkins, T.,Kidd, J. R., Mehdi, S. Q., Seielstad, M. T., Wells, R. S., Piazza, A., Davis, R. W.,Feldman, M. W., Cavalli-Sforza, L. L. and Oefner, P. J. Y chromosome sequencevariation and the history of human populations. Nat Genet 26, 358-361 (2000).
van Holst Pellekaan, S., Frommer, M., Sved, J. and Boettcher, B. Mitochondrialcontrol-region sequence variation in Aboriginal Australians. Am J Hum Genet62, 435-449. (1998).
Vigilant, L., Stoneking, M., Harpending, H., Hawkes, K. and Wilson, A.C. Africanpopulations and the evolution of human mitochondrial DNA. Science 253, 1503-1507 (1991).
Wakeley, J. Substitution rate variation among sites in hypervariable region 1 of humanmitochondrial DNA. J Mol Evol 37, 613-23 (1993).
Walter, R. C., Buffler, R. T., Bruggemann, J. H., Guillaume, M. M. M., Berhe, S. M.,Negassi, B., Libsekal, Y., Cheng, H., Edwards, R. L., von Cosel, R., Neraudeau,D. and Gagnon, M. Early European occupation of the Red Sea coast of Eritreaduring the last interglacial. Nature 405, 65-69 (2000).
Watson, E., Bauer, K., Aman, R., Weiss, G., von Haeseler, A. and Paabo, S. mtDNAsequence diversity in Africa. Am J Hum Genet 59, 437-444 (1996).
White, T. D., Asfaw, B., DeGusta, D., Gilbert, H., Richards, G. D., Suwa, G. andHowell, F. C. Pleistocene Homo sapiens from Middle Awash, Ethiopia. Nature423, 742-747 (2003).
Wright, S. Evolution in Mendelian populations. Genetics 16, 97-159 (1931).Zuckerkandl, E. and Pauling, L. Molecular disease, evolution, and genetic
heterogeneity. In Horizons in biochemistry (eds Kashar, M. and Pullman, B.)189-225 (Academic Press, New York, 1962)
Acta Universitatis UpsaliensisComprehensive Summaries of Uppsala Dissertations
from the Faculty of MedicineEditor: The Dean of the Faculty of Medicine
Distribution:Uppsala University Library
Box 510, SE-751 20 Uppsala, Swedenwww.uu.se, [email protected]
ISSN 0282-7476ISBN 91-554-5738-X
A doctoral dissertation from the Faculty of Medicine, Uppsala University,is usually a summary of a number of papers. A few copies of the completedissertation are kept at major Swedish research libraries, while the sum-mary alone is distributed internationally through the series Comprehen-sive Summaries of Uppsala Dissertations from the Faculty of Medicine.(Prior to October, 1985, the series was published under the title “Abstracts ofUppsala Dissertations from the Faculty of Medicine”.)


