Mitochondrial DNA and Y-Chromosome Variation of Eastern Aleut Populations: Implications for the Genetic Structure and Peopling of the Aleutian Archipelago By Mark Zlojutro M.A., University of Kansas, 2006 Copyright 2008 Submitted to the Department of Anthropology and the Faculty of the Graduate School of the University of Kansas in partial fulfillment of the requirements for the degree of Doctor of Philosophy Dr. Michael H. Crawford (Chairperson) Dr. James H. Mielke Committee members Dr. Felix Moos Dr. Rolfe D. Mandel Dr. Stephen H. Benedict Date defended: September 10 th , 2008
Transcript
i
Mitochondrial DNA and Y-Chromosome Variation of Eastern Aleut
Populations: Implications for the Genetic Structure and Peopling of the
Aleutian Archipelago
By
Mark Zlojutro
M.A., University of Kansas, 2006
Copyright 2008
Submitted to the Department of Anthropology and the Faculty of the Graduate School of the University of Kansas in partial fulfillment of the requirements for the degree of
Doctor of Philosophy
Dr. Michael H. Crawford (Chairperson)
Dr. James H. Mielke
Committee members Dr. Felix Moos
Dr. Rolfe D. Mandel
Dr. Stephen H. Benedict
Date defended: September 10th, 2008
ii
The Dissertation Committee for Mark Zlojutro certifies that this is the approved version of the following dissertation:
Mitochondrial DNA and Y-Chromosome Variation of Eastern Aleut Populations:
Implications for the Genetic Structure and Peopling of the Aleutian Archipelago
Committee:
Dr. Michael H. Crawford (Chairperson)
Dr. James H. Mielke
Dr. Felix Moos
Dr. Rolfe D. Mandel
Dr. Stephen H. Benedict
Date approved: September 16th, 2008
iii
Abstract The Aleuts are the native inhabitants of the Aleutian archipelago off the southwest
coast of Alaska and, since Russian contact in 1741, have experienced a series of demographic transitions. This study investigates the impact of historical events on the genetic structure of the Aleut population through analysis of mitochondrial and Y-chromosome DNA variation in five eastern Aleut communities in relation to previous molecular research conducted on communities located further to the west.
Results from HVS-I sequencing and Y-SNP and Y-STR typing reveal patterns of
variability that exhibit geographic differentiation in an east-west manner. Mitochondrial haplogroups A and D represent the two major maternal lineages observed in the Aleut samples, with haplogroup D more prevalent in the Pribilofs and island groups located to the west. This distribution pattern is likely the result of founder effect related to the forced population resettlements organized by Russian fur traders in the late 18th and early 19th centuries. In the eastern Aleutian Islands and lower Alaska Peninsula, higher frequencies of haplogroup A and its subclades were observed and based on archaeological and phylogeographic evidence may represent the genetic signature of sustained cultural and demic exchange with neighboring Eskimo and Na-Dene groups. The relationship between geography and mtDNA variation is further evident from the highly significant correlation of geographic and genetic distance matrices (r = 0.717) and the decreasing correlogram of spatial autocorrelation values that present a clinal pattern to mtDNA structure. For the Aleut Y-chromosomes, the vast majority were characterized to European haplogroups (approximately 85%), which contrasts the mtDNA picture that reveals only 6.1% non-native matrilines in the eastern region and thus indicating asymmetrical gene flow between European men and Aleut women. Russian paternal lineages are common in the western islands, whereas the predominantly Scandinavian patriline I1a is observed at elevated frequencies in the eastern communities, a consequence of the American purchase of Alaska and the subsequent influx of Scandinavian and US European fishermen into the region. The application of Monmonier’s algorithm and genetic surface interpolations for both genetic systems reveal geographic zones of discontinuity at Umnak and Akutan Islands, underscoring the east-west substructure for the Aleut population. Lastly, phylogeographic analysis of mtDNA data and the results of recent ancient DNA studies suggest that subhaplogroup D2 evolved in Beringia and may represent the ancestral gene pool for both Paleo-Eskimos and Aleuts.
Overall, this study identifies a significant relationship between geography and genetic
variation in the Aleut population, with a distinct substructure along an east-west axis. These regional differences are due to a combination of historical founder effects, male-biased gene flow from European populations, and the peopling of the Aleutian Archipelago during the postglacial period.
iv
I dedicate this dissertation to my loving family.
v
Acknowledgements
I am grateful to all the Aleuts who participated in this study and provided the necessary DNA samples and family history information. I would also like to thank: Dr. Michael Crawford for his conceptualization of the Aleut Research Program at the University of Kansas and guidance provided for this dissertation project; Liza Mack for her boundless energy in promoting the project in the various Aleut communities; and Dr. Christine Hanson for welcoming the research team into her home. Without them this study would not have been possible.
I would like to acknowledge my committee members for their valuable
feedback on the research study: Dr. Michael Crawford, Dr. James Mielke, Dr. Alan Redd, Dr. Rolfe Mandel, and Dr. Steve Benedict. I would also like to thank my collaborators on this project: Dr. Rohina Rubicz, Dr. Mike Grose, and Dr. Katherine Reedy-Maschner; my fellow students: Phil Melton, Kristen Young, Orion Graf, Kristie Beaty, Geetha Chittoor, Anne Justice, Jennifer Rack, and Chris Phillips-Krawczak; the office staff: Judy Ross, Carol Archinal, and Kathleen Womack; and my family and friends for all their support.
This research was funded by NSF grants #OPP-990690 and #OPP-0327676
Anthropological Genetics Review …………………………………..………… 6 Early Research: From Classical to Molecular Markers ……................. 7 Mitochondrial DNA ……………..………………………...………….. 9 Y-Chromosome Markers ……………………………………………. 18 Peopling of the Americas ……………………………….……………. 30
Population Background ………………………………………………………. 38
Archaeology and Prehistory …………………………………………. 40 Aleut Society at Russian Contact …………….……………………… 47 Aleutian History ……………………………………………………… 50 Language …………………………………………………………….. 55 Morphology ………………………………………………………….. 56 Genetics ……………………………………………………………… 58
Summary …………………………………………………………………….. 63
CHAPTER THREE: MATERIALS AND METHODS …………………………… 65
Figure 1 Human Mitochondrial Genome ……………….………..………..……. 10 Figure 2 Phylogeny of human mtDNA from five geographic regions …….……. 15 Figure 3 Evolutionary migration patterns of human mtDNA haplogroups ….…. 17 Figure 4 Diagram of structural variation in the human Y-chromosome …….…. 19 Figure 5 Pie charts of NRY haplogroup frequencies of global populations ……. 23 Figure 6 Differentiation of Y-chromosome macrohaplogroup F outside
Africa ………………………………………………………………….. 25 Figure 7 Application of genetic markers in NRY and mtDNA phylogenetic
reconstructions ……………………….………..………………………. 28 Figure 8 Distribution of mtDNA haplogroup frequencies among Native
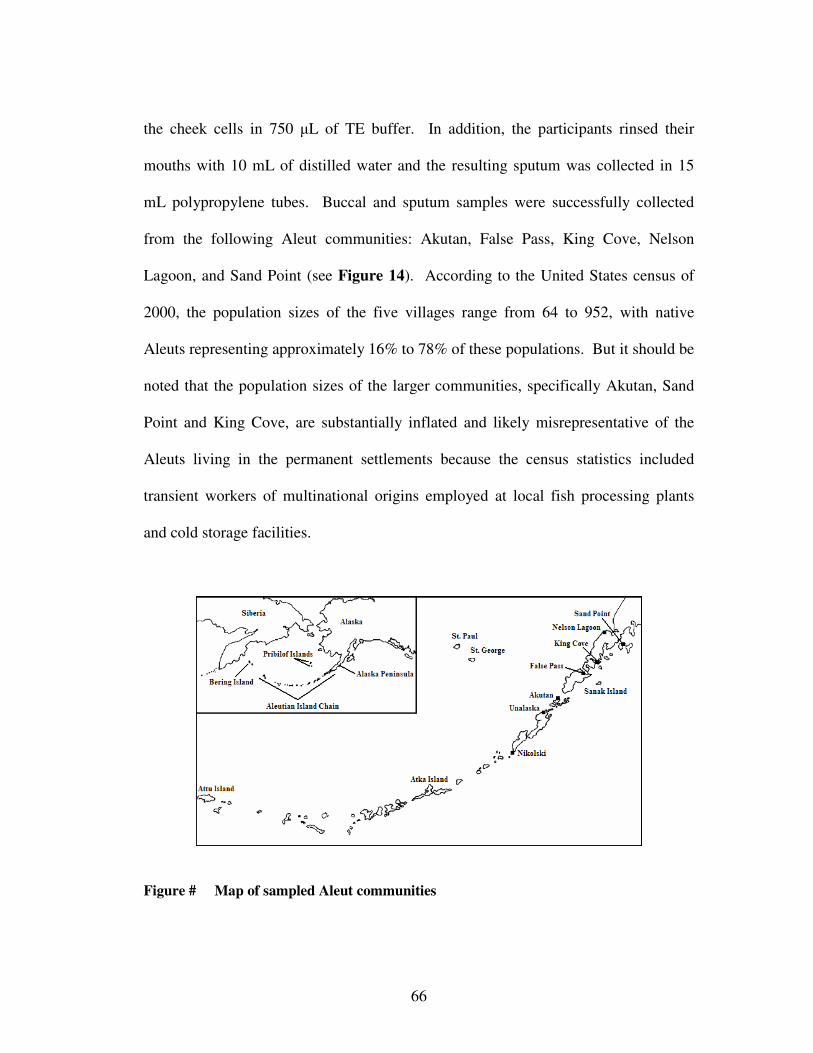
American populations ……………….…………………………………. 32 Figure 9 Maximum extent of North American ice sheets during last ice age ….. 33 Figure 10 Y-STR network for haplogroup R …………………..………………. 37 Figure 11 Map of the Bering Sea region ……………………….………………. 39 Figure 12 Map of the Aleutian Islands ……………………….…………………. 39 Figure 13 Geographic distribution of Aleut and Eskimo languages ………….…. 55 Figure 14 Map of sampled Aleut communities …………………………………. 66 Figure 15 Illustration of polymerase chain reaction (PCR) …………….………. 71 Figure 16 Illustration of gel electrophoresis ……………………….……………. 73 Figure 17 Explanation of electropherogram output from automated capillary
sequencer …………………………………………….………………. 75 Figure 18 Approximate locations of SWGDAM Y-STR loci ………..…………. 79 Figure 19 Concept of Tajima’s D neutrality test statistic ………………………. 85
Figure 20 Schematic of phylogeny construction by the Neighbor-Joining algorithm ……………………………………………………………... 90
Figure 21 Colaescent simulation of gene genealogy and corresponding
mismatch distribution ……………………………..…………………. 96 Figure 22 Example of Voronoï tessellation ………………….…...……………. 100 Figure 23 Circumcircle propertyof Delaunay triangulation ……………………. 100 Figure 24 Example of Delaunay triangulation-based connectivity network .…. 101 Figure 25 Example of barrier construction using Monmonier’s algorithm ……. 102 Figure 26 Map of pie chart frequencies of mtDNA haplogroups for Aleuts
and surrounding Beringian populations …………….………………. 115 Figure 27 Correlogram of autocorrelation statistic II for HVS-I data of Aleut
and Beringian populations ………………………….………………. 116 Figure 28 Median-Joining network for haplogroup A …………………………. 121 Figure 29 Median-Joining network for haplogroup D …………………………. 122 Figure 30 Neighbor-Joining tree based on DA distance matrix of HVS-I
data …………………………………………………………………. 125 Figure 31 PCA of R-matrix computed from haplotype frequencies …….……. 126 Figure 32 PCA biplot of R-matrix population coefficients and haplotype
scores ………………………………………………………………. 127 Figure 33 MDS plot of DA distance matrix and results of SAMOVA
analysis (K = 4) …………………………………….………………. 129 Figure 34 Application of Monmonier’s maximum difference algorithm to DA
distance matrix for HVS-I data ……………….……………………. 131 Figure 35 Genetic surface interpolation based on HVS-I data ………...………. 132 Figure 36 HVS-I diversity versus rii plot ………………………………………. 134 Figure 37 Mismatch distributions of mtDNA subclades for Aleut samples …... 135
Figure 38 Map of pie chart frequencies of Y-chromosome haplogroups for Aleut communities …………………………...……………………. 143
Figure 39 Median-Joining network of R1a Y-STR haplotypes …….…………. 145 Figure 40 Median-Joining network of R1b Y-STR haplotypes ………….……. 146 Figure 41 Median-Joining network of I1a Y-STR haplotypes ………..………. 147 Figure 42 Median-Joining network of N Y-STR haplotypes ……….…………. 147 Figure 43 Median-Joining network of Q Y-STR haplotypes ………….………. 148 Figure 44 Neighbor-Joining tree based on RST distance matrix of
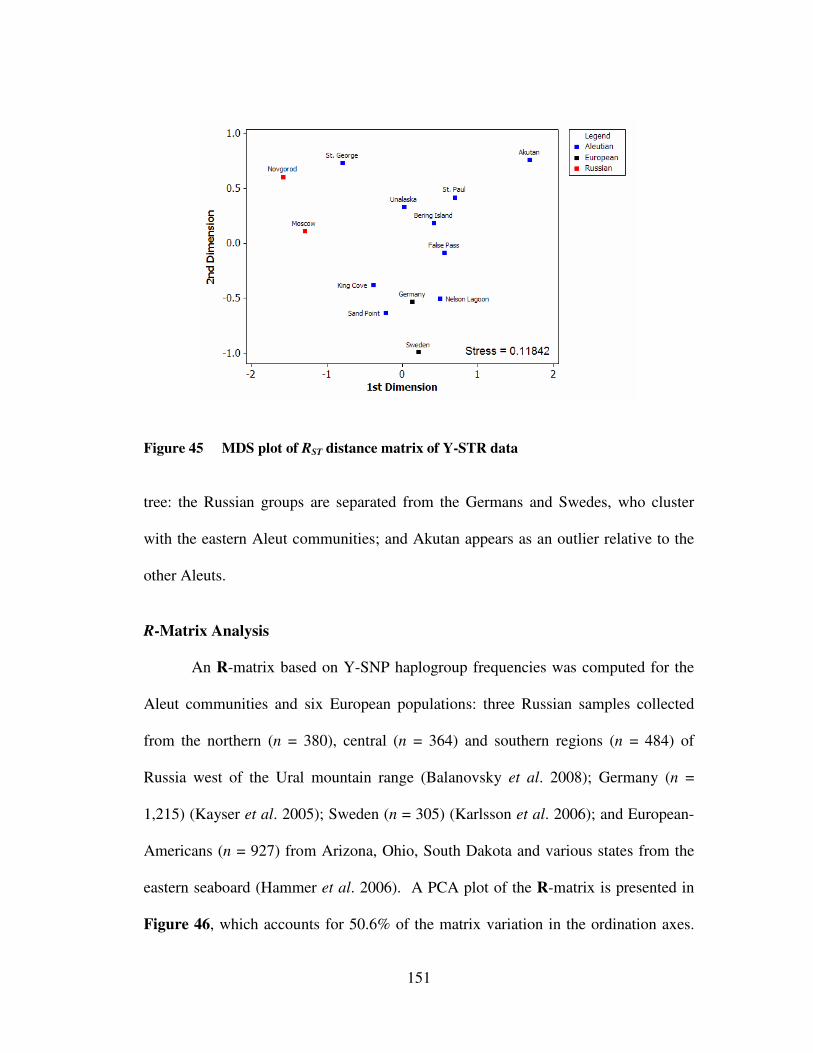
Y-STR data …………………………………………………………. 149 Figure 45 MDS plot of RST distance matrix of Y-STR data …………..………. 151 Figure 46 PCA of R-matrix computed from Y-SNP haplogroup
frequencies ……………………………………………………….…. 152 Figure 47 PCA biplot of R-matrix population coefficients and haplogroup
scores ……………………………………………….………………. 153 Figure 48 Map of pie chart frequencies of combined Y-chromosome
haplogroups for Aleut communities ……………...…………………. 154 Figure 49 Application of Monmonier’s maximum difference algorithm
to RST distance matrix for Y-STR data …………..…………………. 155 Figure 50 Genetic surface interpolation based on Y-STR data ……….………. 156 Figure 51 HVS-I diversity versus rii plot ………………………………………. 157 Figure 52 Map of pie chart frequencies of Russian and non-Russian
surnames in Aleut communities …………………………….………. 166 Figure 53 Human prehistoric dispersals into northern North America
according to the Gilbert et al. (2008) model ………………..………. 169
Table 1 Number of Aleut participants by community and sizes of corresponding data sets ……………………..…..…………………….. 57
Table 2 PCR primer pairs used in RFLP and HVS-I sequence analyses …….…. 72 Table 3 Y-chromosome STR repeat sequences and primer information ………. 80 Table 4 Primers for Y-SNP analysis ……………………………………………. 81 Table 5 HVS-I sequence data for Aleuts ………………………………………. 111 Table 6 Frequencies of mtDNA haplogroups for Aleut communities
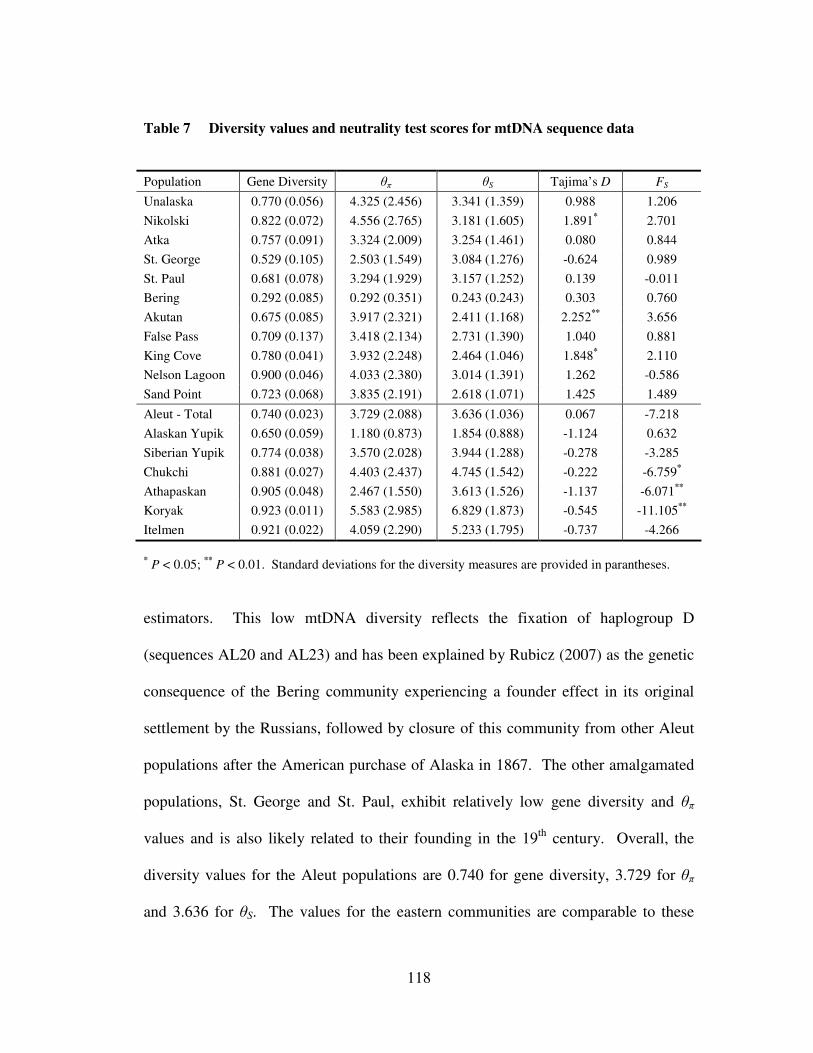
and native populations from Beringia …………………...……………. 113 Table 7 Diversity values and neutrality test scores for mtDNA sequence
data ……………………………………………………………………. 118 Table 8 Coalescent dates of mtDNA subclades for Aleut samples ……………. 136 Table 9 Y-chromosome haplotypes in Aleut communities ……………………. 139 Table 10 Diversity values for Y-STR haplotypes in Aleut populations …….…. 141 Table 11 Y-SNP haplogroup frequencies in Aleut communities ………………. 142
57 72 80 81 111 113 118 136 139 141 142
1
CHAPTER ONE: INTRODUCTION
Since the earliest human migrations across the exposed Bering Land Bridge
into the uninhabited lands of the Western Hemisphere, Native American populations
and their societies had evolved in relative isolation, producing specialized
technologies, complex belief systems and languages, and distinctive styles of art and
architecture that rival the accomplishments of the Classical civilizations that emerged
in Rome, Egypt and China. However, the cultural and biological divergence that
characterized the evolutionary trajectory of most ancient societies, both Old and New
World, began to dramatically change by the medieval period, as much of Eurasia and
Africa had become integrated through a combination of long-distance trade, direct
foreign investment and migration. This socio-economic development produced a
competitive geopolitical environment that spurred intercontinental exploration for
new trade routes and contact with formerly isolated populations, resulting in dynamic,
and often calamitous, relations. For Native Americans, contact occurred in 1492,
when Christopher Columbus and his expedition discovered the Caribbean Islands,
marking the beginning of an extensive period of Western European colonization in
the Americas and considered by some to be one of the most dramatic events of human
history (Ramenofsky 1987, Diamond 1997, Mann 2005).
The collision of Old World and New World societies led to a demographic
tragedy for most Native Americans. Based on ethno-historical and archaeological
evidence, it has been estimated that the population size of the New World was
reduced from over 44 million prior to European contact to only two or three million
2
in less than 100 years after the event (Crawford 1998). A number of factors are
believed to have contributed to this tremendous population crash, including: the
introduction of European diseases such as smallpox, measles, and influenza into
populations with no natural genetic resistance; war and violence as directed against
Native American resistance to European rule; economic exploitation in the form of
forced labor on plantations and hunting grounds; and population displacement and
disruption as a deliberate policy of Native American control by European colonies
and states. As a consequence, Native Americans generally exhibit lower levels of
genetic diversity relative to populations from other continents (Rosenberg et al.
2002), although the picture is complicated by the pervasive admixture of Western
European males into the native gene pools (Jobling et al. 2004).
For the native inhabitants of the Aleutian archipelago, located off the
southwest coast of Alaska, European contact was established much later in 1741 and
with a different European people, the rapidly expanding Russians. Unfortunately, the
Aleuts experienced a similar range of hardships at the hands of their colonizers:
disease epidemics, malnutrition, warfare and indiscriminate violence, population
relocations of laborers conscripted into the Russian fur trade industry, and forcible
abductions and rape of women. Substantial admixture occurred with the influx of
Russian explorers, merchants and clergyman into the region, producing a “Creole”
class that has permanently altered the genetic character of the Aleut people.
However, with the sale of Alaska to the United States in 1867, the uneasy relationship
between Aleuts and Europeans changed as a new wave of migrants began to enter the
3
archipelago, one dominated by Scandinavian and European American fishermen.
This development added a further layer of genetic complexity to the Aleut population,
in particular among the communities in the eastern region that were most heavily
impacted by the arrival of Scandinavian men.
In previous studies that characterized the genetic variation of Aleut
communities in the central and western Aleutians and neighboring island groups
(Rubicz et al. 2003, Zlojutro et al. 2006, Rubicz 2007), evidence was found for
substantial European male admixture based on Y-chromosome markers (73% to
90%), whereas maternal markers from the mitochondrial (mt)DNA belonged
exclusively to two Native American lineages, haplogroups A and D, representing the
genetic signature of the original peopling of the archipelago. Furthermore, in Aleut
communities established through Russian relocation on the Commander and Pribilof
Islands, a reduction in mtDNA diversity was observed, the evolutionary consequence
of founder effect.
This dissertation project contributes to earlier research by characterizing the
mtDNA and Y-chromosome variation in five eastern Aleut communities in order to
provide a more complete understanding of the genetic structure of the Aleut
population distributed throughout the archipelago and neighboring regions. The
study will attempt to identify zones of genetic discontinuity and evaluate the genetic
impact of historical processes, namely asymmetrical European gene flow by Russian
and Scandinavian men in the western and eastern regions respectively, population
reductions stemming from disease epidemics and warfare, forced relocations of Aleut
4
communities and families, and the peopling of the island chain during the postglacial
period.
Specifically, the objectives of the project are the following: (1) collect buccal
and sputum samples from Aleut participants residing in the eastern communities of
Akutan, False Pass, King Cove, Nelson Lagoon and Sand Point, and extract DNA
from the biological material; (2) sequence DNA samples for the hypervariable
segment I (HVS-I) of the mitochondrial organelle and type restriction cut sites
(RFLPs) for the purpose of mtDNA haplogroup assignment; (3) characterize the male
samples for Y-chromosome short tandem repeat (STR) loci and haplogroup-specific
single nucleotide polymorphisms (SNPs); (4) investigate the relationship between
genetic variation and geography through both spatial autocorrelation and the
identification of Aleut population substructure from geographic areas of genetic
discontinuity; (5) investigate the nature of European gene flow into the Aleut
population with regards to the degree of admixture, presence of gender asymmetry,
and regional differences that stem from the American purchase of the Alaska and the
resulting demographic transition in the eastern Aleutian Islands and lower Alaska
peninsula; and (6), based on the genetic results, evaluate different models for the
origins of the Aleut people and the prehistoric relationship of the eastern Aleut region
to neighboring Eskimo and Na-Dene populations from mainland Alaska and Kodiak
Island.
The chapters that follow include a review of the literature, the materials and
methods used in this study, a summary of the results, and a discussion of the findings.
5
Chapter two provides background information on the field of anthropological
genetics, as well as the Aleut people from archaeological, historic, linguistic and
genetic perspectives. The sampling, laboratory protocols, and analytical methods are
presented in chapter three. The results of the molecular genetic typing and
multivariate analysis are provided in chapter four, with a subsequent discussion in
chapter five. And lastly, the conclusions of the project are summarized in chapter six.
6
CHAPTER TWO: LITERATURE REVIEW
This chapter provides a brief overview of the field of anthropological genetics
and summarizes the historical narrative of human evolution as understood by the
phylogeographic analysis of human mitochondrial DNA and Y-chromosome
variation. In addition, an ethno-historical description of the Aleut population is
presented to the reader by reviewing the archaeological record for the Aleutian
Islands and historical accounts beginning with Russian contact in the 18th century, as
well as detailing the body of research conducted on the anthropometric and genetic
traits of the Aleut people.
Anthropological Genetics Review
Physical anthropology is a branch of anthropology that studies, among other
things, biological variation in contemporary human populations and the hominid
fossil record from an evolutionary framework. Moreover, the discipline is considered
a “historical science” that applies modern evolutionary theory to the reconstruction of
human prehistory. Different types of evidence are typically available to test historical
hypotheses, which include written texts, historical linguistics, the archaeological
record, paleontological remains, paleoclimatology, and comparative anthropometrics.
And with the many advances achieved in molecular biology during the latter half of
the twentieth century, human genetic variation has been added to this list, providing
anthropologists with a powerful means of understanding our evolutionary past.
7
With its roots in evolutionary biology, population genetics, and physical
anthropology, anthropological genetics is an amalgamated discipline that investigates
the processes of human evolution, the human migratory patterns out of Africa, and
the resulting distribution of human variation, which includes complex diseases
(Crawford 2007a). According to the seminal volume Methods and Theories of
Anthropological Genetics (1973), which helped to initially define the methods and
research goals for this rapidly growing field, an emphasis tends to be placed on
human genetics in non-Western, highly isolated populations, with a consideration for
the biocultural perspective on human evolution and disease etiology. The discipline
today is a dynamic one that is largely impacted by developments in molecular biology
and bioinformatics, which have made tens of thousands of human genetic markers
available for analysis, including entire genomes, and contrasts the earliest research
that focused on a limited number of classical polymorphisms.
Early Research: From Classical to Molecular Markers
At the beginning of the twentieth century, the Austrian physician Karl
Landsteiner (1901) characterized the ABO red blood cell system and, based on its
Mendelian mode of inheritance, provided the first genetic marker for the measure of
human genetic variation. The first known study of population genetic variation was
Ludwik and Hanka Hirszfeld’s (1919) survey of ABO blood types among military
personnel from several different national armies fighting on the Balkan front in World
War I. In the following decades, additional human blood groups and HLA types were
immunologically identified, such as Rhesus, MNS and Duffy (Landsteiner and Levine
8
1928, Landsteiner and Wiener 1940, Cutbush et al. 1950, Bodmer et al. 1966),
revealing allele frequency differences between regional populations and,
unfortunately, contributing to the formation of a variety of human typologies and
classifications that were in some instances misused to support racial ideologies
(Pearson 1959, Montagu 1964).
In the 1960s, many more genetic markers were made available for analysis by
the earlier development of protein electrophoresis, a method for separating proteins in
an electric field on the basis of their size and charge (Smithies 1955, Hunter and
Markert 1957). Most of these proteins represent red cell antigens, enzymes and
serum proteins, and are collectively referred to as “classical polymorphisms.” The
first studies of human genetic variation conducted by anthropologists began around
this period, such as Frederick Hulse’s (1955, 1957) examination of blood variation in
Native Americans and linguistic barriers to gene flow, and Frank Livingstone’s
(1958, 1960) research on sickle-cell hemoglobin and malaria. By the 1970s,
anthropological genetics was an active field of research, with an increased focus on
the relative effects of evolutionary mechanisms on the patterns of genetic variation
within and between local populations and a corresponding shift away from traditional
classification and taxonomy of human groups (O’Rourke 2003). This was later
complemented by a number of studies examining genetic variation at regional or
continental levels, in particular the comprehensive review and multivariate analysis of
human classical polymorphisms in the volume The History and Geography of Human
Genes by Cavalli-Sforza et al. (1994), which pioneered the use of synthetic gene
9
frequency (PC) maps in order to identify the origins and scope of major human
migration events.
However, with the advent of new laboratory methods in the 1970s for directly
characterizing DNA sequences (i.e., recombinant DNA and sequencing technology),
a new class of “molecular markers” began to be increasingly examined by
anthropologists, in particular restriction fragment length polymorphisms (RFLPs)
used in linkage analyses of disease phenotypes (Botstein et al. 1980) and genetic
investigations of human origins (Johnson et al. 1983). Molecular markers are more
informative than polymorphic blood groups and proteins, with a greater degree of
variation generated from an Infinite Sites Model (ISM) of genetic mutation. But it
was not until the invention of the polymerase chain reaction (PCR) by Kary Mullis in
1984, a method for rapidly synthesizing many copies of a specific segment of DNA,
that researchers were able to cheaply and extensively characterize human genomic
variation, and in the process identify a number of genetic systems that are considered
well-suited for questions concerning human evolutionary history.
Mitochondrial DNA
Since the dawn of the “molecular revolution”, one of the most widely studied
human genetic systems has been mitochondrial DNA (mtDNA), a circular molecule
averaging 16,569 base pairs (bp) in length located within mitochondria, the cellular
organelles responsible for energy production (see Figure 1). The human mtDNA can
be divided into two regions: a coding region of approximately 15,000 bp that contains
37 different genes (22 transfer RNAs, 13 proteins, and two other RNAs) that are
10
Figure 1 Human mitochondrial genome
Interior labels represent genes located on the light strand of the mitochondrial genome, and conversely, exterior ones are genes on the heavy strand. The OH and OL labels identify the origins and directions of the syntheses of the heavy and light strands, respectively. PH and PL are the origins and directions for the transcription of genes on the heavy and light strands.
linked and inherited as a single unit; and the non-coding displacement loop (D-loop)
or control region that regulates the replication of mtDNA and gene expression. The
control region is further subdivided into three hypervariable segments: HVS-I,
574 (Malyarchuk et al. 2002). [Note, the numbering system for mtDNA nucleotide
positions is based upon the first complete sequence produced by Anderson et al.
(1981), commonly referred to as the Cambridge Reference Sequence or CRS]. A
large number of base substitutions and indels identified within the coding region have
been linked to a variety of mitochondrial disorders that affect organs with a high
energy requirement, such as Kearns-Sayre syndrome and progressive encephalopathy.
Although the human mitochondrial genome is only about 0.0005% the size of
the nuclear genome, there are five features that make it particularly useful for
assessing the evolutionary history of closely related populations. First, mtDNA
mutates about five to ten times faster than nuclear DNA, at 2-4% per million years
(Brown et al. 1982). Within the mtDNA molecule, the control region, despite its
functional importance, has a mutation rate ten times higher than that of the coding
region (Francalacci et al. 1999). However, the control region variability is not evenly
distributed, with the highest density of polymorphic positions found in the HVS-I and
HVS-II regions (Lutz et al. 1998; Chen et al. 2002). Overall, the rapid rate of
sequence divergence of mtDNA makes it suitable for investigating short-term
evolutionary phenomena. Second, although each cell contains only a single copy of
nuclear DNA, it has several hundred copies of mtDNA (up to 1,000 per cell) (Robin
and Wong 1988). The high copy number facilitates the analysis of degraded
contemporary samples and ancient DNA. Third, mtDNA is maternally inherited,
meaning that it is passed from the mother to all her offspring, both sons and
daughters, but it is only the daughters who pass it onto the subsequent generation
12
(Giles et al. 1980). Sperm mitochondria disappear early in embryogenesis by
selective destruction, inactivation, or simple dilution by the vast surplus of oocyte
mitochondria. Thus, mtDNA analysis can provide insight into female-specific
processes. Fourth, because inheritance occurs only from a single parent there is no
recombination, which removes its confounding effects from gene trees or networks
and allows for clearer interpretations of mutational pathways. And fifth, the low
effective population size due to the haploid character of mtDNA leads to increased
genetic drift, which generates geographic structure for mtDNA variation (i.e.,
continent-specific lineages).
There are, however, a number of issues concerning the use of mtDNA in
anthropological genetic studies. The most pressing is the anomalous patterns of
human variability that have been identified in HVS-I sequence data, which has been
largely attributed to mutation “hotspots” (Malyarchuk et al. 2002, Galtier et al. 2006),
but has prompted others to suggest the effects of recombination (Eyre-Walker et al.
1999; Hagelberg 2003; Piganeau et al. 2004). The possibility of recombination stems
from a limited number of studies that claim to have observed leakage of paternal
mtDNAs in offspring (Schwartz and Vissing 2002, Williams 2002, Zhao et al. 2004).
If recombination does in fact occur, then some of the assumptions from which
phylogeographic analysis of human mtDNA is conducted need to be reconsidered.
Another important issue regards the discrepancy in mtDNA mutation rates estimated
from either phylogenetic or family pedigree approaches. The pedigree-based
mutation rates for the control region are approximately 5-10 times higher than those
13
derived from phylogenetic considerations (Pakendorf and Stoneking 2005), which
clearly have important implications for coalescent dating of mitochondrial ancestors
(refer to Chapter Three: Materials and Methods for a more a detailed discussion on
this topic). Lastly, several studies based on genetic data for the coding region have
suggested that natural selection has significantly shaped mtDNA variation (Nachman
et al. 1996, Moilanen et al. 2003, Ruiz-Pesini et al. 2004). As a consequence, there is
strong disagreement by some on whether the distribution of continent- and region-
specific human mtDNA clades or haplogroups is due to adaptation to different
environmental conditions or a product of random genetic drift and purifying selection
that is responsible for eliminating many nonsynonymous mutations (i.e., point
mutations that result in the coding for different amino acids). It is often assumed that
mtDNA, or at least for the control region, is neutral and that genetic differences
between any two individuals is mostly due to mutation and genetic drift. Thus, the
mathematical models developed for reconstructing human evolutionary history from
mtDNA variation are based on the mechanisms of mutation and drift.
Research into human mtDNA as a source of molecular markers was pioneered
by Wesley Brown and Douglas Wallace in the late 1970s. In these “pre-PCR” days,
characterization began with RFLP analysis, digesting the molecule with either a
single restriction enzyme applied to a large number of samples (Denaro et al. 1981)
or several enzymes on a few samples (Brown 1980). Later studies tended to use five
or six enzymes on large sample sets (Johnson et al. 1983, Santachiara-Benerecetti et
al. 1988, Scozzari et al. 1988). The resulting “low-resolution” RFLP data from these
14
early studies were soon applied to questions concerning human origins, an area of
research that had produced substantial controversy since Vincent Sarich and Allan
Wilson’s (1967) study that estimated the divergence of the hominid lineage from
other ape species at approximately 5 million years using serum albumins. Based on
the RFLP data, global phylogenies were constructed that had star-like appearances: a
single, central RFLP haplotype shared among individuals from all over the world that
radiated other mtDNA types, some of which were population-specific. This central
haplotype was assumed to be the most recent common ancestor for human mtDNAs
and was interpreted by some as support for the “multi-regional” model for human
evolution, the notion that modern humans had evolved from archaic ancestors in
many different parts of the world (Excoffier and Langaney 1989, Templeton 1992).
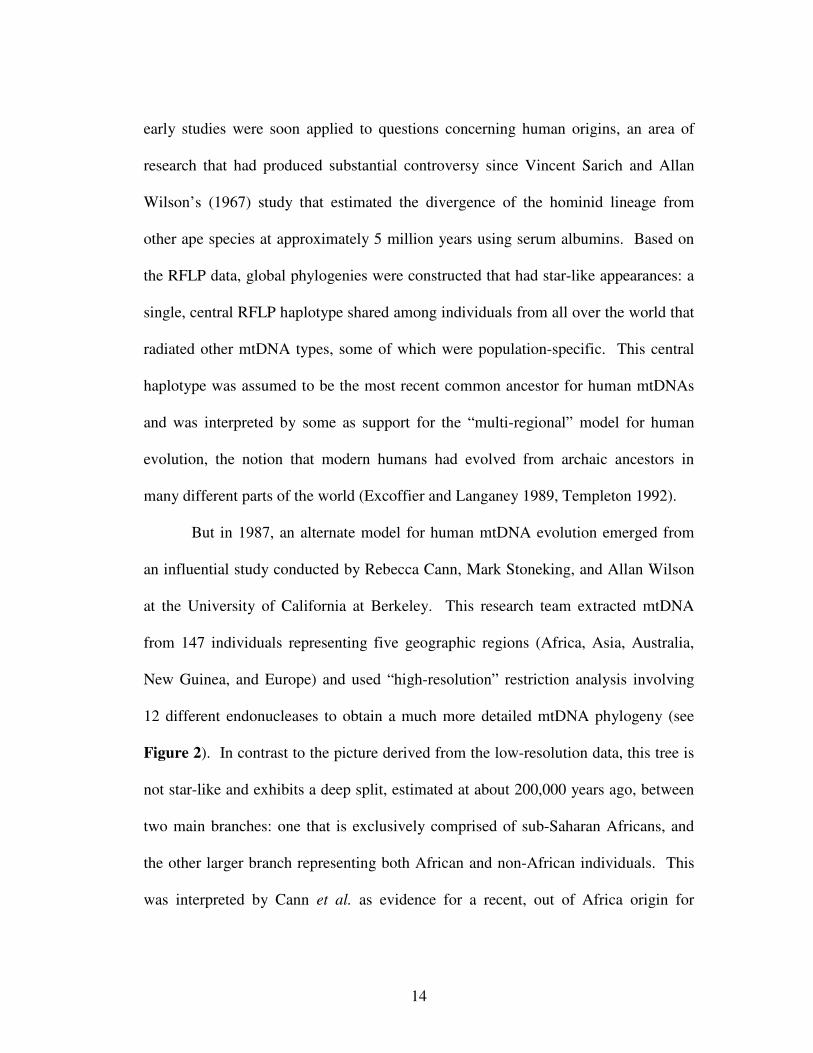
But in 1987, an alternate model for human mtDNA evolution emerged from
an influential study conducted by Rebecca Cann, Mark Stoneking, and Allan Wilson
at the University of California at Berkeley. This research team extracted mtDNA
from 147 individuals representing five geographic regions (Africa, Asia, Australia,
New Guinea, and Europe) and used “high-resolution” restriction analysis involving
12 different endonucleases to obtain a much more detailed mtDNA phylogeny (see
Figure 2). In contrast to the picture derived from the low-resolution data, this tree is
not star-like and exhibits a deep split, estimated at about 200,000 years ago, between
two main branches: one that is exclusively comprised of sub-Saharan Africans, and
the other larger branch representing both African and non-African individuals. This
was interpreted by Cann et al. as evidence for a recent, out of Africa origin for
15
Figure 2 Phylogeny of human mtDNA from five geographic regions (Cann et al. 1987) Tree is based on mtDNA RFLP profiles of 147 individuals (represented by filled-in circles, triangles and squares) relative to the Cambridge Reference Sequence (CRS). The two main branches, one comprised of African individuals and the other with both Africans and non-Africans, are labeled as ‘I’ and ‘II’, respectively.
modern humans, and whose African ancestor was dubbed “Mitochondrial Eve”.
Since then a number of studies based on mtDNA sequence data have supported the
“Out of Africa” scenario for human evolution (Vigilant et al. 1991, Watson et al.
1997, Ingman et al. 2000, Herrnstadt et al. 2002), although the topic is still hotly
16
debated (Takahata et al. 2001, Templeton 2002, Eswaran et al. 2005, Relethford
2008).
During the early 1990s, a more refined picture of the human mtDNA
phylogeny began to emerge with the application of high-resolution RFLP analysis to
population samples from one continent at a time (Schurr et al. 1990, Ballinger et al.
1992, Chen et al. 1995, Torroni et al. 1996). These analyses were first performed at
the laboratory of Douglas Wallace at Emory University in Atlanta, showing that
mtDNA variation could be classified into a small number of monophyletic clades, or
haplogroups, characterized by one or several restriction sites located primarily in the
coding region. In later studies, the focus began to shift towards the direct sequencing
of the control region because of its greater variation (Ingman and Gyllensten 2001),
which allowed for more robust investigations of population differentiation at the
regional level and the identification of additional subhaplogroups.
The geographic distribution and evolutionary relationship of the human
mtDNA haplogroups can be summarized in the following fashion. To begin, the
large majority of African mtDNAs belong to the “L clades”, namely haplogroups L1,
L2, and L3. Africa contains the greatest level of mtDNA diversity in the world, with
deep phylogenetic branches that are exclusively sub-Saharan (Zietkiewicz et al. 1998,
Ingman et al. 2000). As noted above, this has been interpreted by many as evidence
for a recent African origin for modern humans. All non-Africans today are descended
from an L3 type, which gave rise to two founder (macro)haplogroups outside the
African continent, M and N, which are defined by the presence or absence of RFLP
17
Figure 3 Evolutionary migration patterns of human mtDNA haplogroups
(www.anthropology.net)
cut sites at np 10394 (endonuclease DdeI) and np 10397 (AluI) (see Figure 3). From
the divergence dates computed for these two founder lineages and its subclades,
which are often simple conversions of mtDNA diversity into absolute time using an
estimated mutation rate, the out-of-Africa migrants appear to have split along
different routes approximately 60,000 years ago (Forster and Matsumura 2005). The
earliest of these was a tropical coastal route along southern Asia that was ultimately
responsible for introducing modern humans to Australia and Papua New Guinea by
about 46,000 years ago as indicated by the archaeological record (Barker et al. 2002,
Bowler et al. 2003). The northern Eurasian migrants, on the other hand, would have
encountered harsher conditions, such as terrain, Neandertals, and a sharply fluctuating
climate during the earlier stages of the last Ice Age. In the period from 30 to 60
18
thousand years ago, Eurasians gained tenuous footholds in the Old World, and their
M and N mtDNAs mutated into descendant haplogroups, which are still continent- or
region-specific today (Forster 2004). In Europe, the main haplogroups are H, I, J, K,
T, U, V, W and X, which all belong to macrohaplogroup N. In East Asia, the primary
haplogroups are A, B, C, D, F, G, M*, Y and Z, although with important regional
differences (Kivisild et al. 2002, Tanaka et al. 2004). The picture in Central Asia is
more complex, with a mixture of both western and eastern Eurasia haplogroups that is
likely to be the product of recent gene flow due to continental trade routes and
empire-building (Comas et al. 2004). Finally, with regards to the peopling of the
Americas, there is a general consensus that ancestral Native American populations
originated from Asia and migrated over the Bering Land Bridge during the last glacial
maximum approximately 20,000 years ago, introducing haplogroups A, B, C and D,
with a small percentage of X (Torroni et al. 1992, 1993a, Brown et al. 1998).
Y-Chromosome Markers
In addition to mtDNA, the non-recombining portion of the Y-chromosome
(NRY) also possesses genetic properties well-suited for investigating human
evolution but for male-specific demographic processes. This genetic system has been
characterized for a growing number of microsatellite (STR) loci and single nucleotide
polymorphisms (SNPs) and has provided anthropologists with an important
complementary picture to the mtDNA results.
The human Y-chromosome is one of two sex-determining chromosomes,
spanning approximately 58 million bases (Mb) and representing about 1% of the
19
diploid DNA content, and is substantially smaller than the X-chromosome that is
roughly 165 Mb. The Y-chromosome contains 90 known protein-coding genes, of
which 23 are novel, and over 60,000 SNPs have been identified (statistics obtained
from the Ensembl genome browser, an online database for large eukaryotic genomes).
A schematic diagram of the Y-chromosome is provided in Figure 4. The centromere
(CEN) is comprised of heterochromatic sequences (~1 Mb) and separates the short
arm (Yp) from the long arm (Yq). The NRY, also commonly referred to as the male-
specific region of the Y-chromosome (MRY), is flanked by two pseudoautosomal
regions (PAR1 and PAR2) that undergo meiotic pairing and exchange with the X-
chromosome (Vogt et al. 1997), although PAR2 shows a much lower frequency of
recombination than PAR1 and is not necessary for fertility (Kvaloy et al. 1994; Li
and Hamer 1995; Kuhl et al. 2001). The majority of the distal long arm of the Y-
chromosome is comprised of a heterochromatin block of about 30 Mb, which is
Figure 4 Diagram of structural variation in the human Y-chromsome (Repping et al.
2006) The structures depicted include the centromere (CEN), pseudoautosomal regions (PAR1 and PAR2), heterochromatin blocks, and three classes of NRY euchromatin: X-transposed, X-degenerate, and ampliconic.
20
assumed to be genetically inert and polymorphic in length because of two highly
repetitive sequences families, DYZ1 and DYZ2 (Quintana-Murci and Fellous 2001).
The NRY’s euchromatin is roughly 25 Mb and is a mosaic of three classes of
sequences: X-transposed, X-degenerate, and ampliconic (Skaletksy et al. 2003). The
X-transposed sequences are 99% identical to DNA sequences in Xq21, a band in the
human X-chromosome, and exhibits the lowest density of genes and the highest
density of interspersed repeat elements (Venter et al. 2001). The X-degenerate
segments of the NRY contain single-copy genes or pseudogene homologues of X-
linked genes, which exhibit between 60-96% nucleotide sequence similarity. And the
third class of euchromatic DNA, the ampliconic segments, is primarily composed of
sequences highly similar to other sequences in the NRY and harbor the majority of
the Y-chromosome genes, most of which are related to male-specific functions, such
as male sex determination (SRY) and spermatogenesis.
Based on the organization and variability of these euchromatic classes, a
multi-tiered evolutionary model has been proposed for the Y-chromosome (Lahn and
Page 1999, Skaletsky et al. 2003), in which the sex chromosomes co-evolved from an
ordinary pair of autosomes approximately 300 million years ago when mammals
diverged from avian and reptilian lineages, with the X-degenerate and ampliconic
regions representing the earliest “evolutionary strata”. Interestingly, the rapid
degradation of the Y-chromosome since its early divergence from the X (which is
likely due to the effects of “Muller’s ratchet” and/or mutation processes particular to
21
this chromosome) and the acquisition of male-specific roles by the majority of Y-
chromosome genes has led some researchers to conclude that it is undergoing a neo-
functionalization towards male reproduction (Fernandes et al. 2004, Repping et al.
2004, Graves 2006), even to go as far as to suggest the eventual disappearance of the
chromosome in the human species (Aitken and Graves 2002).
The search for polymorphic sites on the NRY that would be useful to
anthropological genetics began relatively slowly, with the first RFLP identified in
1985 (Casanova et al. 1985, Lucotte and Ngo 1985). By the end of 1996 fewer than
60 NRY polymorphisms had been published, of which only 11 could be genotyped by
PCR (Hammer 1994, Seielstad et al. 1994, Hammer and Horai 1995, Santos et al.
1995, Whitfield et al. 1995, Jobling et al. 1996, Underhill et al. 1996). The primary
reason for this slow development is the low level of polymorphisms in the NRY
relative to any other region in the human genome (Hammer 1995, Thomson et al.
2000, International SNP Map Working Group 2001). Estimates based on sequencing
work show an average of one nucleotide substitution per 10,000 bp between two
randomly drawn NRY sequences. This compares with a whole-genome rate of one
SNP for every 1,000 to 2,000 bp (International Human Genome Sequencing
Consortium 2001, Kruglyak and Nickerson 2001, Venter et al. 2001). These
differences in diversity levels likely stem from the effective population sizes of the
autosomal and sex chromosomes, in which the Y-chromosome is expected to be one-
quarter of the effective size of any diploid autosome, one-third of that of the X-
chromosome, and similar in size to the haploid mtDNA. Therefore, assuming the
22
same mutation processes act on all chromosomes, one would expect lower sequence
diversity and greater susceptibility to the effects of genetic drift, leading to increased
rates of differentiation between Y-chromosomes in different populations (Jobling and
Tyler-Smith 2003).
In the late 1990s, there was a dramatic increase in the number of markers
discovered and populations assayed. This was largely due to a new method for
mutation detection, denaturing high performance liquid chromatography (DHPLC), in
which heteroduplexes are detected by their altered retention time on chromatography
columns under near-denaturing conditions. DHPLC was used to discover more than
200 new PCR-based SNPs and small insertions/deletions (indels) in the NRY
(Underhill et al. 1997, 2000, Shen et al. 2000, Hammer et al. 2001). These types of
polymorphisms have low rates of parallel and back mutation, which make them
particularly suitable for identifying paternal lineages or haplogroups that can be
traced back thousands of years (Hammer and Zegura 2002). Based on a
nomenclature system similar to mtDNA, Y-chromosome haplogroups are designated
by capitalized Roman letters (Y and A-R), with nested subclades named using an
alternating alphanumeric system with lower case letters. Paragroups, which are
lineages that are not defined by the presence of a derived marker, are indicated by an
asterisk after the clade designation (for example, P*).
Haplogroup Y is the most inclusive clade, comprising haplogroups A-R. The
position of the root in the human NRY tree falls between A, which is defined by the
SNP marker M91, and haplogroups B-R that encompass the rest of the tree. The
23
various dates estimated for the most recent common ancestor of human Y-
chromosomes range from 40,000 to 140,000 years (Pritchard et al. 1999, Thomson et
al. 2000, Hammer and Zegura 2002). The global distribution of the major NRY
haplogroups is presented in Figure 5. Similar to the phylogeographic structure of
mtDNA variation, two highly diverse haplogroups, A and B, are restricted to African
populations, with the remaining lineages distributed both within and outside the
African continent (Underhill et al. 2001). This pattern in which non-Africans carry a
subset of African diversity supports the “Out of Africa” model for the origins of both
NRY and mtDNA variation (Hammer et al. 1998, Underhill et al. 2000). The main
African lineages, however, are haplogroup E3a, which exhibits a strong
Figure 5 Pie charts of NRY haplogroup frequencies of global populations
(www.scs.uiuc.edu/~mcdonald/WorldHaplogroupsMaps.pdf) Map represents patterns of Y-chromosome variation prior to widescale European expansion beginning around 1500 AD.
24
correspondence with the distribution of Bantu speakers in the sub-Sahara (Underhill
et al. 2000, Cruciani et al. 2002), and haplogroups E3b2 and J*, which are common in
North Africa (Arredi et al. 2004).
The SNP marker M168 is shared by essentially all non-African Y-
chromosomes and represents one of the genetic signatures of the recent modern
human migrations outside of Africa. This Y-SNP has been dated to about 68,500
years (95% probability interval of 56,400 to 80,600) by Hammer and Zegura (2002),
which predates the time estimates for ancient demographic expansions based on
HVS-I mismatch distributions that average approximately 40,000 years (Sherry et al.
1994). Collectively, these genetic dates roughly coincide with the Middle-Upper
Paleolithic boundary, an archaeological period that exhibits increased variability and
geographic distribution of lithic tools belonging to the Upper Paleolithic traditions
generally associated with modern humans (Klein 1992).
The M168 lineages evolved into three distinct subclusters: haplogroup C;
haplogroups D and E that acquired the Alu insertion YAP; and macrohaplogroup F,
which includes lineages F-R. Haplogroup C is currently found throughout Asia and
Oceania (Redd et al. 2002b, Deng et al. 2004, Kayser et al. 2006), and based on its
wide distribution and relative high frequency in Central Asia is considered by some to
represent the patriline of Genghis Khan (Zerjal et al. 2002). Haplogroup D is limited
to Asian populations, predominantly the Japanese and Tibetans, as well as Southeast
Asians at low frequencies (Su et al. 1999, 2000, Qian et al. 2000, Underhill et al.
25
2000, Karafet et al. 2001), and may potentially have been apart of the earliest
southern migration out of Africa along with haplogroup C (Underhill et al. 2001).
The third large sub-cluster of M168 lineages is believed to have first evolved
in East Africa, from where it dispersed to Eurasia through the Levantine corridor
around 45,000 years ago and gave rise to the pronounced geographic expansion of
Upper Paleolithic assemblages 30,000 to 40,000 years ago (see Figure 6). The early
diversification of this macrohaplogroup resulted in at least four major Y-chromosome
patrilines: (i) the eastward expansion of haplogroup H into Pakistan and the Indian
Figure 6 Differentiation of Y-chromosome macrohaplogroup F outside Africa
(www.anthropology.net)
26
subcontinent, where today it is primarily found (Cordaux et al. 2004; Sahoo et al.
2006); (ii) the migration of macrohaplogroup K (defined by M9 and dated to about
35,600 years) towards Central Asia and subsequently dispersing throughout Eurasia
and the Americas, and ultimately differentiating into several distinct lineages
(paragroup K* and haplogroups L-R); (iii) the rise of a north Asian lineage
characterized by markers M45 and M74, representing the ancestral clade of
haplogroups P, Q and R; and (iv) the evolution of a lineage specific to northeast
Asian, haplogroup O (Deng et al. 2004).
From this early distribution of ancestral partilines, a number of more recent
population expansions and migration events are responsible for producing the current
pattern of Y-chromosome variation we see today. The N3 haplogroup of the M9
lineages is believed to have been carried from eastern Siberia or China across Eurasia
into northern Europe by large-scale migrations of Uralic-speaking peoples (Zerjal et
al. 1997, Pakendorf et al. 2006). Another M9 lineage, haplogroup M dispersed into
Southeast Asia and eventually reached New Guinea where it now predominates
(Kayser et al. 2006). From the north Asian M45/M74 lineages, haplogroup R
expanded south into Central Asia and northern India-Pakistan, and westwards into
Europe, where today there are very high frequencies of subclades R1a and R1b
(Semino et al. 2000, Alonso et al. 2005, Kayser et al. 2005). Other lineages from the
M45/M74 cluster, haplogroups P and Q, also dispersed widely across the Asian
northern steppes into Central Asia and northern India-Pakistan, with haplogroup Q3
27
later spreading from south Siberia and/or the Amur River region to the Americas
(Schurr 2004). Closer to Africa, haplogroups E3b and J have high frequencies in the
Mediterranean basin and the Middle East and are believed to have dispersed into
Europe as a consequence of a Neolithic demic expansion (Semino et al. 2000,
Chikchi et al. 2002). And lastly, haplogroup I is common in Europe and the Middle
East, with particularly high frequencies of subclades I1a and I1b in Scandinavia and
the Balkans, respectively (Rootsi et al. 2004, Marjanovic et al. 2005).
In addition to SNP markers, microsatellites or short tandem repeats (STRs)
have also been typed for human Y-chromosomes. STRs are DNA sequences that
consist of repetitions of 2-6 bp motifs and the number of repeats within STRs often
varies between individuals due to high mutation rates relative to Y-SNPs (Heyer et al.
1997, Kayser et al. 2000, Nachman and Cromwell 2000, Xu et al. 2000), making
them useful markers in gene mapping, forensic investigations, and evolutionary
studies. STRs from the NRY have been particularly important for forensic cases
involving sexual assault or paternity testing (Gill et al. 1985, Betz et al. 2001, Rolf et
al. 2001), and have increasingly been used in combination with Y-SNPs to produce
refined phylogenies that differentiate male patrilines (or haplotypes) within
haplogroups and provide diversity estimates of the NRY clades (see Figure 7). By
2002, a total of 53 different Y-STRs were characterized (Chen et al. 1994, Mathias et
al. 1994, Jobling et al. 1996, Kayser et al. 1997, White et al. 1999, Ayub et al. 2000,
Iida et al. 2001, 2002, Bosch et al. 2002, Redd et al. 2002a), a subset of which was
28
Figure 7 Application of genetic markers in NRY and mtDNA phylogenetic
reconstructions (modified figure from Schurr 2004)
used to develop standard forensic databases in Europe and the United States (e.g., Y-
Chromosome Haplotype Reference Database or YHRD). This was soon followed by
a comprehensive survey conducted by Kayser et al. (2004), discovering 166 new Y-
STRs from a sample of eight Y-chromosomes representing different NRY
haplogroups. Based on these data, the authors investigated the capacity of Y-STRs in
resolving deep phylogenetic relationships by constructing a series of trees using sets
of 100 loci. The results were the Y-STR tree outputs all differed from one another
and from the Y-SNP phylogeny, and thus confirming the ineffectiveness of this class
of markers to produce robust resolutions of deep lineages.
Overall, the diversity statistics for NRY markers reveal regional differences.
In a Y-SNP study by Hammer et al. (2001) involving 50 global populations, African
samples exhibited the highest mean number of pairwise differences, indicating a large
29
degree of differentiation between NRY lineages, whereas Native Americans produced
the lowest value, which likely reflects the limited evolutionary time and bottleneck
effect associated with the peopling of the Americas (see the next section for more
information on this topic). Moreover, estimates of the apportionment of NRY
biallelic diversity to hierarchical levels (commonly referred to as F-statistics; Wright
1965) based on geographic considerations has produced an interesting picture of Y-
chromosome variation that starkly differs from mtDNA and autosomal markers. In
general, the within-populations variance component (1 – FST) for NRY data is much
smaller than values reported for autosomal markers and mtDNA, whereas the
between-populations-within-groups (FSC) and between-groups (FCT) component
values for Y-chromosomes are typically larger (Seielstad et al. 1998, Hammer et al.
2001, Roumaldi et al. 2002). In other words, human NRY variation exhibits greater
regional and continental differentiation than other genetic systems. Seielstad et al.
(1998) attributed this geographic pattern of human genetic variation to a higher
female migration rate and the practice of patrilocality, the tendency for a wife to leave
her natal household and move into her husband’s domicile. As a result of this cultural
practice, most men tend to live closer to their birthplaces than do women, and thus
regional differentiation may be enhanced. A number of studies have supported this
hypothesis (Kayser et al. 2001, Oota et al. 2001), although others do not, particularly
ones that included Y-STR markers in their estimates of NRY diversity apportionment
(Santos et al. 1999, Jorde et al. 2000), which may reflect the differences in mutation
mechanisms and rates between Y-STRs and biallelic markers. Perhaps the most
30
direct refutation of the patrilocality hypothesis comes from a study by Wilder et al.
(2004), which found no evidence for higher levels of regional differentiation for the
Y-chromosome based on Alu retrotransposons that represent a rich source of
polymorphisms, unlike Y-SNPs. The authors conclude that previous studies
supporting the hypothesis were flawed by a non-random sampling of Y-SNPs that
produced an ascertainment bias along geographic lines. However, this model for the
relative distribution of human NRY and mtDNA variation continues to be debated.
Peopling of the Americas
One of the most active areas of research in anthropological genetics is the
peopling of the Americas. Initial studies on the mtDNA diversity of Native American
populations revealed four major haplogroups – A, B, C and D – and discovered
regional differences in diversity levels (Torroni et al. 1992, 1993a). These findings
were interpreted by some as genetic evidence of multiple migrations from Asia with
varying chronologies, with the Na-Dene and Esko-Aleut speakers, as defined in
Greenberg et al.’s (1986) tripartite migration model, representing the latest migrants
into the New World across the Bering Land Bridge. However, in later research that
involved Native American HVS-I sequences, differences in diversity levels between
populations and the major haplogroups were found to be negligible, suggesting that
American mtDNA variation has accumulated over a common period of time and is
the product of a single peopling event (Merriwether et al. 1995, Bonatto and Salzano
1997a, b, Lorenz and Smith 1997, Malhi et al. 2002). Other migration scenarios that
have been proposed are based on multiple migration events akin to the Greenberg et
31
al. model, such as the four wave model with each of the major haplogroups
representing a separate migration event (Horai et al. 1993) and a bipartite scenario
with haplogroup B entering the Americas independently in a later migration process
(Torroni et al. 1993b, Starikovskaya et al. 1998). The divergence times for the
Native American haplogroups range from approximately 37,000-14,000 years before
present (BP) (Forster et al. 1996, Bonatto and Salzano 1997b, Silva Jr. et al. 2003),
which generally precede the emergence of the Clovis lithic tradition (13,350-12,895
calibrated BP) (Fiedel 1999), a commonly cited benchmark for the colonization of the
Americas, and generally accommodate the pre-Clovis archaeological record of South
America (Dillehay 1999).
Most Native American populations are polymorphic for the four major
mtDNA haplogroups, although patterns exist in the geographic distributions of these
lineages (see Figure 8). Haplogroup A has its highest frequencies in Arctic and
SubArctic populations, predominantly among Na-Dene and Eskimo groups, and
decreases in frequency in the Southwestern United States before increasing again in
Central America (Torroni et al. 1993, 1994b, Ward et al. 1993, Merriwether et al.
1995, Lorenz and Smith 1996). Haplogroup B is mostly absent from northern North
American populations and has its highest frequencies in the Southwestern US and
Central and South America (Lorenz and Smith 1996, Malhi et al. 2003, Melton et al.
2007). Haplogroup C is not common among Na-Dene and Eskimo populations of
North America, but is prevalent further to the south, with its highest frequencies in
South America (Bert et al. 2001). And lastly, haplogroup D has a similar geographic
32
Figure 8 Distribution of mtDNA haplogroup frequencies among Native American
populations (modified figure from Schurr 2000)
distribution to C, with low frequencies in northern populations, with the notable
exception of the Aleuts where it is found at approximately 60% (see Chapter Four:
Results), and its highest frequency among South American groups (Merriwether et al.
1995, Moraga et al. 2000).
Based on the predominance of haplogroup A and its region-specific subclades
in northern North American populations, several authors have suggested that its
phylogeographic structure represents the genetic signature of an additional peopling
process – a broad population re-expansion in North America that stemmed from gene
33
pools originally derived from the earliest migrations of founder lineages into the
Americas (Forster et al. 1996, Bonatto and Salzano 1997a). This proposed scenario
has been attributed to the adverse climatic conditions that existed during the Younger
Dryas glacial period (12,900 – 11,600 cal. BP) (see Figure 9), which would have
disrupted human settlements in northern North America and produced highly isolated
and reduced gene pools in Beringia and the Pacific Northwest from which later re-
expansions may have occurred (Rogers et al. 1991). The A3 subclade, common to
the circumarctic region, is consistent with this model as its accumulated diversity
dates to about 13,000 years, which coincides closely with the Younger Dryas phase.
The primary criteria that has been used by anthropologists in identifying
potential ancestral populations for Native Americans is the presence of all four of the
major New World haplogroups. In early research that characterized mtDNA variation
Figure 9 Maximum extent of North American ice sheets during last ice age
(modified figure from www.archaeology.org)
34
in East Asian samples, the four lineages were discovered in the Taiwanese Han
(Ballinger et al. 1992), Tibetans (Torroni et al. 1994a), and Mongols (Kolman et al.
1996, Merriwether et al. 1996). Later, this group was expanded by studies conducted
primarily by Miroslava Derenko and colleagues at the Russian Academy of Sciences
in Magadan (Derenko et al. 1999, 2000, 2001b, 2003), who found the haplogroups at
high frequencies in a number of south Siberian groups, such as the Buryats and Tuva.
Our understanding of Native American origins was further complicated by the
discovery of a fifth mtDNA founder lineage by Brown et al. (1998), haplogroup X,
which at the time had not been characterized in any Asian groups, leading some to
suggest that this minor lineage may have come from Europe well before Columbus’
discovery of the Americas. That is until 2001, when Derenko et al. (2001a) reported
finding haplogroup X mtDNAs in the Altai at a low frequency. Not surprisingly, the
authors concluded that the native populations from the Altai mountain region
represent the most likely source of New World mtDNA variation based on the
presence of all five founder haplogroups. However, phylogenetic analysis of
haplogroup X control region sequences for the Altai, Native Americans, and
Europeans showed that the mtDNAs for these three respective groups are distinct
from one another and were thus appropriately assigned to separate subhaplogroups
(Bandelt et al. 2003, Reidla et al. 2003). As a result, the origin of Native American
haplogroup X is still not well understood, although the European scenario of its
introduction to the New World is considered very unlikely.
35
Over the past decade, there has been a steady rise in the application of
complete or nearly complete mtDNA sequences to questions regarding human
evolution and population origins. This change in methodology, as well as improved
coverage in the sampling of global populations, has greatly increased the resolution of
the human mtDNA phylogeny, with a larger number of region- and population-
specific subhaplogroups. Today, the five Native American founder haplogroups are
now recognized by the following nomenclature: A2, B2, C1, D1, and X2a (Forster et
al. 1996, Herrnstadt et al. 2002, Bandelt et al. 2003). In addition to these, a sixth
founder lineage from haplogroup D has been described among the Na-Dene, Aleuts,
and Eskimos, referred to as subhaplogroup D2 (Starikovskaya et al. 1998, Derbeneva
et al. 2002, Rubicz et al. 2003), which does not derive from American D1 and likely
originated from post-glacial Beringian contact with Siberia (Saillard et al. 2000,
Zlojutro et al. 2006).
In the most current mtDNA research on Native American origins that involves
a combination of HVS-I sequencing, high-resolution RFLP typing and complete
genome sequencing, a more detailed picture has emerged. Based on a study by
Starikovskaya et al. (2005), the remnants of an ancient Siberian gene pool were
identified within several contemporary populations, suggesting that the founding
haplogroups of Native Americans originated from different parts in Siberia. Lineage
B1, which is most closely related to the American B2, is present among the Tubalar
and Tuvan inhabiting the upper reaches of the Ob and Yenisei Rivers in south Siberia,
whereas the sequence variants most similar to American C1 and D1 were detected in
36
the Ulchi of the Lower Amur River, located north of Manchuria. The authors
concluded from these genetic findings and compelling archaeological evidence from
northeastern Siberia that the direct ancestors of Native Americans were a hybrid
product of different Siberian groups that migrated to eastern Beringia at different
times and following different routes. Other studies support this conclusion, with
evidence of genetic differentiation of several mtDNA lineages within Beringia prior
to their expansion into the Americas (Derenko et al. 2007, Tamm et al. 2007,
Volodko et al. 2008).
Due to the paucity of polymorphisms on the human Y-chromosome relative to
mtDNA, the contribution of NRY variation to this area of research occurred later
when it was better characterized by biallelic markers (i.e., SNPs, indels) through
DHPLC. As peviously noted, these types of polymorphisms have low rates of
parallel and back mutation, which make them ideal for identifying paternal
haplogroups that complement the mtDNA perspective. NRY haplogroups Q3, C and
R represent the vast majority of male lineages in Native Americans today, which led
some researchers to conclude that the trio represent the founder patrilines (Karafet et
al. 1999, Lell et al. 2002). In a comprehensive study of NRY markers in North and
South American populations by Zegura et al. (2004), haplogroup Q3 was found to be
the predominant lineage, with a wide geographic distribution and an overall
frequency of 76.4%, followed by haplogroup R at 13.4%, and haplogroup C at 5.8%.
Haplogroup C is mainly limited to Na-Dene and Amerind groups of North America
(Bortolini et al. 2003), as well as Greenland Inuit (Bosch et al. 2003). Similar to Q3,
37
haplogroup R has a very broad distribution, but exhibits extensive sharing with
European lineages based on Y-STR haplotypes (see Figure 10), suggesting that
haplogroup R in Native Americans is the product of European admixture, whereas
haplogroups Q3 and C represent the actual male founder lineages associated with the
earliest peopling of the Americas. Phylogeographic analysis of Y-STR variation
identified the Altai-Sayan region in southern Siberia as a potential ancestral homeland
for these patrilines, with divergence dates ranging from approximately 10,100 to
17,200 years, which precludes a very early entry into the Americas as suggested by
some archaeological sites and mtDNA dates.
Figure 10 Y-STR network for haplogroup R (Zegura et al. 2004) Haplotypes are represented by circles with area proportional to the number of individuals with the haplotype. Branch lengths are proportional to mutation number. Haplotypes are coded in white, black, or gray by population, with haplotype sharing indicated by pie chart divisions.
38
Overall, the NRY evidence appears to complement the findings based on
mtDNA data. MtDNA haplogroups A2, B2, C1 and D1 and NRY haplogroup Q3 are
all likely to derive from a single peopling process some time between 10,000-30,000
years ago, with an ancestral origin in Siberia. However, given the circumscribed
distributions of A3, D2 and NRY haplogroup C among northern North American
groups, it is likely that re-expansions occurred within the circumarctic regions and
that Beringia may have served as a “gateway” that both differentiated and facilitated
the infusion of Siberian mtDNAs into the Native American gene pool.
Population Background
The Aleut people are the native inhabitants of the Aleutian archipelago off the
southwest coast of Alaska (see Figures 11 and 12). The island chain is located to the
south of the Bering Sea and is comprised of approximately 200 islands, many of
which are volcanic and the product of tectonic activity between the North Pacific and
North American plates. The Aleutians span around 1,200 miles from the Alaska
Peninsula in the east to Attu Island in the west and is broken down into five major
island groups: Fox, Islands of Four Mountains, Andreanof, Rat, and Near groups.
The climate has been characterized as both harsh and oceanic, with heavy rainfall,
high winds, frequent fog, and cool temperatures throughout the year (Lantis 1984).
Most of the islands are treeless and have few terrestrial resources, although there is
abundant marine life associated with nutritious upwellings of ocean water from the
Aleutian trench that has served as the basis of the Aleut economy (Black 1976). The
39
Figure 11 Map of Bering Sea region (modified map from www.archaeology.org)
Figure 12 Map of the Aleutian Islands
40
Aleut communities are mainly located in the eastern portion of the Aleutians and
mainland Alaska, as well as the Pribilof Islands in the Bering Sea, the Kamchatkan
Peninsula of Siberia, and the Commander Islands located off the coast of Kamchatka.
English and Russian are the dominant languages used by Aleuts living in the United
States and Russia respectively, however the traditional Aleut language is still spoken
by several hundred people. Regional differences in traditional culture and language
have been described by the first Russian inhabitants in the island chain (Veniaminov
1840) and later by linguists and anthropologists (Black 1984). The Aleut population
today is socio-culturally diverse as it has become increasingly integrated with the
global economy through its fishing industry. And as a result of the influx of foreign
workers into the region that began with Russian contact in 1741, Aleuts are an
admixed people mostly through intermarriage with Europeans, in particular Russian
and Scandinavian males.
Archaeology and Prehistory
The Aleutian Islands lie to the south of Beringia, the vast area located between
the Kolyma River in northeastern Siberia and the Mackenzie River in the Northwest
Territories of Canada. During the Pleistocene ice ages, this geographic region
represented a single ecosystem dominated by steppe lands and large grazing animals
and included “land bridges” that emerged across the Bering Sea due to low sea levels
(Guthrie 1982). The eastern-most region of the Aleutians is believed to have been
incorporated into the southeastern terminus of the Bering Land Bridge, which last
existed between 25,000 and 10,000 years ago and served as the likely route of the
41
earliest migrations into the New World (Hoffecker et al. 1993, Elias et al. 1996).
Therefore, given the location of the Aleutians between Asia and the Americas, the
archaeological record of this island chain has generated much interest by
anthropologists concerned with Native American origins.
The earliest archaeological sites in the Aleutian Islands are in the eastern part
of the region in the Fox Islands group. These sites have been generally characterized
as belonging to the Northwest Coast Microblade Tradition (9,000 to 8,500 BP), which
extends south to the Kodiak archipelago and along the Pacific coasts of southeast
Alaska, Canada, Washington and Oregon (Dixon 1999). This tool industry was
contemporaneous with the American Paleoarctic and Denali complexes of mainland
Alaska and is considered by some to have derived from microblade assemblages of
northeastern Siberia, such as layer VI at Ushki-I (10,700 BP) on the Kamchatkan
Peninsula (Akazawa 1999, Goebel and Slobodin 1999, Hamilton and Goebel 1999).
The Anangula Blade Site, radiocarbon dated to 8,400 BP, is the oldest known
Aleutian site (Dumond and Bland 1995). It is located on the small island of
Anangula, across from Nikolski village on Umnak Island, and was first discovered in
1938 by William Laughlin and Alan May as a part of a Smithsonian expedition.
Since then, extensive archaeological work at Anangula has unearthed over 50,000
stone artifacts, making it one of the largest early Holocene assemblages in Alaska
(McCartney and Veltre 1996). The site is dominated by a unifacial blade and core
industry, which mostly consists of knives, end scrapers, and transverse burins
(Dumond 1987). Based on the thickness of the cultural layer, the length of
42
occupation at Anangula is believed to have been relatively short, with estimates
ranging from 500 to 1,500 years in duration (Black 1974, Laughlin 1980). The
excavated remnants of homes indicate that approximately 75 to 100 individuals
resided at the blade site. Reasons for abandonment of Anangula are uncertain,
although stratigraphic data suggests that it may have been in response to heavy ash
fall from nearby volcanic activity that potentially contaminated local sources of
drinking water (McCartney and Turner 1966, Black 1975).
Two other early Aleutian sites, Russian Spruce and Oiled Blade (8,000 BP),
are found on Hog Island near the city of Unalaska. The Russian Spruce site was
excavated from 1997 to 1999 and represents a short-term occupation by a blade-
making people (Dumond and Knecht 2001). The artifacts recovered from the site are
similar to those found at Anangula, including cores prepared by comparable lithic
techniques and the absence of biface manufacture. The Oiled Blade site is located
near Russian Spruce and was excavated in 2001, revealing a stratigraphy that is
deeper and more complex but with an artifact assemblage akin to the other early
Aleutian sites (Knecht and Davis 2001).
To the west of the Fox Islands group, the earliest archaeological sites occur
significantly later, starting with a site on Adak in the Adreanof Islands group that
dates to approximately 6,000 years and progressively becoming more recent moving
westward along the island chain. The cultural layer for the Adak site spans 2,000
years and contains the shell and bone remains of various marine species, as well as a
small number of stemmed points and scrapers (O’Leary 2001). In the Rat Islands
43
group, the oldest sites are located on Amchitka and date to about 4,000 years BP.
Excavations have discovered the elements of a bifacial and unpatterned flake core
technology, which includes burins, projectile points, scrapers, choppers, and abraders
(Hatfield 2002). And in the western-most Aleutians, the Near Islands group, the
oldest sites are on Shemya and Attu, dating from 3,000 to 2,000 years BP (Corbett et
al. 2001, Lefevre et al. 2001). The sites contains several house features, as well as
faunal and artifact samples that have not yet been analyzed.
Overall, the chronological sequence of the archaeological sites follows an
east-to-west pattern, suggesting that the Aleutian Islands were peopled in this
direction. This evidence contradicts various models espoused by Russian and
Japanese researchers in which the Aleutians are considered an extension of the Asian
continent and was peopled from both the west and east through multiple migration
events (Dikov 1965, 1979, Arutinov and Sergeev 1975, Black 1983). Furthermore,
the notion of an eastward entry into the Aleutians is weakened by the fact that the
Commander Islands, which would have served as a necessary stopover point before
the distant travel to Attu and its neighboring islands, exhibit no evidence for
prehistoric occupation (Hrdlička 1945). Therefore, the archaeological record
indicates a Holocene settlement of the Aleutian Islands from the Alaskan side, as
early as 8,400 BP.
According to the American anthropologist William Laughlin (1963, 1980), the
Aleuts descend from a single ancestral population that migrated into the New World
across the Bering Land Bridge, splitting into two groups: the Paleo-Eskimos, who
44
traveled north and then east across the Canadian Arctic; and the Aleuts, who occupied
the Fox Islands. The relationship of the early Anangula and Hog Island people to
present day Aleuts has been subject to much speculation. Based on his 1936 to 1938
archaeological survey of the islands, Aleš Hrdlička (1945) described two distinct
cranial morphologies that represent different periods of occupation: the earlier
dolicocephalic (long and narrow) skulls, attributed to a “pre-Aleut” people; and the
subsequent brachycephalic (short and round) skulls, belonging to a later “Aleut”
population. Hrdlička proposed that the two populations derive from separate
migrations and that the “pre-Aleuts” were replaced by the “Aleuts” beginning around
1,000 BP. However, dating of ancient Aleut skeletal material has shown that the two
morphologies do not sort into distinct chronological categories (Rubicz 2007),
although recent ancient mtDNA and isotope analyses are suggestive of partial
population replacement or admixture within this time frame (Coltrain et al. 2006).
With regards to artifact assemblages, Laughlin (1975) has argued that the
oldest sites in the Aleutians share cultural affinities with the much younger Chaluka
midden, located across the bay on Umnak Island and dated to around 4,000 BP.
Chaluka is believed to have been continuously occupied to the present day and,
interestingly, the current residents of the nearby Nikolski village are considered by
some to be the direct descendants of the original Chaluka people. The assemblages at
the Anangula and Chaluka sites are similar through their shared use of stone vessels,
pumice abraders and ocher grinders, and the manufacture of unifacial implements
(Laughlin 1967, Dumond 2001). However, Laughlin’s argument for cultural
45
continuity was criticized for failing to acknowledge the large technological
differences between the Anangula and Chaluka sites (McCartney 1984), and the
substantial hiatus that existed between the end of early sites (7,000 BP) and the
emergence of the Chaluka complex (4,000 BP).
From recent excavations in the eastern islands, new archaeological evidence
has been reported that settle some of the key issues concerning cultural continuity in
the Aleutians. At the Margaret Bay site near Unalaska Island, a “transitional culture”
has been identified, with an assemblage characteristic of the earliest Aleutian sites
and the bifaces of more recent traditions (Knecht and Davis 2001). Furthermore, the
occupation of the site spans more than 3,000 years and has been radiocarbon dated to
approximately 3,000 to 6,700 BP, which places it within the previously noted hiatus
of the region’s prehistoric chronology. Based on these findings, Knecht and Davis
(2001) devised a five-phase prehistoric sequence for the eastern Aleutians that
underscores cultural continuity: (i) Early Anangula (9,000 to 7,000 BP), represented
by the Anangula and Hog Island sites and characterized by an abundance of blades
and microblades that have been retouched by unifacial techniques; (ii) Late Anangula
(7,000 to 4,000 BP), which is typified by the Margaret Bay site and exhibits basic
elements of the Early Anangula phase and the addition of bifaces and bone artifacts;
(iii) Margaret Bay (4,000 to 3,000 BP), characterized by a technological shift, with
less emphasis on blade and microblade manufacture and a corresponding increase in
unpatterned core technology and tools with similarities to the Eskimo Arctic Small
Tool tradition (ASTt); (iv) Amaknak (3,000 to 1,000BP), named for the island near
46
the city of Unalaska and defined by an abundance of ground slate tools (ulus) and
stone projectile points and v-shaped burial trenches that may suggest a change in
belief system or social organization; and (iv) Late Aleutian (1,000 to 200 BP), lasted
until the time of Russian contact and shows little change from the previous phase,
except for the presence of a more complex bone technology and the first appearance
of long houses with a variety of configurations (Hatfield 2002).
Regional differences have been identified in the archaeological assemblages
recovered from the Aleutian Islands, with the Near Islands group exhibiting the
largest degree of differentiation, mostly in terms of stylistic features (McCartney
1971). The atypical character of these islands likely stems from its relative isolation,
separated from the neighboring Rat Islands by the largest inter-island distance of the
entire chain. Researchers have also noted archaeological differences between the Fox
Islands group and the Aleutian Islands further to the west that have a conspicuous
absence of blade and microblade technology. This may suggest a social or
environmental barrier between these two regions, or may simply be due to
insufficient sampling outside of the eastern Aleutians.
In the east, Aleut settlement is believed to have extended beyond the Aleutian
Islands into the lower Alaska Peninsula, where an ethnic and linguistic boundary
between Aleuts and Eskimos exists today. There is increasing evidence for cultural,
and potentially demic, exchange between the eastern Aleut zone and non-Aleut
peoples. For instance, similarities have been noted in the assemblages belonging to
the Aleutian Late Anangula phase and the Pacific Eskimo Ocean Bay phase (Dumond
47
1987), as well as close affinities between the Margaret Bay phase and Eskimo ASTt
tradition (Dumond 2001, Knecht and Davis 2001). Moreover, from about 1,500 BP
until Russian contact, a trade network appears to have existed among eastern Aleut
communities and Pacific Eskimos from the Alaska Peninsula and Kodiak Island as
suggested by the presence of foreign tool types and exotic materials in the
archaeological record. Therefore, the eastern Aleut region, including the lower
Alaska Peninsula, was likely engaged in considerable contact with outside groups,
either through trade, warfare and/or migration, and was apart of a wider sphere of
interaction that included mainland Alaska and the Pacific Northwest (Dumond 1987,
Moss and Erlandson 1992, Holland 2001).
Aleut Society at Russian Contact
At the time of Russian contact in the year 1741, the Aleut socio-culture was
diverse and in a state of change. According to early historical records and personal
journals of Russian explorers, merchants, and clergymen, Aleut traditional society
was predominantly patriarchal, although with elements of a matrilineal clan system
(Liapunova 1975). Marital relationships were varied, with cross-cousin marriages
preferable. Polygamy and fraternal polyandry were equally common among Aleuts
who could support multiple spouses. The abduction of wives from other villages was
also practiced. There were no marriage ceremonies, however the birth of a child
often signaled a union (Chamberlain 1951).
According to the detailed writings of Ioann Veniaminov (1840), a Russian
Orthodox priest that resided in Unalaska during the 1820s and 1830s, Aleut society
48
was stratified by the following three classes: the “honorable ones”, which comprised
the chiefs, their relatives and children; the “common people”, who were other Aleuts
and freed slaves; and the lowest class represented by slaves. Chiefs were usually
recruited from the highest class, but had to also demonstrate skill in military
leadership and hunting. Slaves and concubines were usually obtained through capture
during raids on enemy communities, and were considered a form of wealth along with
furs, dentalium shells, and amber (Liapunova 1975). The number of slaves one
owned was an essential criterion for determining rank and status among the nobility.
Successes, rank and allegiance were typically advertised on bentwood visors and
parkas with finely-made decoration and amulets (Black 1982). Aleut leaders were
often mummified and buried with these prized items.
Sea mammal hunting and fishing formed the basis of the prehistoric economy
in the Aleutian Islands. Hunting was conducted from baidarkas, the Aleut Kayaks
made from sea lion skin, driftwood, and whalebone (Dyson 2000). Aleuts used
spears and throwing boards for hunting, and seines woven from plant fiber, sinew and
Baleen for fishing (Liapunova 1975). Deep water fishing for halibut was done with
stone sinkers and bone hooks, and fishing lines were made from strands of braided
kelp. When sea conditions were too rough for hunting and fishing, Aleuts collected
terrestrial foods such as berries (moss berry and salmonberry), roots and leaves from
several edible plants (including wild celery and Asian lily), and shellfish and bird
eggs from the beach (Lantis 1984).
49
Aleuts practiced a strict sexual division of labor (Liapunova 1975). Men
hunted sea mammals and birds, engaged in deep-sea fishing, and constructed
baidarkas. Women were in charge of fresh water fishing, preparing foods for storage,
gathering roots, berries and eggs, weaving baskets, and sewing garments, such as rain
resistant clothing produced from sea mammal intestines.
Due to the importance of the sea for Aleut subsistence, settlements were
located on the coasts, usually on the north shores facing the Bering Sea because of the
greater abundance of marine resources and the frequent ocean swells on the Pacific
side that made landing of Baidarkas difficult (Lantis 1984). Villages were generally
located near a fresh water stream and near elevated land that could serve as a look-out
point for migratory animals or approaching enemies (Black 1974). Aleuts lived in
barabaras or semi-subterranean dwellings constructed from driftwood, sod and earth,
which were typically rectangular in shape and designed with common central rooms
and several roof-top openings to allow in light and serve as entrances. Most Aleut
households were composed of single families, with large barabaras sub-divided into
single-family compartments.
The belief system developed by the Aleuts was a sophisticated, naturalistic
religion. Agugux was the primary deity that was associated with the sun and
responsible for successful hunting and reincarnation (Lantis 1984). Lesser spirits
existed in other natural objects and were believed to have interacted with humans.
Each Aleut had his or her own personal amulets which provided a direct relationship
with the spirit world. Shamans also played a role in this relationship, acting as
50
mediators with the deities and claiming powers of prognostication, healing, and
protection from harm.
Aleutian History
The Aleutian Islands and their native inhabitants were independently
discovered by Vitus Bering and Alexei Chirikov in 1741. Their voyages were part of
a long-term Russian campaign to explore and map the lands of the North Pacific, with
over 225 expeditions sent into the region between 1728 and 1867 (Smith 2000). The
Second Kamchatkan Expedition, which lasted from 1733 to 1743, was led by Bering
on the ship St. Peter, and his deputy Chirikov, who directed a second ship christened
St. Paul (Jochelson 1933). In order to reach the North Pacific, the expedition had to
travel overland to northeastern Siberia, and once there, construct the ships for their
voyages. The crews were made up of European naturalists, physicians, marine
officers, and local recruits from Kamchatka and Okhotsk (Waxell 1952). Upon
departure, the two ships became separated after 16 days, with both crews making
contact with the Aleuts before heading back to Kamchatka. However, due to stormy
weather conditions, St. Peter was wrecked on the shores of Bering Island, where
Bering fell ill with scurvy and died in December of 1741.
The survivors of the expedition returned to Kamchatka with impressive cargos
of furs. Despite the financial success of the voyages, the Russian crown did not take
an active role in exploiting the region’s resources, but rather private entrepreneurs
began to quickly travel in large numbers to the newly discovered islands in hopes of
establishing profitable companies and potentially opening a fur market to China
51
(Black 2004). The first Russian and Siberian promyshlenniki (fur hunters) began
landing on Attu Island in 1743 and was chosen as a fur hunting base because of its
smaller Aleut population relative to nearby islands (Black 1984). Soon thereafter,
Russian ships began to bypass the western Aleutian Islands, which were rapidly being
depleted of their fur resources, for new hunting grounds further to the east.
In the 1750s, the Russians had come to dominate the Aleutian Islands, with
the Russian crown establishing sovereignty from the Near Islands to the Alaska
Peninsula, with the private companies having a central role in its governance.
However, Russian control was only attained after numerous violent encounters with
the Aleuts. According to Father Veniaminov (1840), Aleut men were directly
targeted, with approximately 5,000 killed by the Russians. Based on various
estimates, the Aleut population is believed to have been rapidly reduced from a pre-
contact size that was between 8,000 to 20,000 down to perhaps as low as 2,000 by
1790 through a combination of warfare, malnutrition, and the introduction of
European diseases such as smallpox, measles and tuberculosis (Veniaminov 1840,
Milan 1974, Liapunova 1975, Laughlin 1980, Lantis 1984, Fortuine 1992).
In 1799, the regional fur trade was formalized into the Russian-American
Company and was prospering mainly on the backs of Aleut men who were forcibly
conscripted and removed from their villages to work on hunting grounds. For
instance, in 1788, 137 Aleuts from Atka and Unalaska were taken to the uninhabited
Pribilof Islands to hunt seals and sea lions (Elliot 1886). And between the years 1825
and 1828, Aleuts were again relocated from the central and western Aleutian Islands
52
to the Commander Islands to work in the local fur trade industry (Rychkov and
Sheremetyeva 1972, Lantis 1984). As a result of these conscriptions and forced
relocations to worker cooperatives, Aleut communities experienced a deficit of Aleut
men, which enabled hunting crews to gain control over the villages and their women.
Foreign crewman often established themselves in Aleut settlements by constructing
their own version of barabaras (Federova 1973). This led to forcible abductions and
rape (Black 1993, Khlebnikov 1994), but also sexual relations and marriage that
could be characterized as voluntary. This complex relationship between Russian fur
hunters and Aleut women produced a rapidly growing “Creole” class within Aleut
society (Reedy-Maschner 2007).
The American purchase of Alaska in 1867 altered this demographic scenario
in the Aleut population. Russians living in Alaska were given three years to return to
Russia proper or be given automatic citizenship (Federova 1973). Aleuts and Creoles
were classified as “Indians” and were not provided with the same rights as US
citizens (Black 1990). As for the fur and fishing industries, they became controlled
by the US government through the Alaska Commercial Company and attracted large
numbers of Scandinavians and European Americans to the Aleutians, in particular to
the peninsula and eastern islands.
In order to reduce the number of hunters and conserve the dwindling stock of
sea otters, the US Treasury Department imposed a marriage rule during the 1870s, in
which only Alaskan natives and non-native men married to Alaskan women were
permitted to hunt fur-bearing animals (Porter 1893). This policy had the unintended
53
consequence of pushing the two cultures together, leading to further admixture of the
Aleut population with European men, mostly Scandinavians (Reedy-Maschner 2007).
In the eastern Aleut zone, elements of Scandinavian culture are evident from
surnames, language accents, place names, housing designs, cuisine, entrepreneurial
spirit, and even polka parties. Some writers have described a so-called “Scandinavian
effect” in southeastern Alaska, with a corresponding change in work ethic and
material prosperity (Mishler and Mason 1996).
With the start of World War II and the Japanese invasion of the Aleutian
Islands, the culture and lives of the Aleut people were once again disrupted. In June
of 1942, Japan bombed Dutch Harbor and invaded the western islands of Attu and
Kiska, capturing 42 Aleuts that were transferred to the Otaru Prison Camp on
Hokkaido Island for three years (Lantis 1984). In response, the American
government and military evacuated 881 Aleuts from communities west of Unimak
Island to abandoned canneries in southeast Alaska for the duration of the war
(Kohlhoff 1995). In the camps, the Aleuts endured difficult conditions, lacking
proper housing, sanitation, medical supplies, and even sufficient food. As a result,
they experienced a high mortality rate due to pneumonia and poor nutrition (Kohlhoff
1995). It was not until 1944 to 1945 that the Aleuts were finally repatriated, although
many elected not to return to their villages, some of which were heavily damaged
during US military occupation, and resettled elsewhere in Alaska.
In the post-war American period, the Aleut people began to reorganize and
assert their economic and political rights. Tribal councils were established in the
54
various communities in order to regulate land use and preserve Aleut culture. In
1971, The Aleut Corporation, a foundation that settles native land claims on behalf of
all Aleuts and promotes economic and social growth for its shareholders, was formed
through the Alaska Native Claims Settlement Act, with the Aleutian/Pribilof Islands
Association as its non-profit counterpart. Other local organizations, such as the
Aleutians Eastern Borough, were created in order to direct economic development in
their respective communities.
Today, the Aleut communities are becoming increasingly integrated into the
global economy through its fishing industries. Japanese megacorporations are
heavily investing in the region, setting up processing plants in Dutch Harbor, Sand
Point, King Cove and elsewhere in Alaska. Hundreds of international cannery
workers and fisherman work in these communities on a seasonal basis, many of
whom have made the Aleutians their home (Reedy-Maschner 2007). This latest
demographic shift in the Aleut population follows a common theme that is evident
from the region’s dynamic history, in that the rich marine resources of the Bering Sea
and neighboring waters has attracted newcomers to the region, beginning with
Russian fur hunters, followed by Scandinavian fishermen, and now an influx of
international workers associated with the present-day globalization of the Aleutian
economy (Lowe 2006).
55
Language
According to Ruhlen’s (1991) linguistic classification, the Aleut language
belongs to the Esko-Aleut family, with Eskimo and Aleut representing the two major
subgroups. The divergence of these two branches from an ancestral proto-language
has been estimated between 5,000 and 10,000 years BP using the glottochronology
method (Greenberg et al. 1985). The Eskimo group has a total of nine extant
languages that can be further divided into Yupik and Inupiaq branches, with a distinct
geographic barrier at Norton Sound, Alaska, where Yupik speakers are found both to
the south of this boundary and to the west in Chukotka (northeastern Siberia),
whereas Inupiaq speakers are present in northern Alaska and throughout the Arctic
regions of Canada and Greenland (Woodbury 1984) (see Figure 13).
The Aleut language has been divided into eastern and western dialects,
although both are mutually intelligible and exhibit less linguistic differentiation in
Figure 13 Geographic distribution of Aleut and Eskimo languages
56
comparison to the Yupik-Inupiaq divergence (Woodbury 1984). However, other
researchers have identified as many as seven additional dialects or subdialects in the
Aleut communities (Rubicz 2001). It has been estimated by Ruhlen (1991) that the
Aleut language is spoken by approximately 720 people, mostly the older generation,
although this number is likely to be lower today.
Morphology
Morphological traits, such as anthropometrics, cranial shape, and dentition,
have been studied by physical anthropologists since the 19th century to better
understand human evolutionary relationships. But, in comparison to genetic data,
morphological measurements have a number of limitations in this area of research,
most notably the confounding effects of environmental conditions on phenotypic
variation. Nonetheless, a large amount of morphological data has been collected and
analyzed for native populations from northern North America and Siberia.
Based on anthropometric data (i.e., body measurements), the Aleuts, along
with Eskimos and other native groups from Beringia, have been classified as having a
body type adapted for reducing heat loss in cold-climate conditions: medium to sub-
medium stature, tall sitting heights, and small hands and feet (Laughlin 1980). The
Aleuts also share a number of other physical traits with neighboring populations,
including straight black hair, epicanthic eye folds, narrow nasal roots, scanty beards,
broad faces, and high cheekbones (Crawford 1998). Recent multivariate analysis of
various anthropometric measurements collected by William Laughlin has found a
57
close phylogenetic relationship between Aleuts from the Pribilofs and Eskimos from
St. Lawrence Island in the Bering Strait (Justice 2007).
Similar to other Native Americans and Northeast Asian groups, the Aleuts
exhibit sinodont dentition, which is defined by a series of traits such as higher
frequencies of incisor shoveling, single-rooted upper first molars, and triple-rooted
lower first molars. This is in contrast to sundadont dentition, which has relatively
simplified features and is most prevalent among Southeast Asians, native Australians
and other populations in the South Pacific. Statistical analyses of dental traits
confirm this relationship among Sinodont populations, clustering the Aleuts closest to
Eskimos and Northeast Asians (Powell 1993, Turner 1993).
As previously noted in the section on Aleutian archaeology, skull morphology
has been used to reconstruct the evolutionary history of the Aleuts. Hrdlička (1945)
identified two cranial types, dolicocephalic and brachycephalic, arguing that the latter
was representative of a more recent Aleut population that expanded into the island
chain and replaced the other cranial form. However, a number of studies have refuted
this model. Laughlin and Marsh (1951) re-examined Hrdlička’s Aleutian material,
revealing physical similarities between the “pre-Aleuts” and “Aleuts” and concluded
that there was evolutionary continuity between the two types, rather than population
replacement. In a later investigation by Laughlin (1980), the two head shapes were
identified among living Aleuts, with the western Aleutian populations retaining the
dolicocephalic cranial type and the central and eastern islands predominantly
exhibiting the brachycephalic shape. From these results, Laughlin posited that the
58
brachycephalic trait originally evolved in the eastern part of the region, and has
subsequently spread westwards along the island chain through gene flow. And lastly,
in a study by Coltrain et al. (2006), analysis of 80 radiocarbon dated skeletal
specimens that were previously categorized show that both cranial types existed in the
Aleut population since 1,000 BP, although the authors suggest that the brachycephalic
Aleuts may have represented a closely related people with a distinct culture that
recently migrated into Aleutian Islands, mixing with the indigenous inhabitants.
Interestingly, analyses of cranial traits from various Native American and
Siberian populations appear to indicate that Aleut skulls more closely resemble those
of American Indians rather than Eskimos or Siberians. Based on the presence or
absence of 24 discrete cranial features, Szathmary and Ossenberg (1978) found the
Aleuts to cluster with five American Indian groups and none of the nine Eskimo
populations included in their study. Using different Aleut samples, Ossenberg (1992)
and Ousley (1995) produced similar results, with the Aleuts clustering closest to Na-
Dene populations, such as the Apache and Navaho of the American Southwest and
various groups from the Pacific Northwest.
Genetics
For classical genetic polymorphisms that include blood groups and serum
proteins, Aleuts are most similar to Eskimo populations, as well as certain native
groups from the Americas and northeastern Siberia. In studies that characterized the
ABO blood system, Aleuts exhibited high frequencies of ABO*O and ABO*A alleles
and a corresponding low frequency of ABO*B. This is similar to the variability
59
observed in Eskimos and contrasts ABO patterns in other Native American
populations that are either fixated for ABO*O, such as South American Indians, or
have only ABO*A and ABO*O (Laughlin 1980, Mourant 1985). For the MNS blood
group system, Aleuts have high frequencies of MNS*Ms, moderate levels of
MNS*MS and MNS*Ns, and only small numbers of MNS*NS, which once again is a
pattern similar to Eskimo frequencies (Rychkov and Sheremetyeva 1972). Like many
other Native Americans, Rh- phenotypes of the Rhesus blood system are absent from
the Aleuts, who have high frequencies of the cDE and CDe alleles. For the Diego
blood types, Aleuts possess a high frequency of Di*A, which is atypical of North
Americans and more characteristic of native groups from South America. And
similar to other Native Americans and some Siberian populations, Aleuts exhibit
comparable frequencies of haptoglobin genes HPA*1 and HPA*2 and near fixation of
serum albumin gene AL*A (Szathmary and Ossenberg).
Multivariate analyses of classical genetic data for Native American and
Siberian populations have produced varied results, with the Aleuts exhibiting close
genetic affinities with Eskimos, American Indians, and/or Siberians (Rychov and
Sheremetyeva 1972, Szathmary and Ossenberg 1978, Harper 1980, Ousley 1995). In
a recent study by Rohina Rubicz (2007) that analyzed nine alleles from five different
blood group systems, Aleut samples from the Pribilof communities (St. Paul and St.
George) and Bering Island of the Commanders displayed greater genetic similarity
with Eskimos groups, with the exception of St. Paul that clustered away from the
other Aleut populations and appeared closest to Chukchi and Kodiak Eskimos.
60
The first molecular genetic study of the Aleuts was conducted by Merriwether
et al. (1995, 1996), characterizing mtDNA variation in a population sample collected
from St. Paul Island. The initial RFLP results suggested that the Aleuts possessed
three of the founder lineages for Native Americans: haplogroups A (25%), C (1.4%)
and D (66.7%). In later research, additional restriction enzymes were used to
generate greater phylogenetic resolution among the matrilines, which led to the
reclassification of Aleut haplogroups A and D to sublineages A2 and D2,
respectively.
In more recent mtDNA studies (Rubicz 2001, Rubicz et al. 2003, Zlojutro et
al. 2006), Aleut samples were collected from several communities located throughout
the central and western Aleutian Islands, the Pribilofs, and Bering Island, and were
typed for diagnostic RFLP markers, identifying only two of the New World founding
haplogroups: A (28.5%) and D (71.5%). Haplogroup C was not reported and likely
represented non-Aleut individuals in the samples from earlier research. As previously
noted in the section concerning the peopling of the Americas, haplogroup D is an
uncommon mtDNA lineage among Na-Dene and Eskimo populations, while
haplogroup A is far more prevalent in these groups (Figure 8). Thus, the Aleut
mtDNA pattern, with its high frequency of D, is considered atypical for Native North
Americans.
HVS-I sequencing was also performed in the aforementioned studies, with
multivariate analysis revealing greater genetic similarity between Aleuts and the
Chukchi and Eskimo populations of northeastern Siberia, than to either Native
61
Americans or Kamchatkan groups. This finding has effectively refuted an eastward
peopling of the Aleutian archipelago from the Kamchatkan Peninsula, a scenario that
is espoused by several Russian and Japanese scholars (Rubicz et al. 2003).
Moreover, phylogeographic analysis of the HVS-I data has identified three star-like
clusters within the networks for subhaplogroups A3, Aleut-specific A7, and
Beringian-specific D2, a genetic feature that is commonly interpreted as a signature
of population expansion (Zlojutro et al. 2006). Based on coalescent dating, the A7
and D2 subclades have similar ages and appear to be the product of an expansion
event approximately 5,400 years BP, whereas A3 is substantially older (19,900 BP)
and likely represents a genetic remnant of the earliest peopling of northern North
America. From these results and the prevailing interpretations of the Aleutian
archaeological record, Zlojutro et al. (2006) proposed four plausible demographic
models for Aleut prehistory: (i) biological continuity and kin-structured peopling of
the archipelago, with the Anangula and Hog Island sites representing the earliest
ancestors of the Aleuts; (ii) intrusion and expansion of a non-native biface producing
population, beginning around 6,500 BP, that introduced subhaplogroups D2 and A7
into the Aleutian gene pool; (iii) expansion of Arctic Small Tool tradition (ASTt)
peoples into the Aleutian archipelago and the amalgamation of haplogroup D2 with
an older Anangula population substratum; and (iv) biological continuity with the
early Anangula peoples and significant gene flow from neighboring populations in
mainland Alaska and Kodiak. The four models are not mutually exclusive, with each
62
varying in their degree of concordance to current genetic, archeological, and ethno-
linguistic evidence.
To further investigate the evolutionary relationship of haplogroup D2 among
Aleut and Eskimo populations, complete mtDNA sequencing was performed by
Derbeneva et al. (2002) on thirty Aleut samples from Bering Island and seven
Siberian Eskimo samples that were previously classified to the D2 lineage. The
results showed a complete fixation of D2 in the Bering population sample, which the
authors attributed to the effects of genetic drift. However, others have argued that
given the recent settlement of Bering Island by Aleuts (circa 1825), the likelihood of
inter-generational stochastic processes eliminating haplogroup A from the gene pool
is exceedingly improbable (Rubicz et al. 2003), and thus the fixation is likely to be a
product of founder effect as the original Aleut transplants to the Commander Islands
consisted of closely-knit families from Attu and Atka (Rubicz 2007). The phylogeny
based on D2 sequences revealed two major branches: Aleut-specific subclade D2b,
defined by a transversion at np 8910; and subclade D2c, with HVS-I transitions at np
16,111 and 16,366 and identified in five of the seven Eskimo samples (note, a third
and more distant branch, subclade D2a, was also defined by the authors but is
considered to be primarily a Na-Dene lineage). The geographic specificity and
phylogenetic relationship of these two D2 subclades suggest that Aleuts and Eskimos
derive from a common founding population some time during the postglacial period.
The only Y-chromosome research done on the Aleuts to date was conducted
recently by Rubicz (2007) in her PhD dissertation project. In this study, samples
63
from the central and western Aleutian Islands, the Pribilofs, and Bering Island were
characterized for Y-SNPs and Y-STRs, as well as mtDNA markers and autosomal
STRs. The results reveal a considerable reduction of mtDNA diversity for the Bering
community, which is consistent with the findings of Derbeneva et al. (2002), and as
discussed above, is probably the consequence of founder effect. The Aleut Y-
chromosome haplogroups are mostly of non-Aleut origin (73% to 90%), which
indicates substantial male gene flow into the Aleut communities and starkly contrasts
the mtDNA picture that is almost exclusively represented by Native American
matrilines.
Summary
This chapter provided an overview of the field of anthropological genetics and
its application towards understanding regional patterns of human genetic diversity,
most notably mtDNA and Y-chromosome variation, and reconstructing human
evolutionary histories through phylogeographic approaches. In addition, background
information on the Aleut people is presented, including the pre-history and history of
the Aleutian Islands, the different Esko-Aleut languages spoken in the region, and the
morphological and genetic traits observed in the Aleut population. Archaeological
evidence indicates that the Aleutian Islands were first settled in the east at
approximately 8,400 years BP, with the central and western islands occupied much
later in the postglacial period. Much of the debate concerning Aleut origins has
focused on the relationship of the earliest inhabitants on Anangula and Hog Islands to
modern day Aleuts. Some researchers argue for biological continuity, supported
64
primarily by cranial evidence and the Late Anangula transitional phase classified at
Margaret Bay, whereas others propose scenarios in which population replacement or
amalgamation occurred at times of cultural change or technological transitions that
are evident in the archaeological record (e.g., manufacture of biface tools). The
history of the Aleutian Islands is a dynamic one, where the influx of foreigners,
particularly Europeans, has had a major impact on Aleut demography and genetic
structure. Through Russian contact, the Aleut population rapidly became admixed,
producing a so-called “Creole” class in Aleut society. This changed after the sale of
Alaska in 1867, with Scandinavian men representing the majority of newcomers to
the region, especially into Aleut communities located in the lower Alaska Peninsula
and eastern islands. Population genetic studies thus far have not characterized the
genetic variation in the eastern region nor investigated the genetic structure of the
entire Aleutian archipelago, which based on its history, is likely to have significant
regional differences.
65
CHAPTER THREE: MATERIALS AND METHODS
This chapter describes the research design of this dissertation project. This
includes the sampling procedure conducted in eastern Aleut communities, DNA
extraction protocols, characterization of mtDNA and Y-chromosome markers, and the
various analytical methods used to assess Aleut population structure, gene flow, and
molecular signatures of demographic history.
Sampling Methods
During the summers of 2005 and 2006, DNA samples were collected from
Aleut communities located in the eastern Aleutians and lower Alaska Peninsula by a
research team comprised of Dr. Michael Crawford, Mark Zlojutro and Liza Mack.
Participants that claimed Aleut ancestry were informed about the objectives of the
study, the confidentiality of individual genetic profiles and genealogical information,
and the anonymity of any published data. All participants signed informed consent
forms (see Appendix A) and were provided with contact information for any
questions concerning the study and its findings. The scope of the study and the
safeguards concerning personal genetic information were approved by the University
of Kansas Advisory Committee on Human Experimentation (ACHE), the Aleut
Corporation, the Aleutian/Pribilof Islands Association, the Aleutians East Borough,
and the tribal councils of the various communities.
For each participant, buccal samples were obtained by gently scraping the
inside of the participants’ mouths using sterilized wooden dowels and then depositing
66
the cheek cells in 750 µL of TE buffer. In addition, the participants rinsed their
mouths with 10 mL of distilled water and the resulting sputum was collected in 15
mL polypropylene tubes. Buccal and sputum samples were successfully collected
from the following Aleut communities: Akutan, False Pass, King Cove, Nelson
Lagoon, and Sand Point (see Figure 14). According to the United States census of
2000, the population sizes of the five villages range from 64 to 952, with native
Aleuts representing approximately 16% to 78% of these populations. But it should be
noted that the population sizes of the larger communities, specifically Akutan, Sand
Point and King Cove, are substantially inflated and likely misrepresentative of the
Aleuts living in the permanent settlements because the census statistics included
transient workers of multinational origins employed at local fish processing plants
and cold storage facilities.
Figure # Map of sampled Aleut communities
67
The sample sizes are provided in Table 1. A total of 197 samples were
collected from the five communities, which excludes: two samples from participants
who reside in the Pribilofs; and five samples from individuals that were not born in
either Anchorage or one of the Aleut communities and based on genealogical
information were unable to trace their matrilineages to this region. For the mtDNA
analysis, only a subset of the samples was used. Closely related individuals were
culled from the data set (i.e., siblings, mothers, and grandmothers). Moreover,
samples that were not characterized to native haplogroups A or D were also removed
from the data set (n = 12 or 6.1 % of the total sample size) in order to focus the
mtDNA study on ancient evolutionary relationships between Beringian populations.
Similarly, for the Y-chromosome analyses, closely related individuals were excluded
from the male data set. However, non-native haplogroups were included because the
vast majority of Aleut Y-chromosomes belong to European patrilineages (see Chapter
Four: Results). Thus, the focus of the Y-chromosome study mostly concerns the
impact of European gene flow on the Aleut gene pool.
Table 1 Number of Aleut participants by community and sizes of corresponding
data sets
Community Total Samples mtDNA Subset Y-chromosome Subset Akutan False Pass King Cove Nelson Lagoon Sand Point
27 23 57 32 58
16 11 33 16 38
11 9 20 14 21
197 114 75
68
Laboratory Methods
DNA Extraction
Two different methods were used to extract DNA from the buccal and sputum
samples collected from the Aleut communities: Chelex-based DNA extraction (Walsh
et al. 1991); and standard phenol-chloroform protocol (Chomczynski and Sacchi
1987). To safeguard against any potential problems arising from the transport of
Aleut biological material from Alaska to the University of Kansas (e.g., delays, high
temperatures) and ensure high-quality DNA was obtained from the samples, DNA
was extracted in the field using the Chelex method. Sputum samples were allowed to
stand for 15-20 minutes in order for buccal cells to settle at the bottom of 15 mL
polypropylene tubes and then transferred to two 2.0 mL microcentrifuge tubes using
bulb pipettes. The tubes were spun at full speed in a microcentrifuge (3,000 rpm) for
5 minutes, producing cellular pellets. The supernatants were discarded and 100 µL of
10% Chelex resin (BioRad, Hercules, CA) was added to each tube. The pellets were
resuspended through vortexing and incubated at 100°C in a heating block for 10
minutes in order to denature and lyse the buccal cells. The tubes were then placed on
ice for 3 minutes to allow the Chelex to bind to proteins and lipids. The tubes were
centrifuged at full speed for 5 minutes, forcing the Chelex-bound material to the
bottoms of the tubes. The supernatants, which contain the DNA, were transferred
into clean 0.5 mL tubes and stored at 4°C.
For the buccal samples transported to the Laboratory of Biological
Anthropology (LBA) at the University of Kansas, DNA was extracted by the phenol-
69
chloroform method. This protocol required digesting each of the samples overnight
at 55°C in an extraction cocktail of 100 µL 5X STE (sodium chloride-Tris EDTA), 25
* References: Roewer and Epplen 1992; de Knijff et al. 1997; Kayser et al. 1997; and Ayub et al. 2000. Primers were synthesized by Integrated DNA Technologies (Coralville, IA).
lengths were compiled in the program ABI® 3130 Data Collection ver. 3.0 and
standardized against the known Y-STR profile of Dr. Alan Redd.
The resulting Aleut Y-STR haplotypes were tentatively assigned to Y-
chromosome haplogroups using the online database at www.ysearch.org, which
contains the Y-STR and Y-SNP profiles of individuals characterized by Genealogy by
Genetics, Ltd, a company that provides genetic testing services to the general public
for the purpose of determining “ancestral origins”. Based on the results of this cross-
check, Y-SNP analyses were performed to verify all of the haplogroup assignments.
The Y-SNP biallelic markers were typed by direct sequencing of the DNA region
encompassing the polymorphism. The PCR primers and annealing temperatures are
81
listed in Table 4. The thermalcycle protocol that was used in the Y-SNP analysis is
as follows: 94°C for 1 minute (1 cycle); 94°C for 40 seconds (35 cycles); primer
annealing temperature for 30 seconds (35 cycles); 72°C for 1 minute (35 cycles);
72°C for 5 minutes (1 cycle); and a hold at 4°C. The resulting DNA templates were
cleaned using QIAquick® spin columns and sequenced by Dr. Grose at the KU DNA
Sequencing Laboratory (see previous section regarding HVS-I sequencing for a
description of these methodologies).
Table 4 Primers for Y-SNP analysis Y-SNP (Defined Haplogroup) Primer Sequences (5'→3')* Annealing Temp (°C)
P39 (Hap C) FOR: AGAAGGACTGCCTCAGAATGC REV: GTTCGAAAGGGGATCCCTGG
* References: Underhill et al. 1996, 2001; Hammer et al. 1998; Cruciani et al. 2002; Y Chromosome Consortium 2002; Cinnioğlu et al. 2004; and Zegura et al. 2004 . Primers were synthesized by Integrated DNA Technologies (Coralville, IA).
82
Analytical Methods
Measures of Genetic Diversity
Three different diversity measures were calculated for the HVS-I and Y-
chromosome data using the computer program Arlequin ver. 3.1 (Schneider et al.
2000): gene diversity (also referred to as haplotype diversity or heterozygosity for
diploid genetic systems), and two theta estimators, θS and θπ. Gene diversity is
defined by the equation
−
−
= ∑=
k
i
ipn
nH
1
211
, (2)
with n representing sample size and pi the frequency of the ith haplotype (Nei 1987).
This measure is a relatively stable statistic that is considered to be less responsive to
recent demographic events and random genetic drift (Nicholson et al. 2002, Helgason
et al. 2003).
For haploid genetic systems, such as mtDNA and Y-chromosome markers, the
parameter θ equals 2Neµ , where Ne is effective population size and µ is mutation rate.
The θπ estimator, originally derived by the Infinite Sites Model (ISM) from classical
population genetics (Tajima 1983), is equivalent to the mean number of pairwise
differences between sequences (π) (it is also referred to as MPD). This measure is
defined as
∑∑= <
=k
i ij
ijji dPP1
πθ , (3)
83
where dij is the number of nucleotide differences between haplotypes i and j, k is the
number of haplotypes in the data set, and P is haplotype frequency. This differs from
the estimator θS that is calculated by the term
∑−
=
=1
1
1n
i
S
i
Sθ , (4)
where S is the number of observed variant sites (Watterson 1975). Thus, the two θ
indices are derived from different aspects of molecular data, and as a consequence
provide alternative perspectives on the impact of past evolutionary processes on
genetic variation (see below).
Neutrality Test Statistics
The neutrality tests, Tajima’s D and Fu’s FS, were calculated in Arlequin ver.
3.1 to determine whether HVS-I sequence data deviate from genetic variation patterns
expected under the null evolutionary model (i.e., constant population size and absence
of natural selection). Coalescent theory, which is a powerful modeling tool used for
hypothesis-testing in population genetics (Kingman 1982, Hudson 1983), has shown
that populations undergoing size expansion will have gene genealogies that exhibit
“star-like” topologies characterized by long external branches and a compacted
internal structure (Slatkin and Hudson 1991). As a consequence, the genetic diversity
profiles for expanding populations will be distorted by an excess of rare variants or
84
singletons located on the long external branches, which has different implications for
the two θ indices described in the previous section. Due to the importance of the total
number of sequence variants (S) in its calculation, θS values will be significantly
inflated from the increase of low-frequency, unique polymorphisms in a sample data
set. On the other hand, θπ represents the mean pairwise differences between all
sequences and places equal weight on all haplotypic polymorphisms and thus is more
heavily influenced by the number of intermediate- and high-frequency variants
located on the short internal branches. Recognizing this salient difference between
the two θ measures as a potential signal for departure from the null model, Tajima
(1989a, b) created the following test statistic:
( )S
S
VarD
θθ
θθ
π
π
−
−= . (5)
Therefore, if population growth generates an excess of low-frequency mutations, then
expanding populations should have θS values that are greater than its corresponding θπ
values, resulting in negative D scores (see Figure 19). Conversely, population
bottlenecks tend to create gene genealogies that are highly fragmented with deep
internal branches that are characterized by intermediate- and high-frequency variants,
which will inflate θπ relative to θS and produce positive D scores.
Fu’s FS (1997) is another neutrality test statistic that derives from Ewens’
haplotype frequency distribution (Ewens 1972) and evaluates the probability of a
random neutral sample having a number of alleles (K) no fewer than the observed
85
Figure 19 Concept of Tajima’s D neutrality test statistic
number (kobs) given θπ. The expected number of haplotypes (K) in a sample of size n
is calculated as
( )( )1
...21
1−+
+++
++
+=n
KEθ
θθθ
θθ
. (6)
From this formula, Ewens derived the expected distribution of haplotype frequencies
at equilibrium given K and n as
( )KK
KnnnlK
nnKnnn
...!
!,|...,Pr
2121 = , (7)
where lK is a Stirling’s number of the first kind (effectively a normalizing constant).
Based on this probability, Fu’s FS statistic is defined as
−=
'
'
1ln
S
SFS , (8)
where S΄ = Pr (K ≥ kobs | θ = πobs). A negative FS score indicates the genetic effects of
a population expansion, which stems from an excess of alleles (mostly singleton
86
haplotypes) contributing to the reduction of the S΄ term. Compared to Tajima’s D, the
FS statistic is more sensitive to the effects of population growth (Ramos-Onsins and
Rozas 2002). The Arlequin program tests the significance of both statistics by
generating random samples under selective neutrality and population equilibrium
using a coalescent simulation algorithm (Hudson 1990), with P-values representing
the proportion of random statistics less or equal to the observation.
Median-Joining Network Analysis
The evolutionary relationships of Aleut HVS-I and Y-STR haplotypes were
displayed by a phylogenetic method known as Median-Joining (MJ) network analysis
(Bandelt et al. 1995, 1999). The advantage of this type of cluster analysis is it allows
for cycles or reticulations within evolutionary pathways in order to accommodate the
elevated mutation rates and corresponding homoplasy of particular genetic systems,
such as the HVS-I and Y-STR loci (Kayser et al. 2000, Sigurgardóttir et al. 2000,
Pakendorf and Stoneking 2005). Networks are similar to other kinds of phylogenetic
trees in that both are connected graphs composed of nodes (i.e., populations or
haplotypes) and links (i.e., evolutionary pathways). The key distinction is that the
links are not unique paths, but represent cycles in the network diagrams. This feature
creates a degree of fluidity that enables networks to present “all most parsimonious
trees” in a single diagram by distinguishing between unresolvable and resolvable
character conflicts, and then highlighting the unresolvable conflicts in the form of
reticulations that can then be interpreted as the product of either homoplasy or
another molecular issue (e.g., recombination, sequence errors). Moreover, median
87
networks provide a systematic method for reconstructing hypothetical unsampled or
extinct ancestral haplotypes in order to shorten the overall length of a network.
There are four different types of networks: Minimum Spanning Networks
(MSN); Quasi-Median (QM); Reduced Median (RM); and Median-Joining (MJ). The
MSN method creates networks that are embedded by all possible minimum spanning
trees (i.e., the sum of distances between linked sequences is minimal) based on
Kruskal’s (1956) algorithm. It is the simplest to compute, but is of little direct use for
representing genetic data, since minimum spanning trees do not reflect the most
parsimonious phylogeny. However, MSNs serve as the starting point for all higher
level networks. QM networks utilize an unconstrained median operation that
generates all optimal trees, as well as numerous suboptimal ones, and is generally too
complex to be visualized in three-dimensional space. For the two remaining network
methods, the main difference is that RM networks are designed for binary data (e.g.,
RFLPs, SNPs), whereas the MJ approach can handle multi-state data (e.g., DNA
sequences, microsatellites). Thus, the MJ method was applied to HVS-I and Y-STR
data for the Aleuts and comparative populations (note, MJ networks were constructed
for individual haplogroups, which were identified from RFLP and Y-SNP
information).
The assumptions of the MJ method are that ambiguous states are infrequent
and that recombination is absent (Bandelt et al. 1999), two conditions that are largely
met by mtDNA and the non-recombining portion of the Y chromosome (NRY). The
process of constructing a MJ network is accomplished by a five-step algorithm after
88
specifying the value of the tolerance parameter, ε ≥ 0. (i) Create a matrix of genetic
distances between sequences by simply counting the number of site differences. (ii)
Determine the links between the sequence types which describe the (ε – relaxed)
minimum spanning network. (iii) Iteratively remove from the set obsolete sequence
types that are not among the sampled sequences. If obsolete sequences are detected,
the second step is repeated. (iv) Aiming for parsimony, consensus sequences (i.e.,
median vectors, designated as X) of three mutually close sequences (U, V, and W) are
added to the minimum spanning network. These median vectors can be biologically
interpreted as either extant unsampled sequences or extinct ancestral sequences.
Feasible sequence triplets contain two pairs from U, V, and W that are linked, and at
least one median vector X that is not a current sequence type. If there are no feasible
triplets, then the algorithm goes to the final step (v), the construction of the final
network. Otherwise, the minimum connection cost, λ, is calculated for all feasible
triplets. The median vectors are then generated at a connection cost level that does
not exceed λ + ε. The set of current sequence types are then expanded with these new
median vectors and the algorithm process goes back to step (i). The MJ networks
presented in this study were produced using Network ver. 4.5 (Fluxus Engineering,
Suffolk, England) and, in the case of the HVS-I haplotypes, redesigned with the aid
of previously published mtDNA networks for Native American and Asian
populations (Derbeneva et al. 2002, Kivisild et al. 2002, Yao et al. 2002,
Starikovskaya et al. 2005, and Zlojutro et al. 2006).
89
Neighbor-Joining Trees
At the level of the population, phylogenetic trees were constructed from
genetic distance matrices for HVS-I and Y-STR data using the Neighbor-Joining (NJ)
algorithm. This clustering approach was used because it does not assume an
evolutionary clock (i.e., the tree is unrooted) and produces more accurate results
when closely related populations, such as human groups, are analyzed (Saitou and
Nei 1987). Using Arlequin ver. 3.1, the HVS-I data for 17 Aleut and Beringian
populations were converted into a genetic distance matrix using Nei’s intermatch-
mismatch index (Nei and Li 1979):
+−=
2ji
ijA
dddD , (9)
where dij is the average number of nucleotide differences between populations i and j,
and di and dj are the average pairwise differences within populations i and j. For the
Y-STR haplotypes, RST distances (sum of squared size differences) were computed
for 13 Aleut and comparative European populations. The squared number of repeat
differences between any two haplotypes (x and y) is given as
∑ =−=
1
2)(i yixixy aad , (10)
where axi is the number of repeats of the microsatellite for the ith locus and when
estimating population differentiation represents an analog of Slatkin’s RST (1995).
90
Figure 20 Schematic of phylogeny construction by the Neighbor-Joining algorithm Initially, all populations (A-H) are related by a single star-like phylogeny. Then, the pair of populations that gives the shortest overall tree (lowest value for S) is selected and combined into a single taxon (for example, populations D and E in the phylogeny above). The genetic distances from the composite grouping to all other populations is recalculated and the process is repeated until all interior branches have been found (Jobling et al. 2004).
The NJ algorithm begins the tree-building process by assuming that all
populations are related to one another by a star phylogeny. For a star phylogeny of N
populations, the sum of the branch lengths is
( )∑ ≠ −=
ji
ij
N
DS
10 , (11)
where Dij is the distance between populations i and j based on the computed genetic
distance matrices. Next, the algorithm determines which pair of populations, when
considered as a single entity (i.e., joined neighbors), produces minimum branch
lengths (Sij’s) for the entire tree. After the first pair of neighbors is found, the process
of considering all possible pairings is repeated and the joined neighbors are not
rearranged thereafter. The distance from any one population (k) to the pair of
neighbors (i and j) is the average of the two distances: ½ (dik + djk) (see Figure 20).
Thus, the basic principle of the NJ method is to minimize the total evolutionary
91
distance in the tree (Hartl and Clark 1997). The NJ phylogeny was constructed using
the executables NEIGHBOR and DRAWTREE in the PHYLIP ver. 3.6 software
package (Felsenstein 1993). The robustness of the trees were tested by generating
cophenetic matrices derived from the nested population clusters and comparing them
to the original genetic distance matrices by Mantel tests (1967).
Multidimensional Scaling
Since a tree representation of genetic distances may be misread as a
succession of evolutionary splits, which is inappropriate for populations below the
species level, multidimensional scaling (MDS) was performed using the software
package NTSYS (Applied Biostatistics, Inc., Setanket, NY) on DA and RST distance
matrices for HVS-I and Y-STR data, respectively, in order to provide a visual
representation of genetic relationships in two-dimensional space. This ordination
technique presents the dissimilarity of n objects in a k-dimensional space so that the
inter-point distances in the projected space correspond as well as possible to the
observed distances in the original matrix (Kruskal 1964a, b). MDS differs from a
standard principal component analysis (PCA) in that instead of requiring that a
projection of points explains a maximum percentage of the variation found, MDS
focuses on the distances in the k-dimensional space having a monotone relationship to
the original distances. As a consequence, the smaller inter-point distances tend to be
preserved more accurately in MDS than in PCA because of the greater weight given
to larger distances in PCA due to the maximization of variances. Hence, this property
92
is advantageous for characterizing the genetic relationships of regional populations,
such as the Aleuts and neighboring Beringian peoples.
The MDS algorithm begins with an initial configuration for the points (i.e.,
populations) that were produced by PCA, and compute distances, d*
ij, between all
pairs of points, ij, and compare them to the original distances, dij. A monotone
function, dfij, is fitted to these two variables and the deviations from the function are
computed as normalized sums of squared deviations. A statistic called stress
measures the goodness-of-fit of the distances in the projected space to the monotone
function of the original distances:
( )∑
∑ −=
2*
2*
ij
f
ijij
d
ddStress . (12)
The positions of the projected points are then adjusted to reduce this value,
from which stress is then recalculated, and the process repeated until the maximum
number of specified iterations is reached (n = 100). The final MDS distance
coordinates were plotted using Minitab 14.0 (Minitab, Inc., State College, PA).
R-Matrix Analysis
Using the frequencies of mtDNA and Y-chromosome (sub)haplogroups as
identified by diagnostic HVS-I and Y-SNP sites, an R-matrix of genetic similarity
and dissimilarity between populations was computed with the program ANATANA
(Harpending and Rogers 1984). The R-matrix is akin to a variance-covariance matrix
93
that measures deviations from mean allele frequencies (Harpending and Jenkins
1973). The elements are given as
( )( )
( )PP
PPPPr
ji
ij −
−−=
1, (13)
where rij is the kinship coefficient, Pi and Pj are the allele frequencies (or in this case,
haplogroup frequencies) for populations i and j, respectively, and P is the weighted
mean frequency for all populations. The final R-matrix of kinship coefficients is
averaged over all haplogroups in the genetic data set and can be rewritten as the
product of a Z-matrix of standardized variables and its transpose: R = ZZT. The R-
matrix was then transformed by PCA using Minitab ver. 14.0 so that the variation
explained by the first two eigenvectors was maximized. The results are displayed as
a two-dimensional plot of the eigenvalues scaled by the square root of the
corresponding eigenvector, producing a genetic map that orients populations with the
greatest degree of genetic similarity closest together.
In order to assess the relative contribution of the haplogroup variables to the
distribution of populations in the two-dimensional space, biplots of the population
coefficients and haplogroup scores corresponding to the covariance matrix S = ZTZ
were performed. The eigenvectors for the S-matrix were directly computed by
multiplying the R-matrix eigenvectors (ET) by the Z-matrix (Harpending and Jenkins
1973). And as a final note, R-matrix analysis is most informative when multiple loci
94
are examined, and thus a degree of caution needs to be taken when interpreting the
plots generated for the HVS-I data.
Heterozygosity versus rii
To assess the gene flow experienced by these populations, the rii coefficients
(i.e., diagonal elements of the R-matrix representing the genetic distance of a
population from the centroid) was estimated by calculating the mean value for the
following expression:
( ) ( )PPPPr iii −−= 12
, (14)
where rii is the distance from the centroid for the ith population for a particular
(sub)haplogroup, Pi is the frequency of the haplogroup within the ith population and
P is the mean frequency for the entire population data set. The population
heterozygosities or gene diversities (see Equation 2) were plotted against the
corresponding rii scores with the program Minitab ver. 14.0. According to
Harpending and Ward (1982), a linear relationship is expected between
heterozygosity and genetic distance if migration declines monotonically with distance
as conceived in Sewall Wright’s island model (1943), in which the heterozygosity of
the ith population should equal the heterozygosity of the overall population mean of
haplogroup frequencies multiplied by (1 – rii). Thus, deviations from this simple
relationship can be interpreted as evidence for either increased gene flow or greater
95
population isolation, depending upon where a population lies in respect to this
theoretical relationship.
Mismatch Distributions
In addition to the neutrality test statistics, demographic episodes of population
expansion can be detected in genetic data by identifying particular signatures in the
distribution of pairwise sequence differences, also known as mismatch distributions
(Slatkin and Hudson 1991, Rogers and Harpending 1992).
Under the Infinite Sites Model (ISM), Watterson (1975) derived the
probability of observing i differences between two sequences in an equilibrium
population as
( )i
iF
+
+
=11
1
θθ
θθ . (15)
Rogers and Harpending (1992) found that the equilibrium distribution based upon
Watterson’s theoretical formula poorly fit the mismatch data observed in global
populations (Cann et al. 1987), producing a smooth decline instead of a unimodal
distribution that is characteristic of most populations. A number of possibilities were
considered as a potential source for this lack of concordance, including sampling
error, failure of the ISM, and selection. However, the authors demonstrated in their
seminal paper that variation in population size is the likely factor responsible for
creating mismatch “waves”.
96
In an earlier paper, Li (1977) derived the probability of observing i differences
between two sequences taken at random in a population that has instantaneously
expanded from N0 to N1 as
( ) ( ) ( ) ( )[ ]∑=
−−
+−
−×+=i
j
jiji
j
ii FFj
eFF0
10
1
110 !,, 1
1
θθτ
θτθθ θθ
τ
, (16)
where θ0 = 2N0µ, θ1 = 2N1µ, and τ = 2µt (t is post-expansion time in generations).
Simulating distribution curves with Li’s expression, Rogers and Harpending (1992)
Figure 21 Coalescent simulation of gene genealogy and corresponding mismatch
distribution (Rogers 2004) Coalescent simulation based on the following growth parameters: θ0 = 1, θ1 = 100, and τ = 7.
97
found that unimodal waves are generated, moving from lower to higher pairwise
difference values (i) when τ was increased (see Figure 21). The authors argued that
because most coalescent events (i.e., when two or more alleles originate from the
same parent) in an expanding population are clustered over a short period, the number
of generations separating pairs of sequences, along with the expected number of
mutations, will be fairly constant. The variation in the number of pairwise
differences is due to the variance of the Poisson mutation process, but the overall
distribution will be unimodal with a variance approaching the mean. Furthermore,
Rogers and Harpending note in their paper that population size equilibrium would
likely produce multimodality because the gene genealogies for static populations, as
simulated by the coalescent algorithm (Slatkin and Hudson 1991, Rogers 2004),
exhibit long internal branches that create significant fragmentation of the haplotypic
profile.
Mismatch distributions were determined for Aleut HVS-I data for three
haplogroups (A3, A7 and D2) using Arlequin ver. 3.1 and graphically displayed in
Microsoft Excel 2003.
Estimates of Coalescence Time
The timing of coalescence (i.e., the age of the most recent common ancestor
or MRCA) of Aleut mtDNA subclades was estimated by computing the ρ statistic
using the program Network ver. 4.5. The ρ statistic is the average pairwise difference
between a cluster of sequences to a designated root or basal sequence within a median
network and calibrated to a rate of 20,180 years per mismatch difference
98
(alternatively, this rate equals 0.12 mutations per million years per nucleotide)
(Forster et al. 1996; Saillard et al. 2000). A key advantage of this statistic over other
methods of coalescence estimation (e.g., τ parameter from mismatch analysis) is its
relative insensitivity to mutation rate heterogeneity (i.e., mutation hotspots), which is
especially problematic for the HVS-I where 29 sites have been found to mutate at
about 12 times the rate of other sites in the same region (Schneider and Excoffier
1999). However, since ρ is derived from haplotypic networks that are capable of
resolving identical site variants as either independent mutation events or the products
of common ancestry, this potential problem is mitigated.
The mutation rate used in the calibration of colescent dates derives from
phylogenetic considerations of mtDNA subclade A2 and the timing of the end of the
last glacial period in northern North America. According to Forster et al. (1996), the
diversity of haplogroup A2 in Eskimo and Na-Dene populations has accumulated
since the end of the Younger Dryas glacial relapse approximately 11,300 years ago
when warmer circumarctic temperatures prevailed and allowed for considerable
population growth by indigenous peoples. The mutation rate is comparable to other
estimates based on human and chimpanzee divergences (Ward et al. 1991, Hasegawa
et al. 1993, Tamura and Nei 1993). However, HVS-I mutation rates calculated from
direct observations of mutations arising in families or deep-rooted pedigrees have
produced estimates that are approximately 5-fold higher than the rates based on
phylogenies (generally around 0.5 mutations per million years per nucleotide)
(Pakendorf and Stoneking 2005) and are supported by coalescent simulation analysis
99
of HVS-I data for populations with well-known demographic histories (Zlojutro et al.
2008). Many explanations have been offered to account for these differences,
including paternal mtDNA leakage and recombination, mutation rate heterogeneity,
and the effects of selection and/or genetic drift (Macaulay et al. 1997, Siguroardóttir
et al. 2000, Hagelberg 2003, Howell et al. 2003). Interestingly, Ho et al. (2005) have
described an exponential decay in the HVS-I mutation rate using Bayesian methods,
suggesting that for questions concerning recent history (e.g., forensics or biological
relationships between supposed kin) the pedigree-based rate would be most
appropriate. Clearly, this discrepancy in mutation rates has important implications
for reconstructions of human evolutionary history based on mtDNA variation, and
thus caution is required when interpreting the results, noting that the time estimates
would be approximately 5-fold lower using the pedigree-based rates.
Delaunay Triangulation
In order to identify areas of abrupt genetic change within the Aleutians and
surrounding environs, a geographic network of sampling locations was obtained by
constructing Voronoï tessellations and deriving Delaunay triangulations from them.
The Voronoï diagrams are two-dimensional lattices composed of polygons (see
Figure 22) that are defined by having all possible points inside the polygons closest
to its centroid (i.e., the location of the sampled population) than to any other
neighboring centroids (Voronoï 1908). Furthermore, each vertex of a Voronoï
polygon is located at the intersection of three edges, such that the vertex will be
equidistant from three sampled locations represented by the centroids of the
100
Figure 22 Example of Voronoï tessellation
Figure 23 Circumcircle property of Delaunay triangulation
101
Figure 24 Example of Delaunay triangulation-based connectivity network
surrounding polygons. As a result of this characteristic, the vertices will become the
centres of circumcircles formed by three centroid points, as well as correspond to the
intersection of medians for triangles that connect these points (see Figure 23). A
Delaunay triangulation network is obtained from creating all the triangles that have a
circumscribed circle whose centre is a Voronoï vertex (Brassel and Reif 1979) and
thus connecting all adjacent points on a map (see Figure 24). Delaunay
triangulations were computed in the programs Barrier ver. 2.2 (Manni et al. 2004) and
Alleles in Space ver. 1.0 (Miller 2005), which served as an initial step for
methodologies investigating genetic differentiation in geographic space (see the
following sections).
102
Monmonier’s Maximum-Difference Algorithm
Based on a Delaunay triangulation connectivity network, Monmonier’s (1973)
maximum-difference algorithm was used to identify genetic boundaries, namely
geographic zones where differences between populations are largest. The algorithm
was applied in the program Barrier ver. 2.2 with the following three step procedure:
(1) link each edge of the Delaunay triangulation to its corresponding pairwise
distance value from a genetic distance matrix (either DA for HVS-I data or RST for Y-
STR haplotypes); (2) start a boundary at the edge with the largest genetic distance and
proceed across adjacent edges whose distance value is higher; and (3) continue until
the boundary has reached either the limits of the triangulation map or another
Figure 25 Example of barrier construction using Monmonier’s algorithm
The barrier (red line) starts at the triangulation edge with the largest genetic distance (between populations 1 and 2). Next, the edge between populations 2 and 3 has a larger genetic distance (D23) than the one between populations 1 and 3 (D13), and therefore the algorithm extends the barrier across this edge. This procedure is continued until the barrier reaches the limit of the triangulation network between populations 5 and 6.
103
preexisting boundary (Manni and Guérard 2004). An example of a Monmonier
barrier is shown in Figure 25. The significance of the barriers were not tested,
however it is expected to decrease with the rank of the boundaries. In principle,
barrier construction can be continued until all edges of a triangulation network are
crossed and thus the number of barriers identified were informed by population
genetic considerations and ultimately should be viewed as an exploratory tool for
understanding genetic differentiation in relation to geographic space.
Genetic Landscape Interpolation
Interpolation of pairwise genetic distances was performed as a means of further
visualizing spatial patterns of genetic diversity. Using the program Alleles in Space
(AIS) ver. 1.0, a three-dimensional surface plot was generated, where the x and y axes
correspond to geographical locations and the z axis (i.e., surface heights) represents
genetic distance residuals derived from the linear regression of all pairwise genetic
distances and geographic distances (Manni et al. 2004). Based on a Delaunay
triangulation connectivity network, genetic distance residuals between sampling
locations are placed at the midpoints of each connection and surface heights are
interpolated for all of locations overlaid on a uniformly spaced rectangular grid (x, y).
This is accomplished by an Inverse Distance weighted interpolation procedure
(Watson and Phillips 1985, Watson 1992), in which inferred genetic distances, Z, is
obtained for each of the i = 1 to n genetic distance residuals (Zi) assigned to the
midpoints of the connectivity network as
104
∑∑
=
=×
=n
i i
n
i ii
w
ZwZ
1
1 , (17)
where wi is a weighting function applied to each Zi that is inversely proportional to
the distance between a grid coordinate (x, y) and the actual geographical coordinates
(Xi, Yi) used to construct the Delaunay network. The weighting function is computed
as
( ) ( )[ ]yYxXw ii
a
i −+−−
= 22 2 , (18)
when Xi ≠ x, Yi ≠ y (the function is one when the coordinates are equal) and a is a
distance weighting value (Miller 2005).
Spatial Analysis of Molecular Variance
The analysis of molecular variation (AMOVA) has been widely used for the
hierarchical analysis of molecular differences between haplotypes in a set of sampled
populations (Excoffier et al. 1992). Using a genetic distance matrix that summarizes
haplotypic differences, the following equation is used to compute the total sum of
squares:
( ) ∑∑= =
=N
j
N
k
jkTotalN
SSD1 1
2
2
1δ , (19)
105
where N is the total number of haplotypes and δjk2 is the genetic distance between jth
and kth haplotypes. Based on the hierarchical structure being investigated, the total
SSD can be partitioned into SSD among groups and SSD within groups. From these
results, F-statistic analogs, known as Φ-statistics, can be calculated and reflect the
proportion of variation attributable to the hierachical divisions.
Physical, ecological, linguistic and/or cultural criteria are typically used to
define a priori groups of populations to be tested in this manner. But when no
obvious criteria exist for defining groups of populations, the investigation of genetic
structure may be problematic. Several methodologies have been developed to detect
the presence of genetic barriers in population genetic data sets, including
Monmonier’s maximum-difference algorithm and genetic surface interpolations,
which are discussed above. However, these approaches have important limitations.
The Monmonier algorithm can lead to the identification of weak genetic barriers due
to the directional and incremental nature of the technique (i.e., fixation at a local
optimum solution). And when the sampling points are not regularly spaced, the
interpolation process can produce spurious discontinuities, especially for PC maps
based on allele frequency data (Sokal et al. 1999).
Faced with these limitations, Dupanloup et al. (2002) developed a new
approach – spatial analysis of molecular variance (SAMOVA) – for defining groups
of populations that are geographically homogeneous and maximally differentiated
from each other, and in the process identifying genetic barriers between the inferred
groups. The algorithm is composed of the following steps: (1) a two-dimensional
106
space of Voronoï polygons are constructed from the geographical location of the n
population samples; (2) an arbitrary partition of the n populations into K groups
(which is selected a priori) is initially chosen at random; (3) the genetic barrier(s)
between the K groups are identified as edges of the Voronoï polygons; (4) the FCT
index associated with the K groups is computed; (5) an edge on a given barrier is
selected at random; (6) one of the two populations located at the selected edge is
randomly assigned to the group on the opposite side of the barrier; (7) the genetic
barrier is updated and the new FCT* value is computed; and (8) the new structure is
accepted with the probabilities
1=P if FCT* ≥ FCT
( ) ACTCT SFF
eP−=
*
if FCT* < FCT
where S is the number of times steps 5-8 are repeated (set to 10,000) and the constant
A is 0.9158 such that the probability P defined above is equal to 1% if the difference
between FCT and FCT* at the 10,000th iteration is equal to 0.001. This means that
there is a probability of 1% to accept a slightly worse FCT value at the end of the
process. To ensure that the final configuration of K groups is not affected by a given
initial configuration, the process is repeated multiple times, each time from a different
initial partition of the n samples into K groups as determined by the preliminary steps
1-4. Simulations showed that the SAMOVA algorithm indeed finds maximally
differentiated groups that do not always correspond to predefined genetic barriers.
107
SAMOVA analyses were performed on HVS-I data (DA distances) for Aleut
and neighboring Beringian populations using the computer program SAMOVA ver.
1.0 (Dupanloupe et al. 2002). The number of population groupings (K) investigated
ranged from two to seven, with the process repeated 100 times for each run.
Mantel Test
The Mantel test is a method for testing the significance of the correlation
between two or more matrices, and was used in this study to investigate the
relationship between genetics and geography of Aleut and surrounding Beringian
populations for HVS-I and Y-STR haplotypic data sets. For a test involving two
square matrices, X = {xij} and Y = {yij}, the correlation is classically defined as
( )( ) ( )YX
YX,
SSSS
SPrXY = , (20)
where SP is the sum of products for X and Y, and SS is the sum of squares for the
individual matrices (Mantel 1967). Using the program Arlequin ver. 3.1, Mantel tests
were performed on DA and RST matrices with geographic distance matrices (km)
computed in GEOG ver. 2.1 (Relethford 2000). The significance of the correlations
was determined by a permutation procedure of the original matrices and the
computation of the following quantity:
∑∑= =
==N
i
i
j
ijijXY yxZ1 1
* YX . (21)
108
The permutated Z*XY quantities (n = 1000) were compared to the original ZXY to obtain
P-values (Smouse et al. 1986).
Spatial Autocorrelation
The degree of dependency of HVS-I haplotypes in geographic space (i.e.,
whether or not haplotypes in nearby populations are more similar than haplotypes in
more distant populations) was quantified for Aleut and Beringian populations by
spatial autocorrelation. Different patterns of nonindependence are expected for
different types of human genetic variation, such as isolation by distance and regional
clines. This analytical method requires pooling sampled localities within defined
geographic distance classes (km) and calculating measures of genetic similarity that
varies between 1 (strong positive autocorrelation) and -1 (strong negative
autocorrelation) for each distance class (Jobling et al. 2004). Classic spatial
autocorrelation statistics for allele frequency data include Moran’s I and Geary’s C
(Sokal and Oden 1978). For molecular data, such as HVS-I sequences, Bertorelle and
Barbujani (1995) devised two spatial autocorrelation analogs, II and cc indices.
Using the program AIDA developed by these two authors, II scores were computed
for the Aleut and Beringian HVS-I data according to the following equation
( )( )( )∑∑ −
∑∑∑
= =
=
−
= >
−−
=n
i
S
k
kjk
S
kkik
n
i
n
ijij
pp
ppppw
kikW
n
II
1 1
2
1
1
1 , (22)
109
where n is the sample size, W is the number of pairwise comparisons within a
particular distance class, pik and pjk are the haplotype frequencies of the ith and jth
individuals, respectively, at the kth site, kp is the kth element of the average vector,
and the weights wij are 1 if individuals i and j fall within the same distance class, 0 if
otherwise. Summation is for S sites and all individuals in the sample. Confidence
intervals were computed by a permutational method. The autocorrelation scores were
plotted against the geographic distance classes, referred to as a correlogram, and was
used as a means of investigating departure from spatial randomness.
110
CHAPTER FOUR: RESULTS
This chapter presents the genetic variation of Aleut mtDNAs and Y-
chromosomes from eastern communities as characterized by RFLP typing, direct
sequencing of the HVS-I and Y-SNPs, and fragment length analysis of Y-STR
multiplex products. The genetic data were analyzed using several statistical methods,
including: diversity measures and neutrality test statistics; Median-Joining networks;
ordination analyses of genetic distances and R-matrices to characterize genetic
relationships between Aleut communities and neighboring Beringian populations;
spatial autocorrelation and Mantel tests to evaluate the correlation between genetics
and geography; and surface interpolation using genetic distance residuals, along with
the application of SAMOVA and Monmonier algorithms on spatial networks, to
detect genetic barriers or discontinuities in geographic space.
Mitochondrial DNA
HVS-I Sequencing and Haplogroup Frequencies
The sequencing results for the HVS-I region of the mtDNA genome for 114
individuals from the five sampled communities are presented in Table 5. In addition,
sequence data for Aleut participants from Unalaska, Nikolski, Atka, the Pribilofs and
Bering Island are also listed (Rubicz et al. 2003, Zlojutro et al. 2006). A total of 21
different haplotypes are observed in the entire Aleut data set (n = 267), all belonging
to haplogroups A or D. Seventeen of these are characterized to three subhaplogroups:
* P < 0.05; ** P < 0.01. Standard deviations for the diversity measures are provided in parantheses. estimators. This low mtDNA diversity reflects the fixation of haplogroup D
(sequences AL20 and AL23) and has been explained by Rubicz (2007) as the genetic
consequence of the Bering community experiencing a founder effect in its original
settlement by the Russians, followed by closure of this community from other Aleut
populations after the American purchase of Alaska in 1867. The other amalgamated
populations, St. George and St. Paul, exhibit relatively low gene diversity and θπ
values and is also likely related to their founding in the 19th century. Overall, the
diversity values for the Aleut populations are 0.740 for gene diversity, 3.729 for θπ
and 3.636 for θS. The values for the eastern communities are comparable to these
119
levels, although the θS scores are somewhat depressed and, based on the definition of
this measure, indicate a relatively smaller number of variant HVS-I sites and/or
haplotypes in the mtDNA data for these populations.
In comparison to the neighboring Beringian populations, the diversity levels
for the Aleuts are among the lowest, with the exception of the Alaskan Yupik sample.
The Kamchatkan groups and Chukchi exhibit the highest values for all three
measures, other than the gene diversity score for the Athapaskans. This is consistent
with the findings of Zlojutro et al. (2006), who identified a similar regional pattern in
which northern North American populations display lower mtDNA diversity levels
relative to Amerind and Siberian groups that may represent the genetic imprint of
multiple migrations from Asia with varying chronologies, with the Esko-Aleut and
Na-Dene speakers being the latest migrants into the New World.
For the neutrality test statistics, three Aleut communities exhibit significant
positive Tajima’s D scores: Akutan, King Cove and Nikolski. These types of
deviations for neutral genetic systems have typically been interpreted as evidence for
population bottlenecks (Tajima 1989b). However, this is not reflected in the total
Aleut sample, which has non-significant scores of 0.067 and -7.218 for D and Fu’s
FS, respectively. The values for other Beringian populations are mostly negative,
with the Chukchi, Koryaks and Athapaskans exhibiting significant FS scores, which
are considered genetic signatures of population expansion. But it should be noted that
other factors can account for deviations in these statistics, including background
selection and mutation rate heterogeneity (Tajima 1993, Aris-Brousou and Excoffier
120
1996). Furthermore, relative to other global populations, Native Americans, northeast
Siberians and hunter-gatherer groups generally have smaller negative or positive
neutrality test results (Excoffier and Schneider 1999, Zlojutro 2006). In particular,
the pattern in Native Americans can be explained as the product of a strong founder
effect at the time of colonization of the New World and/or the recent population crash
experienced by these groups after European contact. However, simulation studies
have shown that bottleneck times of 100 generations or more are required to
weakening the latter explanation. And on a final note concerning these statistics,
gene flow appears to also play an important role. In a research paper by Ray et al.
(2003), gene flow among simulated metapopulations have shown that high levels of
gene flow increase the probability of significant negative D and FS values. Therefore,
despite the fact that the D and FS tests are commonly employed in human population
genetic studies, the exact meaning of these measures for neutral genetic systems are
difficult to interpret.
MtDNA Network Analysis
The Median-Joining (MJ) networks for Aleut HVS-I data for haplogroups A
and D are presented in Figures 28 and 29. Incorporated into these networks are the
frequencies of haplotype sharing by neighboring Beringian populations, as indicated
by the size and color-coded division of the haplotype nodes. For the network of
haplogroup A, three subclades that derive from the Asian root (A4) are identified: A2,
121
Figure 28 Median-Joining network for haplogroup A Circles represent HVS-I haplotypes, with the size of the circles corresponding to the haplotype frequency in Aleut, Central Alaskan, Chukotkan, and/or Kamchatkan populations. The lines connecting the haplotypes represent mutation pathways (mutations are abbreviated to the last three digits of np 16,000-16,400 of the mtDNA genome).
122
Figure 29 Median-Joining network for haplogroup D
Circles represent HVS-I haplotypes, with the size of the circles corresponding to the haplotype frequency in Aleut and/or Chukotkan populations. The lines connecting the haplotypes represent mutation pathways (mutations are abbreviated to the last three digits of np 16,000-16,400 of the mtDNA genome). The lone transversion, np 16,092 T→A, is presented as 92A.
123
which represents one of the major mtDNA founding lineages of Native American
populations (the other subhaplogroups being B2, C1, D1 and X2a) and is defined by a
transition at np 16,111 (Bandelt et al. 2003); A3, a common lineage among northern
North American and Chukotkan populations that derives from A2 (Forster et al. 1996,
Starikovskaya et al. 1998, Saillard et al. 2000, Helgason et al. 2006); and A7, a
subclade of A3 that has only been identified in Aleut populations (Rubicz et al. 2003,
Zlojutro et al. 2006) and represents 60 individuals (22.5% of the total Aleut sample).
As discussed previously, subhaplogroup A6 is predominantly found among Inuit
populations and a single Aleut sequence from Nelson Lagoon was assigned to this
lineage, but was omitted from the network to prevent excessive cluttering and focus
the diagram on the major Aleut lineages. [Note, an alternate nomenclature has been
proposed by Helgason et al. (2006) for the A2 subhaplogroups that uses lowercase
roman letters for the nested clades and has been adopted in a number of recent
studies: A2a for A3 and A2b for A6. However, in order to maintain consistency with
the Aleut mtDNA studies conducted by Zlojutro et al. (2006) and Rubicz (2007), the
other classification scheme is utilized].
In addition to A7, a second branch that is specific to the Aleuts is observed in
the network. Characterized by a transition at np 16,234, this sublineage contains
three haplotypes representing 15 Aleut individuals (5.6% of the sample). According
to Rubicz et al. (2003), this mtDNA cluster dates to approximately 4,000 years BP
and likely arose through a combination of founder effect and geographic isolation in
the Aleutian Islands.
124
For haplogroup D, the network is almost entirely comprised of D2 sequences,
with the lone exception being a D3 haplotype from Nelson Lagoon. The D2 subclade
exhibits a star-like structure, which is typically interpreted as a genetic signature of
population expansion (Slatkin and Hudson 1991). Two additional star-like structures
are also evident for Aleut sequences of the A3 and A7 clusters (Zlojutro et al. 2006).
The D2 root is the only haplotype found in both Aleut and Chukotkan populations,
with all of the derived haplotypes presented in the network only observed in the Aleut
samples. A major lineage of D2, however, has been identified that is specific to
Chukotkan populations, referred to as subclade D2c (Derbeneva et al. 2002), which is
defined by a transition at np 16,366 (branch not shown in Figure 29).
Neighbor-Joining Tree
A Neighbor-Joining (NJ) tree based on an intermatch-mismatch (DA) distance
matrix for HVS-I sequence data is presented in Figure 30. The correlation of the NJ
phylogeny (i.e., cophenetic matrix) to the original distance matrix is higly significant
(r = 0.597; P < 0.001), indicating a good fit to the data. The tree is comprised of
three major branches relative to the central node positioned between Nikolski and St.
Paul. Towards the bottom of the tree are the two Kamchatkan populations, which are
separated from the other groups by a very long branch and thus indicating substantial
genetic differentiation. To the right of the central node are the historically founded
populations of Bering Island and the Pribilofs, as well as Atka. And the clade to the
left of the central node includes the remaining Aleut communities, which cluster
125
Figure 30 Neighbor-Joining tree based on DA distance matrix of HVS-I data
together, and the Chukotkan and Alaskan populations, with the Alaskan Yupik the
farthest removed. Of the Aleut communities, Nelson Lagoon is positioned closest to
any of the non-Aleut populations (i.e., Siberian Yupik).
126
R-Matrix Analysis
An R-matrix based on haplotype frequencies was computed for the Aleut
communities and neighboring Beringian populations and was projected into two-
dimensional space using principal components analysis (PCA) (see Figure 31). The
first axis accounts for 22.2% of the R-matrix variation and clusters the Aleut
communities separately from the non-Aleut populations. However, similar to the NJ
tree, Nelson Lagoon is positioned closest to the Chukotkan and Central Alaskan
populations. This result is likely a reflection of the atypical HVS-I profile of Nelson
Lagoon. This sample harbors two haplotypes (AL29 and AL30) that belong to
haplogroups D3 and A6, which are absent in other Aleut communities but are present
in the Chukotkan and Alaskan populations. The second axis captures 16.9% of the
Figure 31 PCA of R-matrix computed from haplotype frequencies
127
Figure 32 PCA biplot of R-matrix population coefficients and haplotype scores The closed squares represent the scaled eigenvector coefficients for the population variables as presented in Figure 31 (blue squares are Aleut groups, red ones are Chukotkan, green ones are Alaskan, and black ones are Kamchatkan). The open triangles represent haplotype scores (blue triangles belong to haplogroup D2, red ones to haplogroup A7, and black ones to haplogroups A2 and A3). The two haplotype scores identified in the plot as haplogroup A7 and D2 represent the root sequences for their respective haplogroups.
variation, and thus the PCA plot accounts for a total of 39.1% of the R-matrix
variation. Against the second axis, the Kamchatkan populations are separated from
the other Beringian groups, with the Alaskan Yupik located at the other end of the
dimension. The isolation of the Koryaks and Itelmen in the plot is due to their low
frequencies of haplogroup A (0.054 and 0.065, respectively) and high numbers of
Asian lineages such as G and Y.
A biplot of the scaled eigenvector coefficients for the population variables and
haplotype scores is presented in Figure 32. Along the first dimension the roots for
128
subhaplogroups A7 and D2 are the genetic variables primarily responsible for the
dispersion of the Aleut communities away from the non-Aleut populations. This
result is not surprising given that subhaplogroup A7 is Aleut-specific and D2 has its
highest frequencies in Aleut populations. On the other hand, haplotype variables
belonging to A2 and A3 have situated the Chukotkan and Alaskan populations
towards the other end of the axis. Thus, the proximity of the Aleut communities to
non-Aleut populations appears to be predicated upon the frequencies of haplogroup A
and its subclades. As noted above, Nelson Lagoon is positioned closest along the first
axis, followed by False Pass, King Cove and Akutan. All four of these eastern
communities have the highest frequencies of haplogroup A, ranging from 0.515 to
0.727 (see Table 6), with the only exception being Unalaska (0.607). Moreover, the
orientation of these five particular communities in relation to one another is based
upon the frequencies of subclades A2 and A3. Unalaska and Akutan have low
combined frequencies (0.071 and 0.063, respectively) and are positioned towards the
center of the Aleut cluster. Conversely, Nelson Lagoon (0.250), False Pass (0.152)
and King Cove (0.182) have relative high frequencies of A2 and A3 and are
positioned closer to the Chukotkan and Alaskan groups.
Multidimensional Scaling and SAMOVA Analysis
A multidimensional scaling (MDS) plot based on a DA distance matrix
computed from the HVS-I sequence data is presented in Figure 33. The stress level
of the plot is 0.095, which according to guidelines proposed by Kruskal (1964a)
129
Figure 33 MDS plot of DA distance matrix and results of SAMOVA analysis (K = 4)
represents a “good” fit with the distance matrix. Overall, the plot presents a
projection similar to the R-matrix analysis based on haplotypic frequency data. The
Aleut communities cluster together, with the dispersion mostly in the first axis. The
Chukotkan populations are closest to the eastern communities of Nelson Lagoon and
False Pass, whereas the Alaskan groups are positioned further away relative to the
first axis. The Kamchatkan populations are again isolated from the other Beringian
groups, particularly along the second dimension.
In order to investigate the relationship of the population clusters differentiated
in the MDS plot to the geographic proximity of these populations, a series of
SAMOVA analyses were conducted. The number of population groups (K) that were
considered in the SAMOVA computations ranged from two to seven. The highest
130
ФCT score was obtained with K set to four groups (0.326; P = 0.000) and the results
are shown in Figure 33. As expected from their isolation in the NJ tree and
ordination plots, the Kamchatkan populations comprise one of the groups.
Interestingly, the Alaskan Yupik forms a group by itself, which may be due to its near
fixation of haplogroup A. For the remaining two groups, the Aleut communities of
Bering Island, the Pribilofs and Atka are separated from the more eastern
communities, as well as the Chukotkan and Athapaskan populations. This genetic
discontinuity is likely a reflection of the high frequencies of haplogroup D in Atka
and the amalgamated Aleut settlements.
Monmonier’s Maximum Difference Algorithm
To further investigate genetic differentiation of Beringian populations in
geographic space, Monmonier’s (1973) maximum difference algorithm was applied
to a Delaunay triangulation derived from population coordinates (see Figure 34).
Using the results from the SAMOVA analysis as a guide, four genetic barriers were
identified with Monmonier’s algorithm. The barrier with the maximum degree of
genetic differentiation was located between the Chukotkan and Alaskan Yupik groups
and the Aleut communities. The next barrier identified by the algorithm isolates the
Kamchatkan populations from the Chukchi and Bering Island settlement. The third
barrier is located between the Athapaskans and the eastern Aleut communities. And
the fourth zone of genetic discontinuity is between the Pribilofs and Nikolski and the
Aleut communities to the east. These results are slightly different from the
population groupings obtained in the SAMOVA analysis, which identified the
131
Figure 34 Application of Monmonier’s maximum difference algorithm to DA distance
matrix for HVS-I data Four sequential genetic barriers (red arcs) were identified in a Delaunay triangulation constructed from the geographic coordinates of Beringian populations.
Alaskan Yupik as an outlier and did not include Nikolski in the cluster of
amalgamated Aleut communities. These differences likely stem from the fact that the
barriers detected by Monmonier’s algorithm only require a single maximum pairwise
genetic distance to initiate the iteration process, whereas the SAMOVA method
searches for groups of adjacent populations that maximize genetic variation between
them regardless of pairwise differences of the individual populations. However, both
methods reveal an east-west genetic structure in the Aleut communities.
132
Genetic Surface Interpolation
The final method used to determine regions of genetic differentiation for
Beringia is Miller’s (2005) genetic surface interpolation (see Figure 35). Similar to
the application of Monmonier’s algorithm, a Delaunay triangulation network is
utilized. The genetic surface is generated from the residual values of a regression
between pairwise genetic and geographic distance variables. The residual scores are
placed at the midpoint of the Delaunay connections and a surface landscape is created
by inverse distance interpolation. Thus, the surface landscape is defined by three
Figure 35 Genetic surface interpolation based on HVS-I data Residual scores derived from a linear regression of intermatch genetic distances on geographic distances were used to generate a landscape surface created by inverse distance interpolation. The x and y axes represent the geographic coordinates of populations in a Delaunay triangulation network. The z axis corresponds to the residual genetic distances.
133
axes: x and y, which represent the geographic coordinates of the Delaunay network of
populations; and z, the positive or negative residual scores of the population pairs.
For the Aleut communities and surrounding Beringian populations, five surface peaks
were produced (i.e., pairwise genetic distances that are greater than expected given
the geographic distance between the population pair). In the west, there are two
peaks separating the Kamchatkan groups from Bering Island and the Chukchi, as well
as a third situated between the Koryaks and Itelmen. Further to the east, a
pronounced peak separates the Alaskan Yupik from the Pribilofs. And among the
Aleut communities, a fifth peak arises between Nikolski and Unalaska, which
supports the results of the other methods employed in this study that show an east-
west genetic differentiation for the Aleut populations. Lastly, a major depression was
produced in the surface landscape between the Bering Island settlement and the
nearest Aleutian communities, which indicates that the Bering sample is genetically
similar to other western Aleut populations despite the large distance that separates the
groups (approximately 1,300 km).
Diversity versus rii Plot
The plot of haplotype diversities (equivalent to the heterozygosity measure of
diploid systems) against the distances from the centroid (rii) computed in the R-
matrix analysis is presented in Figure 36. According to Harpending and Ward
(1982), a linear relationship between diversity and rii is expected for human genetic
variation that follows an isolation by distance model where “peripheral” populations
experience less gene flow and results in lower diversity and greater differentiation.
134
With the exception of Nelson Lagoon and Nikolski, all of the Aleut communities fall
below the theoretical relationship. This suggests that the Aleut populations have
experienced a high degree of isolation relative to other Beringian groups. In
particular, the communities of Bering Island and St. George are considerably below
the theoretical line and as a result produce a positive regression fit to the data (not
shown). The relative low diversity for these two populations is likely a product of
founder effect stemming from their original settlement by the Russians. Both Yupik
populations are located below the theoretical line, whereas the remaining Beringian
Figure 36 HVS-I diversity versus rii plot
Heterozygosity values represent haplotype diversities (1-Σp2) for HVS-I data.
Distances from the centroid (rii) were computed in R-matrix analysis between Aleut and Beringian populations. The theoretical relationship between the two variables is displayed as a solid line and corresponds to average heterozygosities multiplied by (1-rii) (Harpending and Ward 1982).
135
populations are all positioned above the linear relationship, with the Koryaks and
Itelmen exhibiting the largest deviations, which suggests greater gene flow into these
particular groups.
Mismatch Distributions and Coalescent Time Estimations
In the MJ networks presented in Figures 28 and 29, star-like clusters are
evident in three subhaplogroups: A3, A7 and D2. This genetic characteristic is
commonly interpreted as a signature of population expansion (Slatkin and Hudson
1991). In order to gain further insight into Aleut demographic history from the HVS-
I data, mismatch distributions were determined for the star-like clades (see Figure
37). All three distributions are unimodal, which is also considered a product of
Figure 37 Mismatch distributions of mtDNA subclades for Aleut samples
136
population expansion (Rogers and Harpending 1992). However, the shapes of the
distributions vary. Both A7 and D2 have modes at zero pairwise differences, whereas
A3 peaks at one. Based on mismatch analysis theory, this modal difference between
the distributions suggests that the subclades are the products of multiple population
expansions, with A7 and D2 possibly being generated by the same demographic event
or process.
Based on the MJ networks, the ρ statistic was computed and coalescent times
were estimated for the three subclades by applying a mutation rate of 20,180 years
per HVS-I variant (see Table 8). The age of subhaplogroup A3 is 23,285 ± 13,488
years, which is considerably older than the dates derived for A7 (3,027 ± 1,932 years)
and D2 (5,247 ± 2,752 years). Thus, the expansion signature identified in the A3
cluster appears to be associated with demographic events of the last glacial maximum
(approximately 21,000 years BP) and is likely to have derived from the reduced gene
pools that existed in circumarctic populations during this period (although the large
standard deviation does not preclude the possibilities of alternate scenarios involving
much earlier or later expansions).
Table 8 Coalescent dates of mtDNA subclades for Aleut samples
mtDNA Subclades n ρ ± σ Age (years)*
A3 A7 D2
26 60
165
1.154 ± 0.668 0.150 ± 0.096 0.260 ± 0.136
23,285 ± 13,488 3,027 ± 1,932 5,247 ± 2,752
* The ρ statistic and σ were converted to time using the mutation rate of 20,180 years per HVS-I variant
(Forster et al. 1996, Saillard et al. 2000).
137
Given the more circumscribed geographic distributions of lineages A7 and D2
relative to A3 that is widespread in northern North America, the younger coalescent
dates likely correspond to demographic episodes localized to Beringia and the
Aleutian Archipelago. The D2 date of 5,247 years neatly parallels the approximate
onset of peopling into the central and western Aleutian Islands based on the
archaeological record. The age of A3 is younger by about two thousand years,
however the confidence intervals for the two dates overlap and may derive from a
single expansion event. Another plausible model that accounts for the
phylogeographic structure of D2 and was originally proposed by Zlojutro et al.
(2006) is that the clade represents a genetic marker of the Arctic Small Tool tradition
(ASTt), a circumarctic cultural development that expanded rapidly from Beringia
across northern Canada and Greenland around 4,000 years BP and gave rise to the
pre-Dorset peoples. Intriguingly, ancient DNA analysis has recently identified
haplogroup D2 for a pre-Dorset specimen discovered at a Greenland site (Gilbert et
al. 2008), an area where D2 has not been identified among extant Eskimo
populations. This finding suggests that D2 was an early mtDNA lineage of Beringia
that not only played a major role in the ethnogenesis of the Aleuts, but also
represented an important genetic lineage of the paleo-Eskimo migrants into northern
North America.
138
Y-Chromosome DNA
Y-Chromosome STR Haplotypes and Population Diversities
The Y-chromosome STR haplotypes for 75 male individuals from the five
sampled communities are presented in Table 9. Also listed are haplotypes for 62
participants from Unalaska, St. George, St. Paul and Bering Island (Rubicz 2008).
The Aleut samples were typed for the United States “core” Y-STR haplotype
(Budowle et al. 2005), which include the following eleven loci: DYS19, DYS385a/b,
DYS389I, DYS389II, DYS390, DYS391, DYS392, DYS393, DYS438, and DYS439.
A total of 89 haplotypes are observed in the nine Aleut populations, with 42 new
haplotypes characterized in the five eastern communities. The vast majority of the Y-
STR variants are population specific (77 haplotypes or 86.5%), of which 64 represent
singletons. The most frequent haplotype (16-11/14-14-30-25-10-11-13-11-11) is
observed for seven Aleuts from Bering Island and the Pribilofs.
The population diversities for the Aleut Y-STR data are presented in Table
10. Gene diversities (1-Σp2) were computed for the haplotype frequencies and ranged
from 0.889 in the False Pass sample to 0.995 in the Bering sample. The mean
number of pairwise differences (MPD) was also calculated and ranged from 5.756 for
St. George to 7.642 for Unalaska. Interestingly, the Bering sample exhibits the
highest gene diversity value and the second highest MPD, which is in stark contrast to
the mtDNA data that revealed extremely low diversity levels in this population. This
discrepancy between the two genetic systems likely stems from the different modes of
inheritance (i.e., maternal versus paternal) and the corresponding impact of Russian
139
Table 9 Y-Chromosome haplotypes in Aleut communities
a Haplotypes based on alleles (i.e., repeat numbers) for the following Y-STR loci: DYS19, DYS385a/b, DYS389I, DYS389II, DYS390, DYS391, DYS392, DYS393, DYS438, and DYS439. b Communities: UN = Unalaska; SG = St. George; SP = St. Paul; BR =Bering Island; AK = Akutan; FP = False Pass; KC = King Cove; NL = Nelson Lagoon; and SD = Sand Point.
141
Table 10 Diversity values for Y-STR haplotypes in Aleut populations Aleut Communities n Gene Diversity MPD
Unalaska St. George St. Paul Bering Akutan False Pass King Cove Nelson Lagoon Sand Point
Standard deviations for the diversity measures are provided in parantheses. MPD is mean number of pairwise differences (π). male gene flow on Bering Y-chromosome diversity. Overall, there is no apparent
geographic pattern in the diversity levels. The total Aleut sample has a gene diversity
of 0.990 and a MPD of 7.353, which are comparable to Y-STR diversities reported
for Native American populations from the United States (Redd et al. 2006).
Y-Chromosome SNPs and Haplogroup Frequencies
Results of the Y-chromosome SNP analysis are presented in Table 11. A
total of ten Y-SNPs were characterized in the Aleut samples via direct sequencing,
each one defining a different Y-chromosome haplogroup. The most common
haplogroups are R1a (25.5%) and R1b (21.9%), which are observed in almost every
Aleut community. These patrilines are prevalent in Europe, with R1a widely found in
Eastern European and Russian populations (Kayser et al. 2005) and R1b common in
Western Europe and the British Isles (Semino et al. 2000, Alonso et al. 2005).
Haplogroup I1a, another European lineage that is mainly observed in Scandinavian
142
Table 11 Y-SNP haplogroup frequencies in Aleut communities Phylogeny represents human Y-chromosome haplogroups. Diagnostic Y-SNPs are positioned along the phylogeny branches, with the corresponding haplogroup designations placed at the branch termini and column headings of the frequency table.
populations (Rootsi et al. 2004, Karlsson et al. 2006), has the third highest frequency
in the Aleuts (13.9%) and is mostly found in the eastern communities. Of the
remaining six haplogroups identified in the Aleuts, only Q* and Q3 are considered to
be Native American in origin (Zegura et al. 2004). [Note, haplogroup C3b is also
regarded as a Native American founder lineage but was not identified in any of the
Aleut samples]. These two haplogroups have a combined frequency of 15.3% and are
present in every Aleut community, with the exception of Nelson Lagoon. Therefore,
84.7% of the Aleut male samples have non-Aleut Y-chromosomes, of which most are
likely to be of European origin (including haplogroups I, J and N), and represents an
estimation of the degree of male-mediated gene flow into the Aleut gene pool. In
143
Figure 38 Map of pie chart frequencies of Y-chromosome haplogroups for Aleut
communities stark contrast, the number of Aleut participants with mtDNAs not characterized to
haplogroups A and D is only six (6.1%), and thus suggesting a large degree of
asymmetry in European gene flow into Aleut communities with regards to gender.
The Y-chromosome haplogroup frequencies of the Aleut communities are
presented as pie charts in Figure 38 in order to reveal any geographic patterns that
may be present in the genetic data. However, unlike the mtDNA sequences that
exhibit a pronounced east-west differentiation, the geographic structure of the various
Y-chromosome haplogroups is less evident. For instance, haplogroups R1a, R1b and
I1a, which represent the majority of the Aleut Y-chromosomes, are present in most of
the communities. Although as mentioned above haplogroup I1a is found at higher
frequencies in the eastern populations, which may be indicative of differences in the
nature of male gene flow into this region. Furthermore, a Mantel test was performed
on matrices of Y-STR genetic and geographic distances and found a non-significant
144
negative correlation of -0.123 (P = 0.581), which contrasts the highly significant
result obtained for the mtDNA data (r = 0.717).
Y-STR Network Analysis
MJ networks were constructed for Aleut and European Y-STR haplotypes
based on seven loci: DYS19, DYS389I, DYS389II, DYS390, DYS391, DYS392 and
DYS393. The European Y-STR data represent three different populations – Germany
(n =549), Sweden (n = 708), and Russia (participants from Novgorod and Moscow; n
= 135). The data were obtained from the Y Chromosome Haplotype Reference
Database (YHRD), a collaborative online database (www.yhrd.org) maintained and
used by the international forensic and scientific communities. Specifically, the data
derives from a comprehensive Y-STR study conducted by Roewer et al. (2005), in
which 12,700 samples from 91 different locations in Europe were typed for the above
mentioned loci. In total, five networks were created for the major Y-SNP
haplogroups observed in Aleuts: R1a, R1b, I1a, N and Q (see Figures 39 through 43).
The European Y-STR haplotypes were assigned to haplogroups using the database
www.ysearch.org, an online tool developed by Genealogy by Genetics, Ltd, a
company that offers Y-DNA testing (both STRs and SNPs) to the general public
(approximately 59,000 Y-chromosome profiles as of May 2008).
The MJ network for haplogroup R1a is presented in Figure 39. The color-
coded nodes represent relative frequencies of the Y-STR haplotypes in their
respective population samples instead of absolute counts. This was done in order to
avoid a frequency skew towards the Swedish and German haplotypes because of the
145
Figure 39 Median-Joining network of R1a Y-STR haplotypes
Figure 40 Median-Joining network of R1b Y-STR haplotypes
146
much larger sizes of the samples. Clearly, R1a haplotypes are well-represented by
the Russian samples, with relatively high frequencies for most of the major nodes. Of
the fifteen Aleut R1a haplotypes, eleven are shared with the comparative European
populations. Overall, the network exhibits a tremendous amount of reticulation
(mutation pathways are represented by the gray connecting lines), which is typical of
Y-STR networks because of the high mutation rate for these loci (Kayser et al. 2004).
In Figure 40 is the MJ network for R1b haplotypes. A total of 128 different
haplotypes are presented in the network, of which 84 and 52 are observed in the
German and Swedish samples, respectively. The largest Y-STR node is found in all
four populations, with the highest frequency in the German data set. For the Aleut
samples, seventeen different R1b haplotypes were identified, with twelve shared with
the European populations, primarily the Germans and Swedes.
The MJ network for haplogroup I1a is shown in Figure 41. Most of the 66
haplotypes in the network are Swedish and/or German (87.9%), with only a single
haplotype from the Russian data set. Of the seven Aleut I1a haplotypes, six are
shared with Swedish and German samples. The most frequent haplotype in the
network is found in the Aleuts, with its highest frequency in the Swedes and
exhibiting a star-like structure.
The final two networks are based on haplogroups N and Q and are presented
in Figures 42 and 43. From earlier Y-SNP studies conducted on European
populations (Semino et al. 2000, Malyarchuk et al. 2004), haplogroup N was found to
be most prevalent in groups east of the Baltic Sea, including the Russians. However,
147
Figure 41 Median-Joining network of I1a Y-STR haplotypes
Figure 42 Median-Joining network of N Y-STR haplotypes
148
Figure 43 Median-Joining network of Q Y-STR haplotypes most of the low-frequency haplotypes (i.e., singletons) shown in the network are from
the Swedish data set, which is likely due to its much larger sample size relative to the
Russian sample. All five of the Aleut N haplotypes are shared with the comparative
European populations. Overall, the network is based on 18 haplotypes and as
consequence exhibits far less reticulation than the networks discussed above. And
lastly, the network for haplogroup Q, which includes subclade Q3, represents 15
different haplotypes. Interestingly, in addition to the Aleut samples, haplogroup Q
was identified in the Swedish data set (4 individuals representing only 0.56% of the
total sample), with one haplotype shared between the two populations. Haplogroup Q
is a diverse lineage that is scattered at low frequencies throughout Eurasia, especially
among Europeans (Semino et al. 2000). However, none of the Swedish Y-STR
149
haplotypes were assigned to Q3, a patriline only found in the Americas and Beringia
(Zegura et al. 2004).
Neighbor-Joining Tree
A NJ tree based on a RST (sum of squared size differences) distance matrix for
Aleut and European Y-STR data used in the network analysis above is shown in
Figure 44 Neighbor-Joining tree based on RST distance matrix of Y-STR data
Aleut and European Y-STR haplotypes used in RST computation comprise the following seven loci: DYS19, DYS389I, DYS389II, DYS390, DYS391, DYS392 and DYS393.
150
Figure 44. The correlation of the NJ phylogeny to the original distance matrix is
highly significant (r = 0.403; P < 0.001), indicating a good fit to the data. The tree
exhibits three major branches: on the left side are the Russian groups, along with
St.George and Unalaska; towards the bottom are the Aleut populations of False Pass,
Bering Island, St. Paul and Akutan; and near the top are the remaining European
populations, Sweden and Germany, clustering with the eastern Aleut communities
from Nelson Lagoon, King Cove and Sand Point. Of the thirteen Aleut and European
populations presented in the tree, Akutan is separated by the longest branch,
indicating a substantial degree of Y-chromosome differentiation. This result likely
reflects the high frequency of haplogroup Q* observed in this community.
Multidimensional Scaling
A MDS plot based on a RST distance matrix computed from the Y-STR data is
presented in Figure 45. The stress level of the plot is 0.118, which according to
Kruskal (1964a) represents a “fair” fit with the original distance matrix. Along the
first dimension, the Russian samples from Novgorod and Moscow are removed from
the Aleut communities and the other two European populations. Against the second
dimension, the eastern Aleut communities of Sand Point, King Cove and Nelson
Lagoon, as well as the German and Swedish populations, are oriented towards the
bottom of the axis. At the other end are the Russian samples and the Aleut
populations from Bering Island, the Pribilofs and the central Aleutians. Overall, the
MDS plot has a two-dimensional projection that mirrors the branching order of the NJ
151
Figure 45 MDS plot of RST distance matrix of Y-STR data
tree: the Russian groups are separated from the Germans and Swedes, who cluster
with the eastern Aleut communities; and Akutan appears as an outlier relative to the
other Aleuts.
R-Matrix Analysis
An R-matrix based on Y-SNP haplogroup frequencies was computed for the
Aleut communities and six European populations: three Russian samples collected
from the northern (n = 380), central (n = 364) and southern regions (n = 484) of
Russia west of the Ural mountain range (Balanovsky et al. 2008); Germany (n =
1,215) (Kayser et al. 2005); Sweden (n = 305) (Karlsson et al. 2006); and European-
Americans (n = 927) from Arizona, Ohio, South Dakota and various states from the
eastern seaboard (Hammer et al. 2006). A PCA plot of the R-matrix is presented in
Figure 46, which accounts for 50.6% of the matrix variation in the ordination axes.
152
Figure 46 PCA of R-matrix computed from Y-SNP haplogroup frequencies
The Russian populations are well removed from the other European groups in the
two-dimensional space. The Aleut communities of Bering Island, King Cove and the
Pribilofs are positioned closest to the Russians, whereas Sand Point and Nelson
Lagoon cluster with the German, Swedish and European-American populations.
False Pass and Akutan appear as outliers on opposite ends of the second axis, and
Unalaska is located near the center of the PCA plot. Overall, the combined Aleut
sample is oriented close to Unalaska and approximately equidistant between the
Russian groups and the other European cluster.
A biplot of the R-matrix coefficients for the population variables and
haplogroup scores is given in Figure 47. Along the first axis, haplogroups R1a and
R1b are the key polarizing variables, clustering the Russian populations on one end of
the axis due to their high frequency of R1a and conversely orienting the other
153
Figure 47 PCA biplot of R-matrix population coefficients and haplogroup scores The closed squares represent the scaled eigenvector coefficients for the population variables as presented in Figure 46 (blue squares are Aleut groups, red ones are Russian, and black ones are European). The open triangles represent Y-chromosome haplogroup scores.
European populations on the other end from the high frequency of R1b Y-
chromosomes. Relative to the second axis, haplogroup N is the key variable in
positioning the Russian groups towards the bottom of the entire cluster of
populations, whereas haplogroup I1a is directing the other European populations
towards the top of the two-dimensional space. In addition, haplogroups Q* and Q3
appear to be responsible for the outlier status of Akutan and False Pass, respectively.
The remaining haplogroup scores for E3, I and J are positioned within the cluster of
Aleut and European populations.
The haplogroup frequencies of the various Aleut communities support the
patterns observed in the PCA plot above. The Pribilofs, Bering Island and King Cove
154
Figure 48 Map of pie chart frequencies of combined Y-chromosome haplogroups for
Aleut communities
have high frequencies of haplogroup(s) R1a and/or N (see Figure 48) and thus are
oriented closest to the Russian groups. Sand Point and Nelson Lagoon have high
frequencies of haplogroups R1b and I1a and therefore are clustered with the German,
Swedish and European-American groups. And lastly, Akutan and False Pass have
high frequencies of haplogroups Q* and Q3, respectively, and as a consequence both
Aleut communities are removed from the rest of the populations in the PCA plot.
Monmonier’s Maximum Difference Algorithm
Given the genetic differentiation of certain groups of Aleut communities in
the ordination analyses above, Monmonier’s algorithm was applied to a Delaunay
triangulation in order to identify geographic regions of maximum genetic change (see
Figure 49). The genetic barrier with the greatest degree of differentiation was
located between Unalaska and Akutan, which can be explained by the large number
of haplogroup Q* Y-chromosomes in the Akutan sample and the high frequency of
155
Figure 49 Application of Monmonier’s maximum difference algorithm to RST
distance matrix for Y-STR data Two sequential genetic barriers (red arcs) were identified in a Delaunay triangulation constructed from the geographic coordinates of Aleut communities.
haplogroups R1a and N in the Pribilofs relative to the eastern communities, especially
Nelson Lagoon. The next barrier to be identified by the algorithm is placed between
Akutan and False Pass, underscoring the outlier status of Akutan. Additional barriers
were derived from the RST distances, however each one simply isolated individual
communities, beginning with King Cove (results not shown). Similar to the
geographic pattern revealed in the mtDNA data, the first two Monmonier barriers
create an east-west genetic structure, with the predominantly Russian lineages R1a
and N found at high frequencies in the west and the Scandinavian I1a and West
European R1b most prevalent in the eastern communities.
Genetic Surface Interpolation
The genetic surface interpolated from the residual values of a regression
between pairwise RST and geographic distances for Aleut communities is shown in
Figure 50 (note, the diagram is oriented in a north-to-south direction). The most
156
Figure 50 Genetic surface interpolation based on Y-STR data Residual scores derived from a linear regression of RST genetic distances on geographic distances were used to generate a landscape surface created by inverse distance interpolation. The x and y axes represent the geographic coordinates of populations in a Delaunay triangulation network, with a north-to-south orientation. The z axis corresponds to the residual genetic distances.
pronounced surface peaks are located between Akutan and the communities to the
east. Further to the north, a smaller ridge is present between the Pribilofs and the
eastern communities, effectively creating an east-west separation in the Aleut Y-
chromosome variation. Four major surface depressions are also revealed, with two
located among Nelson Lagoon, King Cove and Sand Point in the east, and the other
two positioned near the Pribilof Islands.
157
Diversity versus rii Plot
The plot of Y-SNP haplogroup diversities versus distances from the centroid
for Aleut and European populations is given in Figure 51. Most of the populations
exhibit relatively small rii values (generally less than 0.04), indicating the genetic
similarity of Aleut Y-chromosomes with European ones. The exceptions are False
Pass and Akutan, which likely stems from the high frequencies of Native American
patrilines Q* and Q3 in these communities. Interestingly, the highest
heterozygosities are observed in the Aleut groups, which is a reflection of the diverse
European origins of the Aleut Y-chromosomes. Bering Island, St. Paul and False
2) for Y-SNP data. Distances from the centroid (rii) were computed in R-matrix analysis between Aleut and European populations. The theoretical relationship between the two variables is displayed as a solid line and corresponds to average heterozygosities multiplied by (1-rii) (Harpending and Ward 1982).
158
Pass are the only populations situated above Harpending and Ward’s (1982)
theoretical line, suggesting relatively higher gene flow in these particular
communities. However, for the remaining populations lying below the theoretical
relationship, it probably should not be interpreted as evidence for increased isolation.
All of the Aleut communities have experienced substantial male-mediated gene flow
into their respective populations, as evidenced by their predominantly European
haplogroup profiles. And the European groups, especially the European-Americans,
have known histories of significant immigration levels. The orientation of the
populations relative to the theoretical line would likely change with the inclusion of
truly isolated populations (with respect to male gene flow), pushing more of the Aleut
and European groups above it. Regression analysis produced a positive fit to the data,
which is a pattern not predicted by Harpending and Ward, further underscoring the
amalgamated and diverse nature of the Aleut Y-chromosomes.
159
CHAPTER FIVE: DISCUSSION
The results from the mtDNA and Y-chromosome analyses of Aleut samples
representing five eastern communities are consistent with previous studies of the
central and western Aleutians and neighboring island groups in that it revealed high
frequencies of mtDNA haplogroups A and D and a majority of non-Aleut Y-
chromosomes (Rubicz et al. 2003, Zlojutro et al. 2006, Rubicz 2007). Overall, the
Aleut frequencies for haplogroups A and D are 0.378 and 0.622 respectively, which
differs markedly from other Beringian populations that exhibit substantially lower
numbers of D. Among the various Aleut communities, haplogroup D is more
prevalent in the Pribilofs and islands further to the west, especially Bering Island
where it was found to be fixated in two independent samples (Derbeneva et al. 2002,
Zlojutro et al. 2006). Diversity statistics highlight the atypical mtDNA composition
of Bering Island, showing markedly lower levels of diversity relative to other Aleut
settlements. In her dissertation project investigating the genetic consequences of
Aleut relocations and population aggregation since Russian contact, Rubicz (2007)
argues that the mtDNA pattern observed for Bering Island, as well as St. George and
St. Paul of the Pribilofs that exhibit high frequencies of D (0.821 and 0.714) but less
pronounced diversity reductions, is primarily the result of founder effect. These three
aggregate communities were established in the late 18th and early 19th centuries by
Aleut individuals and families forcibly taken from Unalaska and the western and
central Aleutian Islands of Attu and Atka to work for the Russian fur trade industry,
and based on these findings, are likely to have had a disproportionate number of D
160
lineages. Further to the east in the Fox Islands group and lower Alaska Peninsula,
haplogroup A is present at significantly higher frequencies, ranging from 0.400 to
0.727, and thus indicating regional differences in the genetic structure of the widely
distributed Aleut populations.
East-West Genetic Substructure
The correlogram generated through spatial autocorrelation analysis revealed a
negative clinal relationship between mtDNA similarity and corresponding geographic
distance classes for Beringian populations. This nonrandom distribution of genetic
variation in geographic space likely reflects the deep evolutionary histories of the
various Beringian peoples, as well as the differentiation of Aleut communities along
an east-west axis. In the NJ tree based on HVS-I data, the historically founded
populations of Bering Island and the Pribilofs, as well as Atka of the central
Aleutians, all clustered together separately from the more eastern Aleut populations.
This pattern is also observed in the MDS plot and in the results for the SAMOVA
analysis which placed these four populations in a grouping that excluded the other
Aleut communities. Based on Monmonier’s maximum difference algorithm and
genetic surface interpolation using residual distances, a zone of genetic discontinuity
was identified further to the east, between Nikolski and Unalaska. This genetic
boundary corresponds well with the distribution of haplogroup D, as its frequencies in
Nikolski and the communities to the west, including the Pribilofs, are all greater than
those observed in the east. Thus, an east-west substructure for Aleut mtDNA
variability is evident from the multivariate analyses and appears to be the
161
consequence of two factors: (1) founder effect in the aggregated Aleut communities
of Bering Island and the Pribilofs, responsible for depressing diversity levels in these
respective populations; and (2) the elevated frequencies of haplogroup D in the
central and western Aleutian Islands, which may reflect the genetic distribution
pattern established during the early postglacial peopling of these island groups.
From the Median-Joining networks constructed for mtDNA haplogroups A
and D, three major subclades were identified in the Aleuts: A3, Aleut-specific A7,
and D2. The PCA biplot of population coefficients and HVS-I haplotype scores
indicates that the roots for A7 and D2 are the genetic variables primarily responsible
for the dispersion of the Aleut communities away from non-Aleut populations, and in
particular D2 for the orientation of Nikolski and the historically founded communities
towards the positive end of the first dimension. Conversely, haplotype variables
belonging to A2 and A3 have situated the eastern Aleut communities towards the
opposite end of the dimension, in closer proximity to the non-Aleuts. These two
subhaplogroups are common in Eskimo and Chukotkan populations, as well as False
Pass (0.152), King Cove (0.182), and Nelson Lagoon (0.250). Of these three, Nelson
Lagoon exhibits the greatest differentiation in relation to other Aleut communities,
consistently clustering closest to non-Aleut populations in the NJ tree, R-matrix PCA,
and MDS plot. Furthermore, three of the four newly observed Aleut haplotypes
reported in this study are only present in the Nelson Lagoon sample, with two
commonly found in Eskimo groups in Alaska and the third previously reported in the
Haida of Pacific Northwest. Therefore, the higher frequencies of haplogroup A
162
among eastern Aleut communities, and in particular subclades A2 and A3, are
suggestive of a third factor responsible for the east-west mtDNA substructure: (3)
gene flow into the eastern Aleutians and lower Alaska Peninsula from neighboring
Eskimo and Na-Dene groups.
Archaeological evidence tends to support the notion of native gene flow into
the eastern Aleutians, as cultural exchange is evident at various times during the
prehistory of the reigon. Artifact similarities have been documented between the Late
Anangula phase (dated to approximately 6,000 BP) and the Pacific Eskimo Ocean
Bay phase, as well as connections between the Margaret Bay phase (3,000 BP) and
Eskimo ASTt (Dumond 1987, 2001). Also, beginning around 1,500 BP until Russian
colonization, there is evidence for increased cultural contact between Aleuts and
Pacific Eskimos from the Alaska Peninsula and Kodiak Island and the Tlingit of the
Pacific Northwest (Holland 2001). This is based upon shared tool styles and
manufacturing techniques, and the use of exotic materials for stone or bone artifacts.
The eastern boundary of the Aleut people has been identified to the east of Port
Moller (Dumond 1992), which interestingly is located near Nelson Lagoon across the
Hague Channel, and likely served as a zone of cultural exchange through migration,
For the Y-chromosome picture, the geographic structure of genetic variation is
less evident. The result of a Mantel test performed on Y-STR and geographic
distance matrices was a non-significant correlation of -0.123, which distinctly
contrasts the highly significant value obtained for the mtDNA data (r = 0.717), and is
163
likely due to non-Aleut male gene flow throughout the region. A total of nine
different haplogroups were identified in the Aleut samples by Y-SNP analysis, with
R1a, R1b and I1a the most common lineages. Only two of the identified haplogroups
are considered Native American in origin, Q* and Q3, with a combined frequency of
15.3%. Therefore, 84.7% of the Aleut male samples are considered to have non-
Aleut Y-chromosomes, of which most are likely to be of European origin, and
represents an estimation of the degree of male-mediated gene flow into the Aleut
gene pool. This differs substantially from the mtDNA results, which shows only a
small frequency (6.1%) of non-Native American haplogroups (i.e., lineages other than
A and D) that are limited to the eastern Aleut samples. Curiously, nine of the twelve
non-native matrilines were identified in Sand Point, which may represent the genetic
impact of an increasingly globalized fishing industry, as the local cold storage and
fish-processing plant owned by Trident Seafoods typically attracts hundreds of
transient workers into the community, both male and female. Nonetheless, this
finding underscores the asymmetrical nature of gene flow into the Aleut population
that is dominated by European men.
In order to investigate the origins of the Aleut Y-chromosomes, comparative
population data for Sweden, Germany, US Europeans and Russia were incorporated
into the analyses. In the NJ tree and MDS plot based on Y-STR data, the eastern
communities of Nelson Lagoon, King Cove, and Sand Point clustered with the
Swedish and German populations and were well removed from other Aleut and
Russian samples. For the PCA plot of an R-matrix derived from Y-SNP haplogroup
164
frequencies, Nelson Lagoon and Sand Point once again oriented closely to the
Swedish and German populations, as well as US Europeans. Additionally, a second
cluster emerged that included the Russian populations, St. Paul and St. George of the
Pribilofs, King Cove, and Bering Island. The biplot of population coefficients and
haplogroup scores indicate that haplogroups R1a and N are the key polarizing
variables for the Russian cluster, whereas haplogroups R1b and I1a are primarily
responsible for orienting the eastern Aleut communities towards the Swedish,
German and US European populations. This pattern is supported by the MJ
networks, as the R1a network is dominated by Russian Y-STR haplotypes, while both
the R1b and I1a networks are heavily represented by German and Swedish lineages.
To assess the level of Russian and Scandinavian male admixture, the major Y-
SNP haplogroups observed in the Aleuts were analyzed using Bernstein’s (1931)
classical equation M = (PH – PB/PA – PB), where P represents the haplogroup
frequencies for the hybrid (H) and two parental populations (A and B), with M and 1 –
M the proportion of migrant alleles deriving from the two parental sources. The
results for this admixture scenario show that the majority of Aleut patrilines derive
from Russian admixture (M = 0.586), with a smaller proportion attributable to
Scandinavian males (M = 0.414), suggesting that the genetic impact of European gene
flow during Russian rule was more pronounced on the Aleut gene pool than after the
American purchase of the Alaskan territory.
Although the Mantel test failed to reveal a significant relationship between Y-
STR variation and geography, from both the application of Monmonier’s algorithm
165
and the interpolation of residual genetic distances a zone of genetic discontinuity was
identified around Akutan, which effectively divides the Aleut male population into
two regions. In the western part, Aleut Y-chromosomes are characterized by
relatively higher frequencies of haplogroups R1a and N. The Aleut community on
Bering Island exhibits the highest level of Y-chromosome diversity and, based on its
placement above the theoretical line in the diversity versus rii plot, appears to have
experienced considerable gene flow. This contrasts the mtDNA data for Bering
Island that shows a marked reduction in diversity and the placement of all three
aggregate populations well below the diversity versus rii theoretical expectation.
In the eastern region, the Y-chromosome variation is somewhat more
complex, with King Cove possessing a large number of R1a lineages and False Pass
exhibiting a relatively high frequency of Native American Q3. However, the region
is characterized by I1a frequencies that are higher than in any of the Aleut
communities to the west, ranging from 0.15 up to 0.333. Therefore, given that I1a
appears to be predominantly a Scandinavian partiline based on the results of this
study and previously published research (Rootsi et al. 2004, Karlsson et al. 2006), the
Aleut communities in the eastern Aleutian islands and Alaska Peninsula appear to
harbor the genetic signature of the influx of Scandinavian fishermen into the region
that began with the sale of Alaska to the US in 1867 and the US Treasury
Department’s intermarriage policy that promoted Aleut-European admixture in the
following decades. In the communities further to the west, patriarchal remnants of
166
Figure 52 Map of pie chart frequencies of Russian and non-Russian surnames in
Aleut communities
the earlier Russian conquest are evident from both Y-chromosome variation and
surname ancestry (see Figure 52).
Overall, an east-west substructure in the Aleut population is present for both
mtDNA and Y-chromosome variation, with a number of interdigitated factors
contributing to the geographic differentiation: founder effect, prehistoric gene flow,
assymetrical admixture with European men, and the original peopling of the Aleutian
archipelago.
Origins of the Aleut People
Previous phylogeographic studies of mtDNA and Y-chromosome data
indicate that the native Aleut maternal and paternal lineages derive from Siberian
and/or Beringian sources. According to Zegura et al. (2004), the Altai-Sayan region
of southern Siberia represents the ancestral homeland for Q3 Y-chromosomes,
whereas mtDNA haplogroups A2, including its subclades, and D2 appear to have
167
evolved within Beringia (Derbeneva et al. 2002, Starikovskaya et al. 2005). The
three major mtDNA lineages in Aleuts – A3, A7 and D2 – all exhibit star-like
network structures and unimodal mismatch distributions, which suggest the genetic
effects of population expansion. The A3 subclade is mostly observed among northern
North American populations and, using Aleut HVS-I sequences, was dated in this
study to 23,285 ± 13,488 years, revealing a deep evolutionary history. Thus, A3
appears to have been introduced into the Aleut population through either gene flow
from neighboring groups in southwestern Alaska or population amalgamation with an
older Anangula substratum during the postglacial period. Both A7 and D2 have much
younger ages (approximately 3,000 and 5,200 years BP, respectively) and, based on
phylogeographic considerations, are likely to represent the founder lineages of the
Aleut people. In the study by Zlojutro et al. (2006), four models were proposed for
Aleut origins from mtDNA and archaeological evidence, representing a combination
of biological continuity with the earliest inhabitants at Anangula and Hog Islands and
population intrusion as reflected by cultural transitions evident in the archaeological
record (for instance, Margaret Bay phase at 3,000 BP and its similarities to Eskimo
ASTt).
In a recent June issue of Science, the results of an ancient mtDNA study
conducted by Gilbert et al. (2008) are particularly relevant to this topic of Aleut
origins. The mitochondrial genome for a 3,400 to 4,500 year-old Paleo-Eskimo
human hair specimen from an early Greenland Saqqaq settlement was sequenced.
The results revealed that the mtDNA belongs to haplogroup D2, which is absent in
168
contemporary Eskimo populations in northern Canada and Greenland (Saillard et al.
2000, Helgason et al. 2006). More specifically, the ancient mtDNA was assigned to
D2a1, a subclade previously observed only among contemporary Aleut and Siberian
Eskimo populations of Beringia [note, D2a1 corresponds to the phylogenetic
branches D2b and D2c in the study by Derbeneva et al. (2002)]. The early settlement
of Eskimo peoples across northern North American is associated with the ASTt
culture (4,500 BP) that gave rise to the Independence I-Saqqaq and Pre-Dorset
traditions found throughout this vast region from approximately 4,000 to 2,500 years
BP (Fitzhugh 1984). Later, around 1,000 BP, the Paleo-Eskimos are believed to have
been largely replaced through an expansion of the Neo-Eskimo Thule peoples, a
distinct population characterized by high frequencies of mtDNA haplogroup A
(Helgason et al. 2006). Therefore, the results of this study suggest that the ASTt
migrants into northern North America derived in part from populations in Beringia,
represented by the D2a1 matriline, and may have played an important role in Aleut
ethnogenesis (see Figure 53). As previously noted, similarities exist in the cultural
assemblages of the Aleutian Margaret Bay phase and ASTt, such as well flaked, small
tools that include “qaxaq” points (Hatfield 2002, Knecht and Davis 2001), and may
reflect population admixture in the Aleutians from outside groups during this
transitory period, which roughly corresponds to the ages estimated for lineages A7
and D2. However, additional research needs to be done to confirm this scenario.
Other ancient DNA studies have identified haplogroup D among Paleo-Eskimo
specimens, but have not performed complete mitochondrial sequencing that would
169
Figure 53 Human prehistoric dispersals into northern North America according to
the Gilbert et al. (2008) model
allow for the characterization of D2a1 (Hayes et al. 2003, 2005). Furthermore,
Aleutian discontinuity has been described for cultural practices, isotope chemistry,
and mtDNA haplogroup frequencies for archaeological specimens dating to around
1,000 years BP (Coltrain et al. 200), thus adding further complexity to the issue of
Aleut origins.
170
CHAPTER SIX: CONCLUSION
This study characterized the mitochondrial and Y-chromosome DNA diversity
in five eastern Aleut communities in order to complement earlier research conducted
on communities further to the west and provide a comprehensive understanding of the
genetic substructure of the Aleut people and their origins. Results from both genetic
systems reveal patterns of variability that exhibit geographic differentiation along an
east-west axis and reflect the genetic impact of key demographic events. In the west,
which includes the central and western Aleutian Islands and the historically founded
communities on Bering Island and the Prbilofs, a combination of low mtDNA
diversity and high frequencies of haplogroup D2 is observed, which likely derives
from both founder effect associated with the forced population relocations during
Russian colonization and the early postglacial peopling of the region. For the Aleut
Y-chromosomes, the vast majority are of European origin, approximately 85%, which
contrasts the mtDNA picture, as only 6% of the Aleut matrilines were characterized
to non-Aleut haplogroups and thus indicating a large degree of asymmetrical gene
flow into the Aleut population from European male sources. In the eastern Aleutian
Islands and lower Alaska Peninsula, Aleuts exhibit higher frequencies of mtDNA
haplogroup A and its subclades, which according to archaeological evidence and
phylogeographic considerations may stem from a sustained cultural and demic
exchange across the eastern boundary with various Eskimo and Na-Dene groups prior
to European contact. NRY haplogroup I1a, considered to be a Scandinavian patriline,
is common among the eastern communities and represents the genetic impact of
171
Scandinavian and American migrants that entered the region after the sale of Alaska
in 1867. Further to the west, Russian Y-chromosomes predominate, in particular
haplogroups R1a and N. The phylogeographic analysis of mtDNA data and the
results of recent ancient DNA studies both suggest that haplogroup D2 evolved in
Beringia and formed the ancestral gene pool for Paleo-Eskimos and Aleuts, although
further research is needed to fully elucidate the evolutionary relationship between
these two arctic peoples and the demographic events that contributed to Aleut
ethnogenesis.
It is evident from the mtDNA and Y-chromosome results of this study that the
Aleuts are a genetically diverse population, with significant substructure between the
eastern and western communities. Founder effect, gene flow, and prehistoric
peopling events have all played a role in molding the patterns of Aleut genetic
variability. However, of these three demographic circumstances, gene flow appears
to be the primary factor responsible for the observed differentiation. The admixture
model described in this study is a complex one, with differences in gender
contribution, timing, genetic sources, and intensity. Most Native American
populations have experienced varying degrees of creolization through European
contact and settlement, as well as the introduction of African slaves into the North
and South American mercantile economic systems. Generally, European ancestry is
found at higher frequencies among Native American Y-chromosomes than mtDNAs,
which underscores the detrimental impact of historic events over the past 500 years
on Native American paternal lineages.
172
This pattern of male-mediated admixture also occurred in the Aleutians, but
with an important difference. Unlike most Native American groups that were
colonized by Western European nations, the Aleutians were governed by two
European peoples – initially by the Russians and then later by the Americans. As a
result, the nature of Aleut-European genetic admixture is a dichotomy between
Russian and non-Russian Y-chromosome sources, in terms of both frequencies and
geographic distributions.
Therefore, the American purchase of Alaska represents a watershed moment
for Aleut history and demography, incorporating the Aleutians into an American
sphere of socio-economic influence dominated by the fishing industry and impacted
by the arrival of non-Russian European males, especially Scandinavian fishermen in
the eastern region. Today, the Aleutian Islands are undergoing a third demographic
transition with the increasing integration of its fishing industry into the global
economy, which attracts hundreds of international, seasonal workers to the region on
a yearly basis and will undoubtedly alter the genetic character of the highly admixed
Aleut people.
173
LITERATURE CITED Achilli A, Rengo C, Magri C, Battaglia V, Olivieri A, Scozzari R, Cruciani F, Zeviani M, Briem E, Carelli V, Moral P, Dugoujon J-M, Rootsalu U, Loogväli E-L, Kivisild T, Bandelt H-J, Richards M, Villems R, Santachiara-Benerecetti AS, Semino O, and Torroni A (2004) The Molecular Dissection of mtDNA Haplogroup H Confirms that the Franco-Cantabrian Glacial Refuge was a Major Source for the European Gene Pool. American Journal of Human Genetics 75: 910-918. Achilli A, Rengo C, Battaglia V, Pala M, Olivieri A, Fornarino S, Magri C, Scozzari R, Babudri N, Santachiara-Benerecetti AS, Bandelt H-J, Semino O, and Torroni A (2005) Saami and Berbers – An Unexpected Mitochondrial DNA Link. American
Journal of Human Genetics 76: 883-886. Aitken RJ, and Graves JAM (2002) The Future of Sex. Nature 415: 963. Akazawa T (1999) Pleistocene Peoples of Japan and the Peopling of the Americas. In: Bonnichsen R and Turnmire K (eds) Ice Age Peoples of North America. Corvallis, OR: Oregon State University Press, pp 95-103. Alonso S, Flores C, Cabrera V, Alonso A, Martín P, Albarrán C, Izagirre N, de la Rúa C, and García O (2005) The Place of the Basques in the European Y-chromosome Diversity Landscape. European Journal of Human Genetics 13: 1293-1302. Anderson S, Bankier AT, Barrell BG, De Bruijn MHL, Coulson AR, Drouin J, Eperon IC, Nierlich DP, Roe BA, Sanger F, Schreier PH, Smith AJ, Staden R, and Young IG (1981) Sequence and Organization of the Human Mitochondrial Genome. Nature 290: 457-465. Aris-Brousou S, and Excoffier L (1996) The Impact of Population Expansion and Mutation Rate Heterogeneity on DNA Sequence Polymorphism. Molecular Biology
and Evolution 13: 494-504. Arredi B, Poloni ES, Paracchini S, Zerjal T, Fathallah DM, Makrelouf M, Pascali VL, Novelletto A, and Tyler-Smith C (2004) A Predominantly Neolithic Origin for Y-Chromosomal DNA Variation in North Africa. American Journal of Human Genetics 75: 338-345. Arutinov S, and Sergeev D (1975) Problemy Etnicheskoi Istorii Beringomor’ia. Moscow, Russia: Nauka Publications.
174
Ayub Q, Mohyuddin A, Qamar R, Mazhar K, Zerjal T, Mehdi SQ, and Tyler-Smith C (2000) Identification and Characterisation of Novel Human Y-Chromosomal Microsatellites from Sequence Database Information. Nucleic Acids Research 28: 2-8. Balanovsky O, Rootsi S, Pshenichnov A, Kivisild T, Churnosov M, Evseeva I, Pocheshkhova E, Boldyreva M, Yankovsky N, Balanovska E, and Villems R (2008) Two Sources of the Russian Patrilineal Heritage in their Eurasian Context. American
Journal of Human Genetics 82: 236-250. Ballinger SW, Schurr TG, Torroni A, Gan YY, Hodge JA, Hassan K, Chen K-H, and Wallace DC (1992) Southeast Asian Mitochondrial DNA Analysis Reveals Genetic Continuity of Ancient Mongoloid Migrations. Genetics 130: 139-152. Bandelt H-J, Forster P, Sykes BC, and Richards MB (1995) Mitochondrial Portraits of Human Populations using Median Networks. Genetics 141: 743-753. Bandelt H-J, Forster P, and Röhl A (1999) Median-Joining Networks for Inferring Intraspecific Phylogenies. Molecular Biology and Evolution 16: 37-48. Bandelt H-J, Lahermo P, Richards M, and Macaulay V (2001) Detecting Errors in mtDNA Data by Phylogenetic Analysis. International Journal of Legal Medicine 115: 64-69. Bandelt H-J, Herrnstadt C, Yao YG, Kong QP, Kivisild T, Rengo C, Scozzari R, Richards R, Richards M, Villems R, Macaulay V, Howell N, Torroni A, and Zhang YP (2003) Identification of Native American Founder mtDNAs through the Analysis of Complete mtDNA Sequences: Some Caveats. Annals of Human Genetics 67: 512-524. Barker G, Barton H, Beavitt P, Bird M, Daly P, Doherty C, Gilbertson D, Hunt C, Krigbaum J, Lewis H, Manser J, McLaren S, Paz V, Piper P, Pyatt B, Rabett R, Reynolds T, Rose J, Rushworth G, and Stephens M (2002) Prehistoric Foragers and Farmers in Southeast Asia: Renewed Investigations at Niah Cave, Sarawak. Proceedings of the Prehistoric Society 68: 147-164. Bernstein F (1931) Die Geographische Verteilung der Blutgruppen und ihre Anthropolgische Bedeutung. In: Gini C (ed) Comitato Italiano per Studio dei
Problemi della Populazione. Rome: Instituto Poligrafico de Stato, pp 227-243. Bert F, Corella A, Gene M, Perez-Perez A, and Turbon D (2001) Major Mitochondrial DNA Haplotype Heterogeneity in Highland and Lowland Amerindian Populations from Bolivia. Human Biology 73: 1-16.
175
Bertorelle G, and Barbujani G (1995) Analysis of DNA Diversity by Spatial Autocorrelation. Genetics 140: 811-819. Betz A, Bassler G, Dietl G, Steil X, Weyermann G, and Pflug W (2001) DYS STR Analysis with Epithelial Cells in a Rape Case. Forensic Science International 118: 126-130. Black L (1982) Aleut Art: Unangam Aquqaadangin/Unangan of the Aleutian
Archipelago. Anchorage, AK: Aleutian/Pribilof Islands Association, Inc. Black L (1983) Some Problems in the Interpretation of Aleut Prehistory. Arctic
Anthropology 20: 49-78. Black L (1984) Atka: An Ethnohistory of the Western Aleutian Islands. In: Pierce RA (ed) Alaska History, No. 24. Kingston, Canada: The Limestone Press. Black L (1990) Creoles in Russian America. Pacifica 2: 142-155. Black L (1993) Ethnographic Summary: The Aleutian-Pribilof Islands Region. In: Social Transition in the North: Working Papers 1(3). Anchorage, AK: Social Research Institute. Black L (2004) Russians in Alaska, 1732-1867. Anchorage, AK: University of Alaska Press. Black R (1974) Late-Quaternary Sea Level Changes, Umnak Island, Aleutians: Their Effects on Ancient Aleuts and their Causes. Quaternary Research 4: 262-281. Black R (1975) Late-Quaternary Geomorphic Processes: Effects on the Ancient Aleuts of Umnak Island in the Aleutians. Arctic 28: 159-169. Black R (1976) Geology of Umnak Island, Eastern Aleutian Islands, as Related to the Aleuts. Arctic and Alpine Research 8: 7-35. Bodmer WF, Bodmer J, Adler S, Payne R, and Bialek J (1966) Genetics of ‘4’ and ‘LA’ Human Leukocyte Groups. Annals of the New York Academy of Sciences 129: 473-489. Bonatto SL, and Salzano FM (1997a) A Single and Early Migration for the Peopling of the Americas Supported by Mitochondrial DNA Sequence Data. Proceedings of
the National Academy of Sciences USA 94: 1866-1871.
176
Bonatto SL, and Salzano FM (1997b) Diversity and Age of the Four Major mtDNA Haplogroups, and their Implications for the Peopling of the New World. American
Journal of Human Genetics 61: 1413-1423. Bosch E, Lee AC, Calafell F, Arroyo E, Henneman P, de Knijff P, and Jobling MA (2002) High Resolution Y Chromosome Typing: 19 STRs Amplified in Three Multiplex Reactions. Forensic Science International 125: 42-51. Botstein D, White RL, Skolnick M, and Davis RW (1980) Construction of Genetic Linkage Map in Man using Restriction Fragment Length Polymorphisms. American
Journal of Human Genetics 32: 314-331. Bowler JM, Johnston H, Olley JM, Prescott JR, Roberts RG, Shawcross W, and Spooner NA (2003) New Ages for Human Occupation and Climatic Change at Lake Mungo, Australia. Nature 421: 837-840. Brassel KE, and Reif D (1979) A Procedure to Generate Thiessen Polygons. Geographical Analysis 325: 31-36. Brown MD, Hosseini SH, Torroni A, Bandelt H-J, Allen JC, Schurr TG, Scozzari R, Cruciani F, and Wallace DC (1998) MtDNA Haplogroup X: An Ancient Link between Europe/Western Asia and North America? American Journal of Human
Genetics 63: 1852-1861. Brown WM (1980) Polymorphism in Mitochondrial DNA of Humans as Revealed by Restriction Endonculcease Analysis. Proceedings of the National Academy of
Sciences USA 77: 3605-3609. Brown WM, Prager EM, Wang A, and Wilson AC (1982) Mitochondrial DNA Sequences of Primates: Tempo and Mode of Evolution. Journal of Molecular
Evolution 18: 225-239. Budowle B, Adamowicz M, Aranda XG, Barna C, Chakraborty R, Cheswick D, Dafoe B, Eisenberg A, Frappier R, and Gross A (2005) Twelve Short Tandem Repeat Loci Y Chromosome Haplotypes: Genetic Analysis on Populations Residing in North America. Forensic Science International 150: 1-15. Cann RL, Stoneking M, and Wilson AC (1987) Mitochondrial DNA and Human Evolution. Nature 325: 31-36. Cao W, Hashibe M, Rao J-Y, Morgenstern H, and Zhang Z-F (2003) Comparison of Methods for DNA Extraction from Paraffin-Embedded Tissues and Buccal Cells. Cancer Detection and Prevention 27: 397-404.
177
Casanova M, Leroy P, Boucekkine C, Weisenbach J, Bishop C, Fellous M, Purrello M, Fiori G, and Siniscalco M (1985) A Human Y-linked DNA Polymorphism and its Potential for Estimating Genetic and Evolutionary Distance. Science 230: 1403-1406. Cavalli-Sforza LL, Menozzi P, and Piazza A (1994) The History and Geography of
Human Genes. New Jersey, USA: Princeton University Press. Chamberlain AF (1951) Aleuts. In: Encyclopedia of Religion and Ethics. New York, USA: Charles Scribner’s Sons, pp 303-305. Chen H, Lowther W, Avramopoulos D, and Antonarakis SE (1994) Homologous Loci DXYS156X and DXYS156Y Contain a Polymorphic Pentanucleotide Repeat (TAAAA)n and Map to Human X and Y Chromosomes. Human Mutation 4: 208-211. Chen MH, Lee HM, and Tzen CY (2002) Polymorphism and Heteroplasmy of Mitochondrial DNA in the D-Loop Region in Taiwanese. Journal of the Formosan
Medical Assocation 101: 268-276. Chen YS, Torroni A, Excoffier L, Santachiara-Benerecetti AS, and Wallace DC (1995) Analysis of mtDNA Variation in African Populations Reveals the Most Ancient of all Human Continent-Specific Haplogroups. American Journal of Human
Genetics 57: 133-149. Chikchi L, Nichols RA, Barbujani G, and Beaumont MA (2002) Y Genetic Data Support the Neolithic Demic Diffusion Model. Proceedings of the National Academy
of Sciences USA 99: 11008-11013. Chomczynski P, and Sacchi N (1987) Single-Step Method of RNA Isolation by Acid Guanidinium Thiocynate-Phenol-Chlorofrom Extraction. Analytical Biochemistry 162: 156-159. Chomczynski P, and Sacchi N (2006) Single-Step Method of RNA Isolation by Acid Guanidinium Thiocynate-Phenol-Chlorofrom Extraction: Twenty-Something Years On. Nature Protocols 1: 581-585. Cinnioğlu C, King R, Kivisild T, Kalfoglu E, Atasoy S, Cavalleri GL, Lillie AS, Roseman CC, Lin AA, Prince K, Oefner PJ, Shen P, Semino O, Cavalli-Sforza LL, and Underhill PA (2004) Excavating Y-Chromosome Haplotype Strata in Anatolia. Human Genetics 114: 127-148. Coltrain J, Hayes MG, and O’Rourke D (2006) Hrdlička’s Aleutian Population-Replacement Hypothesis. Current Anthropology 47: 537-548.
178
Comas D, Plaza S, Wells RS, Yuldaseva N, Lao O, Calafell F, and Bertranpetit J (2004) Admixture, Migrations, and Dispersals in Central Asia: Evidence from Maternal DNA Lineages. European Journal of Human Genetics 12: 495-504. Corbett D, West D, and Lefevre D (2001) Prehistoric Village Organization in the Western Aleutians. In: Dumond D (ed) Archaeology in the Aleut Zone of Alaska,
Some Recent Research. Eugene, OR: University of Oregon Press, pp 251-266. Cordaux R, Aunger R, Bentley G, Nasidze I, Sirajuddin SM, and Stoneking M (2004) Independent Origins of Indian Case and Tribal Paternal Lineages. Current Biology 14: 231-235. Crawford MH (1998) The Origins of Native Americans: Anthropological Genetic
Perspective. Cambridge, UK: Cambridge University Press. Crawford MH (2007a) Foundations of Anthropological Genetics. In: Crawford MH (ed) Anthropological Genetics: Theory, Methods and Applications. New York: Cambridge University Press, pp 1-16. Crawford MH (2007b) Genetic Structure of Circumpolar Populations: A Synthesis. American Journal of Human Biology 19: 203-217. Cruciani F, Santolamazza P, Shen P, Macaulay V, Moral P, Olckers A, Modiano D, Homlmes S, Destro-Bisol G, Coia V, Wallace DC, Oefner PJ, Torroni A, Cavalli-Sforza LL, Scozzari R, and Underhill PA (2002) A Back Migration from Asia to Sub-Saharan Africa is Supported by High-Resolution Analysis of Human Y-Chromosome Haplotypes. American Journal of Human Genetics 70: 1197-1214. Cutbush M, Mollison PL, and Parkin DM (1950) A New Human Blood Group. Nature 165: 188-189. de Knijff P, Kayser M, Caglia A, Corach D, Fretwell N, Gehrig C, Graziosi G, Heidorn F, Herrman S, Herzog B, Hidding M, Honda K, Jobling M, Krawczak M, Leim K, Meuser S, Meyer O, Österreich W, Pandya A, Parson W, Penacino G, Perez-Lezaun A, Piccinini A, Prinz M, Schmitt C, Schneider PM, Szibor R, Teifel-Greding J, Weichhold G, and Roewer L (1997) Chromosome Y Microsatellites: Population Genetics and Evolutionary Aspects. International Journal of Legal Medicine 110: 134-149. Denaro M, Blanc H, Johnson MJ, Chen KH, Wilmsen F, Cavalli-Sforza LL, and Wallace DC (1981) Ethnic Variation in HpaI Endonuclease Cleavage Patterns of Human Mitochondrial DNA. Proceedings of the National Academy of Sciences USA 78: 5768-5772.
179
Deng W, Shi B, He X, Zhang Z, Xu J, Li B, Yang J, Ling L, Dai C, Qiang B, Shen Y, and Chen R (2004) Evolution and Migration History of the Chinese Population Inferred from Chinese Y-Chromosome Evidence. Journal of Human Genetics 49: 339-348. Derbeneva OA, Sukernik RI, Volodko NV, Hosseini SH, Lott M, and Wallace DC (2002) Analysis of Mitochondrial DNA Diversity in the Aleuts of the Commander Islands and its Implications for the Genetic History of Beringia. American Journal of
Human Genetics 71: 415-421. Derenko MV, Dambueva IK, Maliarchuk BA, Dorzhu ChM, and Zakharov IA (1999) Structure and Diversity of the Mitochondrial Gene Pool of the Aboriginal Population of Tuva and Buriatia from Restriction Polymorphism Data. Genetika 35: 1706-1712. Derenko MV, Malyarchuk BA, Dambueva IK, Shaihaev GO, Dorzhu CM, Nimaev DD, and Zakarov IA (2000) Mitochondrial DNA Variation in Two South Siberian Aboriginal Populations: Implications for the Genetic History of North Asia. Human
Biology 72: 945-973. Derenko MV, Grzybowski T, Malyarchuk BA, Czarny J, Miścicka-Śliwka D, and Zhakharov IA (2001a) The Presence of Mitochondrial Haplogroup X in Altaians from South Siberia.” American Journal of Human Genetics 69: 237-241. Derenko MV, Denisova GA, Malyarchuk BA, Dambueva IK, Luzina FA, Lotosh EA, Dorzhu CM, Karamchakova ON, Solovenchuk LL, and Zakharov IA (2001b) The Structure of the Gene Pools of the Ethnic Populations of Altai-Sayan Region based on Mitochondrial DNA Polymorphism Data. Russian Journal of Genetics 37: 1177-1184. Derenko MV, Grzybowski T, Malyarchuk BA, Dambueva IK, Denisova GA, Czarny J, Dorzhu CM, Kakpakov VT, Miścicka-Śliwka D, Woźniak M, and Zakharov IA (2003) Diversity of Mitochondrial DNA Lineages in South Siberia. Annals of Human
Genetics 67: 391-411. Derenko M, Malyarchuk B, Grzybowski T, Denisova G, Dambueva I, Perkova M, Dorzhu C, Luzina F, Lee HK, Vanecek, Villems R, and Zakharov I (2007) Phylogeographic Analysis of Mitochondiral DNA in Northern Asian Populations. American Journal of Human Genetics 81: 1025-1041. Devor EJ (2004) Polymerase Chain Reaction (PCR): Theory, Method, and Practice. Corralville, Iowa: Integrated DNA Technologies. Diamond J (1997) Guns, Germs, and Steel: The Fates of Human Societies. New York, USA: WW Norton & Company.
180
Dikov N (1965) The Stone Age of Kamchatka and the Chukchi Peninsula in the Light of New Archaeological Data. Translated by G Clark. Arctic Anthropology 3: 10-25. Dikov N (1979) Drevniie Kul’tury Severo-vostochnoi Azil. Moscow, Russia: Nauka Publications. Dillehay TD (1999) The Late Pleistocene Cultures of South America. Evolutionary
Anthropology 7: 206-216. Dixon EJ (1999) Bones, Boats, and Bison. Albuquerque, NM: University of New Mexico Press. Dumond D (1987) The Eskimos and Aleuts. London: Thames and Hudson Limited. Dumond D (1992) Archaeological Reconaissance in the Chignik-Port Heiden Region of the Alaska Peninsula. Anthropological Papers of the University of Alaska 24: 89-108. Dumond D (2001) Toward a (yet) Newer View of the (Pre)History of the Aleutians. In: Dumond D (ed) Archaeology in the Aleut Zone of Alaska, Some Recent Research. Eugene, OR: University of Oregon Press, pp 289-309. Dumond D and Bland R (1995) Holocene Prehistory of the Northernmost North Pacific. Journal of World Prehistory 9: 401-451. Dumond D, and Knecht R (2001) An Early Blade Site in the Eastern Aleutians. In: Dumond D (ed) Archaeology in the Aleut Zone of Alaska, Some Recent Research. Eugene, OR: University of Oregon Press, pp 9-34. Dupanloup I, Schneider S, and Excoffier L (2002) A Simulated Annealing Approach to Define the Genetic Structure of Populations. Molecular Ecology 11: 2571-2581. Dyson G (2000) The Aleutian Kayak. Scientific American April: 84-91. Elias SA, Short SK, Nelson CH, and Birks HH (1996) Life and Times of the Bering Land Bridge. Nature 382: 60-63. Elliott HW (1886) Our Arctic Province, Alaska and the Seal Islands. New York, USA: Charles Scribners’s Sons. Eswaran V, Harpending H, and Rogers AR (2005) Genomics Refutes an Exclusively African Origin of Humans. Journal of Human Evolution 49: 1-18.
181
Ewens WJ (1972) The Sampling Theory of Selectively Neutral Alleles. Theoretical
Population Biology 3: 87-112. Excoffier L, and Langaney A (1989) Origin and Differentiation of Human Mitochondrial DNA. American Journal of Human Genetics 44: 73-85. Excoffier L, and Schneider S (1999) Why Hunter-Gatherer Populations do not Show Signs of Pleistocene Demographic Expansions. Proceedings of the National
Academy Sciences USA 96: 10597-10602. Excoffier L, Smouse P, and Quattro J (1992) Analysis of Molecular Variance Inferred from Metric Distances among DNA Haplotypes: Application to Human Mitochondrial DNA Restriction Data. Genetics 131: 479-491. Eyre-Walker A, Smith NH, and Smith JM (1999) How Clonal are Human Mitochondria? Proceedings of the Royal Society of London: B Series 266: 477-483. Federova S (1973) The Russian Population in Alaska and California, Late 18
th
Century. Translated by Pierce RA, and Donnelly AS (eds). Kingston, Ontario: The Limestone Press. Felsenstein J (1993) PHYLIP (Phylogeny Inference Package) version 3.6. Distributed by the author. Department of Genetics, University of Washington, Seattle, USA. Fernandes S, Paracchini S, Meyer LH, Floridia G, Tyler-Smith C, and Vogt PH (2004) A large AZFc Deletion Removes DAZ3/DAZ4 and Nearby Genes from Men in Y Haplogroup N. American Journal of Human Genetics 74: 180-187. Fiedel SJ (1999) Older than we Thought: Implications of Corrected Dates for Paleoindians. American Antiquity 64: 95-115. Fitzhugh WW (1984) Paleo-Eskimo Cultures of Greenland. In: Damas D (ed) Handbook of North American Indians, Volume 5. Washington, USA: Smithsonian Institute, pp 528-539. Forster P (2004) Ice Ages and the Mitochondrial DNA Chronology of Human Dispersals: A Review. Philosophical Transactions of the Royal Society of London.
Series B: Biological Sciences 359: 255-264. Forster P, and Matsumura S (2005) Did Early Humans Go North or South? Science 308: 965-966.
182
Forster P, Harding R, Torroni A, and Bandelt H-J (1996) Origin and Evolution of Native American mtDNA Variation: A Reappraisal. American Journal of Human
Genetics 59: 935-945. Fortuine R (1992) Chills and Fever: Health and Disease in the Early History of
Alaska. Anchorage, AK: University of Alaska Press. Francalacci P, Montiel R., Malgosa A (1999) A Mitochondrial Database: Applications to Problems of Nomenclature and Populations Genetics. In: Papiha SS, R. Deka, and R. Chakraborty (eds) Genomic Diversity: Applicatons in Human
Population Genetics. New York, USA: Kluwer Academic/Plenum Publishers, pp 103-120. Fu XY (1997) Statistical Tests of Neutrality of Mutations against Population Growth, Hitchhiking, and Background Selection. Genetics 147: 915-925. Galtier N, Enard D, Radondy Y, Bazin E, and Belkhir K (2006) Mutation Hot Spots in Mammalian Mitochondrial DNA. Genome Research 16: 215-222. Gilbert MTP, Kivisild T, Grønnow B, Andersen PK, Metspalu E, Reidla M, Tamm E, Axelsson E, Götherström A, Campos PF, Rasmussen M, Metspalu M, Higham TFG, Schwenninger J-L, Nathan R, De Hoog C-J, Koch A, Møller LN, Andreasen C, Meldgaard M, Villems R, Bendixen C, and Willerslev E (2008) Paleo-Eskimo mtDNA Genome Reveals Matrilineal Discontinuity in Greenland. Science 320: 1787-1789. Giles R, Blanc H, Cann H, and Wallace D (1980) Maternal Inheritance of Human Mitochondrial DNA. Proceedings of the National Academy of Sciences USA 77: 6715-6719. Gill P, Jeffreys AJ, and Werrett DJ (1985) Forensic Application of DNA “Fingerprints”. Nature 318: 577-579. Goebel T, and Slobodin S (1999) The Colonization of Western Beringia: Technology, Ecology, and Adaptations. In: Bonnichsen R and Turnmire K (eds) Ice Age Peoples
of North America. Corvallis, OR: Oregon State University Press, pp 104-155. Graves JAM (2006) Sex Chromosome Specialization and Degeneration in Mammals. Cell 124: 901-914. Greenberg J, Turner CG, and Zegura SL (1986) The Settlement of the Americas: A Comparison of the Linguistic, Dental, and Genetic Evidence. Current Anthropology 4: 477-497.
183
Guthrie RD (1982) Mammals of the Mammoth Steppe as Paleoenvironmental Indicators. In: Hopkins DM, Matthews Jr JV, Schweger CE, and Young SB (eds) Paleoecology of Beringia. New York: Academic Press, pp 307-326. Hagelberg E (2003) Recombination or Mutation Rate Heterogeneity? Implications for Mitochondrial Eve. Trends in Genetics 19: 84-90. Hamilton T and Goebel T (1999) Late Pleistocene Peopling of Alaska. In: Bonnichsen R and Turnmire K (eds) Ice Age Peoples of North America. Corvallis, OR: Oregon State University Press, pp 156-199. Hammer MF (1994) A Recent Insertion of an Alu Element on the Y Chromosome is a Useful Marker for Human Population Studies. Molecular Biology and Evolution 11: 749-761. Hammer MF (1995) A Recent Common Ancestry for Human Y Chromosomes. Nature 378: 376-378. Hammer MF, and Horai S (1995) Y chromosomal DNA Variation and the Peopling of Japan. American Journal of Human Genetics 56: 951-962. Hammer MF, and Zegura SL (2002) The Human Y Chromosome Haplogroup Tree: Nomenclature and Phylogeography of its Major Divisions. Annual Review of
Anthropology 31: 303-321. Hammer MF, Karafet T, Rasanayagam A, Wood ET, Altheide TK, Jenkins T, Griffiths RC, Templeton AR, and Zegura SL (1998) Out of Africa and Back Again: Nested Cladistic Analysis of Human Y Chromosome Variation. Molecular Biology
and Evolution 15: 427-441. Hammer MF, Karafet TM, Redd AJ, Jarjanazi H, Santachiara-Benerecetti S, Soodyall H, and Zegura SL (2001) Hierarchical Patterns of Global Human Y-Chromosome Diversity. Molecular Biology and Evolution 18: 1189-1203. Hammer MF, Chamberlain VF, Kearney VF, Stover D, Zhang G, Karafet T, Walsh B, and Redd AJ (2006) Population Structure of Y Chromosome SNP Haplogroups in the United States and Forensic Implications for Constructing Y Chromosome STR Databases. Forensic Science International 164: 45-55. Harpending HC, and Jenkins T (1973) Genetic Distance among Southern African Populations. In: Crawford M and Workman P (eds) Methods and Theories of
Anthropological Genetics. Albuquerque, NM: University of New Mexico Press, pp 177-199.
184
Harpending HC, and Rogers AR (1984) ANTANA: A Package for Multivariate Data
Analysis. Distributed by the authors. Harpending HC, and Ward RH (1982) Chemical Systematics and Human Populations. In: Nitechi MH (ed) Biochemical Aspects of Evolutionary Biology. Chicago, IL: University of Chicago Press, pp 213-256. Harper A (1980) Origins and Divergence of Aleuts, Eskimos and American Indians. Annals of Human Biology 7: 547-554. Hartl DL and Clark AG (1997) Principles of Population Genetics, Third Edition. Sunderland, Massachusetts: Sinauer Associates, Inc. Publishers. Hasegawa M, Di Rienzo A, Kocher TD, and Wilson AC (1993) Toward a More Accurate Time Scale for the Human Mitochondrial DNA Tree. Journal of Molecular
Evolution 37: 347-354. Hatfield V (2002) The Pan-Aleutian Lithic Project. NSF Doctoral Dissertation Improvement Grant. Hayes MG, Coltrain JB, and O’Rourke DH (2003) Mitochondrial DNA Analysis of Dorset, Thule, Sadlermiut, and Aleut Skeletal Samples from the Prehistoric North American Arctic. In: Lynnerup N, Andreasen C, and Berglund J (eds) Mummies in a
New Millennium: Proceedings of the 4th
World Congress on Mummy Studies. Copenhagen, Denmark: Greenland National Museum and Archives, Danish Polar Center, pp 125-128. Hayes MG, Coltrain JB, and O’Rourke DH (2005) Molecular Archaeology of the Dorset, Thule, and Sadlermiut: Ancestor-Descendant Relationships in Eastern North American Arctic Prehistory. In: Sutherland P (ed) Contributions to the Study of the
Dorset Palaeo-Eskimos, Mercury Series No. ARCH167. Gatineau, Quebec: Archaeological Survey of Canada, Canadian Museum of Civilization, pp 11-32. Helgason A, Nicholson G, Stefánsson K, and Donnelly P (2003) A Reassessment of Genetic Diversity in Icelanders: Strong Evidence from Multiple Loci for Relative Homogeneity Caused by Genetic Drift. Annals of Human Genetics 67: 281-297. Helgason A, Pálsson G, Pedersen HS, Angulalik E, Gunnarsdóttir ED, Yngvadóttir B, and Stefánsson K (2006) mtDNA Variation in Inuit Populations of Greenland and Canada: Migration History and Population History. American Journal of Physical
Anthropology 130: 123-134. Herrnstadt C, Elson JL, Fahy E, Preston G, Turnbull DM, Anderson C, Ghosh SS, Olefsky JM, Beal MF, Davis RE, and Howell N (2002) Reduced-Median-Network
185
Analysis of Complete Mitochondrial DNA Coding-Region Sequences for the Major African, Asian, and European Haplogroups. American Journal of Human Genetics 70: 1152-1171. Heyer E, Puymirat J, Dietjes P, Bakker E, and de Knijff (1997) Estimating Y Chromosome Specific Microsatellite Mutation Frequencies Using Deep Rooting Pedigrees. Human Molecular Genetics 6: 799-803. Hirszfeld L, and Hirszfeld H (1919) Essai D’Application des Méthodes au Problème des Races. Anthropologie 29: 505-537. Ho SYW, Phillips MJ, Cooper A, and Drummond A (2005) Time Dependency of Molecular Rate Estimates and Systematic Overestimation of Recent Divergence Times. Molecular Biology and Evolution 22: 1561-1568. Hoeffecker JF, Pwers WR, and Goebel T (1993) The Colonization of Beringia and the Peopling of the New World. Science 259: 46-53. Holland K (2001) Regional Interaction as Seen from the Eastern Aleutians. In: Dumond D (ed) Archaeology in the Aleut Zone of Alaska, Some Recent Research. Eugene, OR: University of Oregon Press, pp 173-182. Howell C, Smejkal CB, Mackey DA, Chinnery PF, Turnbull DM, Hernstadt C (2003) The Pedigree Rate of Sequence Divergence in the Human Mitochondrial Genome: There is a Difference between Phylogenetic and Pedigree Rates. American Journal of
Human Genetics 72: 659-670. Horai S, Konodo R, Nakagawa-Hattori Y, Hayashi S, Sonodo S, and Tajima K (1993) Peopling of the Americas, Founded by Four Major Lineages of Mitochondrial DNA. Molecular Biology and Evolution 10: 23-47. Hrdlička A (1945) The Aleutian and Commander Islands and their Inhabitants. Philadelphia, PA: The Wistar Institute of Anatomy and Biology.
http://www.anthropology.net accessed in June 2008. http://www.archaeology.org accessed in June 2008.
http://www.ebi.ac.uk/ensembl/index.html (Ensemble browser) accessed in May 2007. http://www.scs.uiuc.edu/~mcdonald/WorldHaplogroupsMaps.pdf accessed in 2007. http://www.yhrd.org accessed in November 2007.
186
http://www.ysearch.org accessed numerous times from 2006 to 2008. Hudson RR (1983) Properties of a Neutral Allele Model with Intragenic Recombination. Theoretical Population Biology 23: 183-201. Hudson RR (1990) Gene Genealogies and the Coalescent Process. Oxford Surveys in
Evolutionary Biology 9: 1-44. Hulse FS (1955) Blood Types and Mating Patterns Among Northwest Coast Indians. Southwest Journal of Anthropology 11: 93-104. Hulse FS (1957) Linguistic Barriers to Gene Flow. The Blood-Groups of the Yakima, Okanagon and Swinomish Indians. American Journal of Physical
Anthropology 15: 235-246. Hunter RL, and Markert CL (1957) Histochemical Demonstration of Enzymes Separated by Zone Electrophoresis in Starch Gels. Science 125: 1294-1295. Iida R, Tsubota E, and Matsuki T (2001) Identification and Characterization of Two Novel Human Polymorphic STRs on the Y Chromosome. International Journal of
Legal Medicine 115: 54-56. Iida R, Tsubota E, Sawazaki K, Masuyama M, Matsuki T, Yasuda T, and Kishi K (2002) Characterization and Haplotype Analysis of the Polymorphic Y-STRs DYS443, DYS444, and DYS445 in a Japanese Population. International Journal of
Legal Medicine 116: 191-194. Ingman M, and Gyllensten U (2001) Analysis of the Complete Human mtDNA Genome: Methodology and Inferences for Human Evolution. Journal of Heredity 92: 454-461. Ingman M, Kaessmann H, Pääbo S, and Gyllensten U (2000) Mitochondrial Genome Variation and the Origin of Modern Humans. Nature 408: 708-713. Innis MA, and Gelfand DH (1990) Optimization of PCRs. In: Innis MA, Gelfand DH, Sninsky JJ, and White TJ (eds) PCR Protocols. New York: Academic Press, pp 3-12. International Human Genome Sequencing Consortium (2001) Initial Sequencing and Analysis of the Human Genome. Nature 409: 860-921. International SNP Map Working Group (2001) A Map of Human Genome Sequence Variation Containing 1.42 Million Single Nucleotide Polymorphisms. Nature 409: 928-933.
187
Jobling MA, and Tyler-Smith C (2003) The Human Y Chromosome: An Evolutionary Marker Comes of Age. Nature Reviews: Genetics 4: 598-612. Jobling MA, Hurles ME, and Tyler-Smith C (2004) Human Evolutionary Genetics:
Origins, Peoples and Disease. New York, USA: Garland Science. Jobling MA, Samara V, Pandya A, Fretwell N, Bernasconi B, Mitchell RJ, Gerelsaikhan T, Dashnyam B, Sanjantila A, Salo PJ, Nakahori Y, Disteche CM, Thangaraj K, Singh L, Crawford MH, and Tyler-Smith C (1996) Recurrent Duplication and Deletion Polymorphism on the Long Arm of the Y Chromosome in Normal Males. Human Molecular Genetics 5: 1767-1775. Jochelson W (1933) History, Ethnology and Anthropology of the Aleut. Salt Lake City, UT: University of Utah Press. Johnson MJ, Wallace DC, Ferris SD, Ratazzi MC, and Cavalli-Sforza LL (1983) Radiation of Human Mitochondria DNA Types Analyzed by Restriction Endonuclease Cleavage Patterns. Journal of Molecular Evolution 19: 255-271. Jorde LB, Watkins WS, Bamshad MJ, Dixon ME, Ricker CE, Seielstad MT, and Batzer MA (2000) The Distribution of Human Genetic Diversity: A Comparison of Mitochondrial, Autosomal, and Y-Chromosome Data. American Journal of Human
Genetics 66: 979-988. Justice A (2007) Apportionment of Genetic Variation in Contemporary Aleut and
Eskimo Populations of Alaska using Anthropometrics and Classical Genetic Markers. Master’s thesis. University of Kansas. Karafet TM, Zegura SL, Posukh O, Osipova L, Bergen A, Long J, Goldman D, Klitz W, Harihara S, de Kniff P, Wiebe V, Griffiths RC, Templeton AR, and Hammer MF (1999) Ancestral Asian Source(s) of New World Y-Chromosome Founder Haplotypes. American Journal of Human Genetics 64: 817-831. Karafet T, Xu L, Du R, Wang W, Feng S, Wells RS, Redd AJ, Zegura SL, and Hammer MF (2001) Paternal Population History of East Asia: Sources, Patterns, and Microevolutionary Processes. American Journal of Human Genetics 69: 615-628. Karlsson AO, Wallerström T, Götherström, and Holmlund G (2006) Y-Chromosome Diversity in Sweden – A Long-Time Perspective. European Journal of Human
Genetics 14: 963-970. Kayser M, Caglia A, Corach D, Fretwell N, Gehrig C, Graziosi G, Heidorn F, Herrmann S, Herzog B, Hiddingn M, Honda K, Jobling M, Krawczak M, Leim K,
188
Meuser S, Meyer E, Oesterreich W, Pandya A, Parson W, Penacino G, Perez-Lezaun A, Piccinini A, Prinz M, Schmitt C, Schneider PM, Szibor R, Teifel-Greding J, Weichhold G, de Knijff P, and Roewer L (1997) Evaluation of Y-Chromosomal STRs: A Multicenter Study. International Journal of Legal Medicine 110: 125-133 (Appendix 141-149). Kayser M, Roewer L, Hedman M, Henke L, Henke J, Brauer S, Krüger K, Krawczak m, Nagy M, Dobosz T, Szibor R, de Knijff P, and Sajantila A (2000) Characteristics and Frequency of Germline Mutations at Microsatellite Loci from the Human Y Chromosome, as Revealed by Direct Observation in Father/Son Pairs. American
Journal of Human Genetics 66: 1580-1588. Kayser M, Brauer S, Weiss G, Scheifenhovel W, Underhill P, and Stoneking M (2001) Independent Histories of Human Y Chromosomes from Melanesia and Australia. American Journal of Human Genetics 68: 173-190. Kayser M, Kittler R, Erler A, Hedman M, Lee AC, Mohyuddin A, Mehdi SQ, Rosser Z, Stoneking M, Jobling MA, Sajantila A, and Tyler-Smith C (2004) A Comprehensive Survey of Human Y-Chromosomal Microsatellites. American
Journal of Human Genetics 74: 1183-1197. Kayser M, Lao O, Anslinger K, Augustin C, Bargel G, Edelmann J, Elias S, Heinrich M, Henke J, Henke L, Hohoff C, Illing A, Jonkisz A, Kuzniar P, Lebioda A, Lessig R, Lewicki S, Maciejewska A, Monies DM, Pawłowski R, Poetsch, Schmid D, Schmidt U, Schneider PM, Stradmann-Bellinghausen B, Szibor R, Wegener R, Wozniak M, Zoledziewska M, Roewer L, Dobosz T, and Ploski R (2005) Significant Genetic Differentiation between Poland and Germany Follows Present-Day Political Borders, as Revealed by Y-chromosome Analysis. Human Genetics 117: 428-443. Kayser M, Brauer S Cordaux R, Casto A, Lao O, Zhivotovsky LA, Moyse-Faurie C, Rutledge RB, Scheifenhoevel W, Gil D, Lin AA, Underhill PA, Oefner PJ, Trent RJ, and Stoneking M (2006) Melanesian and Asian Origins of Polynesians: mtDNA and Y Chromosome Gradients Across the Pacific. Molecular Biology and Evolution 23: 2234-2244. Khlebnikov (1994) Notes on Russian America,Parts II-V. Translated by Ramsay M. Kingston, Ontario: Limestone Press. Kingman, JFC (1982) The Coalescent. Stochastic Processes and their Applications 13: 235-248. Kivisild T, Tolk H-V, Parik J, Wang Y, Papiha SS, Bandelt H-J, and Villems R (2002) The Emerging Limbs and Twigs of the East Asian mtDNA Tree. Molecular
Biology and Evolution 19: 1737-1751.
189
Klein R (1992) The Archaeology of Modern Human Origins. Evolutionary
Anthropology 1: 5-14. Knecht R, and Davis R (2001) A Prehistoric Sequence for the Eastern Aleutians. In: Dumond D (ed) Archaeology in the Aleut Zone of Alaska, Some Recent Research. Eugene, OR: University of Oregon Press, pp 269-288. Kohlhoff D (1995) When the Wind was a River: Aleut Evacuations in World War II. Seattle, WA: University of Washington Press. Kolman CJ, Sambuughin N, and Bermingham E (1996) Mitochondrial DNA Analysis of Mongolian Populations and Implications for the Origin of New World Founders. Genetics 142: 1321-1334. Kruglyak L, and Nickerson DA (2001) Variation is the Spice of Life. Nature
Genetics 27: 234-236. Kruskal JB (1956) On the Shortest Spanning Subtree of the Graph and the Travelling Salesman Problem. Proceedings of the American Mathematical Society 7: 48-57. Kruskal JB (1964a) Multidimensional Scaling by Optimizing Goodness of Fit to a Nonmetric Hypothesis. Psychometrika 29: 1-27. Kruskal JB (1964b) Nonmetric Multidimensional Scaling: A Numerical Method. Psychometrika 29: 28-42. Kuhl H, Rottger S, Heilbronner H, Enders H, and Schempp W (2001) Loss of the Y Chromosomal PAR2-Region in Four Familial Cases of Satellited Y Chromosomes (Yqs). Chromosome Research 9: 215-222. Kvaloy K, Galvagni F, and Brown WR (1994) The Sequence Organization of the Long Arm Pseudoautosomal Region of the Human Sex Chromosomes. Human
Molecular Genetics 3: 771-778. Lahn BT, and Page DC (1999) Four Evolutionary Strata on the Human X Chromosome. Science 286: 964-967. Landsteiner K (1901) Uber Agglutinionscheinungen Normalen Menschlichen Blutes. Wiener Klinische Wochenschrift 14: 1132-1134. Landsteiner K, and Levine MDP (1928) On the Inheritance of Agglutinogens of Human Blood Demonstrable by Immune Agglutinins. Journal of Experimental
Medicine 43: 223-224.
190
Landsteiner K, and Wiener AS (1940) An Agglutinable Factor in Human Blood Recognized by Immune Sera for Rhesus Blood. Proceedings of the Society for
Experimental Biology and Medicine 43: 223-224. Lantis M (1984) Aleut. In: Handbook of North American Indians, Arctic Volume 5. Washington, USA: Smithsonian Institution, pp 161-184. Laughlin W (1963) Eskimos and Aleuts: Their Origins and Evolution. Science 142: 633-645. Laughlin W (1967) Human Migration and Permanent Occupation in the Bering Sea Area. In: Hopkins D (ed) The Bering Land Bridge. Stanford, CA: University of Stanford Press, pp 409-450. Laughlin W (1975) Aleut Adaptation and Evolution. In: Fitzhugh W (ed) Prehistoric
Maritime Adaptations of the Circumpolar Zone. The Hague: Mouton, pp 181-202. Laughlin W (1980) Aleuts: Survivors of the Bering Land Bridge. New York: Holt, Rinehart, and Winston. Laughlin W, and Marsh G (1951) The Lamellar Flake Manufacturing Site on Anangula Island in the Aleutians. American Antiquity 1: 27-39. Lefevre C, West D, and Corbett D (2001) Archaeological Surveys in the Near Islands: Attu Island and Shemya Island. In: Dumond D (ed) Archaeology in the Aleut
Zone of Alaska, Some Recent Research. Eugene, OR: University of Oregon Press, pp 235-250. Lell JT, Sukernik RI, Starikovskaya YB, Su B, Jin L, Schurr TG, Underhill PA, and Wallace DC (2002) The Dual Origin and Siberian Affinities of Native American Y Chromosomes. American Journal of Human Genetics 70: 192-206. Li L, and Hamer DH (1995) Recombination and Allelic Association in the Xq/Yq Homology Region. Human Molecular Genetics 4: 2013-2016. Liapunova R (1975) Essays on the Ethnography of the Aleuts. Translated (1996) by Shelest J. Fairbanks, AK: University of Alaska Press. Livingstone FB (1958) Anthropological Implications of Sickle-Cell Gene Distribution in West Africa. American Anthropologist 60: 533-562. Livingstone FB (1960) The Wave of Advance of an Advantageous Gene: The Sickle Cell Gene in Liberia. Human Biology 32: 197-202.
191
Lorenz JG, and Smith DG (1996) Distribution of the Four Founding Haplogroups among Native North Americans. American Journal of Physical Anthropology 101: 307-323. Lorenz JG, and Smith DG (1997) Distribution of Sequence Variation in the mtDNA Control Region of Native North Americans. Human Biology 69: 749-776. Lowe M (2006) The Impact of Industrial Fishing on Localized Social and
Environmental Change in Alaska’s Aleutian Islands. PhD dissertation. Columbia University, New York. Lucotte G, and Ngo NY (1985) p49f, a Highly Polymorphic Probe, that Detects Taq1 RFLPs on the Human Y Chromosome. Nucleic Acids Research 13: 82-85. Lutz S, Weisser H-J, Heizmann J, and Pollak S (1998) Location and Frequency of Polymorphic Positions in the mtDNA Control Region of Individuals from Germany. International Journal of Legal Medicine 111: 67-77. Macaulay VA, Richards MB, Forster P, Bendall KE, Watson E, Sykes B, and Bandelt HJ (1997) MtDNA Mutation Rates – No Need to Panic. American Journal of Human
Genetics 61: 983-990. Macauley VA, Richards M, Hickey E, Vega E, Cruciani F, Guida V, Scozzari R, Bonné-Tamir B, Sykes B, and Torroni A (1999) The Emerging Tree of West Eurasian mtDNAs: A Synthesis of Control Region Sequences and RFLPs. American Journal
of Human Genetics 64: 232-249. Malhi RS, Eshleman JA, Greenberg JA, Weiss DA, Shook BAS, Kaestle FA, Lorenz JG, Kemp BM, Johnson JR, and Smith DG (2002) The Structure of Diversity within New World Mitochondrial DNA Haplogroups: Implications for the Prehistory of North America. American Journal of Human Genetics 70: 905-919. Malhi RS, Mortensen HM, Eshleman JA, Kemp BM, Lorenz JG, Kaestle FA, Johnson JR, Gorodezky C, and Smith DG (2003) Native American mtDNA Prehistory in the American Southwest. American Journal of Physical Anthropology 120: 108-124. Malyarchuk BA, Rogoszin IB, Berikov VB, and Derenko MV (2002) Analysis of Phylogenetically Reconstructed Mutational Spectra in Human Mitochondrial DNA Control Region. Human Genetics 111: 46-53. Malyarchuk B, Derenko M, Grzybowski T, Lunkina A, Czarny J, Rychkov S, Morozova I, Denisova G, and Miścicka-Śliwka D (2004) Differentiation of
192
Mitochondrial DNA and Y Chromosomes in Russian Populations. Human Biology 76: 877-900. Mann CC (2005) 1491: New Revelations of the Americas Before Columbus. New York, USA: Knopf. Manni F, and Guérard E (2004) Barrier version 2.2. Manual of the User. Distributed by the authors. Population genetics team, Musée de l’homme, Paris, France. Manni F, Guérard E, and Heyer E (2004) Geographic Patterns of (Genetic, Morphologic, Linguistic) Variation : How Barriers can be Detected by ‘Monmonier’s Algorithm’. Human Biology 76: 173-190. Mantel N (1967) The Detection of Disease Clustering and a Generalized Regression Approach. Cancer Research 27: 209-220. Marjanovic D, Fornarino S, Montagna S, Primorac D, Hadziselimovic R, Vidovic S, Pojskic N, Battaglia V, Achilli A, Drobnic K, Andjelinovic S, Torroni A, Santachiara-Benercetti AS, and Semino O (2005) The Peopling of Modern Bosnia-Herzegovina: Y-Chromosome Haplogroups in the Three Main Ethnic Groups. Annals of Human Genetics 69: 757-763. Mathias N, Bayés M, and Tyler-Smith C (1994) Highly Informative Compound Haplotypes for the Human Y Chromosome. Human Molecular Genetics 3: 115-123. McCartney A (1984) Prehistory of the Aleutian Region. In: Arctic. Handbook of
North American Indians, Volume 5. Washington, USA: Smithsonian Insitution Press, pp 119-135. McCartney A, and Turner C (1966) Stratigraphy of the Anangula Unifacial Core and Blade Site. Arctic Anthropology 3: 28-40. McCartney A, and Veltre D (1996) Anangula Core and Blade Site. In: West FH (ed) American Beginnings: The Prehistory and Paleoecology of Beringia. Chicago: The University of Chicago Press, pp 443-450. Melton PE, Briceño I, Gómez A, Devor EJ, Bernal JE, and Crawford MH (2007) Biological Relationship between Central and South American Chibchan Speaking Populations: Evidence from mtDNA. American Journal of Physical Anthropology 133: 753-770. Merriwether D, Rothhammer F, and Ferrell R (1995) Distribution of the Four Founding Lineage Haplotypes in Native Americans Suggests a Single Wave of
193
Migration for the New World. American Journal of Physical Anthropology 98: 411-430. Merriwether DA, Hall WW, Vahlne A, and Ferrell RE (1996) MtDNA Variation Indicates Mongolia may have been the Source for the Founding Population for the New World. American Journal of Human Genetics 59: 204-212. Milan LC (1974) Ethnohistory of Disease and Medical Care among the Aleut. Anthropological Papers of the University of Alaska 16: 15-40. Miller MP (2005) Alleles In Space (AIS): Computer Software for the Joint Analysis of Interindividual Spatial and Genetic Information. Journal of Heredity 96: 722-724. Mishler C, and Mason R (1996) Alutiiq Vikings: Kinship and Fishing in Old Harbor, Alaska. Human Organization 55: 263-269. Moilanen JS, Finnila S, and Majamaa K (2003) Lineage-Specific Selection in Human mtDNA: Lack of Polymorphisms in a Segment of MTND5 Gene in Haplogroup J. Molecular Biology and Evolution 20: 2132-2142. Monmonier M (1973) Maximum-Difference Barriers: An Alternative Numerical Regionalization Method. Geography Analysis 3: 245-261. Montagu A (1964) Concept of Race in the Human Species in the Light of Genetics. Journal of Heredity 32: 243-247. Moraga ML, Rocco P, Miguel JF, Nervi F, Llop E, Chakraborty R, Rothhammer F, and Carvallo P (2000) Mitochondrial DNA Polymorphisms in Chilean Aboriginal Populations: Implications for the Peopling of the Southern Cone of the Continent. American Journal of Physical Anthropology 113: 19-29. Moss M, and Erlandson J (1992) Forts, Refuge Rocks, and Defensive Sites: The Antiquity of Warfare along the North Pacific Coast of North America. Arctic
Anthropology 29: 79-90. Mourant AE (1985) Blood Relations: Blood Groups and Anthropology. Oxford, UK: Oxford University Press. Nachman MW, and Crowell SL (2000) Estimate of the Mutation Rate per Nucleotide in Humans. Genetics 156: 297-304. Nachman MW, Brown WM, Stoneking M, and Aquadro CF (1996) Nonneutral Mitochondrial DNA Variation in Humans and Chimpanzees. Genetics 142: 953-963.
194
Nei M (1987) Molecular Evolutionary Genetics. New York, USA: Columbia University Press. Nei M, and Li WH (1979) Mathematical Model for Studying Genetic Variation in Terms of Restriction Endonucleases. Proceedings of the National Academy of
Sciences USA 76: 5269-5273. Nicholson G, Smith AV, Jónsson F, Gústafsson Ó, Stefánsson K, and Donnelly P (2002) Assessing Population Differentiation and Isolation from Single-Nucleotide Polymorphism Data. Journal of the Royal Statistical Society: Series B 64: 695-715. O’Leary M (2001) Volcanic Ash Stratigraphy for Adak Island, Central Aleutian Archipelago. In: Dumond D (ed) Archaeology in the Aleut Zone of Alaska, Some
Recent Research. Eugene, OR: University of Oregon Press, pp 215-233. Oota H, Settheetham-Ishida W, Tiwawech D, Ishida T, and Stoneking M (2001) Human mtDNA and Y-Chromosome Variation is Correlated with Matrilocal versus Patrilocal Residence. Nature Genetics 29: 20-21. O’Rourke DH (2003) Anthropological Genetics in the Genomic Era: A Look Back and Ahead. American Anthropologist 105: 101-109. Ossenberg N (1992) Native People of the American Northwest: Population History from the Perspective of Skull Morphology. In: Akazawa T, Aoki K, and Kimura T (eds) The Evolution and Dispersal of Modern Humans in Asia. Japan: Hokusen-Sha Publishing Company. Ousley S (1995) Relationships between Eskimos, Amerindians, and Aleuts: Old Data, New Perspectives. Human Biology 67: 427-458. Pakendorf B, and Stoneking M (2005) Mitochondrial DNA and Human Evolution. Annual Review of Genomics and Human Genetics 6: 165-183. Pakendorf B, Novgorodov IN, Osakovskij VL, Danilova AP, Protod’jakonov AP, and Stoneking M (2006) Investigating the Effects of Prehistoric Migrations in Siberia: Genetic Variation and the Origins of Yakuts. Human Genetics 120: 334-353. Pearson R (1959) Blood Groups and Race. London: Clair Press. Piganeau G, Gardner M, and Eyre-Walker A (2004) A Broad Survey of Recombination in Animal Mitochondria. Molecular Biology and Evolution 21: 2319-2325.
195
Porter RA (1893) Report on the Population and Resources of Alaska at the Eleventh
Census: 1893. Washington, USA: United States Government Printing Office. Powell J (1993) Dental Evidence for the Peopling of the New World: Some Methodological Considerations. Human Biology 65: 799-819. Pritchard JK, Seielstad MT, Pérez-Lezaun A, and Feldman MW (1999) Population Growth of Human Y Chromosomes: A Study of Y Chromosome Microsatellites. Molecular Biology and Evolution 16: 1791-1798. Qian Y, Qian B, Su B, Yu J, Ke Y, Chu Z, Shi L, Lu D, Chu J, and Jin L (2000) Multiple Origins of Tibetan Y Chromosomes. Human Genetics 106: 453-454. Quintana-Murci L, and Fellous M (2001) The Human Y Chromosome: The Biological Role of a “Functional Wasteland”. Journal of Biomedicine and
Biotechnology 1: 18-24. Ramenofsky AF (1987) Vectors of Death: The Archaeology of European Contact. Albuquerque, NM: University of New Mexico Press. Ramos-Onsins SE, and Rozas J (2002) Statistical Properties of New Neutrality Tests Against Population Growth. Molecular Biology and Evolution 19: 2092-2100. Ray N, Mathias C, and Excoffier L (2003) Intra-Deme Molecular Diversity in Spatially Expanding Populations. Molecular Biology and Evolution 20: 76-86. Redd AJ, Agellon AB, Kearney VA, Contreras VA, Karafet T, Park H, de Knijff P, Butler JM, and Hammer MF (2002a) Forensic Value of 14 Novel STRs of the Human Y Chromosome. Forensic Science International 130: 97-111. Redd AJ, Roberts-Thomson J, Karafet T, Bamshad M, Jorde LB, Naidu JM, Walsh B, and Hammer MF (2002b) Gene Flow from the Indian Subcontinent to Australia: Evidence from the Y Chromosome. Current Biology 12: 673-677. Redd AJ, Chamberlain VF, Kearney VF, Stover D, Karafet T, Calderon K, Walsh B, and Hammer MF (2006) Genetic Structure among 38 populations from the United States based on 11 U.S. Core Y chromosome STRs. Journal of Forensic Science 51: 580-585. Reedy-Maschner K (2007) "Where did all the Aleut Men Go?": Aleut Male Attrition and Related Patterns in Aleutian Demography and Social Organization. In: O’Rourke DH, Crawford MH, and West DL (eds) The Aleutian Islands: Archaeology,
Demography and Genetics. Salt Lake City, UT: University of Utah Press.
196
Reidla M, Kivisild T, Metspalu E, Kaldma K, Tambets K, Tolk H-V, Parik J, Loogväli E-L, Derenko M, Malyarchuk B, Bermisheva M, Zhadanov S, Pennarun E, Gubina M, Golubenko M, Damba L, Fedorova S, Gusar V, Grechanina E, Mikerezi I, Moisan J-P, Chaventré A, Khusnutdinova E, Osipova L, Stepanov V, Voevoda M, Achilli A, Rengo C, Rickards O, De Stefano GF, Papiha S, Beckman L, Janicijevic B, Rudan P, Anagnou N, Michalodimitrakis E, Koziel S, Usanga E, Geberhiwot T, Herrnstadt C, Howell N, Torroni A, and Villems R (2003) Origin and Diffusion of mtDNA Haplogroup X. American Journal of Human Genetics 73: 1178-1190. Relethford JH (2000) GEOG. Distributed by the author. SUNY College at Oneota, New York. Relethford JH (2008) Genetic Evidence and the Modern Human Origins Debate. Heredity 100 : 555-563. Repping S, van Daalen SK, Korver CM, Brown LG, Marszalek JD, Gianotten J, Oates RD, Silber S, van der Veen F, Page DC, and Rozen S (2004) A Family of Human Y Chromosomes has Dispersed Throughout Northern Eurasia Despite a 1, 8-Mb Deletion in the Azoospermia Factor c Region. Genomics 83: 1046-1052. Repping S, van Daalen SK, Brown LG, Korver CM, Lange J, Marszalek JD, Pyntikova T, van der Veen F, Skaletsky H, Page DC, and Rozen S (2006) High Mutation Rates have Driven Extensive Structural Polymorphism among Human Y Chromosomes. Nature Genetics 38: 463-467. Richards MB, Macauley V, Hickey E, Vega E, Sykes B, Guida V, Rengo C, Sellitto D, Cruciani F, Kivisild T, Villems R, Thomas M, Rychkov S, Rychkov O, Rychkov Y, Gölge M, Dimitrov D, Hill E, Bradley D, Romano V, Cali F, vona G, Demaine A, Papiha S, Triantaphyllidis C, Stefanescu G, Hatina J, Belledi M, Di Rienzo A, Novelletto A, Oppenheim A, Nørby S, Al-Zaheri, Santachiara-Benerecetti S, Scozzari R, Torroni A, and Bandelt H-J (2000) Tracing European Founder Lineages in the Near Eastern mtDNA Pool. American Journal of Human Genetics 67: 1251-1276. Robin ED, and Wong R (1988) Mitochondrial DNA Molecules and Virtual Number of Mitochondria per Cell in Mammalian Cells. Journal of Cellular Physiology 136: 507-513. Roewer L, and Epplen JT (1992) Rapid and Sensitive Typing of Forensic Stains by PCR Amplification of Polymorphic Simple Repeat Sequences in Case Work. Forensic Science International 53: 163-171. Roewer L, Croucher PJP, Willuweit S, Lu TT, Kayser M, Lessig R, de Knijff P, Jobling MA, Tyler-Smith C, and Krawczak M (2005) Signature of Recent Historical
197
Events in the European Y-Chromosomal STR Haplotype Distribution. Human
Genetics 116: 279-291. Rogers AR (2004) Lecture 7 (Biology 5410): The Theoretical Mismatch Distribution. University of Utah, Salt Lake City, UT. Rogers AR, and Harpending HC (1992) Population Growth Makes Waves in the Distribution of Pairwise Genetic Differences. Molecular Biology and Evolution 9: 552-569. Rogers RA, Rogers LA, Hoffmann RS, and Martin LD (1991) Native American Biological Diversity and the Biogeographic Influence of Ice Age Refugia. Journal of
Biogeography 18: 623-630. Rolf B, Keil W, Brinkmann B, Roewer L, and Fimmers R (2001) Paternity Testing using Y-STR Haplotypes: Assigning a Probability for Paternity in Cases of Mutations. International Journal of Legal Medicine 115: 12-15. Rootsi S, Magri C, Kivisild T, Benuzzi G, Help H, Bermisheva M, Kutuev I, Barać L, Peričić M, Balanovsky O, Pshenichnov A, Dion D, Grobei M, Zhivotovsky LA, Battaglia V, Achilli A, Al-Zahery N, Parik J, King R, Cinnioğlu C, Khusnutdinova E, Rudan P, Balanovska E, Scheffrahn W, Simonescu M, Brehm A, Goncalves R, Rosa A, Moisan J-P, Chaventre A, Ferak V, Füredi S, Oefner PJ, Shen P, Beckman L, Mikerezi I, Terzić R, Primorac D, Cambon-Thomsen A, Krumina A, Torroni A, Underhill PA, Santachiara-Benercetti AS, Villems R, and Semino O (2004) Phylogeography of Y-Chromosome Haplogroup I Reveals Distinct Domains of Prehistoric Gene Flow in Europe. American Journal of Human Genetics 75: 128-137. Rosenberg NA, Pritchard JK, Weber JL, Cann HM, Kidd KK, Zhivotovsky LA, and Feldman MW (2002) Genetic Structure of Human Populations. Science 298: 2381-2385. Roumaldi C, Balding D, Nasidze IS, Risch G, Robichaux M, Sherry ST, Stoneking M, Batzer MA, and Barbujani G (2002) Patterns of Human Diversity, within and among Continents, Inferred from Biallelic DNA Polymorphisms. Genome Research 12: 602-612. Rubicz RC (2001) Origins of the Aleuts: Molecular Perspectives. Master’s thesis. University of Kansas. Rubicz RC (2007) Evolutionary Consequences of Recently Founded Aleut
Communities in the Commander and Pribilof Islands. PhD dissertation. University of Kansas.
198
Rubicz RC, Schurr TG, Babb PL, and Crawford MH (2003) Mitochondrial DNA Variation and the Origins of the Aleuts. Human Biology 75: 809-835. Ruhlen M (1991) A Guide to the World’s Languages. Stanford, CA: Stanford University Press. Ruiz-Pesini E, Mishmar D, Brandon M, Procaccio V, and Wallace DC (2004) Effects of Purifying and Adaptive Selection on Regional Variation in Human mtDNA. Science 303: 223-226. Rychkov YG, and Sheremetyeva VA (1972) Population Genetics of the Aleuts of the Commander Islands. Voprosy Anthropologii 40: 45-70. Sahoo S, Singh A, Himabindu G, Banerjee J, Sitalaximi T, Gaikwad S, Trivedi R, Endicott P, Kivisild T, Metspalu M, Villems R, and Kashyap VK (2006) A Prehistory of Indian Y Chromosomes: Evaluating Demic Diffusion Scenarios. Proceedings of
the National Academy of Sciences USA 103: 843-848. Saillard J, Forster P, Lynnerup N, Bandelt H-J, and Norby S (2000) mtDNA Variation among Greenland Eskimos: The Edge of the Beringian Expansion. American Journal of Human Genetics 67: 718-726. Saitou N, and Nei M (1987) The Neighbor-Joining Method: A New Method for Reconstructing Phylogenetic Trees. Molecular Biology and Evolution 10: 471-483. Sambrook J, Fritsch EF, and Maniatis T (1989) Molecular Cloning: A Laboratory
Manual, Second Edition. Plainview, New York: Cold Spring Harbor Laboratory Press. Sanger F, Micklen S, and Coulson AR (1977) DNA Sequencing and Chain-Terminating Inhibitors. Proceedings of the National Academy of Sciences USA 74: 5463-5467. Santachiara-Benerecetti AS, Scozzari R, Semino O, Torroni A, Brega A, and Wallace DC (1988) Mitochondrial DNA Polymorphisms in Italy. II. Molecular Analysis of New and Rare Morphs from Sardinia and Rome. Annals of Human Genetics 52: 39-56. Santos FR, Pena SDJ, and Tyler-Smith C (1995) PCR Haplotypes for the Human Y Chromosome Based on Alphoid Satellite Variants and Heteroduplex Analysis. Gene 165: 191-198.
199
Santos FR, Pandya A, Tyler-Smith C, Pena SD, Schanfield M, Leonard WR, Osipova L, Crawford MH, and Mitchell RJ (1999) The Central Siberian Origin for Native American Y Chromosomes. American Journal of Human Genetics 64: 619-628. Sarich VM, and Wilson AC (1967) Immunological Time Scale for Hominid Evolution. Science 158: 1200-1203. Schneider S, and Excoffier L (1999) Estimation of Past Demographic Parameters from the Distribution of Pairwise Differences when the Mutation Rates Vary among Sites: Application to Human Mitochondrial DNA. Genetics 152: 1079-1089. Schneider S, Roessli D, and Excoffier L (2000) Arlequin ver. 2.00: A Software for
Population Genetic Data Analysis. Switzerland: Genetics and Biometry Laboratory, University of Geneva. Schurr TG (2001) Mitochondrial DNA and the Peopling of the New World. American Scientist 88: 246-253. Schurr TG (2004) The Peopling of the New World: Perspectives from Molecular Anthropology. Annual Review of Anthropology 33: 551-583. Schurr TG, Ballinger SW, Gan YY, Hodge JA, Merriwether DA, Lawrence DN, Knowler WC, Weiss KM, and Wallace DC (1990) Amerindian Mitochondrial DNAs have Rare Asian Mutations at High Frequencies, Suggesting they Derived from Four Primary Maternal Lineages. American Journal of Human Genetics 46: 613-623. Schurr TA, Sukernik RI, Starikovskaya YB, and Wallace DC (1999) Mitochondrial DNA Variation in Koryaks and Itel’men: Population Replacement in the Okhotsk Sea-Bering Sea Region during the Neolithic. American Journal of Physical
Anthropology 108: 1-39. Schwartz M, and Vissing J (2002) Paternal Inheritance of Mitochondrial DNA. New
England Journal of Medicine 347: 576-580. Scozzari R, Torroni A, Semino A, Sirugo G, Brega A, and Santachiara-Benerecetti AS (1988) Genetic Studies on the Senegal Population. I. Mitochondrial DNA Polymorphisms. American Journal of Human Genetics 43: 534-544. Seielstad MT, Hebert JM, Lin AA, Underhill PA, Ibrahim M, Vollrath D, and Cavalli-Sforza LL (1994) Construction of Human Y-Chromosomal Haplotypes Using a New Polymorphic A to G Transition. Human Molecular Genetics 3: 2159-2161. Seielstad MT, Minch E, and Cavalli-Sforza LL (1998) Genetic Evidence for a Higher Female Migration Rate in Humans. Nature Genetics 20: 278-280.
200
Semino O, Passarino G, Oefner PJ, Lin AA, Arbuzova S, Beckman LE, De Benedictis G, Francalacci P, Kouvatsi A, Limborska S, Marcikiæ M, Mika A, Mika B, Primorac D, Santachiara-Benerecetti AS, Cavalli-Sforza LL, and Underhill PA (2000) The Genetic Legacy of Paleolithic Homo Sapiens in Extant Europeans: A Y Chromosome Perspective. Science 290: 1155-1159. Semino O, Magri C, Benuzzi G, Lin AA, Al-Zahery N, Battaglia V, Maccioni L, Triantaphyllidid C, Shen P, Oefner PJ, Zhivotovsky LA, King R, Torroni A, Cavalli-Sforza LL, Underhill PA, and Santachiara-Benercetti AS (2004) Origin, Diffusion, and Differentiation of Y-Chromosome Haplogroup E and J: Inferences on the Neolithization of Europe and Later Migratory Events in the Mediterranean Area. American Journal of Human Genetics 74: 1023-1034. Shen P, Wang F, Underhill PA, Franco C, Yang WH, Roxas A, Sung R, Lin AA, Hyman RW, Vollrath D, Davis RW, Cavalli-Sforza LL, and Oefner PJ (2000) Population Genetic Implications from Sequence Variation in Four Y Chromosome Genes. Proceedings National Academy of Sciences USA 97: 7354-7359. Sherry ST, Rogers AR, Harpending H, Soodyall H, Jenkins T, and Stoneking M (1994) Mismatch Distributions of mtDNA Reveal Recent Human Population Expansions. Human Biology 66: 761-775. Shields GF, Schmiechen AM, Frazier BL, Redd A, Voevoda MI, Reed JK, and Ward RH (1993) mtDNA Sequences Suggest a Recent Evolutionary Divergence for Beringian and Northern North American Populations. American Journal of Human
Genetics 53: 549-562. Sigurgardóttir S, Helgason A, Gulcher JR, Stefánsson K, and Donnelly P (2000) The Mutation Rate in the Human mtDNA Control Region. American Journal of Human
Genetics 66: 1599-1609. Silva WA Jr, Bonatto SL, Holanda AJ, Ribeiro-Dos-Santos AK, Paixao BM, Goldman GH, Abe-Sandes K, Rodriguez-Delfin L, Barbosa M, Paco-Larson ML, Petzl-Erler ML, Valente V, Santos SE, and Zago MA (2002) Mitochondrial Genome Diversity of Native Americans Supports a Single Early Entry of Founder Populations into America. American Journal of Human Genetics 71: 187-192. Simonson JH, and Shields GF (1997) Genetic Evidence for a Beringian Bottleneck in Northern Native Americans during the Late Pleistocene. Unpublished. Skaletsky H, Kuroda-Kawaguchi T, Minx PJ, Cordum HS, Hillier L, Brown LG, Repping S, Pyntikova T, Ali J, Bieri T, Chinwalla A, Delehaunty A, Delehaunty K, Du H, Fewell G, Fulton L, Fulton R, Graves T, Hou S-F, Latrielle P, Leonard S,
201
Mardis E, Maupin R, McPherson J, Miner T, Nash W, Nguyen C, Ozersky P, Pepin K, Rock S, Rohlfing T, Scott K, Schultz B, Strong C, Tin-Wollam A, Yang S-P, Waterston RH, Wilson RK, Rozen S, and Page DC (2003) The Male-Specific Region of the Human Y Chromosome is a Mosaic of Discrete Sequence Classes. Nature 423: 825-837. Slatkin, M (1995) A Measure of Population Subdivision based on Microsatellite Allele Frequencies. Genetics 139: 457-462. Slatkin M, and Hudson RR (1991) Pairwise Comparisons of Mitochondrial DNA Sequences in Stable and Exponentially Growing Populations. Genetics 129: 555-562. Smith B (2000) Science under Sail: Russia’s Great Voyages to America 1728-1867. Anchorage, AK: Anchorage Museum of History and Art. Smithies O (1955) Zone Electrophoresis in Starch Gels: Group Variation in the Serum Proteins of Normal Human Adults. Biochemical Journal 61: 629-641. Smouse PE, Long JC, and Sokal RR (1986) Multiple Regression and Correlation Extensions of the Mantel Test of Matrix Correspondence. Systematic Zoology 35: 627-632. Sokal RR, and Oden NL (1978) Spatial Autocorrelation Analysis in Biology. 1. Methodology. Biological Journal of the Linnean Society 10: 199-228. Sokal RR, Oden NL, and Thomson BA (1999) A problem with synthetic maps. Human Biology 71: 1-13. Starikovskaya YB, Sukernik RI, Schurr TG, Kogelnik AM, and Wallace DC (1998) mtDNA diversity in Chukchi and Siberian Eskimos: Implications for the Genetic History of Ancient Beringia and the Peopling of the New World. American Journal
of Human Genetics 63: 1473-1491. Starikovskaya YB, Sukernik RI, Derbeneva OA, Volodko NV, Ruiz-Pesini E, Torroni A, Brown MD, Lott MT, Hosseini SH, Huoponen K, and Wallace DC (2005) Mitochondrial DNA Diversity in Indigenous Populations of the Southern Extent of Siberia, and the Origins of Native American Haplogroups. Annals of Human
Genetics 69: 67-89. Su B, Xiao J, Underhill P, Deka R, Zhang W, Akey J, Huang W, Shen D, Lu D, Luo J, Jiayou C, Jiazhen T, Peidong S, Davis R, Cavalli-Sforza LL, Chakraborty R, Momiao X, Ruofu D, Oefner P, Zhu C, and Li J (1999) Y-Chromosome Evidence for a Northward Migration of Modern Humans into Eastern Asia during the Last Ice Age. American Journal of Human Genetics 65: 1718-1724.
202
Su B, Xiao C, Deka R, Seielstad MT, Kangwanpong D, Xiao J, Lu D, Underhill P, Cavalli-Sforza L, Chakraborty R, and Jin L (2000) Y chromosome haplotypes reveal prehistorical migrations to the Himalayas. Human Genetics 107: 582-590. Szathmary E, and Ossenberg N (1978) Are the Biological Differences between North American Indians and Eskimos truly Profound? Current Anthropology 19: 673-701. Tajima F (1983) Evolutionary Relationship of DNA Sequences in Finite Populations. Genetics 105: 437-460. Tajima F (1989a) Statistical Method for Testing the Neutral Mutation Hypothesis by DNA Polymorphism. Genetics 123: 585-595. Tajima F (1989b) The effect of change in population size on DNA polymorphism. Genetics 123: 597-601. Tajima F (1993) Measurement of DNA Polymorphism. In: Takahata N and Clark AG (eds) Mechanisms of Molecular Evolution: Introduction to Molecular
Paleopopulation Biology. Tokyo: Japan Scientific Societies Press, pp 37-59. Takahata N, Lee SH, and Satta Y (2001) Testing Multiregionality of Modern Human Origins. Molecular Biology and Evolution 18: 172-183. Tamm E, Kivisild T, Reidla M, Metspalu M, Smith DG, Mulligan CJ, Bravi CM, Rickards O, Martinez-Labarga C, Khusnutdinova EK, Fedorova SA, Golubenko MV, Stepanov VA, Gubina MA, Zhadanov S, Ossipova LP, Damba L, Voevoda MI, Dipierri JE, Villems R, and Malhi RS (2007) Beringian Standstill and Spread of Native American Founders. PLoS ONE 9: e829. Tamura K, and Nei M (1993) Estimation of the Number of Nucleotide Substitutions in the Control Region of Mitochondrial DNA in Humans and Chimpanzees. Molecular Biology and Evolution 10: 512-526. Tanaka M, Cabrera VM, González AM, Larruga JM, Takeyasu T, Fuku N, Guo L-J, Hirose R, Fujita Y, Kurata M, Shinoda K, Umetsu K, Yamada Y, Oshida Y, Sato Y, Hattori N, Mizuno Y, Arai Y, Hirose N, Ohta S, Ogawa O, Tanaka Y, Kawamori R, Shamoto-Nagai M, Maruyama W, Shimokata H, Suzuki R, and Shimodaira H (2004) Mitochondrial Genome Variation in Eastern Asia and the Peopling of Japan. Genome
Research 14: 1832-1850. Templeton AR (1992) Human Origins and Analysis of Mitochondrial DNA Sequences. Science 255: 737.
203
Templeton AR (2002) Out of Africa Again and Again. Nature 416: 45-51. Thomson R, Pritchard JK, Shen P, Oefner PJ, and Feldman MW (2000) Recent Common Ancestry of Human Y Chromosomes: Evidence from DNA Sequence Data. Proceedings of the National Academy of Sciences USA 97: 7360-7365. Torroni A, Schurr TG, Yang CC, Szathmary EJE, Williams RC, Schanfield MS, Troup GA, Knowler WC, Lawrence DN, Weiss KM, and Wallace DC (1992) Native American Mitochondrial DNA Analysis Indicates that the Amerind and the Nadene Populations were Founded by Two Independent Migrations. Genetics 130: 153-162. Torroni A, Schurr TG, Cabell MF, Brown MD, Neel JV, Larsen M, Smith DG, Vullo CM, and Wallace DC (1993a) Asian Affinities and Continental Radiation of the Four Founding Native American mtDNAs. American Journal of Human Genetics 53: 563-590. Torroni A, Sukernik RI, Schurr TG, Starikovskaya YB, Cabell MF, Crawford MH, Commuzzie AG, and Wallace DC (1993b) MtDNA Variation of Aboriginal Siberians Reveals Distinct Genetic Affinities with Native Americans. American Journal of
Human Genetics 53: 591-608. Torroni A, Miller JA, Moore LG, Zamudio S, Zhuang J, Droma T, and Wallace DC (1994a) Mitochondrial DNA Analysis in Tibet: Implications for the Origin of the Tibetan Populations and its Adaptation to High Altitude. American Journal of
Physical Anthropology 93: 189-199. Torroni A, Neel JV, Barrantes R, Schurr TG, and Wallace DC (1994b) Mitochondrial DNA ‘Clock’ for the Amerinds and its Implications for Timing their Entry into North America. Proceedings of the National Academy of Sciences USA 91: 1158-1162. Torroni A, Huoponen K, Francalacci P, Petrozzi M, Morelli L, Scozzari R, Obinu D, Savontaus M-L, and Wallace DC (1996) Classification of European mtDNAs from an Analysis of Three European Populations. Genetics 144: 1835-1850. Turner C (1985) The Dental Search for Native American Origins. In: Kirk R, and Szathmary E (eds) Out of Asia. Canberra, Australia: Australian National University Press, pp 31-78. Underhill PA, Jin L, Zemans R, Oefner PJ, and Cavalli-Sforza LL (1996) A Pre-Columbian Y Chromosome-Specific Transition and its Implications for Human Evolutionary History. Proceedings of the National Academy of Sciences USA 93: 196-200.
204
Underhill PA, Jin L, Lin AA, Mehdi SQ, Jenkins T, Vollrath D, Davis RW, Cavalli-Sforza LL, and Oefner PJ (1997) Detection of Numerous Y Chromosome Biallelic Polymorphisms by Denaturing High-Performance Liquid Chromatography. Genome
Research 7: 996-1005. Underhill PA, Shen P, Lin AA, Jin L, Passarino G, Yang WH, Kauffman E, Bonné-Tamir B, Bertranpetit J, Francalacci P, Ibrahim M, Jenkins T, Kidd JR, Mehdi SQ, Seielstad MT, Wells RS, Piazza A, Davis RW, Feldman MW, Cavalli-Sforza LL,and Oefner PJ (2000) Y Chromosome Sequence Variation and the History of Human Populations. Nature Genetics 26: 358-361. Underhill PA, Passarino G, Lin AA, Shen P, Mirazon Lahr M, Foley RA, Oefner PJ, and Cavalli-Sforza LL (2001) The Phylogeography of Y Chromosome Binary Haplotypes and the Origins of Modern Human Populations. Annals of Human
Genetics 65: 43-62. Veniaminov I (1840) Notes on the Islands of the Unalaska District. St. Petersburg, Russia: Russian-American Company. Venter JC, Adams MD, Myers EW, Li PW, Mural RJ, Sutton GG, Smith HO, Yandell M, Evans CA, Holt RA et al. (2001) The sequence of the human genome. Science 291: 1304-1351. Vigilant L, Pennington R, Harpending H, Kocher TD, and Wilson AC (1989) Mitochondrial DNA Sequences in Single Hairs from a Southern African Population. Proceedings of the National Academy of Sciences USA 86: 9350-9354. Vogt PH, Affara N, Davey P, Hammer M, Jobling MA, Lau YF, Mitchell M, Schempp W, Tyler-Smith C, Williams G, Yen P, and Rappold GA (1997) Report of the Third International Workshop on Y Chromosome Mapping. Cytogenetics and
Cell Genetics 79: 1-20. Volodko NV, Starikovskaya EB, Mazunin IO, Eltsov NP, Naidenko PV, Wallace DC, and Sukernik RI (2008) Mitochondrial Genome Diversity in Arctic Siberians, with Particular Reference to the Evolutionary History of Beringia and Pleistocene Peopling of the Americas. American Journal of Human Genetics 82: 1-17. Voronoï MG (1908) Nouvelles Application des Paramètres Continus à la Théorie de Formes Quadratiques, Deuxième Mémoire, Recherche sur le Paralléloedres Primitifs. Journal für die Reine und Angewandte Mathematik 134: 198-207. Walsh PS, Metzger DA, and Higuchi R (1991) Chelex® 100 as a Medium for Simple Extraction of DNA for PCR-Based Typing from Forensic Material. BioTechniques 10: 506-513.
205
Ward RH, Frazier BL, Dew-Jager K, and Pääbo S (1991) Extensive Mitochondrial Diversity within a Single Amerindian Tribe. Proceedings of the National Academy of
Sciences USA 88: 8720-8724. Ward RH, Redd A, Valencia D, Frazier B, and Pääbo S (1993) Genetic and Linguistic Differentiation in the Americas. Proceedings of the National Academy of Sciences
USA 90: 10663-10667. Watson DF (1992) Contouring: A Guide to the Analysis and Display of Spatial Data. New York, USA: Pergamon Press. Watson DF, and Philips GM (1985) A Refinement of Inverse Distance Weighted Interpolation. Geo-Processing 2: 315-327. Watson E, Forster P, Richards M, and Bandelt H-J (1997) Mitochondrial Footprints of Human Expansions in Africa. American Journal of Human Genetics 61: 691-704. Watterson GA (1975) On the Number of Segregating Sites in Genetical Models without Recombination. Theoretical Population Biology 7: 256-276. Waxell S (1952) [1743] The American Expedition. Translated by Michael MA. London: William Hodge. White PS, Tatum OL, Deaven LL, and Longmire JL (1999) New, Male-Specific Microsatellite Markers from the Human Y Chromosome. Genomics 57: 433-437. Whitfield LS, Sulston JE, and Goodfellow PN (1995) Sequence Variation of the Human Y Chromosome. Nature 378: 379-380. Wilder JA, Kingan SB, Mobasher Z, Pilkington MM, and Hammer MF (2004) Global Patterns of Human Mitochondrial DNA and Y-Chromosome Structure are not Influenced by Higher Migration Rates of Females versus Males. Nature Genetics 36: 1122-1125. Williams RS (2002) Another Surprise from the Mitochondrial Genome. New
England Journal of Medicine 347: 609-612. Woodbury A (1984) Eskimo and Aleut Languages. In: Damas D (ed) Handbook of
North American Indians. Arctic, Volume 5. Washington, USA: Smithsonian Institution, pp 49-63. Wright S (1943) Isolation by Distance. Genetics 28: 114-138.
206
Wright S (1965) The Interpretation of Population Structure by F-Statistics with Special Regard to Systems of Mating. Evolution 19: 395-420. Xu X, Peng M, Fang Z, and Xu X (2000) The Direction of Microsatellite Mutations is Dependent upon Allele Length. Nature Genetics 24: 396-399. Yao Y-G, Kong Q-P, Bandelt H-J, Kivisild T, and Zhang Y-P (2002) Phylogeographic Differentiation of Mitochondrial DNA in Han Chinese. American
Journal of Human Genetics 70: 635-651. Y Chromosome Consortium (YCC) (2002) A Nomenclature System for the Tree of Human Y-Chromosomal Binary Haplogroups. Genome Research 12: 339-348. Zegura SL, Karafet TM, Zhivotovsky LA, and Hammer MF (2004) High-Resolution SNPs and Microsatellite Haplotypes Point to a Single, Recent Entry of Native American Y Chromosomes into the Americas. Molecular Biology and Evolution 21: 164-175. Zerjal T, Dashnyam B, Pandya A, Kayser M, Roewer L, Santos FR, Schiefenhovel W, Fretwell N, Jobling MA, Harihara S, Shimizu K, Semjidmaa D, Sajantila A, Salo P, Crawford MH, Ginter EK, Evgrafov OV, and Tyler-Smith C (1997) Genetic Relationships of Asians and Northern Europeans, Revealed by Y-Chromosomal DNA Analysis. American Journal of Human Genetics 60: 1174-1183. Zerjal T, Wells RS, Yuldasheva N, Ruzibakiev R, and Tyler-Smith C (2002) A Genetic Landscape Reshaped by Recent Events: Y-Chromosomal Insights into Central Asia. American Journal of Human Genetics 71: 466-482. Zhao X, Li N, Guo W, Hu X, Liu Z, Gong G, Wang A, Feng J, and Wu C (2004) Further Evidence for Paternal Inheritance of Mitochondrial DNA in the Sheep (Ovis aries). Heredity 93: 399-403. Zietkiewicz E, Yotova V, Jarnik M, Korab-Laskowska M, Kidd KK, Modiano D, Scozzari R, Stoneking M, Tishkoff S, Batzer M, and Labuda D (1998) Genetic Structure of the Ancestral Population of Modern Humans. Journal of Molecular
Evolution 47: 146-155. Zlojutro M (2006) Mitochondrial DNA Variation in Yakutia: The Genetic Structure of
an Expanding Population. Master’s thesis. University of Kansas. Zlojutro M, Rubicz R, Devor EJ, Spitsyn VA, Makarov SV, Wilson K, and Crawford MH (2006) Genetic Structure of the Aleuts and Circumpolar Populations Based on Mitochondrial DNA Sequences: A Synthesis. American Journal of Physical
Anthropology 129: 446-464.
207
Zlojutro M, Tarksaia LA, Sorensen M, Snodgrass JJ, Leonard WR, and Crawford MH (2008) Coalescent Simulations of Yakut mtDNA Variation Suggest Small Founding Population. Manuscript submitted to American Journal of Physical Anthropology.
208
APPENDIX A
Informed Consent Statement The Department of Anthropology at the University of Kansas supports the practice of protection for human subjects participating in research. The following information is provided for you to decide whether you wish to participate in the present study. You should be aware that even if you agree to participate, you are free to withdraw at any time without penalty. We are interested in reconstructing the origins and migrations of the Aleut people, using molecular genetic information. You will be participating in one session that should require a few minutes of your time. During that time you will asked about the geographic origins of your parents and two buccal smears, one on each side, will be taken. The buccal smear technique consists of a sterile wooden applicator being gently stroked across the cheeks and gums, followed by rinsing the mouth with distilled water. The DNA extracted from the buccal smears will be used solely to reconstruct the history of the Aleut people. Although participation will not directly benefit you, we believe that the information will be useful in revealing the origins of Aleut people and their connections to Siberian, Inuit, and Native American populations. All DNA will be used up in the analysis. Only personnel working directly on the Aleut project will have access to the DNA. Your participation is solicited although strictly voluntary. We assure you that your name will not be associated in any way with the research findings. The information will be identified only by a code number. If you would like additional information concerning this study before or after it is complete, please feel free to contact me by phone or mail. Sincerely, Michael H. Crawford, Ph.D. Principal Investigator Department of Anthropology University of Kansas, Lawrence, KS 66045 785-864-4170 ______________________________________________________ Signature of participant agreeing to participate With my signature I affirm that I am at least 18 years of age and have received a copy of the consent form.
209
APPENDIX B
Y-STR Multiplex PCR Mixtures and Thermalcycler Profiles Multiplex I: DYS385a/b, DYS390, DYS391 and DYS393 4.4 µL Flexi® PCR buffer 3.8 MgCl2 (25 mM) 1.0 dNTP mix 0.3 GoTaqTM polymerase 0.4 BSA 2.0 Primer mix (10 pmoles of each primer per µL) 5.7 ddH2O 4.4 Target DNA 22.0 µL Multiplex II: DYS19, DYS392, DYS438 and DYS439 3.6 µL Flexi® PCR buffer 3.1 MgCl2 (25 mM) 1.0 dNTP mix 0.3 GoTaqTM polymerase 0.3 BSA 2.0 Primer mix (10 pmoles of each primer per µL) 4.1 ddH2O 3.6 Target DNA 18.0 µL Multiplex III: DYS389I and DYS389II 3.6 µL Flexi® PCR buffer 3.1 MgCl2 (25 mM) 0.4 dNTP mix 0.2 GoTaqTM polymerase 0.3 BSA 0.8 Forward primer (10 pmoles per µL) 0.8 Reverse primer (10 pmoles per µL) 5.2 ddH2O 3.6 Target DNA 18.0 µL Thermalcycle Profile: Multiplex I 94°C for 3 minutes (1 cycle); 94°C for 30 seconds (35 cycles); 57°C for 30 seconds (35 cycles); 72°C for 30 seconds (35 cycles); 72°C for 3 minutes (1 cycle); and a hold at 4°C. Thermalcycle Profile: Multiplexes II and III 94°C for 3 minutes (1 cycle); 94°C for 25 seconds (35 cycles); 56°C for 30 seconds (35 cycles); 72°C for 30 seconds (35 cycles); 72°C for 3 minutes (1 cycle); and a hold at 4°C.