11


ii
TABLE OF CONTENT PREFACE ................................................................................................................................... i
TABLE OF CONTENT .............................................................................................................. ii
WELCOME SPEECH ............................................................................................................... iv
Welcome Message from Rector............................................................................................. v
Welcome Message from Dean.............................................................................................. vi
PROCEEDINGS ........................................................................................................................ 1
The Impact of COVID-19 Pandemic on Poultry Production: Challenges and Prospects
A. Jalaludeen and Stella Cyriac ............................................................................................. 2
Sustainability of Sheep and Goat Production in Asian Countries A. K.Thiruvenkadan and
J. Muralidharan ..................................................................................................................... 10
Electrical Conductivity of Milk: Measurement and Analysis of Mastitis Detection
Performance on Dairy Cattle T. E. Susilorini, G. Emerald, and Kuswati ............................ 21
Analysis of Critical Point Amplification of DNA Microsatellite of Capra hircus
D. Wulandari, I. L. Murtika, F. E. Wardani, A. Furqon, W. A. Septian, T. E. Susilorini and S.
Suyadi ................................................................................................................................... 27
Case Study of Critical Point on RFLP (Restriction Fragment Length Polymorphism)
F. E. Wardani, D. Wulandari, I. L. Murtika, A. Furqon, W. A. Septian, T. E. Susilorini, A.
Rachmawati and S. Suyadi .................................................................................................. 34
Observational Study on Critical Point of Polymerase Chain Reaction (PCR) Process of
Mitochondrial DNA I. L. Murtika, D. Wulandari, F. E. Wardani, A. Furqon, W.A. Septian,
T.E. Susilorini, and S. Suyadi .............................................................................................. 41
Estimation of Heritability for Body Weight Using Fullsib and Halfsib Method in Etawah
Grade Goat V. M. A. Nurgiartiningsih and C. Safina ........................................................... 46
5 Ways to Improve Farmer Management Skills of Joper Parent Stock in Berline Farm,
Ngajum, Malang M. H. Natsir, V. M. A. Nurgiartiningsih, O. Sjofjan, W. Firdaus, and Y. F.
Nuningtyas............................................................................................................................ 52
The Potential of Antioxidant Activity and the Characteristics of Fingerroot Extract
(Boesenbergia pandurata Roxb. Schlecht.) with Nanoencapsulation Technology N. N. N.
Nida, Z. Zuprizal and B. Ariyadi ........................................................................................... 56
Nutritional Content, Gross Energy and Density of Banana Corn Evaluation from
Nanotechnology and Re-binding as A Hybrid Duck Feeds O. Sjofjan, M. H. Natsir, Y. F.
Nuningtyas,E. A. Putra, and D. N. Adli ................................................................................ 62
The Effect of Corn Substitution with Re-Binding Banana Hump Flour in Feed on Internal
Organs, Abdominal Fat Percentage and Size of Caeca in Hybrid Ducks O. Sjofjan, M. H.
Natsir, Y. F. Nuningtyas, T. S. Wardani, and D. N. Adli ...................................................... 67
The Effect of Corn Substitution with Palm Kernel Meal with Addition of Enzyme Mananase
in Feed on Carcass Weight, Carcass Percentage, Pieces of Carcass Hybrid Ducks O.
Sjofjan, M. H. Natsir, Y. F. Nuningtyas, F. R. Amalia, and D. N. Adli ................................. 72

iii
Ruminal Degradation of Selected Local Feeds in Dairy Cattle Using In Sacco Techniques
A. Rosmalia, I.G. Permana, Despal, and R. Zahera ........................................................... 77
The Effect of Fresh Dayak Onion (Eleutherine palmifolia L. Merr) and Storage Time on
Rejected-Duck Nuggets N. Hidayat ..................................................................................... 83
Effect Ozonation on the Physicochemical and Penicillin-G Residues in Dairy Milk D.
Suprapto, L. E. Radiati, C. Mahdi, and H. Evanuarini ......................................................... 91
Extraction of Chicken Head Proteins and Evaluation of Their Functional Properties K. U. Al
Awwaly, I. Thohari, M. W. Apriliyani, and D. Amertaningtyas ............................................. 97
Water Requirements in Hydroponic and Aquaponic Maize Fodder Production Hermanto,
S. Chuzaemi, B. A. Nugroho and I. Subagiyo ................................................................... 103
The Fermentation Quality of Agricultural Waste-based Complete Feed Silage Treated with
Cellulase and its Effect on Productivity of Kacang Goats B. Santoso, T. W. Widayati, and
B. T. Hariadi ....................................................................................................................... 110
Indonesian Food Culture, Goat Satay: Nutritional Profile and Precursor Compounds of
Heterocyclic Aromatic Amine (HAA) Carcinogens D. Rosyidi, E. Saputro, L. E. Radiati and
W. Warsito .......................................................................................................................... 115

27
Analysis of Critical Point Amplification of DNA Microsatellite of Capra hircus
D. Wulandari1, I. L. Murtika2, F. E. Wardani2, A. Furqon2, W. A. Septian2, T. E. Susilorini2 and S. Suyadi2,*
1Department of Animal Reproduction and Breeding, Faculty of Animal Science, Universitas Brawijaya, Malang 65145, Indonesia
2Department of Animal Production, Faculty of Animal Science, Universitas Brawijaya, Malang 65145, Indonesia
*Corresponding email: [email protected]
Abstract Polymorphism Chain Reaction (PCR) is a revolution in molecular biology that produce substantial amounts of DNA from small amounts of genetic material. The final PCR product can be visualized using agarose gel which then goes through the electrophoresis stage. One DNA polymerization cycle is a complex process that requires the proper interaction of several components. The success of DNA amplification using PCR, among others, is influenced by the size of the primer length, the composition of the primer base, the concentration of DNA, the concentration of Mg ions, and the temperature of the primer hybridization. It’s important to know the critical points that influence DNA amplification in order to produce a good copies of DNA fragments. Key words: Polymorphism Chain Reaction (PCR), Primer, DNA Amplification
INTRODUCTION
Polymerase chain reaction (PCR) is one of the most commonly used methods in modern molecular biology. This technique was developed by Kary Mullis, in 1984. PCR is a simple process that can produce millions to billions of DNA copies from a small amount of DNA for sequencing, analysis and cloning [Vogel et al., 2012]. PCR begins with the denaturation process, the separation of two strands of DNA that are joined to each other (double helix) into two single DNA strands, then proceed with the annealing process, the attachment of a primer to the template DNA for the formation of nitrogenous bases and their partners, finally the extension process, the extension of nitrogen base formation from DNA template [Wahyudi. 2007].
PCR can be used for a series of molecular biology activities, one of which is to determine genetic diversity using microsatellites. Microsatellites are markers used on regions of DNA that show short repeating sequences. Microsatellites have been used to analyze genetic variation in cattle, sheep, pigs, goats, buffalo [Bowcock et al., 1994; Wimmers et al., 2000; Solis et al., 2005; Vicente et al., 2008]. DNA amplification for microsatellites analysis use a special primer recommended by the FAO (Food and Agriculture Organization). Primers are one of the factors for the success of the DNA amplification process using PCR.
The success of PCR is influenced by several factors, including DNA template, primer length size, primer base composition, DNA concentration, Mg ion concentration, primer hybridization temperature and PCR conditions [Suryanto. 2003; Sambrook and Russell, 2001]. In some cases, the amplification process are failed, so that the electrophoresis did not reveal any DNA fragments. Determination of the critical point in the PCR process is needed to increase the success of DNA amplification.

28
COMPONENTS OF DNA MICROSATELLITE AMPLIFICATION
There are several factors that affect the success of DNA microsatellite amplification
using PCR method, including: a. Nucleic acid (DNA template) The integrity and quality of DNA obtained will affect the amplification results. Nucleic Acid Extraction (NAE) is one of the first steps in amplification stage in molecular biology. NAE divided into four steps, consist: (i) cell disruption; (ii) removal of membrane proteins, lipids and other nucleic acids, (iii) DNA purification/binding from bulk; and (iv) DNA concentration [9]. Usually 0.1-1ng of template DNA is required for 0.1-1µg for genomic DNA, in a total reaction mixture of 50µl. DNA should be pure as even a trace amount of EDTA, phenol, Proteinase K, etc. [Singh et al., 2014]. b. Primer Primers in the PCR process has a function as fragment boundaries in DNA target amplification and provide the hydroxy (-OH) group at the 3 'end needed for the existence of DNA, means PCR primers define the target region to be amplified. The minimum primary length is 18 nucleotides by avoiding 4 or more G / C successively. The optimal melting temperature for primers is in the range of 52-58°C, primers with melting temperatures above 60°C have the potential for adhesion. The GC% provides information on annealing strength, primers should have a GC content of between 45 and 60 percent. Terminal 3 'position on the PCR primer is very important for miss-priming control. The primer should be more "sticky" at the 5"end than the 3" end, the 3"end which is sticky as indicated by its high GC content could potentially adhere to some template DNA sites. Primary cannot contain complementary in itself. The formula below can be used to estimate the melting temperature for oligonucleotides: Tm = 81.5 + 16.6 × (log10[Na+]) + 0.41 × (%G+C) – 675/n Explanation: [Na+] = the molar salt concentration n = number of bases in the oligonucleotide c. Taq DNA polymerase Taq DNA polymerase is isolated from Thermus aquaticus. Taq DNA polymerase will catalyzes in the 5′→3′ direction the primer-dependent incorporation of nucleotides into duplex in the presence of Mg2+. Taq DNA polymerase is suitable for PCR applications for detecting specific DNA sequences and to amplify PCR product of 5kb or less and between 5-10 kb. The error rate of Taq DNA polymerase approximately about 1×10⁻⁵ errors/base. d. Cycling Parameters The components of template DNA, primer, Taq DNA polymerase and Nucleas Free Water (NFW) are mixed in a test tube and then placed in a PCR machine that allow DNA amplification that occur in three basic steps. The machine is a thermal cycler that has a thermal block with holes for the test tubes holding the PCR reaction mixture are inserted. The PCR machine will raises and lowers the temperature as the programmed steps are set-up [Weier and Gray, 1988]. The first reaction solution is heated above the melting point of the two complementary DNA strands of the DNA target, which allows the double strands to separate, it called denaturation. Then, the lowered to allow the primers to bind to the DNA target segments, a process called annealing. Annealing between the DNA target and primers will occur if they are complementary in sequence (e.g., A binding to G). After that,
29
the temperature raised again, at this stage the DNA polymerase will adding nucleotides to the developing DNA strand to extend the primers. These three steps will be repeated based on the cycles that been already set up, usually 35 cycles [Does. 2013].
Figure 1. PCR Principle
Source : (http://schoolworkhelper.net/pcr-uses-steps-purpose) e. Electrophoresis Agarose gel electrophoresis is a method commonly used to separate protein, DNA or RNA molecules. The nucleic acid molecules in agarose media are separated in size with the help of an electric field where negatively charged molecules migrate towards the anode (positive) poles. Electrophoretic conditions are characterized by the electrical parameters (current, voltage, power), and factors such as pH value, ionic strength, pore size, viscosity, etc., which describe the medium in which the particles are moving. Gel electrophoresis is zone electrophoresis in a chemically inert gel matrix, such as polyacrylamide or agarose. Agarose is a highly purified polysaccharide derived from agar, a natural product of red seaweed.
Figure 2. Electrophoresis
Source : Westermeier [2005]
RESULTS AND DISSCUSION Amplified DNA
There are three main steps in DNA extraction, consist destruction of the cell wall (lysis), separation of DNA from solid materials such as cellulose and protein, and DNA purification. Through this process DNA is separated from other cellular components such as protein, RNA (Riboxy nucleic acid), and fat. DNA that is less pure and inaccurate dilution will cause the primer not sticking to the DNA target, so that the three basic concepts that must be done are opening the cell in the sample to excrete its nucleic acid, separating the nucleic acid from other cell components, and purifying the nucleic acid [Yusdiana. 2008].
PCR utilizes DNA replication with the help of primers that flank certain areas and temperature optimization to obtain optimal PCR conditions so that a specific PCR product is

30
produced, which is will form of a thick DNA band. The optimization of the PCR process can be done by varying the conditions used in the PCR process. Optimization of conditions is closely related to factors such as the type of DNA polymerase; temperature; concentration, in this case related to dNTPs, MgCl2 and DNA polymerase; PCR buffer and time. Muladno [2010] states that PCR is a reaction that doubles the number of DNA molecules on a specific target by synthesizing new DNA molecules that complement the target DNA. The PCR product to be amplified comes from the results of total DNA extraction.
The success of DNA fragment amplification is influenced by several factors, including DNA template, primer, polymerase enzyme, PCR buffer, MgCl2, temperature, time and number of cycles [Sambrook and Russel. 2001]. Figure 3. does not show any DNA bands formed when visualizing the results of PCR products, this can be happen because the annealing temperature is not suitable for the primer so that the PCR amplification process is not successful. Hsu et al. [1996] stated that the temperature of the primer attachment does not exceed or less than the temperature of the primer association, by not attaching the primer, the polymerase enzyme cannot catalyze the installation of the complement nitrogen base that is present in the reagent into the DNA template which is ultimately not will form new DNA.
Figure 3. Blank DNA Fragment
Source: Personal Documentation
The blank of DNA bands during visualization can be influenced by several possible causes, including poor primer design, insufficient primer concentration and contamination of reaction tubes or solutions. The solution for these problem; 1) poor primary design can be solved by increase of length of primer and verify that primers are non-complementary. 2) insufficient primary concentration, primary concentration can range from 0.05 until 1 µM in the reaction, so verify that the concentration is between the range, not too low or high. 3) Contamination can be solved by autoclave the tubes to eliminate the biological inhibitor and use new reagent/solution. There were several cases where when the primer concentration was improved and the annealing time was increased, the PCR results still did not show any DNA fragments so that it was assumed that the concentration of the template DNA sample was less than 50 ng. This can be corrected by reprocessing the PCR product, where the PCR product is used as a sample and then added with a premix (Taq polymerase, Nucleas Free Water and primer) then put into the PCR machine with the same machine condition as before. The repetition of the PCR product is assumed that the amplification result will be doubled from the previous one (235) so that the probability of DNA fragments appearing is higher.
31
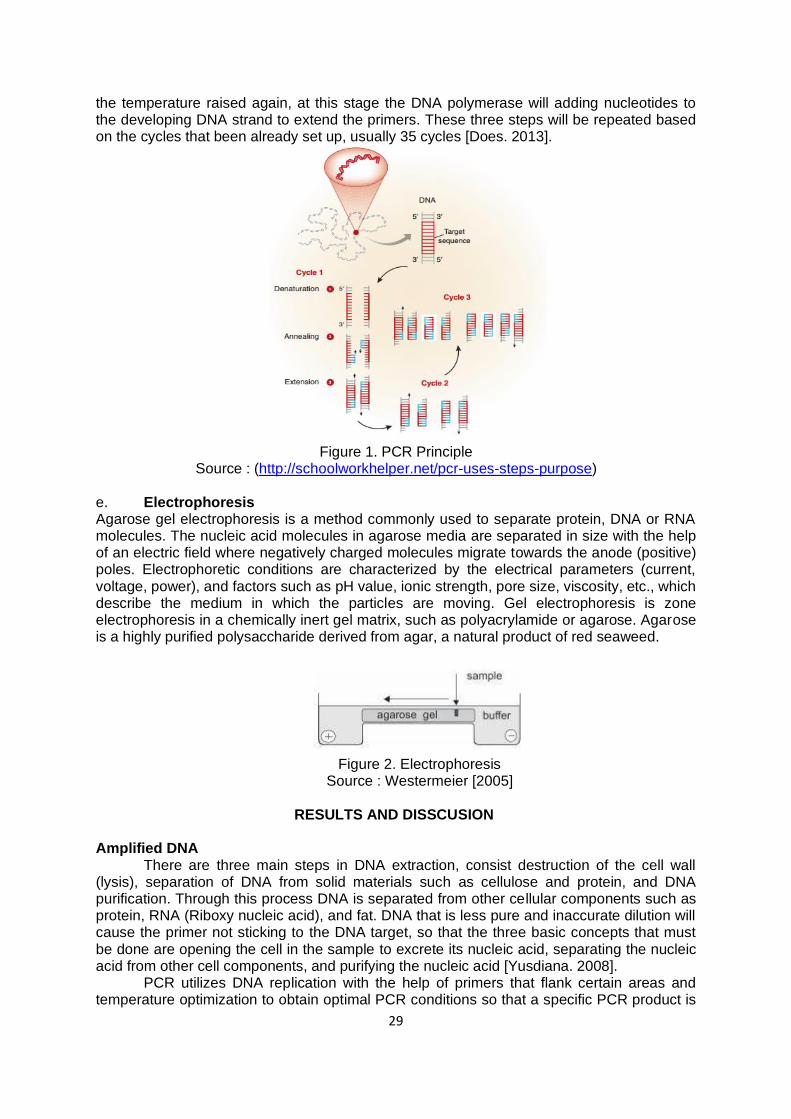
Figure 4. Smear DNA Fragment Source: Personal Documentation
Figure 4. shows the DNA bands results in the presence of a smear, this is due to the
amplification process that forms non-target DNA. The problem of non-target DNA which is indicated by the presence of additional fragments that differ in size from the target DNA fragments can be overcome by increasing the annealing temperature and using longer primers so that the length of the primer, the specificity is quite good [Erlich. 1989].
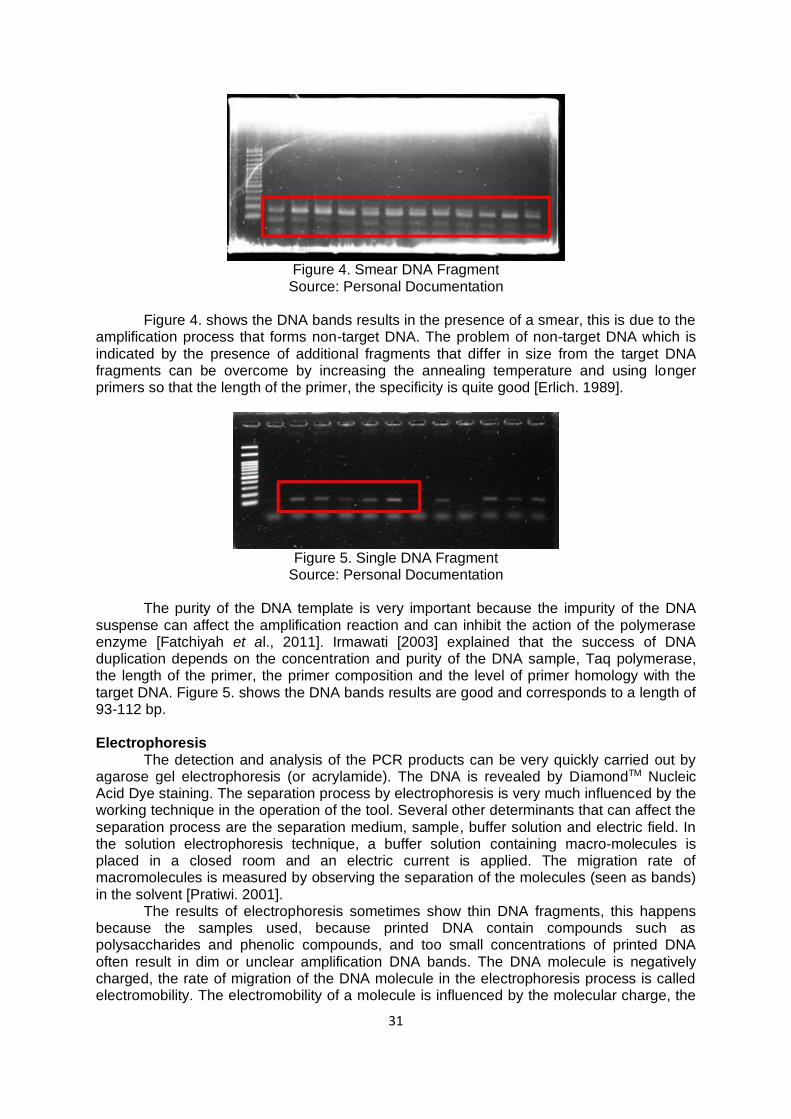
Figure 5. Single DNA Fragment
Source: Personal Documentation
The purity of the DNA template is very important because the impurity of the DNA suspense can affect the amplification reaction and can inhibit the action of the polymerase enzyme [Fatchiyah et al., 2011]. Irmawati [2003] explained that the success of DNA duplication depends on the concentration and purity of the DNA sample, Taq polymerase, the length of the primer, the primer composition and the level of primer homology with the target DNA. Figure 5. shows the DNA bands results are good and corresponds to a length of 93-112 bp.
Electrophoresis
The detection and analysis of the PCR products can be very quickly carried out by agarose gel electrophoresis (or acrylamide). The DNA is revealed by DiamondTM Nucleic Acid Dye staining. The separation process by electrophoresis is very much influenced by the working technique in the operation of the tool. Several other determinants that can affect the separation process are the separation medium, sample, buffer solution and electric field. In the solution electrophoresis technique, a buffer solution containing macro-molecules is placed in a closed room and an electric current is applied. The migration rate of macromolecules is measured by observing the separation of the molecules (seen as bands) in the solvent [Pratiwi. 2001].
The results of electrophoresis sometimes show thin DNA fragments, this happens because the samples used, because printed DNA contain compounds such as polysaccharides and phenolic compounds, and too small concentrations of printed DNA often result in dim or unclear amplification DNA bands. The DNA molecule is negatively charged, the rate of migration of the DNA molecule in the electrophoresis process is called electromobility. The electromobility of a molecule is influenced by the molecular charge, the

32
greater the charge of the molecule, the greater the electromobility. However, the electromobility value is inversely related to the molecular size.
Other factors that influence electrophoresis are media (agarose gel), buffer solution (Tris Borat EDTA buffer) and electric field. Buffer solutions can affect the velocity of compounds due to their composition, pH and concentration. Agarose gels are much elastic than polyacrylamide gels so easily to torn and required careful handling. The buffer composition must not bind the compounds to be separated because it will affect the speed of separation of molecules. The buffer concentration must be stable, if the ion buffer concentration increases it will cause the electric current carried by the sample to decrease, thus slowing down its motion. The components that affect the electric field in electrophoresis are voltage, electric current and resistance [Hendayana. 2006].
CONCLUSION
PCR is technique that amplified specific DNA fragment into billions copies. The process sometimes lead to no amplified DNA or fragment errors (smear/thin) due to several factors including DNA template (referring to DNA purity without other substances), primer (primer design should meet the standards), the condition of machine for PCR (time, cycle and annealing temperature). In electrophoresis, the errors due to the sample (DNA purity), media, buffer and electric field. So that, when do the DNA amplification, must pay attention to these several factors in order to produce a good DNA amplification.
REFERENCES
Bowcock, A.M., Ruiz-Linares, A., Tomfohrde, J., Minch, E., Kidd, J.R., & CavalliSforz, L.L., (1994). High Resolution of Human Evolutionary Trees with Polymorphic Microsatellites. Nature 368, 455–457.
Does, W. P. (2013). Polymerase chain reaction. Journal of Investigative Dermatology, 133. Erlich, H.A. (1989). PCR Technology: principle and Application for DNA. Fatchiyah., E. Laras., S. Widyawarti., & S. Rahayu. (2011). Molecular Biology: Basic
Principles of Analysis. Jakarta : Erlangga Hendayana, S. (2006). Chemical Separation of Modern Chromatography and
Electrophoresis Methods. Jakarta: PT. Remaja Rosdakarya Hsu, J.T., S. Das dan Satish. (1996). Polymerase Chain Reaction Engineering.
Bhiopharmacertical of Chemical Engineering. Bethlehem: Lehigh University. Irmawati. (2003). Changes in Genetic Diversity of 1st Generation Grouper Rat in Hatchery
Stocks. Thesis. Bogor: IPB Muladno. (2010). Genetic Engineering Technology Second Edition. Bogor: IPB Press. Pratiwi, R. (2001). Get to know the electrophoresis method. Oseana, 26(1), 25-31. S. Goldberg. (2008). “Mechanical/physical methods of cell distributionand tissue
homogenization,” Methods in Molecular Biology.1(424): pp 3–22. Sambrook, J., & D. W .Russell. (2001). Molecular Clonning: A Laboratory Manual. 3th ed.
Cold Spring Harbor Laboratory Press. Book 1&2. Singh, J., Birbian, N., Sinha, S., & Goswami, A. (2014). A Critical Review on PCR, its Types
and Applications. Int. J. Adv. Res. Biol. Sci, 1(7), 65-80. Solis, A., Jugo, B.M., Meriaux, J.C., Iriondo, M., Mazon, L.I., Aguirre, A.I.,Vicario, A., &
Estomba, A. (2005). Genetic diversity within and among four south European native horse breeds based on microsatellite DNA analysis: implications for conservation. J. Hered. 96, 670–678.
St. Rosemary Educational Institution (http://schoolworkhelper.net/pcr-uses-steps-purpose) Suryanto, D. (2003). Seeing the Diversity of Organisms through Several Molecular Genetic
Techniques. USU Digital Library.

33
Vicente, A.A., Carolino, M.I., Sousa, M.C.O., Ginja, C., Silva, F.S., Martinez,A.M., Vega-Pla, J.L., Carolino, N., & Gama, L.T. (2008). Genetic Diversity in Native and Commercial Breeds of Pigs in Portugal Assessed By Microsatellites. J. Anim. Sci. 86, 2496–2507.
Vogel J., Yee C., & Darling J. (2012). Molecular biology. In: Bolognia J, Jorizzo J, Rapini R (eds) Dermatology, 3rd edn. Elsevier: Philadelphia, PA, 65–79.
Wahyudi, T.H. (2007). The Effect of Annealing Temperature and the Number of Different Cycles on the PCR Program on the Success of the Isolation and Amplification of Patin Fish mtDNA. Skripsi. Bogor:ITB
Weier HU, Gray JW (1988) A Programmable System to Perform The Polymerase Chain Reaction. DNA.7:441–7.
Westeimer, R. (2005). Electrophoresis in Practice: A Guide to Methods and Applications of DNA and Protein Separations, Fourth, revised and enlarged Edition. Germany: Wiley-VCH
Wimmers, K., Ponsuksili, S., Hardge, T., Valle-Zarate, A., Mathur, P.K., & Horst, P. (2000). Genetic Distinctness of African. Asian and South American Local Chickens. Anim. Genet. 31, 159–165.
Yusdiana. (2008). Characterization of Five Provenances of Bitti (Vitex cofassus Reinw.) In South Sulawesi. Hasanuddin University. Makassar (Unpublished).

126


