Accepted 9 February; published on WWW 24 March 1998
yll,
The oxygen affinity of the enzyme system involved inmitochondrial respiration indicates, in relation tointracellular oxygen levels and interpreted with the aid offlux control analysis, a significant role of oxygen supply inlimiting maximum exercise. This implies that the fluxcontrol coefficient of mitochondria is not excessively high,based on a capacity of mitochondrial oxygen consumptionthat is slightly higher than the capacity for oxygen supplythrough the respiratory cascade. Close matching of thecapacities and distribution of flux control is consistent withthe concept of symmorphosis. Within the respiratory chain,however, the large excess capacity of cytochrome c oxidase,COX, appears to be inconsistent with the economic designof the respiratory cascade. To address this apparentdiscrepancy, we used three model systems: culturedendothelial cells and mitochondria isolated from heart andliver. Intracellular oxygen gradients increase with oxygenflux, explaining part of the observed decrease in oxygenaffinity with increasing metabolic rate in cells. In addition,mitochondrial oxygen affinities decrease from the resting
to the active state. The oxygen affinity in the active ADP-stimulated state is higher in mitochondria from heart thanin those from liver, in direct relationship to the higherexcess capacity of COX in heart. This yields, in turn, alower turnover rate of COX even at maximum flux throughthe respiratory chain, which is necessary to prevent a largedecrease in oxygen affinity in the active state. Up-regulation of oxygen affinity provides a functionalexplanation of the excess capacity of COX. The concept ofsymmorphosis, a matching of capacities in the respiratorycascade, is therefore complemented by ‘synkinetic’considerations on optimum enzyme ratios in therespiratory chain. Accordingly, enzymatic capacities arematched in terms of optimum ratios, rather than equallevels, to meet the specific kinetic and thermodynamicdemands set by the low-oxygen environment in the cell.
The mitochondrial respiratory chain fulfils the kinetically anthermodynamically complex tasks of (1) catalysing a hielectron flux to oxygen in active metabolic states and pumping protons at high efficiency as a basis for intense aerATP production. Moreover, these functions must be (performed at low intracellular oxygen pressure, which requia high affinity for oxygen (Babcock and Wikström, 1992).
Oxygen in the environment is globally stable whemeasured at the scale of generations, but varies locally andbecome limiting under diverse environmental anphysiological conditions. Respiration of all organisms isfunction of the partial pressure of oxygen, PO∑, below a criticalenvironmental oxygen pressure, depending on the structand functional capacities and regulatory mechanisms atsteps of the respiratory cascade (Fig. 1). The form of oxygen-dependence varies among species and may
Respiratory cascade to respiratory chain
dgh(2)obic3)res
n mayd
a
ural allthe be
complex, yet a surprisingly simple hyperbolic equatiodescribes the flux/pressure relationship in some cases (Gnai1993a). The rectangular hyperbolic equation with an intercethrough the origin:
where JO∑ is oxygen flux, is characterised by two parameterP50, the oxygen partial pressure at which respiratory flux 50 % of maximum, and Jmax, the maximum oxygen flux, atsaturating oxygen levels. Jmax is a function of metabolic state.At maximum aerobic power, the corresponding Jmax may beestimated approximately at a plateau of non-limiting, possibhyperoxic, oxygen pressures greater than 20 kPa. Differenin JO∑ of a few per cent are usually within experimental errobut might be important indications that oxygen saturation
JO2 = –––––––––– ,P50 + PO2
Jmax × PO2 (1)
1130
tode
rytheryic
ory
he
offnt
of
of
DPytic
E. GNAIGER AND OTHERS
nearly but not fully reached. Accurate determination of Jmax,therefore, requires statistical evaluation over the entire ranof oxygen concentration. This is not a simple task in athleor animal models at maximum levels of exercise (Chanceetal. 1985; Wagner, 1996).
When studying the respiration of isolated cells, the mapathway for oxygen from the environment along threspiratory cascade (Weibel, 1984) is removed (Fig. 1), andrelevant PO∑ range is reduced from more than 20 to 1 kPa. tumour vessels, for instance, in vivo PO∑ values as low as0.7 kPa are not hypoxic (Helmlinger et al. 1997). Under thesimpler conditions for oxygen transport from extracellular PO∑
to the terminal oxidase, a hyperbolic oxygen-dependen(equation 1) is more generally observed (for a review, sGnaiger et al. 1995), despite the remaining complexities ointracellular oxygen gradients and heterogeneities of lipid aaqueous phases and mitochondrial clusters (Fig. 2).
A further shortcut for oxygen delivery to the actual site conversion of oxygen to water is afforded by the study isolated mitochondria. A myoglobin saturation oapproximately 50 % is typical for the volume-averageintracellular oxygen pressure in heart and skeletal musccorresponding to 0.3 kPa (2 mmHg, 3µmol l−1; Wittenberg andWittenberg, 1989; Wagner, 1996). In the physiologicalrelevant intracellular PO∑ range below 1 kPa, respiration canagain be described by a hyperbolic function. Measureme
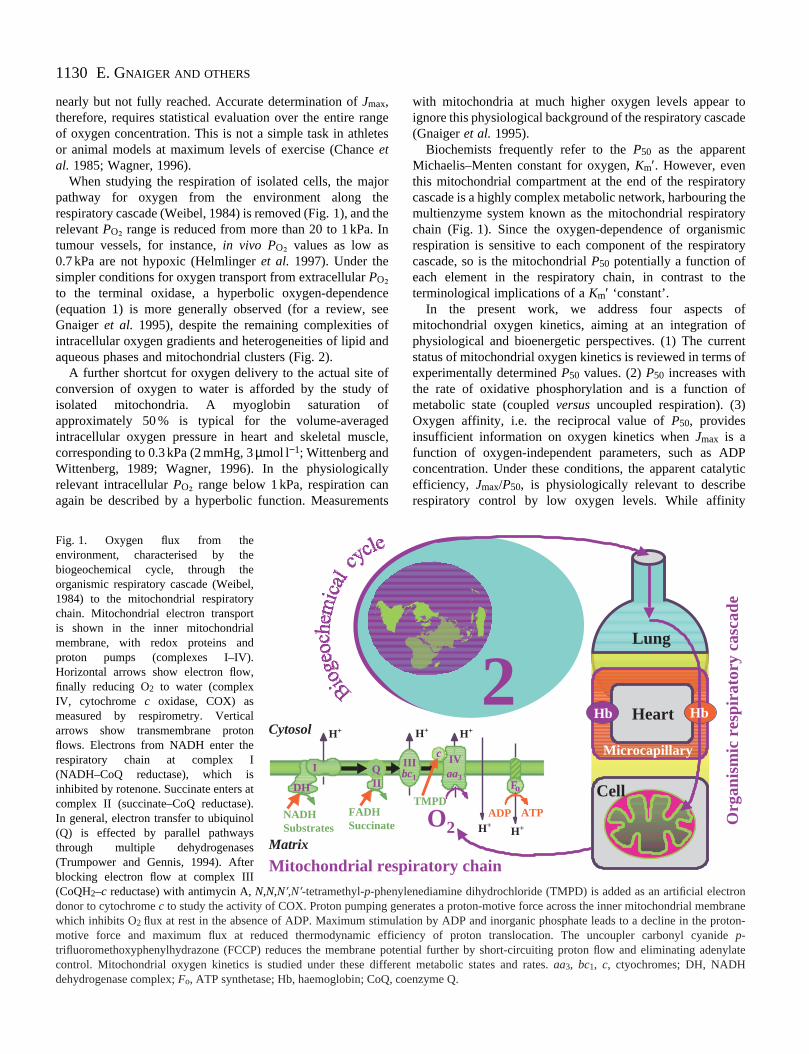
Fig. 1. Oxygen flux from theenvironment, characterised by thebiogeochemical cycle, through theorganismic respiratory cascade (Weibel,1984) to the mitochondrial respiratorychain. Mitochondrial electron transportis shown in the inner mitochondrialmembrane, with redox proteins andproton pumps (complexes I–IV).Horizontal arrows show electron flow,finally reducing O2 to water (complexIV, cytochrome c oxidase, COX) asmeasured by respirometry. Verticalarrows show transmembrane protonflows. Electrons from NADH enter therespiratory chain at complex I(NADH–CoQ reductase), which isinhibited by rotenone. Succinate enters atcomplex II (succinate–CoQ reductase).In general, electron transfer to ubiquinol(Q) is effected by parallel pathwaysthrough multiple dehydrogenases(Trumpower and Gennis, 1994). Afterblocking electron flow at complex III(CoQH2–c reductase) with antimycin A, N,N,N′,N′-tetramethyl-p-phendonor to cytochrome cto study the activity of COX. Proton pumpingwhich inhibits O2 flux at rest in the absence of ADP. Maximum stimmotive force and maximum flux at reduced thermodynamic trifluoromethoxyphenylhydrazone (FCCP) reduces the membrancontrol. Mitochondrial oxygen kinetics is studied under these ddehydrogenase complex; Fo, ATP synthetase; Hb, haemoglobin; CoQ
FADHSuccinate
Matrix
Cytosol
DH
NADHSubstrates
Q
Mitochondrial resp
III
H+
getes
jore
theIn
ceeefnd
ofoffdle,
ly
nts
with mitochondria at much higher oxygen levels appear ignore this physiological background of the respiratory casca(Gnaiger et al.1995).
Biochemists frequently refer to the P50 as the apparentMichaelis–Menten constant for oxygen, Km′. However, eventhis mitochondrial compartment at the end of the respiratocascade is a highly complex metabolic network, harbouring multienzyme system known as the mitochondrial respiratochain (Fig. 1). Since the oxygen-dependence of organismrespiration is sensitive to each component of the respiratcascade, so is the mitochondrial P50 potentially a function ofeach element in the respiratory chain, in contrast to tterminological implications of a Km′ ‘constant’.
In the present work, we address four aspects mitochondrial oxygen kinetics, aiming at an integration ophysiological and bioenergetic perspectives. (1) The currestatus of mitochondrial oxygen kinetics is reviewed in termsexperimentally determined P50 values. (2) P50 increases withthe rate of oxidative phosphorylation and is a function metabolic state (coupled versusuncoupled respiration). (3)Oxygen affinity, i.e. the reciprocal value of P50, providesinsufficient information on oxygen kinetics when Jmax is afunction of oxygen-independent parameters, such as Aconcentration. Under these conditions, the apparent catalefficiency, Jmax/P50, is physiologically relevant to describerespiratory control by low oxygen levels. While affinity
ylenediamine dihydrochloride (TMPD) is added as an artificial electron generates a proton-motive force across the inner mitochondrial membrane
ulation by ADP and inorganic phosphate leads to a decline in the proton-efficiency of proton translocation. The uncoupler carbonyl cyanide p-e potential further by short-circuiting proton flow and eliminating adenylateifferent metabolic states and rates. aa3, bc1, c, ctyochromes; DH, NADH, coenzyme Q.
HbHb
ATPADP
IIIc
bc1Fo
IVaa3
O2 H+H+
TMPD
2O
rgan
ism
ic r
espi
rato
ry c
asca
de
iratory chain
Lung
Heart
Microcapillary
Cell
H+H+
1131Respiratory flux control and COX
rym
A
B
s
l
l ls
n
n
Fig. 2. Ultrastructure of human umbilical vein endothelial cells (HUVECs) suspended in endothelial culture medium. (A) The spherical cellsshow large lobate nuclei (n) and a correspondingly uneven distribution of mitochondria (arrowheads). Cell extensions (lamellipodia, l) areretracted to varying degrees and some microspikes (s) are always present. Extensions frequently contain rough endoplasmic reticulum cisternae(small arrows) and occasionally contain mitochondria. Scale bar, 5µm. (B) Elongate mitochondria (arrowheads) with regularly arrangedlamelliform cristae and medium-dense matrix. Mitochondria are closely associated with the network of rough endoplasmic reticulum (smallarrows). The numerous Weibel–Palade bodies (large arrows) are of similar size to mitochondria. Scale bar, 1µm. Cells were fixed by injectingglutaraldehyde into a sample taken from the stirred oxygraph chamber (2.5 % final concentration, for 90 min at 4 °C). After centrifugation, thepellet was washed and resuspended in agar. The hardened agar pellet was cut into small pieces for post-fixation in 2 % OsO4 (0.05 mol l−1
sodium cacodylate buffer, 60 min) and serial dehydration. Thin sections were stained with saturated aqueous uranyl acetate and lead citrate andexamined using a Zeiss 902 transmission electron microscope.
decreases, the apparent catalytic efficiency increases fromresting to the active state and increases in general as thermodynamic efficiency of energy conversion decreasThis analysis sets the stage for (4) a discussion of the oxykinetics of the mitochondrial respiratory chain in relation to thorganismic respiratory cascade (Fig. 1), with reference to
thethe
es.gene
the
concept of symmorphosis (Weibel et al. 1991). The excesscapacity of cytochrome coxidase (COX) relative to thecapacity of the integrated respiratory chain and respiratocascade is functionally explained as a regulatory mechanisfor maintaining a high oxygen affinity by a COX turnover ratethat is low even at maximum aerobic performance.
1132
xtheeeel,
r
c
eea
d
fornd%
a
te-
w
E. GNAIGER AND OTHERS
Oxygen affinity and metabolic state/rateThe conflicting views on the role of oxygen in respirato
control are mainly due to uncertainties about intracellugradients and levels of oxygen in the mitochondrimicroenvironment and to the difficulties of making respiratomeasurements at the corresponding low oxygen concentrat(Gnaiger et al. 1995). Is intracellular PO∑ limiting underphysiological conditions? Negative answers to this importaquestion refer to a value for P50 for mitochondrial respirationof 0.005 kPa, which is nearly 100 times below intracelluloxygen levels (Cole et al. 1982; Gayeski and Honig, 1991Wittenberg and Wittenberg, 1985), whereas an affirmatirelates to more recent data on P50 values that are less than onetenth of intracellular PO∑ (Wilson et al. 1988; Rumsey et al.1990; Gnaiger et al. 1995). Up to 30-fold differences in P50
reported for mitochondrial respiration continue to separopposing views on the role of intracellular oxygen respiratory control and require resolution.
Intracellular oxygen gradients and mitochondrial oxygenkinetics
The study of the oxygen kinetics of isolated cells offethe advantage of observing mitochondrial function largeundisturbed in the intracellular environment (Fig. 2). Aexperimental example with endothelial cells is shown Fig. 3. By selecting appropriate cell densities, the transitfrom kinetic oxygen saturation to anoxia is sufficiently fato eliminate effects that are unrelated to the regulation of flby oxygen in the physiological range, without compromisinthe requirement to obtain a large number of data points durthe transition (Fig. 3, inset). Continuous measurement inclosed system offers the advantage of a high density of dpoints but presents the problem of a non-steady-state procA quasi-steady state may be realised at each point durin
Time (min)10 15 20 25
0
40
80
120
24 25 26 270
5
10
O2
conc
entr
atio
n, C
O2
(nm
ol c
m−3
)
0
25
50
75
100
CO2
JO2
JO2
CO2
0
40
80
120
O2
flux
, JO
2 (p
mol
s−1
cm
−3)
Fig. 3. Experimental records of oxygen concentration, CO∑
(µmol l−1=nmol cm−3), and oxygen flux, JO∑ (pmol s−1cm−3), as afunction of time. Endothelial cells at a density of 2.9×106cm−3 werestudied in the 2 cm3 closed Oroboros oxygraph chamber (37 °CInset: low oxygen range (10µmol l−1=1 kPa) and the aerobic–anoxitransition relevant for oxygen kinetics. Each symbol for flurepresents one data point.
rylaralryions
nt
ar;on-
atein
rslynin
ionstuxging aataess.g a
sufficiently slow transition (Fig. 3), such that externallymeasured oxygen flux is equal to intracellular diffusional fluand equal to all enzyme-catalysed reaction rates along respiratory chain (Fig. 1). Hyperbolic oxygen flux/pressurrelationships were obtained by non-linear fitting in thoxygen range below 1.1 kPa (Fig. 4; equation 1). Thdistribution of residuals provides a powerful statisticaevaluation (Cornish-Bowden, 1995), both in cells (Fig. 4inset) and in isolated mitochondria (Gnaiger et al.1995,1998). In contrast, Petersen et al. (1974) show double-reciprocal plots of the oxygen kinetics of isolated rat livemitochondria in the range below 1µmol l−1 O2 (<0.1 kPa),yielding non-linear (non-hyperbolic) patterns in all metabolistates. Their method (P50 varies with enzyme concentration;Petersen et al. 1976), the narrow oxygen range and thdouble-reciprocal Lineweaver–Burk plots appear to binadequate for a statistical test of deviations from hyperbolic relationship (Cornish-Bowden, 1995).
Interpretation of the oxygen affinity of intact cells iscomplex owing to the diversity of metabolic states andifficulties in quantification of intracellular oxygen gradients(Jones, 1986; Wittenberg and Wittenberg, 1989; Rumsey et al.1990). Suspended endothelial cells provide a good model the study of oxygen kinetics because of their small size aregular shape (Fig. 2). Their respiratory rate is 95mitochondrial (Steinlechner-Maran et al. 1996). The increasein cellular P50 with maximum respiratory rate per cell(=oxygen flow, IO∑; Gnaiger, 1993b) is caused by intracellularoxygen gradients, which increase with oxygen flow, and bychange in mitochondrial P50 (Fig. 5). Separation of theseinterdependent factors is achieved by a comparison of the radependence of P50 in identical ranges of oxygen flow incoupled and uncoupled/inhibited cells (Fig. 5). The shalloslope of P50 as a function of oxygen-saturated flow, Imax, in the
).cx
O2
flux
, JO
2 (p
mol
s−1
cm
−3)
0 0.2 0.4 0.6 0.8 1.00
40
80
120
Oxygen pressure, PO2 (kPa)
0 0.5 1.0
−20
0
20
Res
idua
ls
Fig. 4. Oxygen flux, JO∑, plotted as a function of oxygen pressure,PO∑ (data from Fig. 2, inset). Solid line, hyperbolic fit(P50=0.06 kPa=0.5 mmHg=0.6µmol l−1). Large circles, original data;small circles, smoothed data. Oscillations in the original data areinstrumental; smoothing shifts the hyperbolic function to the right,with a higher apparent P50. Inset: residuals of the hyperbolicregression, validating the hyperbolic function.
1133Respiratory flux control and COX
ng
o
ione
xofl
ey
,
er-
oncin
r,
he
in
e
no
the
d
0 20 40 600
0.02
0.04
0.06
0.08
Uncoupled/inhibited
Coupled
P50
(kP
a)
Imax (pmol s−1 10−6 cells)
Fig. 5. P50 (kPa) as a function of maximum oxygen flow, Imax
(pmol s−110−6cells), in endothelial cells in coupled (filled circlesolid line) and in uncoupled/inhibited states (>4µmol l−1 FCCP; opencircles, dashed line) in experiments with up to five anoxic expos(3 min) and partial re-oxygenations. Regression for coupled cy=0.0127+0.00140x; r=0.711, P<0.0001; and for uncoupled/inhibitecells: y=0.0092+0.00039x; r=0.773, P<0.0032. 95 % confidenceintervals are also shown. Comparison of slopes in an identical rof maximum oxygen flow provides a basis for the separation ofeffects of state and rate on P50. A shallow slope for the relationshipbetween P50 and oxygen flow indicates a minor influence intracellular diffusion gradients (modified after Steinlechner-Maet al.1996).
uncoupled/inhibited state indicates that intracellular oxyggradients are small. The difference between the slopescoupled and uncoupled/inhibited cells, therefore, can interpreted as the diffusion-independent mitochondrial P50
(Table 1). The lower P50 in uncoupled cells emphasises thimportance of metabolic state in the regulation of P50
(Steinlechner-Maran et al.1996). A direct test is required withisolated mitochondria.
Fact and artefact
It is becoming increasingly clear that various potentartefacts are confounding factors in mitochondrial oxygkinetics. These include oxygen gradients in the respiromeback-diffusion of oxygen from Teflon stirrers, Perspechambers and inappropriate sealing materials, the sensitivity of oxygen sensors and insufficient time resolutioThese limitations are resolved in high-resolution respiromebased on the Oroboros oxygraph and DatLab softw(Oroboros, Innsbruck, Austria) and on rigorous tests instrumental background, correction for the exponential timconstant of the sensor (3–6 s) and internal calibration of the zoxygen signal (Gnaiger et al.1995, 1998). The contribution ofinstrumental artefacts changes with mitochondrconcentration and activation state. Unfortunately, only festudies report adequate methodological tests.
en ofbe
e
ialenter,x
lown.
try,areofe
ero
ialw
Instrumental background oxygen flux over the experimentaloxygen range (Gnaiger et al.1995)
Background measurements yield the change in oxygeconcentration over time in the closed system containinincubation medium without biological material. Backgroundoxygen flux results from oxygen consumption by thepolarographic oxygen sensor, which is directly proportional tPO∑, and back-diffusion of oxygen into the medium at decliningoxygen levels, which is proportional to the PO∑ differencebetween the oxygen source and the medium. Gradual depletof the oxygen source gives rise to a hysteresis effect. Thoverall background flux is a near-linear function of oxygenconcentration, which is subtracted from the experimental fluat each point of oxygen measurement. A sampling interval 1 s is appropriate. In addition, occasional microbiacontamination is detected by careful background tests.
Independence of P50 from concentrations of cells,mitochondria or enzymes at constant metabolic state (Rumset al.1990; Steinlechner-Maran et al.1996; Gnaiger et al.1998)
Oxygen flux per volume of the oxygraph chamber, JO∑,V
(pmol s−1cm−3=nmol l−1s−1), is a function of specificrespiratory activity and the concentration of mitochondriacells or enzyme(s). JO∑,V increases proportionally with enzymeconcentration. In contrast, P50 must be constant, except if (i)concentration exerts an effect on metabolic state (SteinlechnMaran et al. 1996), (ii) the varying aerobic–hypoxic–anoxictransition time influences compensatory processes (Wilson etal. 1988) or (iii) different instrumental artefacts are sensitiveto different levels of JO∑,V, particularly the time resolution, thenumber of data points obtained in the oxygen-dependent regiand the ratio of uncorrected background flux to metabolioxygen flux. We tested our system for concentration effects the JO∑,V range 20–500 pmol s−1cm−3 at a chamber volume of2 cm3, and observed no significant differences in P50 at variousmitochondrial dilutions. At higher volume-specific fluxes,erroneously high P50 values were obtained (Gnaiger et al.1998; B. Lassnig, A. Kuznetsov, R. Margreiter and E. Gnaigein preparation).
Oxygen gradients from a gas–aqueous boundary layer to toxygen sensor yield low apparent P50 values. This artefactmight explain the low P50 of 0.005 kPa in active skeletalmuscle mitochondria at high protein concentration(10 mg cm−3; Cole et al.1982) in comparison with the value of0.015 kPa observed on the basis of intracellular myoglobsaturation in resting cardiomyocytes (Wittenberg andWittenberg, 1985). The latter value agrees closely with thvalue of 0.025 kPa for skeletal muscle mitochondriadetermined by high-resolution respirometry (Gnaiger et al.1995) and of 0.008 kPa for passive heart mitochondria (Sugaet al.1974). Although Sugano et al.(1974) used a gas–aqueoustransfer system, the low mitochondrial density of 0.2 mg cm−3
and the spatially dispersed bioluminescence probe reduced interference by oxygen gradients. A higher P50 of 0.04 kPa wasobtained for passive heart mitochondria in a close
s,
uresells:d
ange the
ofran
1134
at
nt,hee.
lic
be
hat
rt a
ent,iaer
E. GNAIGER AND OTHERS
Table 1.Mitochondrial P50 in passive and active states, with substrates for complexes I or II
P50 (kPa)a TemperatureSource Passive Active (°C) Reference
Heartb 0.008 0.08 25 Sugano et al. (1974)0.015c − 30 Wittenberg and Wittenberg (1985)0.04 − 25 Rumsey et al.(1990)0.016 0.035 30 B. Lassnig, A. Kuznetsov, R. Margreiter and
E. Gnaiger (in preparation); Gnaiger et al.(1998)
Liverc 0.06 − 25 Wilson et al.(1988)0.025 − 25 Gnaiger et al. (1995)0.020 0.057 30 B. Lassnig, A. Kuznetsov, R. Margreiter and
E. Gnaiger (in preparation); Gnaiger et al.(1998)
Endothelial cellsd 0.039 0.057 37 Steinlechner-Maran et al.(1996)
aP50 is better expressed in terms of partial pressure (kPa; 1 mmHg=0.133322 kPa) rather than concentration, since oxygen solubility (oxygenconcentration per unit partial pressure) decreases with temperature and depends on the composition of the medium. For merely approximateconversion, a solubility of 10 µmol O2 l−1 kPa−1 may be used.
bIsolated mitochondria, in states 4 (passive) and 3 (active), respiring on substrates for respiratory complex I and II.cCardiac myocytes, oxygen partial pressure based on intracellular myoglobin saturation.dEndothelial cells, in (not maximally) active and passive states, corrected for intracellular oxygen gradients.
respirometer using a phosphorescence probe (Rumseyet al.1990). The difference may be due to uncorrected oxygen badiffusion from the Teflon stirrer. Whereas high volumespecific fluxes cause an underestimation of P50 due to gradientsin steady-state oxygen transfer systems, the opposite effeproduced in closed systems (P50 of 0.15 kPa in active heart andliver mitochondria; Costa et al. 1997) where fastaerobic–anoxic transitions are beyond the scope of tiresolution of the oxygen sensor. In Table 1, results excluded that appear to suffer from implicit artefacts.
Mitochondrial P50 and elasticity in passive and active states
The P50 of mitochondrial respiration increases witactivation by ADP (Table 1). In heart mitochondria, P50
doubles from 0.02 to 0.04 kPa (from 0.12 to 0.26 mmHgwhereas in liver mitochondria P50 increases almost threefoldfrom 0.02 to 0.06 kPa (0.43 mmHg) in the active state (Lassnig and others, in preparation; Gnaiger et al.1998;Table 1). At an intracellular PO∑ of 0.3 kPa, the maximumaerobic performance of heart mitochondria is limited to 90of Jmax (Fig. 6), as derived from equation 1:
Liver mitochondria would be limited to 84 % of Jmax atmaximum activity (Fig. 6). Insufficient information isavailable on intracellular PO∑ in liver. The relative limitationof flux by a given intracellular oxygen level is equivalent the elasticity in metabolic control analysis (Fell, 1997):
O2 = –––––––– .
P50 + PO2
P50 (3)Jε
JO2 (% max) = –––––––– × 100 .P50 + PO2
PO2 (2)
ck--
ct is
meare
h
),
B.
%
to
As shown in Fig. 6, the value of elasticity, εJO∑, is 0.10 in active
heart mitochondria and 0.16 in liver mitochondria, anddecreases to 0.06 in the passive state. In other words,intracellular PO∑, mitochondrial flux reaches 94 % of Jmax inthe resting state of zero ATP turnover (Fig. 6). Any evaluatioof the physiological role of respiratory control by oxygen mustherefore, take into account tissue-specific differences and tdependence of oxygen affinity on metabolic state and ratInterpretation of affinities, in turn, is incomplete withoutsimultaneous consideration of maximum flux at each metabostate.
Catalytic efficiency versusaffinity
The decrease in oxygen affinity (=1/P50) in active states,when the demand for oxygen is highest, appears to paradoxical from a functional point of view. While the affinitydecreases, however, maximum flux increases greatly, such tthe ratio Jmax/P50 is actually increased by adenylate activation(Fig. 7). The scope for activation by ADP declines undehypoxia, but this decline would be even more pronounced aconstant Jmax/P50 ratio (Gnaiger et al. 1998). As seen fromequation 1, Jmax/P50 is the initial slope of the hyperbolicfunction:
when PO∑<P50, and reflects the ‘catalytic efficiency’ at lowsubstrate concentrations (Place and Powers, 1984). Apparcatalytic efficiencies can be compared within a systemwhereas comparison between different types of mitochondrrequires the expression of fluxes in terms of enzyme turnovrates.
Oxygen affinity and catalytic efficiency are highly sensitive
JO2 = ––––– PO2P50 Jmax (4)
1135Respiratory flux control and COX
.
hesh
an
ofnds an).lyrn
atd
e arle
Xl
0 4 8 12 16 200
20
40
60
80
100
Flux
, JO
2 (%
max
imum
)
Liveractive
Heartactive
84% 94%90%
Passive
PO2/P50P50
PO2,i = 0.3 kPa
1.0
0.8
0.6
0.4
0.2
0
Ela
stic
ity,
O
2J ε
Fig. 6. Oxygen flux JO∑ (% of Jmax) as a function of oxygen pressurePO∑, expressed relative to the P50 value for each particular state, andthe inverse relationship to the elasticity εJ
O∑ of mitochondrial oxygenflux with respect to oxygen pressure (right-hand y-axis). Arrowsindicate the PO∑/P50 ratio in the passive and active states inmitochondria isolated from rat heart and liver at an intracellular PO∑
of 0.3 kPa. The maximum PO∑/P50 ratio of 20 on the x-axiscorresponds to the PO∑ range below 1.1 kPa in active livermitochondria. If intracellular PO∑ in liver were approximately doublethat in heart, then active mitochondria would respire atapproximately 90 % of maximum capacity in both tissues. Based onequation 2 in the form:
PO∑/P50JO∑ (% max) = –––––––––– × 100 .
1 +PO∑/P50
0 0.1 0.2 0.3 0.4
PO2 (kPa)
ADP
J O2
(% J
max
)
0
50
100
25
75
CO2 (µmol l−1)0 1 2 3 4
ATP
3
4
Fig. 7. Oxygen flux, JO∑ (as a percentage of Jmax in the presence ofexcess ADP), of rat heart mitochondria as a function of oxygenpressure, PO∑ (kPa), or oxygen concentration, CO∑ (µmol l−1), in thepassive and active states. The vertical arrow indicates the scope foractivation by ADP at an intracellular PO∑ of 0.3kPa (2mmHg). Thecircle and square show J50 (50 % of Jmax) and P50 in states 4 and 3,respectively. The dotted lines through these points show slopes(0.5Jmax/P50), proportional to apparent catalytic efficiency, whichincrease with activation by ADP (curved arrow). Measurements at30 °C with pyruvate and malate, and 1mmol l−1 ATP, no ADP(passive, state 4) or 1mmol l−1 ADP plus 1mmol l−1 ATP (active,state 3). 100% JO∑ is equivalent to a state 3 flux of4.5nmol s−1mg−1mitochondrialprotein (from Gnaiger et al.1998).
to uncoupling of oxidative phosphorylation (Fig. 8)
At low concentration of carbonyl cyanide p-trifluoromethoxyphenylhydrazone (FCCP), uncouplerespiration of endothelial cells increased to a maximum valmore than double that for coupled oxygen flow. P50 andcatalytic efficiency increased concomitantly. Above aoptimum uncoupler concentration, oxygen-saturaterespiratory flow, Imax, declined to the inhibited state, butcatalytic efficiency increased further as a function of state aindependently of rate (Fig. 8). In the uncoupled/inhibited sta(compare Fig. 5), further changes in catalytic efficiency wenot significant. Catalytic efficiency increases athermodynamic efficiency decreases, consistent with a mobased on the thermodynamics of irreversible process(Gnaiger et al.1995). This inverse relationship is not restricteto uncoupling, but also applies to activation by ADP (Fig. 7when thermodynamic efficiency decreases at maximum powoutput (Gnaiger, 1993c).
Oxygen affinity and excess capacity of cytochrome coxidase
Threshold effect and flux control coefficient of cytochrome coxidase
ADP and oxygen saturation of mitochondrial respiration optimum conditions does not drive cytochrome c oxidase to
due
nd
ndteresdeles
d)er
at
its kinetic limit: turnover rate can be increased further by taddition of artificial electron donors. COX activity wameasured in the oxygraph after blocking complex III witantimycin A (Fig. 1). Reduced N,N,N′,N′-tetramethyl-p-phenylenediamine dihydrochloride (TMPD) served as electron donor to cytochrome c, and its concentration washeld constant by the addition of ascorbate. Auto-oxidationascorbate and TMPD is a function of oxygen pressure awas subtracted from the measured oxygen consumption achemical background (B. Lassnig and others, in preparatioThe activity of COX was 50 % and 100 % above maximalADP-stimulated flux through the respiratory chain in liveand heart mitochondria, respectively, at kinetic oxygesaturation and 500µmol l−1 TMPD (Fig. 9). This is anunderestimation since TMPD becomes saturating only millimolar levels in coupled mitochondria (Morgan anWikström, 1991).
The phenomenon of an excess capacity of cytochromcoxidase is well known and largely unexplained. The molratio between complexes IV and I is six in skeletal musc(Schwerzmann et al. 1989). COX has a low flux controlcoefficient, CJ
COX, which means that a small change in COactivity plays a minor role in the control of mitochondria
1136
.le
o.
ep
ighol
arhis
ain
yces
dch
y
lyinst
E. GNAIGER AND OTHERS
Rel
ativ
e un
its (
%)
0
50
100
150
200
250
COXexcess
1/P50JO2
0
50
100
150
Exc
ess
capa
city
(%
)
Fig. 9. Excess capacity of cytochrome c oxidase (COX) relative tomaximum oxygen flux, JO∑, through the respiratory chain and thecorresponding oxygen affinity, 1/P50, in isolated mitochondria fromliver (open columns) and heart (filled columns). Fluxes are expressedrelative to the respiratory chain (with substrates for complex II inliver, complex I or II in heart). Oxygen affinity is for the activeADP-stimulated state expressed relative to the affinity of livermitochondria. Error bars show S.D., N=6–9. The excess capacity ofCOX (500µmol l−1 TMPD, 2 or 5 mmol l−1 ascorbate, 2.5µmol l−1
antimycin A) is significantly higher (P<0.05) in heart than in livermitochondria. The higher excess capacity of COX leads to the higheroxygen affinity of the respiratory chain.
respiration (Groen et al. 1982; using azide for inhibitortitrations). In titrations with cyanide, Kuznetsov et al.(1996)found a lower flux control coefficient of COX than with azideIdentical values of maximum fluxes in permeabilized muscfibres of 50 % COX-deficient mice and controls (Kuznetsovetal. 1996) might even suggest a flux control coefficient of zerThe flux control coefficient is the (infinitesimally small)change in relative flux through the pathway over th(infinitesimally small) change in relative capacity of the ste(Kacser and Burns, 1973; Heinrich and Rapoport, 1974). Hexcess capacity is associated with a low flux contrcoefficient. Correspondingly, CJ
COX is increased in musclefibres of the 50 % COX-deficient mice (Kuznetsov et al.1996).In a theoretical model, CJ
COX increases when musclemitochondria are nearly 50 % oxygen-limited at intracelluloxygen pressure (Korzeniewski and Mazat, 1996), but tlacks support from experimental oxygen kinetics.
A low flux control coefficient is directly related to thethreshold effect and explains why COX can be inhibited tolarge extent without effect on flux through the respiratory cha(Letellier et al.1993, 1994). The threshold effect of COX maprovide a safety margin, protecting against the consequenof accumulations of mutations in mitochondrial DNA(mtDNA) with age (Sohal and Weindruch, 1996) ancounteracting genetic defects with mtDNA heteroplasmy, suthat a small fraction of wild-type mtDNA remaining in amitochondrion or cell is sufficient for normal respiratorfunction (Mazat et al.1997). Importantly, the low flux controlcoefficient of cytochrome coxidase needs re-evaluation undeintracellular PO∑ levels (Gnaiger et al.1995).
iticicedslyelycenevelin nd
here
of
m
re
[FCCP] (µmol l−1) 0 4 8
0
20
40
60
80
100
0
0.04
0.08
0.12
0.16
Imax
P50
(kP
a); I
max
/(P
50×1
0−4 )
P50
Imax/P50
I max
(pm
ol s
−1 1
0−6
cells
)
Fig. 8. Maximum oxygen flow, Imax, in endothelial cells(pmol s−110−6cells) (open squares) and P50 (kPa) (open triangles) asa function of the concentration of the uncoupler FCCP (µmol l−1).Maximum stimulation of respiration was observed at FCCconcentrations of 2–3µmol l−1. Higher concentrations caused rapiinhibition of respiration, to Imax or below, of coupled cells. Apparencatalytic efficiency, Imax/P50 (filled circles), increases with uncoupleconcentration to a plateau that is reached when respirationinhibited to a constant minimum value (calculated from data givenSteinlechner-Maran et al.1996).
r Symmorphosis and flux control analysis
Is the excess capacity of COX non-functional, mereproviding a safety margin and expensive insurance agairregular events (Diamond and Hammond, 1992), or doesserve a direct function and is thus compatible with economdesign of the respiratory chain? The principle of economdesign is well illustrated when considering that thmitochondrial respiratory capacity in skeletal muscle exceejust slightly the capacity for cardiovascular oxygen supp(Saltin, 1985), and the oxidative capacity of the heart is mer10–20 % above the maximum physiological performan(Mootha et al. 1997). Indeed, the simplest structure–functiorelationship in the respiratory cascade appears to be at the lof muscle mitochondria, the total volume of which varies proportion to the aerobic capacity of the organism (Weibeletal. 1991). Regardless of allometric variation of body mass aadaptive variation of aerobic scope in athletic versussedentaryspecies, there is a constant relationship of 3.7µmol O2s−1cm−3
between the maximum rate of oxygen consumption of twhole organism and mitochondrial volume in the musculatu(Hoppeler and Turner, 1989). At a mitochondrial volume 1.4 mm3mg−1mitochondrial protein, this is equivalent to aprotein-specific maximum O2 flux of 4.1 nmol s−1mg−1 at30 °C, corresponding to the range of 2–6 nmol s−1mg−1
measured in ADP-activated mitochondria isolated froskeletal muscle (Schwerzmann et al. 1989) and4.5 nmol s−1mg−1 in active heart mitochondria (Fig. 7). Incontrast to the closely matched mitochondrial capacity, the
Pdtr is in
1137Respiratory flux control and COX
h of
aree
ic ofysn
hesf
0,ced
ureeadofuxrr
en
e ofnlyof
al.mdnd
rysis,he aear aXn
tein
is excess lung structure in relation to maximum respirati(Weibel et al.1991), suggesting that the flux control coefficienof the lung in the respiratory cascade must be very low unnormoxic conditions.
What is the flux control coefficient of mitochondria in threspiratory cascade? Important insights can be derived frour study on mitochondrial oxygen kinetics with the aid of flucontrol analysis. For this purpose, the respiratory cascadsimplified to three steps (Fig. 1): (1) the lung, with a flucontrol coefficient of zero; (2) the cardiovascular oxygesupply, including diffusion with a typically high flux controcoefficient, CJ
supply; and (3) the mitochondria, with a fluxcontrol coefficient, CJ
mito = 1−CJsupply. Consider a 5 %
inhibition of mitochondrial capacity in active heart. Thcompetition for oxygen decreases after a reduction mitochondrial capacity. Consequently, intracellular PO∑ tendsto increase and flux becomes more oxygen-saturated, relato a PO∑/P50 ratio of approximately 9 (Fig. 6). This pushes JO∑
closer to the maximum of the remaining mitochondricapacity (Jmax is now 5 % less than in the absence of inhibitoFig. 6, left-hand y-axis), and a 5 % reduction in mitochondriacapacity yields a response of less than 5 % in flux; therefoCJ
mito<1. To compensate fully for any change in flux and attain CJ
mito=0, intracellular oxygen pressure would have double to a PO∑/P50 ratio of 18, assuming no change in P50. Inthis new state, the system is driven to a lower elasticity (fro0.1 to 0.05; Fig. 6, right-hand y-axis), and flux is nowinevitably more sensitive to a further inhibition omitochondrial activity, i.e.CJ
mito increases as the elasticitydecreases. This reflects the well-known connectivity theor(Kacser and Burns, 1973), application of which shows thachange in elasticity tends to be associated with a change incontrol coefficient in the opposite direction, a very smaelasticity corresponds to a large flux control coefficient, avice versa. Elasticity and excess capacity (%) are also relate
At PO∑>P50 (on the far right in Fig. 6), the excess capacity diminishingly small and is equal to the elasticity (×100;equations 3 and 5).
A mitochondrial excess capacity of 10–20 % (Mootha et al.1997) is in line with an elasticity of 0.1 for active heart (Fig. 6Under these conditions, intracellular oxygen level can maintained high with respect to mitochondrial P50, but not highenough for full kinetic oxygen saturation of the respiratochain (Fig. 6). This implies a fairly high mitochondrial fluxcontrol coefficient, sharing control with the cardiovasculsystem. Such distribution of flux control is seen directly training and in a comparison of sedentary with athletic animawhere the gain in aerobic performance is due to cardiovascimprovement and an accompanying increase in mitochonddensity (Weibel et al.1991).
One central hypothesis of symmorphosis is the matchingcapacity for oxygen flux at each step in the respiratory casc
Excess capacity (%) = –––– × 100 .P50
(5)PO2
ont
der
eomx
e isxn
l
ein
tive
alr;lre,toto
m
f
emt a fluxll
ndd:
is
).be
ry
arinls,
ularrial
ofade
(Fig. 1) to the maximum flux of the physiological system(Weibel et al. 1991). At steady state, oxygen fluxes througeach step in the cascade are equal. Does the matchingcapacities, therefore, imply that equal capacities of all steps optimal for economical design? Intuitively, this appears to bthe logical implication of symmorphosis. The mechanistaspects of oxygen kinetics and the mathematical formalismflux control analysis, however, provide a quantitativeldifferent perspective. Mitochondrial oxidative capacity iconventionally and conveniently measured at kinetic oxygesaturation (Schwerzmann et al.1989; Mootha et al.1997). Fullkinetic oxygen saturation would be required, at eacmitochondrion in the cell, at a 1:1 matching of the capacitifor oxygen consumption and supply. A kinetic saturation o99 % is reached at a PO∑/P50 ratio of 100 (equation 2) or at anintracellular PO∑ of 3.5 kPa (26 mmHg). Quite apart from thecontradiction with experimental observation by a factor of 1this high intracellular oxygen pressure would seriously reduthe oxygen gradient from haemoglobin to mitochondria anthereby impose additional demands on cardiovascular structand function to compensate for the lower oxygen pressure hfor diffusion. In addition, at a mitochondrial excess capacity zero, the elasticity reduces to zero and the mitochondrial flcontrol coefficient is 1, exerting exclusive control ovemaximum aerobic performance. Equal capacities fomitochondrial oxygen consumption and cardiovascular oxygsupply are not economical.
At the other extreme of an intracellular PO∑/P50 ratio of 1 (afactor of 10 below measured PO∑ in myocytes), the elasticityfor oxygen is increased to 0.5 (Fig. 6). Mitochondrial oxidativcapacity would have to be 100 % instead of 10 % in excessoxygen supply capacity (equation 5). Such a design is not ouneconomical but impossible, because a doubling mitochondrial volume density in cardiomyocytes wouldexceed the available space (Hoppeler et al.1984). Neither zeronor a large mitochondrial excess capacity is economicInstead, criteria for an optimum excess capacity and optimudistribution of flux control coefficients have to be developeunder the constraints set by mitochondrial oxygen kinetics athe intracellular microenvironment (Fig. 6).
Kinetic trapping of oxygen: COX and the respiratory chain
100 % excess capacity of mitochondria in the respiratocascade would present a serious challenge for symmorphoand so does the 100 % excess capacity of COX in trespiratory chain (Fig. 9). Excess capacities of enzymes inpathway are required to maintain a catalysed reaction step nequilibrium (for a review, see Suarez, 1996). We proposenew functional explanation of the excess capacity of COrelated to the regulation of mitochondrial oxygen affinity, othe basis of (1) the decrease in P50 with a reduction in oxygenflux in the transition from the active to the passive sta(Fig. 7), (2) the increase in oxygen affinity with an increase excess capacity of COX in heart versusliver (Fig. 9), and (3)a kinetic model of the regulation of the Km′ of cytochrome c
1138
esnd)ulJ.-
heA.
.
n
ral
ts.
nt
.
n:
t
E. GNAIGER AND OTHERS
oxidase for oxygen (Chance, 1965; Petersen et al. 1974;Verkhovsky et al.1996):
Km′ for oxygen of cytochrome coxidase is maintained at a lowvalue by the ratio of rate constants for different reaction stwithin the macromolecular structure, where kin is the small,and hence rate-limiting, rate constant for electron input into enzyme, ket is the excessively large rate constant for thhaem–haem electron transfer, and Keq is the equilibriumconstant of oxygen binding. A very fast electron transfer to binuclear haem iron–copper centre of COX correspondskinetic trapping of oxygen as a basis for the low Km′. Variationof ket yields the expected change in the oxygen affini(Verkhovsky et al.1996). Similarly (Riistama et al.1996):
where k1 is the oxygen diffusion rate constant into the binuclesite domain of COX and KD is the local dissociation constanof the iron–oxygen complex at the reaction centre. Agarestricting the hypothetical oxygen channel into the enzymand thus lowering k1, effectively increases Km′ of COX(Riistama et al.1996).
In these examples with the isolated enzyme, Km′ of COX isincreased by decreasing the ‘internal’ rate constants, ket or k1
(equations 6 and 7). In our examples with intact mitochondP50 of the respiratory chain is decreased by decreasing Jmax.Since Jmax<kin (see equation 6), flux control is shifted from thinternal rate-limiting electron input into COX to the externelectron transport chain, thus reducing COX turnover rateoxygen saturation. (1) COX turnover rate is reduced at low flthrough the respiratory chain in the passive state. This decrethe P50 from the active to the passive state. (2) COX turnovrate is reduced at high flux through the respiratory chain increasing the excess capacity of COX and thus distributelectron input flux to a larger number of enzymes, which yiea lower input rate per enzyme. This decreases the P50 in activemitochondria of the heart compared with the liver. Actuallequation 7 provides a similarly plausible model for thfunctional relationship between the excess capacity of COX high oxygen affinity. The integratedchannel area for oxygendiffusion to the reactive centre of COX is enlarged by providia higher density of COX molecules, which then decreasesP50. This ‘synkinetic’ regulation of P50 depends merely on thequantitative relationship between COX capacity and trespiratory chain, but does not imply kinetic differences betweCOX in liver and heart (Bonne et al.1993). The apparent excescapacity of COX compared with the aerobic mitochondrcapacity is a basis for the high oxygen affinity of the respiratochain. It is the necessary price to be paid for the thermodynaand kinetic optimum function of the respiratory chain within thconstraints of oxygen supply through the organismic respiratcascade and of intracellular oxygen pressure.
Km' = –––– KD ,kin
(7)k1
Km' = –––– Keq .kin
(6)ket
eps
thee
the to
ty
artin,e,
ria,
eal atuxaseserbyinglds
y,e
and
ng the
heen
sialrymice
ory
This work was supported by a research grant from thUniversity of Innsbruck. A.K. was supported by an Orobororesearch award. We thank the Department of Zoology aLimnology, University of Innsbruck (Professor Dr R. Riegerfor the use of the electron microscopy facility. We are grateffor stimulating discussions and cooperation with Professor P. Mazat (Bordeaux).
ReferencesBABCOCK, G. T. AND WIKSTRÖM, M. (1992). Oxygen activation and
the conservation of energy in cell respiration. Nature356, 301–309.BONNE, G., SEIBEL, P., POSSEKEL, S., MARSAC, C. AND KADENBACH,
B. (1993). Expression of human cytochrome c oxidase subunitsduring foetal development. Eur. J. Biochem.217, 1099–1107.
CHANCE, B. (1965). Reaction of oxygen with the respiratory chain incells and tissues. J. gen. Physiol.49, 163–188.
CHANCE, B., LEIGH, J. S., CLARK, B. J., MARIS, J., KENT, J., NIOKA, S.AND SMITH, D. (1985). Control of oxidative metabolism and oxygendelivery in human skeletal muscle: A steady-state analysis of twork/energy cost transfer function. Proc. natn. Acad. Sci. U.S.82, 8384–8388.
COLE, R. C., SUKANEK, P. C., WITTENBERG, J. B. AND WITTENBERG,B. A. (1982). Mitochondrial function in the presence of myoglobinJ. appl. Physiol.53, 1116–1124.
CORNISH-BOWDEN, A. (1995). Fundamentals of Enzyme Kinetics.London: Portland Press.
COSTA, L. E., MÉNDEZ, G. AND BOVERIS, A. (1997). Oxygendependence of mitochondrial function measured by high-resolutiorespirometry in long-term hypoxic rats. Am. J. Physiol. 273,C852–C858.
DIAMOND, J. AND HAMMOND, K. (1992). The matches, achieved bynatural selection, between biological capacities and their natuloads. Experientia 48, 551–557.
FELL, D. (1997). Understanding the Control of Metabolism. London:Portland Press.
GAYESKI, T. E. J. AND HONIG, C. R. (1991). Intracellular PO∑ inindividual cardiac myocytes in dogs, cats, rabbits, ferrets and raAm. J. Physiol.260, H522–H531.
GNAIGER, E. (1993a). Homeostatic and microxic regulation ofrespiration in transitions to anaerobic metabolism. In TheVertebrate Gas Transport Cascade: Adaptations to Environmeand Mode of Life(ed. J. E. P. W. Bicudo), pp. 358–370. BocaRaton, Ann Arbor, London, Tokyo: CRC Press.
GNAIGER, E. (1993b). Nonequilibrium thermodynamics of energytransformations. Pure appl. Chem.65, 1983–2002.
GNAIGER, E. (1993c). Efficiency and power strategies under hypoxiaIs low efficiency at high glycolytic ATP production a paradox? InSurviving Hypoxia: Mechanisms of Control and Adaptation(ed. P.W. Hochachka, P. L. Lutz, T. Sick, M. Rosenthal and G. Van deThillart), pp. 77–109. Boca Raton, Ann Arbor, London, TokyoCRC Press.
GNAIGER, E., LASSNIG, B., KUZNETSOV, A. AND MARGREITER, R.(1998). Mitochondrial respiration in the low oxygen environmenof the cell. Effect of ADP on oxygen kinetics. Biochim. biophys.Acta (in press).
GNAIGER, E., STEINLECHNER-MARAN, R., MÉNDEZ, G., EBERL, T. AND
MARGREITER, R. (1995). Control of mitochondrial and cellularrespiration by oxygen. J. Bioenerg. Biomembr.27, 583–596.
GROEN, A. K., WANDERS, R. J. A., WESTERHOFF, H. V., VAN DER
1139Respiratory flux control and COX
lt
d
.
f
:
t
n
g
MEER, R. AND TAGER, J. M. (1982). Quantification of thecontribution of various steps to the control of mitochondrirespiration. J. biol. Chem.257, 2754–2757.
HEINRICH, R. AND RAPOPORT, T. A. (1974). A linear steady-statetreatment of enzymatic chains. General properties, control effector strength. Eur. J. Biochem. 42, 97–105.
HELMLINGER, G., YUAN, F., DELLIAN , M. AND JAIN, R. K. (1997).Interstitial pH and PO∑ gradients in solid tumors in vivo: High-resolution measurements reveal a lack of correlation. NatureMedicine3, 177–182.
HOPPELER, H., LINDSTEDT, S. L., CLAASSEN, J., TAYLOR, C. R.,MATHIEOU, O. AND WEIBEL, E. R. (1984). Scaling mitochondriavolume in heart to body mass. Respir. Physiol. 55, 131–137.
HOPPELER, H. AND TURNER, D. L. (1989). Plasticity of aerobic scopeAdaptation of the respiratory system in animals, organs and ceIn Energy Transformations in Cells and Organisms(ed. W. Wieserand E. Gnaiger), pp. 116–122. Stuttgart, New York: Thieme.
JONES, D. P. (1986). Intracellular diffusion gradients of O2 and ATP.Am. J. Physiol.250, C663–C675.
KACSER, H. AND BURNS, J. A. (1973). The control of flux. Symp. Soc.exp. Biol.32, 65–104.
KORZENIEWSKI, B. AND MAZAT, J.-P. (1996). Theoretical studies ocontrol of oxidative phosphorylation in muscle mitochondria different energy demands and oxygen concentrations. Actabiotheoretica44, 263–269.
KUZNETSOV, A., CLARK, J. F., WINKLER, K. AND KUNZ, W. S. (1996).Increase of flux control of cytochrome c oxidase in copper-deficientmottled brindled mice. J. biol. Chem. 271, 283–288.
LETELLIER, T., HEINRICH, R., MALGAT, M. AND MAZAT, J.-P. (1994).The kinetic basis of the threshold effects observed in mitochonddiseases: a systemic approach. Biochem. J.302, 171–174.
LETELLIER, T., MALGAT, M. AND MAZAT, J.-P. (1993). Control ofoxidative phosphorylation in rat muscle mitochondria. Implicatioto mitochondrial myopathies. Biochim. biophys. Acta1141, 58–64.
MAZAT, J.-P., LETELLIER, T., BÉDES, F., MALGAT, M., KORZENIEWSKI,B., JOUAVILLE , L. S. AND MORKUNIENE, R. (1997). Metaboliccontrol analysis and threshold effect in oxidative phosphorylatiImplications for mitochondrial pathologies. Molec. cell. Biochem.174, 143–148.
MOOTHA, V. K., ARAI, A. E. AND BALABAN , R. S. (1997). Maximumoxidative phosphorylation capacity of the mammalian heart. Am. J.Physiol. 272, H769–H775.
MORGAN, J. E. AND WIKSTRÖM, M. (1991). Steady-state redoxbehavior of cytochrome c, cytochrome a and CuA of cytochrome coxidase in intact rat liver mitochondria. Biochemistry 1991,948–958.
PETERSEN, L. C., NICHOLLS, P. AND DEGN, H. (1974). The effect ofenergization on the apparent Michaelis–Menten constant oxygen in mitochondrial respiration. Biochem. J.142, 247–252.
PETERSEN, L. C., NICHOLLS, P. AND DEGN, H. (1976). The effect ofoxygen concentration on the steady-state kinetics of the solubilicytochrome c oxidase. Biochim. biophys. Acta452, 59–65.
al
and
l
:lls.
nat
rial
n
on:
for
zed
PLACE, A. R. AND POWERS, D. A. (1984). Kinetic characterization ofthe lactate dehydrogenase (LDH-B4) allozymes of Fundulusheteroclitus. J. biol. Chem.259, 1309–1318.
RIISTAMA , S., PUUSTINEN, A., GARCIA-HORSMAN, A., IWATA, S.,MICHEL, H. AND WIKSTRÖM, M. (1996). Channelling of dioxygeninto the respiratory enzyme. Biochim. biophys. Acta1275, 1–4.
RUMSEY, W. L., SCHLOSSER, C., NUUTINEN, E. M., ROBIOLIO, M. AND
WILSON, D. F. (1990). Cellular energetics and the oxygendependence of respiration in cardiac myocytes isolated from adurat. J. biol. Chem.265, 15392–15402.
SALTIN , B. (1985). Malleability of the system in overcominglimitations: functional elements. J. exp. Biol.115, 345–354.
SCHWERZMANN, K., HOPPELER, H., KAYAR, S. R. AND WEIBEL, E. R.(1989). Oxidative capacity of muscle and mitochondria:Correlation of physiological, biochemical and morphometriccharacteristics. Proc. natn. Acad. Sci. U.S.A.86, 1583–1587.
SOHAL, R. S. AND WEINDRUCH, R. (1996). Oxidative stress, caloricrestriction and ageing. Science273, 59–63.
STEINLECHNER-MARAN, R., EBERL, T., KUNC, M., MARGREITER, R. AND
GNAIGER, E. (1996). Oxygen dependence of respiration in coupleand uncoupled endothelial cells. Am. J. Physiol.271, C2053–C2061.
SUAREZ, R. K. (1996). Upper limits to mass-specific metabolic ratesA. Rev. Physiol. 58, 583–605.
SUGANO, T., OSHINO, N. AND CHANCE, B. (1974). Mitochondrialfunctions under hypoxic conditions. The steady states ocytochrome c reduction and energy metabolism. Biochim. biophys.Acta347, 340–358.
TRUMPOWER, B. L. AND GENNIS, R. B. (1994). Energy transduction bycytochrome complexes in mitochondrial and bacterial respirationThe enzymology of coupling electron transfer reactions totransmembrane proton translocation. A. Rev. Biochem.63,675–716.
VERKHOVSKY, M. I., MORGAN, J. E., PUUSTINEN, A. AND WIKSTRÖM,M. (1996). Kinetic trapping of oxygen in cell respiration. Nature380, 268–270.
WAGNER, P. D. (1996). Determinants of maximal oxygen transporand utilization. A. Rev. Physiol. 58, 21–50.
WEIBEL, E. R. (1984). The Pathway for Oxygen. Structure andFunction in the Mammalian Respiratory System. Cambridge, MA:Harvard University Press. 425pp.
WEIBEL, E. R., TAYLOR, C. R. AND HOPPELER, H. (1991). The conceptof symmorphosis: a testable hypothesis of structure–functiorelationship. Proc. natn. Acad. Sci. U.S.A.88, 10357–10361.
WILSON, D. F., RUMSEY, W. L., GREEN, T. J. AND VANDERKOOI, J. M.(1988). The oxygen dependence of mitochondrial oxidativephosphorylation measured by a new optical method for measurinoxygen concentration. J. biol. Chem.263, 2712–2718.
WITTENBERG, B. A. AND WITTENBERG, J. B. (1985). Oxygen pressuregradients in isolated cardiac myocytes. J. biol. Chem. 260,6548–6554.
WITTENBERG, B. A. AND WITTENBERG, J. B. (1989). Transport ofoxygen in muscle. A. Rev. Physiol.51, 857–878.