RESEARCH REPORT No VTT-R-04098-07 11.6.2007 Steel Inner layer Outer layer IL/OL IL/OL k IL/OL Electrolyte Steel Inner layer Outer layer Cr m e Cr(III) D Cr D Cr D Fe D Fe Fe m Fe(X) k 1Cr k 3Fe k 3Cr k 1Fe Cr(III) IL/OL Ni m Ni(II) D Ni D Ni k 1Ni Ni(II) IL/OL k 3Ni Fe(X) IL/OL Fe(X) OL D Fe,OL Ni(II) OL D Ni,OL Cr(III) OL D Cr,OL Electrolyte Mixed Conduction Model for Oxide Films – quantitative procedure for determination of kinetic parameters for individual species Authors Iva Betova, Martin Bojinov, Petri Kinnunen and Timo Saario Confidentiality Public
Transcript
RESEARCH REPORT No VTT-R-04098-07 11.6.2007
Steel Inner layer Outer layer
Crm
e
Cr(III)DCr
DFe
Fem
Fe(X)
k1Cr
k3Fe
k3Cr
k1Fe
Cr(III)IL/OL
Nim Ni(II) DNik1Ni
Ni(II)IL/OL
k3Ni
Fe(X)IL/OLFe(X)OL
DFe,OL
Ni(II)OL
DNi,OL
Cr(III)OL
DCr,OL
ElectrolyteSteel Inner layer Outer layer
Crm
e
Cr(III)DCrDCr
DFeDFe
Fem
Fe(X)
k1Cr
k3Fe
k3Cr
k1Fe
Cr(III)IL/OL
Nim Ni(II) DNiDNik1Ni
Ni(II)IL/OL
k3Ni
Fe(X)IL/OLFe(X)OL
DFe,OL
Ni(II)OL
DNi,OL
Cr(III)OL
DCr,OL
Electrolyte
Mixed Conduction Model for Oxide Films – quantitative procedure for determination of kinetic parameters for individual species Authors Iva Betova, Martin Bojinov, Petri Kinnunen and Timo Saario
Confidentiality Public
RESEARCH REPORT VTT-R-04098-07
2 (27)
Preface The work discussed in the present report has been carried out as a part of the Work Package 1 of the project FP6-036367 A deterministic model for corrosion and activity incorporation in nuclear power plants (ANTIOXI) in 2006 - 2007. The ANTIOXI project is a part of the EURATOM FP6 Programme “Advanced tools for nuclear safety assessment and component design”. The ANTIOXI project in EURATOM FP6 concentrates on development of modelling tools for activity incorporation and corrosion phenomena into oxide films on construction materials in light water reactor environments. The main funding source of the work has been the Sixth Framework Programme of the European Commission. The cooperation of the Members of the Advisory Board of the ANTIOXI project is gratefully acknowledged. Espoo, June 2007 Authors
RESEARCH REPORT VTT-R-04098-07
3 (27)
Contents 1 Introduction 4
2 Goal 6
3 Description 6
4 Limitations 6
5 Experimental 7
6 Theoretical approach 7
7 Results 12
8 Validation of results 16
9 Conclusions 24
10 Summary 24
11 Nomenclature 25
12 References 26
RESEARCH REPORT VTT-R-04098-07
4 (27)
1 Introduction Oxide films formed on metallic construction materials such as stainless steels and nickel-based alloys during their exposure to Light Water Reactor (LWR) coolants play a decisive role in maintaining the integrity of coolant circuits, working as an effective barrier against general and different forms of localised and stress-induced corrosion. On the other hand, they act as a deposit for radioactivity incorporation in the reactor primary circuit which is a potential risk for personnel safety during maintenance and shutdown periods [1-3].
During the almost 50 years of commercial use of LWRs, a considerable experience has been gained about the materials behaviour in addition to the technical materials test results. Yet, the increasingly faster change of the environmental conditions have made it difficult to test all possible combinations of materials and environments in order to assess the long-term behaviour of the protective oxides on the materials, in these new combinations of environments [1-5]. The inference is that a full assessment of the materials behaviour in LWRs cannot be gained only through material testing in simulated or even real LWR environments, since the oxide film stability and protectiveness will depend on a large number of factors, and so will the materials integrity. We need a more fundamental understanding for each kind of oxide film and the impact of environmental factors on the film behaviour. We also need a theory or a modelling tool that can take into account the interaction between the various local oxides with their local chemistry in order to have an integral description and understanding of the stress corrosion cracking and the activity build-up in any LWR. Especially for the activity build-up the extent to which activated particles are able to incorporate into the oxide film on a construction material depends strongly on the composition of the different oxide layers. Therefore understanding the roles of the major constituents in these oxide layers is a necessity in order to understand the phenomena related to activity incorporation.
In a previous paper [5] the oxide films formed on AISI 316L(NG) in the temperature range 150 - 300°C were characterised in-situ by impedance spectroscopy in alloy / oxide / electrolyte and alloy / oxide / inert metal configurations and ex-situ by Auger electron spectroscopy. The ability of the Mixed-Conduction Model for passive films [5-8] to reproduce the experimental impedance data in both configurations has been verified. A procedure for the calculation of the kinetic constants of the interfacial reactions of generation / consumption of predominant point defects, as well as those characterising the transport rates of those defects in the oxide has been developed. The effect of temperature on the kinetic and transport parameters has been assessed, and the relevance of these parameters for the corrosion behaviour of stainless steel in a high-temperature electrolyte has been discussed. The picture of the oxide that emerges from the impedance measurements is that of a mixed-conducting film with predominant electronic conductivity. The fact that the impedance of this film does not change significantly with temperature suggested that its electrical and electrochemical properties remain qualitatively unaltered in the entire studied temperature interval. In general, the impedance and surface analytical results
RESEARCH REPORT VTT-R-04098-07
5 (27)
reported earlier by some of the authors [5] indicate that regardless of the fact that comparatively thick oxide layers are formed especially at temperatures exceeding 200°C, the kinetics of the overall film growth and corrosion process is governed by a thin barrier layer. In that respect, this quantitative treatment based on a conceptual model consisting of a very thin barrier layer adjacent to the alloy substrate and a much thicker layer growing by dissolution - re-deposition has been found to be in full quantitative agreement with the electrochemical impedance data measured after short oxidation times. In addition, the dependence of the overall film thickness on temperature after 72 h oxidation at potentials in the passive region has been predicted. This calculation is based on the assumption that the growth rate of the outer layer is controlled by its solubility in a borate electrolyte. However, the version of the model presented in Ref. 5 did not take into account that diffusion coefficients and interfacial rate constants differ between various metallic oxide constituents, and thus is not able to quantitatively predict the in-depth composition of the oxide formed on stainless steel in high-temperature electrolytes. There is a need to review these constants and include their reliable estimates in the inner, compact oxide part of the model in order to be able to predict the influence of different water chemistries and chemical conditions in the coolant circuits on the growth of the inner layer and its restructuring leading to the formation of the outer layer crystallites. As a step towards that goal, the above conceptual model has been revised, so that the thin barrier layer adjacent to the alloy interface has been replaced an inner layer growing via solid state diffusion-migration of point defects and (at higher temperatures) an outer layer growing via re-precipitation of material dissolved through the inner layer has been considered in the present report. To the best of our knowledge, the only attempt to assess quantitatively the kinetic parameters pertinent to individual oxide constituents has been made by Zhang and Macdonald [9,10] using the framework of the Point Defect Model (PDM) [11,12], the attempt being restricted to the passive film on a binary Ni-W alloy. The present work summarizes the first step towards a refinement of the MCM that will enable the estimation of kinetic and transport parameters of metallic oxide film constituents. First, an approximation of the approach oriented towards the calculation of depth profiles of individual metallic constituents of the oxide is outlined and the corresponding mathematical procedure is briefly described. Second, data from Auger Electron Spectroscopic (AES) depth profiles of oxide films formed on AISI 316L(NG) stainless steel in a borate electrolyte at temperatures in the range 150 - 300°C are presented and quantitatively compared to the predictions of the proposed approach. Estimates of kinetic and transport parameters for the individual metallic constituents of the inner and outer layers of oxide are thereby obtained and their relevance to the mechanism of the film growth and restructuring processes as depending on electrode potential and temperature is discussed. Further, using the proposed quantitative procedure, the kinetic and transport parameters of long-term (up to 10, 000 h) film growth and restructuring on AISI 304 stainless steel in simulated PWR water with or without zinc addition are also estimated on the basis of a quantitative comparison of the model predictions and literature data on the in-depth concentration profiles of the constituent elements.
RESEARCH REPORT VTT-R-04098-07
6 (27)
The obtained values are discussed in terms of the effect of Zn on the growth rate of the inner and outer layers of the corrosion film.
2 Goal The main objective of the present task is to elaborate a quantitative procedure of determination of kinetic and transport parameters for individual alloy constituents during anodic film growth on AISI 316 L(NG) stainless steel in high-temperature borate electrolyte. Based on the developed procedure, the long-term growth process of a corrosion film on AISI 304 steel in simulated PWR water is quantitatively described and estimates of kinetic and transport parameters for this case are also obtained.
3 Description This study concerns with the corrosion film growth on AISI 304 and AISI 316L (NG) stainless steels in high-temperature water solutions pertinent to the coolant circuits of light-water reactors. The compositions of the steels are given in Table 1.
Table 1. Composition of the investigated materials, wt.%
AISI 304 [16] 0.065 18.5 - Bal. 0.10 10.750.001 0.41 - 0.06 The modelling tools used in this work are based on the Mixed-Conduction Model for Oxide Films developed earlier [5-8] and represent in fact its refinement and further quantification with respect to the prediction of the evolution of the concentration profiles of individual alloying elements (Fe,Cr,Ni) and incorporated solution-originating species (Zn) during the growth and restructuring of the corrosion film.
4 Limitations Since our goal is to compare the predictions of the proposed model with depth profiles of metallic constituents of the oxide normalised to its total cation content in order to exclude the influence of the oxygen profile, at this point we do not distinguish between the defects via which respective metallic constituent is transported through the inner layer of oxide. At this stage, the evolution of the micro- and nanostructure of the inner oxide layer(s) and its influence on the mechanism(s) of ion transport in that layer is not taken into account. This issue will be treated in a subsequent report. In the absence of representative information on the pore diameter and tortuousity of the outer deposited layer of oxide, and also of reliable data on the crystallite size of that layer, the growth of this layer is formally treated as a diffusion process in a matrix constituted of the outer layer crystals and the electrolyte in between, which precludes at this stage the precise
RESEARCH REPORT VTT-R-04098-07
7 (27)
determination of the kinetic and transport parameters of all the elementary steps involved in the outer layer growth.
5 Experimental The working electrodes have been manufactured from AISI 316 L(NG) stainless steel (its composition as determined by emission spectroscopy is listed in Table 1). All measurements were performed in a static Ti-cladded autoclave at temperatures of 150, 200, 250 and 300°C, the corresponding pressures being between 4 and 10 MPa. A Pt sheet was used as a counter electrode. All potentials were measured vs. a Pd electrode electrochemically loaded with hydrogen to approximate the reversible hydrogen electrode (RHE) at each temperature. The potential of Pd was continuously checked vs. an external pressure-balanced AgCl/Ag electrode filled with 0.1 M KCl which enabled its conversion to the standard hydrogen electrode (SHE) scale when appropriate. A 0.1 M Na2B4O7 solution prepared from p.a. sodium tetraborate (Merck) and ultrapure water was employed. The pH of the solution was 9.3 at room temperature, ca. 8.7 at 200oC and ca. 9.1 at 300oC. Experiments were performed under slow continuous bubbling with N2 (99.999%). Stainless steel samples were oxidised for 72 h at potentials of 0.2, 0.4, 0.6 and 0.8 V vs. RHE at the specific temperature using a multichannel potentiostat. Auger Electron spectra and depth profiles were measured using a Perkin Elmer PHI model 610 scanning Auger microprobe controlled by Microsoft Windows based software. The spectral data were collected in the pulse counting mode and the differentation for the elemental concentration analysis from the selected observable spectral features was made by the software. Sensitivity factors of Auger transitions were taken into account by the computing procedure. For depth profiling, sputtering by an Ar+ ion beam (energy 3 keV, current 2.5 μA) was performed. The angle of incidence of the Ar+ ion beam with respect to the sample surface was 30°. During depth profiling the vacuum in the analyzer chamber was better than 2.67 ×10⁻⁶ Pa. Sputtering area rastered on the sample surface was about 4×4 mm2 and the sputtering rate was 4.5 nm/min, as calibrated using a standard Ta2O5/Ta sample.
6 Theoretical approach Inner layer growth according to the proposed approximation of the MCM. - According to the PDM and MCM [5-13], the inner layer growth proceeds via the sequence of reactions involving the generation of normal cation positions and injection of oxygen vacancies at the alloy/film interface, their transport via a diffusion-migration mechanism and subsequent consumption at the film/electro-lyte interface via a reaction with adsorbed water. In parallel to that process, metal cation dissolution through the film, involving either the generation of cation vacancies at the outer interface, their transport and consumption at the inner interface, or generation, transport and release of interstitial cations, respectively, is also expected to occur [5-12]. Due to the low solubility of the constituent metals in the high-temperature electrolyte, the dissolved cations are mainly redeposited to form the outer layer. Such a situation is illustrated schematically in Figure 1 in which the oxidation and dissolution of nickel has been omitted for the sake of simplicity.
RESEARCH REPORT VTT-R-04098-07
8 (27)
Steel Inner layer ElectrolyteOuter layer
k3Fe
k1FeM z+Cr +aq
CrIIICr
V••
O H2Ok4
H+k2FeCrm
CrIIICr
e- Fe y+aq
Fem
Feχ•ik1iFe
k3iFe kr
Cr•••i
V••
O
V'''M
Fem
Crm
FeIIIFek2Cr
V'''M
Cr•••iFeχ•
iCraq
z+
FeIIIFe
Fem
Crm
OO
k3iCr
k3CrFe y+
aq
k1CrM
k1iCr
Di
DM
DO
Steel Inner layer ElectrolyteOuter layer
k3Fe
k1FeM z+Cr +aqz+Cr +aqCr +aq
CrIIICrCrIIICr
V••
OV••
O H2Ok4k4
H+k2FeCrm
CrIIICrCrIIICr
e- Fe y+aqFe y+aq
Fem
Feχ•iFeχ•ik1iFe
k3iFe
V••
OV••
O
V'''MV'''M
Fem
Crm
kr
Cr•••iCr•••i
FeIIIFeFeIIIFek2Cr
V'''MV'''M
Cr•••iCr•••iFeχ•
iFeχ•i
Craqz+Craqz+
FeIIIFeFeIIIFe
Fem
Crm
OO
k3iCr
k3CrFe y+
aqFe y+aq
Di
DO
DMk1CrM
k1iCr
Figure 1. A scheme of the growth of the inner layer, dissolution of cations through it and subsequent precipitation of the outer layer of the corrosion film on stainless steel according to the MCM.
The goal of the present work is to elaborate a calculational procedure for the determination of kinetic and transport parameters of individual alloy constituents. Such a procedure is intended to be validated by comparing the predictions of the model with experimentally measured depth profiles of such constituents in the oxide, normalised to its total cation content to exclude the influence of the oxygen profile. In order to reduce the number of variables, we intend to use a simplified approach scheme presented in Figure 2. Although it has been presumed that Cr and Ni are transported through the oxide via vacancies and Fe via interstitial cations [5-8], at this point we do not distinguish between the type of the defects via which the respective metallic constituent is transported through the inner layer of oxide. Thus e.g. the reaction rate constant at the alloy/inner layer interface for Fe (k1Fe) can be regarded as a sum of the reaction rate constants of oxidation of Fe producing Fe interstitials (k1iFe), producing normal Fe positions and oxygen vacancies (k2Fe) and consuming cation vacancies with the simultaneous production of normal Fe positions (k1FeM), the same being the case for Cr and Ni and also for the inner layer/electrolyte interface in the pores of the outer layer. On the other hand, the diffusion coefficients DCr, DFe and DNi can be regarded as characterising the overall transport of cations through the inner layer resulting either from its growth via generation, transport and consumption of oxygen vacancies or the dissolution of these cations through the inner layer via a vacancy or interstitial mechanism.
RESEARCH REPORT VTT-R-04098-07
9 (27)
Steel Inner layer Outer layer
Crm
e
Cr(III)DCr
DFe
Fem
Fe(X)
k1Cr
k3Fe
k3Cr
k1Fe
Cr(III)IL/OL
Nim Ni(II) DNik1Ni
Ni(II)IL/OL
k3Ni
Fe(X)IL/OLFe(X)OL
DFe,OL
Ni(II)OL
DNi,OL
Cr(III)OL
DCr,OL
ElectrolyteSteel Inner layer Outer layer
Crm
e
Cr(III)DCrDCr
DFeDFe
Fem
Fe(X)
k1Cr
k3Fe
k3Cr
k1Fe
Cr(III)IL/OL
Nim Ni(II) DNiDNik1Ni
Ni(II)IL/OL
k3Ni
Fe(X)IL/OLFe(X)OL
DFe,OL
Ni(II)OL
DNi,OL
Cr(III)OL
DCr,OL
Electrolyte
Figure 2. A simplified scheme of the growth of the inner and outer layers of the film formed on stainless steel according to the proposed simplified approach. For details see text. Mathematically, we treat the problem in conceptual analogy to the approach presented in Refs. 9 and 10, where the depth profile of W in a binary Ni-W alloy has been calculated on the basis of the PDM. In order to calculate the respective depth profile of a metallic oxide constituent j = Fe,Cr or Ni, expressed as the dependence of its molar fraction, yj=cjVm,MO, on the distance within the inner layer, cj being its molar concentration and Vm,MO the molar volume of the phase in the layer, the respective transient diffusion-migration equations for each component
2
2
2
2
2
2
3
2
Fe Fe Fe FeFe
Cr Cr Cr CrCr
Ni Ni Ni NiNi
y y XFED yDt x RT x
y y FED yDt x RT x
y y FED yDt x RT
∂ ∂ ∂= +
∂ ∂∂ ∂ ∂
= +∂ ∂∂ ∂ ∂
= +∂ ∂ ∂x
∂
∂
r
r
r
(1)
where X stands for the nominal valency of Fe in the oxide, which is close to 2.67 in the passive region and close to 3 in the transpassive region, have to be solved subject to the boundary conditions at the alloy/film and film/electrolyte interfaces, as well as the initial conditions
RESEARCH REPORT VTT-R-04098-07
10 (27)
, ,
, ,
1
, 3
1
, 3
1
, 3
( ,0) , ( ,0) , ( ,0)(0, ) , (0, ) , (0, )
1( , )
1( , )2
1( , )3
Fe Fe a Cr Cr a Ni Ni a
Fe Fe a Cr Cr a Ni Ni a
FeFe
m MO Fe Fe
NiNi
m MO Ni Ni
CrCr
m MO Cr Cr
,
,
y x y y x y y x yy t y y t y y t y
k RTy L tV k XFED
k RTy L tV k FED
k RTy L tV k FED
= =
= = =
⎡ ⎤= +⎢ ⎥
⎣ ⎦⎡ ⎤
= +⎢ ⎥⎣ ⎦⎡
= +
r
r
r⎤
⎢ ⎥⎣ ⎦
=
(2)
where x = 0 at the alloy/film interface and x = L is the film/electrolyte or inner layer/outer layer interface.
At this stage of the modelling, we do not consider the existence of a transition layer between the bulk alloy and the alloy/oxide interface in which the composition of the underlying alloy is modified. In other words, the respective mass fractions at the alloy / film interface are taken as equal to the fractions in the bulk alloy. Albeit admittedly a crude simplification, this assumption facilitates the computations markedly. The introduction of the transition layer at a later stage of this work is, however, conceptually straightforward. Another simplification introduced at this point is that at t=0, there is no oxide on the surface, which means that the thin barrier layer formed via the transformation of the airborne oxide during heat-up is neglected. The boundary conditions at the film/electrolyte interface are given by the steady-state concentrations of the respective metallic constituents at that interface obtained by the steady-state solution of the transport equations.
The system of equations (1) was solved subject to the initial and boundary conditions (2) using a Crank-Nicholson method with a fixed geometry in order to compare the model predictions to experimental AES profiles. The position of the metal/oxide interface and the thickness of the inner layer of the oxide have been obtained experimentally by fitting the oxygen profiles with a sigmoidal function to obtain the inflexion point at which the concentration of oxygen has dropped to half its value at the outer interface. An approach to the outer layer growth. – As mentioned already in our previous papers [5,6], the outer layer is presumed to grow via the precipitation of material that is dissolved from the substrate through the inner layer of oxide. This is admittedly a simplification with regard to the real plant conditions, in which the composition of the coolant water adjacent to the outer layer plays an important role. The growth of the outer layer is a multistep process that involves the dissolution reaction at the inner layer/solution interface (already described above by the reaction steps k3,i (i = Fe, Cr and Ni), liquid phase transport through the pores of the outer layer, supersaturation and re-precipitation of cations both at the pore walls and at the outer layer/electrolyte interface and hence outer layer crystal growth. In the absence of representative information on the pore diameter and tortuousity, and also of reliable data on the crystallite size of the outer layer, the growth of this layer can be formally treated as a diffusion process in a matrix constituted of the outer layer crystals and the electrolyte in between. Such a
RESEARCH REPORT VTT-R-04098-07
11 (27)
treatment for the oxide layer has already been presented in relation to incorporation of foreign species into the growing film [2]. Since the outer layer is not continuous but rather represents a system of discrete crystallites with electrolyte in the pores, the role of the potential gradient in this layer can be considered negligible with respect to the concentration gradient. Thus, to calculate the depth profile of a certain cation in the outer layer, the following system of equations has to be solved:
2, ,
, 2
2,
, 2
2, ,
, 2
Fe OL Fe OLFe OL
Cr OL Cr OLCr OL
Ni OL Ni OLNi OL
y yD
t xy y
Dt x
y yD
t x
∂ ∂=
∂ ∂∂ ∂
=∂ ∂
∂ ∂=
∂ ∂
, (3)
The boundary conditions at the inner interface of the outer oxide layer are identical to those used as outer boundary conditions at the inner layer / electrolyte interface, which ensures the continuity of the composition of the whole film as usually found by ex-situ analytical techniques. It also reflects the implicit assumption that the material dissolving at the inner layer/solution boundary is effectively re-deposited to form the outer layer. In the actual in-plant case, on the contrary, we probably will not have a confined system which will possibly affect the model by introducing additional terms for solution-originating Fe, Cr and Ni cations that are able to incorporate in the outer layer. Description of the calculation procedure. – First, the position of the metal/film interface is determined by a sigmoidal fit of the experimental profile of the atomic concentration of oxygen from the AES. Then, the profiles of the mass fractions of main metallic elements normalised to the total metallic content of the film are recalculated with the estimated position of the metal/film interface as zero. The approximate position of the inner layer/outer layer interface is calculated by sigmoidal fits of the experimental profiles of the main metallic constituents of the alloy – Fe and Cr, whenever evidence of the presence of an outer layer has been found in the experimental profiles. As a first step of the calculation, the system of equations (1) was solved subject to the initial and boundary conditions (2) using a Crank-Nicholson method with discretisation of the moving boundaries due to the growth of the oxide in analogy to the calculational approach outlined in Ref. 10 in order to obtain the compositional profiles in the inner layer. In the cases when an outer layer is present, the inner layer thickness has been subtracted and the inner/outer layer boundary is taken as a new zero. Then the system of equations (3) is solved with the respective boundary conditions at the inner layer/outer layer interface similar as those used in (2). The boundary conditions at the outer layer / electrolyte interface are at this point assumed to be equal to the experimentally found stoichiometry of the outermost layer of oxide as determined by the respective ex-situ technique. In principle, the surface composition has been found to be in reasonable agreement with thermodynamic calculations of the solubility of the respective oxide phases discussed by other authors [15]. As a final step, the calculated profiles for the normalised mass fractions of the inner and outer layers are combined in order to compare the model predictions with the experimental results in a convenient way.
RESEARCH REPORT VTT-R-04098-07
12 (27)
7 Results Estimation of the oxide layer thickness on AISI 316L(NG) in borate electrolyte as depending on potential and temperature. - Figure 3 shows the profiles of the oxygen concentration for all the studied films in the interval 150-300°C, expressed vs. the position of the metal/film interface determined by a sigmoidal fit of the profiles for each potential and temperature. As demonstrated by the very good correspondence between experimental points and calculated lines, this approach gives reliable estimates of the film thickness that can be used further in the computation procedure. It is worthwhile noting that it is difficult to derive any dependence of total film thickness on potential, whereas in general the film thickness increases with temperature in an Arrhenius-like fashion. The estimated apparent activation energies will be commented below in relation to the activation energies for the kinetic and transport parameters of individual oxide constituents. One interesting finding is that films formed in the transpassive region are the thickest for all temperatures except 250°C (for that temperature they are found to be the thinnest). An explanation of that fact is sought below on the basis of the experimental and calculated film compositions at all investigated temperatures.
a) b)
-20 -10 0 10 20 30 40
10
20
30
40
50 -0.44 V -0.24 V -0.04 V 0.16 V
oxyg
en c
once
ntra
tion
/ %
distance from the M/F interface / nm -200 -150 -100 -50 0 50 100 150 200
10
20
30
40
50 -0.6 V -0.4 V -0.2 V 0 V
oxyg
en c
once
ntra
tion
/ %
distance from the M/F interface / nm
c) d)
-100 -50 0 50 100 150 200 250 3000
10
20
30
40
50
60
oxyg
en c
once
ntra
tion,
%
distance from the M/F interface / nm
-0.7 V -0.5 V -0.3 V -0.1 V
-200 -100 0 100 200 300 400 500 6000
10
20
30
40
50
60
oxyg
en c
once
ntra
tion,
%
distance from the M/F interface / nm
-0.7 V -0.5 V -0.3 V -0.1 V
Figure 3. Profiles of the oxygen concentration for the studied films on AISI 316L(NG) at 150 (a), 200 (b), 250 (c) and 300°C (d) expressed vs. the position of the metal/film interface. Points – experimental values, solid lines – sigmoidal fit. Vertical lines (other than the one located at x = 0) indicate the position of the film/electrolyte interface for each respective potential given vs. SHE.
RESEARCH REPORT VTT-R-04098-07
13 (27)
Experimental and calculated in-depth compositions of the films. – The data collected in Figure 4 - Figure 7 demonstrate the ability of the present approach to account for the in-depth distribution of metallic elements in the passive and transpassive films on AISI 316L(NG) in the studied temperature range. At 150°C, the film formed in the passive region is Cr-enriched, whereas in the transpassive region, a clear depletion of Cr accompanied by an enrichment of Ni is observed (Figure 4). The transpassive release of Cr at such potentials has been verified by some of us earlier using a wall-jet ring-disc electrode [16]. The Cr depletion is an important result which shows that the passive-to-transpassive transition results in a formation of a Fe- and Ni-rich film by selective leaching of Cr also in high-temperature electrolytes.
0 5 10 15 20 250.0
0.1
0.2
0.3
0.4
0.5
0.6
0.7
0.8
yFe
yCr
yNi
y
distance from the M/F interface / nm
-0.44 V
0 5 10 15 20 25 30 35 400.0
0.1
0.2
0.3
0.4
0.5
0.6
0.7
0.8
0.16 V
yCr
yFe
yNi
y
distance from the M/F interface / nm
Figure 4. Experimental (points) and calculated (solid lines) depth profiles of the mass fractions of Fe,Cr and Ni in the films on AISI 316L (NG) for 72 h in 0.1 M Na2B4O7 at 150°C in the passive (left figure) and transpassive (right figure) range expressed vs. the position of the metal/film interface. Potentials given vs. SHE.
Figure 5. Experimental (points) and calculated (solid lines) depth profiles of the mass fractions of Fe,Cr and Ni in the films on AISI 316L (NG) for 72 h in 0.1 M Na2B4O7 at 200°C in the passive (left figure) and transpassive (right figure) range expressed vs. the position of the metal/film interface. Potentials given vs. SHE.
At 200°C, the film in the passive range contains mainly Fe with some slight enrichment of Cr, whereas once again in the transpassive range a depletion of the film in Cr is observed (Figure 5). It has to be noted that there are indications of a bilayer structure of the transpassive film at this temperature which have not been
RESEARCH REPORT VTT-R-04098-07
14 (27)
taken into account in the present treatment. The fact that the films at 200°C are iron oxide-like in the whole range of investigated potentials is in agreement with the finding of Szklarska-Smialowska et al. [14] that the content of Cr in the oxides formed in simulated pressurized water reactor coolant passes through a minimum at that temperature. On the other hand, the passive film at 250°C (Figure 6) is strongly enriched in Cr, which seems to be in accordance with the fact that the rate of iron release from stainless steels at low potentials as estimated from thermodynamic calculations exhibits a maximum at this temperature [13]. Conversely, the transpassive film is impoverished in Cr and significantly enriched in Ni, being thinner than the passive film (a tentative explanation of that fact could be found in the increased stability of the nickel-rich phase in the oxide at that temperature). Also these features of the experimental data are correctly predicted by the model to a first approximation (Figure 6).
0 50 100 150 200 250 3000.0
0.1
0.2
0.3
0.4
0.5
0.6
0.7
0.8
yCr
yFe
yNi
y
distance from M/F interface / nm
-0.5 V
0 10 20 30 40 50 60 70 80 900.0
0.1
0.2
0.3
0.4
0.5
0.6
0.7
yCr
yFe
yNi
y Cr, y
Fe, y
Ni
distance from M/F interface / nm
-0.1 V
Figure 6. Experimental (points) and calculated (solid lines) depth profiles of the mass fractions of Fe,Cr and Ni in the films on AISI 316L (NG) for 72 h in 0.1 M Na2B4O7 at 250°C in the passive (left figure) and transpassive (right figure) range expressed vs. the position of the metal/film interface. Potentials given vs. SHE.
0 50 100 150 2000.0
0.1
0.2
0.3
0.4
0.5
0.6
0.7
0.8
yCr
yFe
yNi
y
distance from the M/F interface / nm
-0.7 V
300 °C
0 50 100 150 200 250 300 3500.0
0.1
0.2
0.3
0.4
0.5
0.6
0.7
0.8
-0.3 V yCr
yFe
yNiy
distance from the M/F interface / nm Figure 7. Experimental (points) and calculated (solid lines) depth profiles of the mass fractions of Fe,Cr and Ni in the films on AISI 316L (NG) for 72 h in 0.1 M Na2B4O7 at 300°C in the passive (left figure) and transpassive (right figure) range expressed vs. the position of the metal/film interface. The positions of the inner/ outer layer boundary indicated with vertical lines. Potentials given vs. SHE.
In contrast to the films formed at all potentials at 150 and 250°C and those in the passive range at 200°C, the films at 300°C exhibit a clear bilayer structure (Figure 7). In the passive range, the inner layer is once again somewhat enriched in Cr. On
RESEARCH REPORT VTT-R-04098-07
15 (27)
0.0
0.1
0.2
0.3
0.4
0.5
0.6
0.7
0.8
0.9
the other hand, in the transpassive regime, the inner layer is depleted in Cr and enriched in Ni, whereas the outer layer seems to contain mainly Ni and Fe. These findings point to an increased role of Ni in the oxide film on stainless steels at temperatures above 200°C, especially at potentials close to the passive-to-transpassive transition. The obtained results are also in accordance to the fact that the composition of the outer layer is based on a spinel of the trevorite (NiFe2O4) type since this phase exhibits the largest thermodynamic stability range in the relevant conditions [15]. In other words, the composition of the outer layer is determined by thermodynamic factors in PWR conditions, as discussed already earlier [5].
0 1000 2000 3000 4000 0 100 200 300 400 5000.0
0.1
0.2
0.3
0.4
0.5
0.6
0.7
0.8
0.9
0.00
0.05
0.10
0.15
0.20
0.25
0.30
10000 h
yCr
yFe
y Fe, y
Cr
distance from the M/F interface / nm
yN
i, yZn
yZn
yNi
10000 h
yFe
yCr
yNi
y
distance from the M/F interface / nm
Figure 8. Experimental (points) and calculated (solid lines) depth profiles of the mass fractions of Fe,Cr, Ni and Zn in the films formed on AISI 304 during a 10,000 h exposure to a simulated PWR water without (left figure) and with (right figure) the addition of 30 ppb of Zn at 260 °C. The inner layer / outer layer boundary indicated with a vertical line. Experimental data taken from Refs. 16 and 18.
Figure 8 shows the in-depth profiles of the oxides on AISI 304 formed during long term (10,000 h) exposure to simulated PWR water without and with the addition of Zn from the beginning of exposure at 260 °C (data taken from Refs. 16 and 18). Relatively thick films (600 – 4500 nm) are formed upon such exposures and they exhibit a typical bilayer structure. The inner layer has a composition close to chromite in which divalent Fe is partly substituted by Ni whereas the outer layer that of a non-stoichiometric trevorite. The extent of incorporation of Zn is substantial, especially in the inner layer (the mass fraction of Zn reaching ca. 0.10), indicating a very large enrichment factor of this cation in the oxide. The effect of Zn incorporation in the oxide is very pronounced, leading to a ca. 7-fold decrease of the thickness of the whole corrosion film and the inner layer and more than 8-fold decrease of the thickness of the outer layer. In addition, the concentrations of Cr and Ni in the inner layer formed in the presence of Zn are larger when compared to those in the inner layer formed in the absence of Zn. In order to predict quantitatively the depth profile of Zn from the coolant that is incorporated into the inner layer, we need to add the associated diffusion-migration equation for the non-steady state transport of Zn cation
2
2
2c c FED cDt x RT∂ ∂
= −∂ ∂ ∂
r
x∂ (4)
RESEARCH REPORT VTT-R-04098-07
16 (27)
to the system of equations (1) and solve the extended system subject to the boundary conditions (2). The boundary condition for Zn at the inner layer/outer layer interface is given by the enrichment factor of Zn defined as the ratio between the concentration of Zn at that interface and the Zn concentration in the water. A reflective boundary condition is used for Zn at the alloy / inner layer interface since there is no Zn present in the alloy substrate. The depth profile of Zn in the outer layer is predicted by solving the system of equations (3) extended with a corresponding equation for Zn:
2,
, 2,Zn OL Zn OL
Zn OL
y yD
t x∂ ∂
=∂ ∂
(5)
The boundary condition at the outer layer/water interface is set by the corresponding enrichment factor at that interface.
8 Validation of results Using the calculational procedure outlined above, the in-depth profiles of Fe, Cr and Ni in the films formed on AISI 316L(NG) by a 72 h oxidation in 0.1 M Na2B4O7 in a wide temperature and electrode potential ranges have been predicted. A summary of the boundary conditions at the alloy/inner layer and outer layer/electrolyte interfaces is given in Table 2.
Table 2. Summary of the boundary conditions at the alloy/inner layer and outer layer/electrolyte interfaces for the films on AISI 316L(NG) used in the calcula-tions as depending on the applied potential (vs. the RHE) and temperature.
yNi, OL/E 0.25 0.24 0.24 0.23 The calculated profiles are presented in Figure 4 - Figure 8 and are in good agreement with the experimental results. Therefore, the extracted parameter values can be considered reliable and are discussed below.
RESEARCH REPORT VTT-R-04098-07
17 (27)
The kinetic and transport parameters of the inner layer, namely the rate constants at the inner and outer interfaces and the diffusion coefficients of individual metallic constituents, estimated by the procedure outlined above, are shown in Figure 9 - Figure 11 in Arrhenius co-ordinates. The values of the apparent activation energies and pre-exponential factors were calculated from the equations
, /
/0,
( )
( )
A ki
i
Di
E RTk
E RTi
k T A e
D T D e
−
−
=
= (6)
and listed in Table 3 and Table 4. In these figures, the potential is expressed vs. the reversible hydrogen electrode (RHE) at the respective temperature in order to enable the direct comparison of obtained estimates at different temperatures.
1.7 1.8 1.9 2.0 2.1 2.2 2.3 2.40.60.8
1
2
4
68
10
20
0.2 V 0.4 V 0.6 V 0.8 V
1011
k1
Ni /
cm
4 mol
-1 s
-1
103 T-1 / K-1
1.7 1.8 1.9 2.0 2.1 2.2 2.3 2.41
2
4
68
10
20
40
0.2 V 0.4 V 0.6 V 0.8 V
1011
k1F
e / cm
4 mol
-1 s
-1
103 T-1 / K-1
1.7 1.8 1.9 2.0 2.1 2.2 2.3 2.4
5
10
15
20 0.2 V 0.4 V 0.6 V 0.8 V
1011
k1C
r / cm
4 mol
-1 s
-1
103 T-1 / K-1
Figure 9. Temperature dependence of the rate constants for individual metal constituents at the alloy/inner layer interface at different potentials expressed vs. the RHE at the respective temperature: a) Cr, b) Fe, c) Ni.
Table 3. Apparent activation energies of the kinetic and transport parameters of inner layer growth.
E vs. RHE / V 0.2 V 0.4 V 0.6 V 0.8 V EA, k1Fe / kJ mol-1
E vs. RHE / V 0.2 V 0.4 V 0.6 V 0.8 V EDFe / kJ mol-1 48 53 51 53 EDNi / kJ mol-1 48 55 53 27 EDCr / kJ mol-1 42 53 48 30
Table 4. Pre-exponential factors of the kinetic and transport parameters of inner layer growth.
E vs. RHE / V 0.2 V 0.4 V 0.6 V 0.8 V lg (A, k1Fe / cm4 mol-1s) 4.472 4.576 4.241 4.241 lg (A, k1Ni / cm4 mol-1s) 3.226 4.202 3.287 3.525 lg (A, k1Cr / cm4 mol-1s) 2.945 3.312 2.938 3.131 lg (A, k3Fe / cm s-1) 4.278 4.418 2.576 3.622 lg (A, k3Ni / cm s-1) 4.646 4.129 2.153 1.813 lg (A, k3Cr / cm s-1) 2.925 2.167 5.102 5.294 lg (D0,Fe / cm2 s-1) 5.898 7.106 5.912 6.070 lg (D0, Ni / cm2 s-1) 6.069 6.543 6.395 3.671 lg (D0,Cr / cm2 s-1) 5.049 6.205 5.599 3.900
1.7 1.8 1.9 2.0 2.1 2.2 2.3 2.40.1
0.2
0.40.60.8
1
2
4
68
10 0.2 V 0.4 V 0.6 V 0.8 V
1011
k3
Ni /
cm s
-1
103 T-1 / K-1
1.7 1.8 1.9 2.0 2.1 2.2 2.3 2.40.060.080.1
0.2
0.40.60.8
1
2
468
10
0.2 V 0.4 V 0.6 V 0.8 V
1011
k3F
e / c
m s
-1
103 T-1 / K-1
1.7 1.8 1.9 2.0 2.1 2.2 2.3 2.40.60.8
1
2
468
10
20
406080
100
0.2 V 0.4 V 0.6 V 0.8 V
1011
k3C
r / cm
s-1
103 T-1 / K-1
a
b
c
Figure 10. Temperature dependence of the rate constants for individual metal constituents at the inner layer/solution interface at different potentials expressed vs. the RHE at the respective temperature: a) Cr, b) Fe, c) Ni.
RESEARCH REPORT VTT-R-04098-07
19 (27)
The following main conclusions can be drawn based of the parameter values: • The kinetic parameters at the alloy/inner layer interface are almost independent on applied potential which justifies the assumption made in our previous works [5-8] that the potential drop at this interface is at best weakly dependent on the external potential (Figure 9). The values of the rate constants k1,i are the largest for Fe and the smallest for Ni, especially at the higher temperatures. This calculational result is in agreement with the fact that Ni oxidation proceeds much slower than that of the other two constituents which is often expressed as enrichment of Ni at the inner layer/ alloy interface. The rate constants exhibit apparent activation energies of ca. 25 - 35 kJ mol-1 which are in broad agreement with what has been calculated earlier by us based on electrochemical impedance spectroscopic data for the same steel in a similar electrolyte solution and temperature range [5].
1.7 1.8 1.9 2.0 2.1 2.2 2.3 2.40.40.60.8
1
2
468
10
20
4060 0.2 V
0.4 V 0.6 V 0.8 V
1018
DNi
/ cm
2 s-1
103 T-1 / K-1
1.7 1.8 1.9 2.0 2.1 2.2 2.3 2.40.1
0.2
0.40.60.81
2
468
10
20
406080
0.2 V 0.4 V 0.6 V 0.8 V
1018
DFe
/ cm
2 s-1
103 T-1 / K-1
1.7 1.8 1.9 2.0 2.1 2.2 2.3 2.4
0.40.60.8
1
2
468
10
20 0.2 V 0.4 V 0.6 V 0.8 V
1018
DC
r / cm
s-1
103 T-1 / K-1
a
b
c
Figure 11. Temperature dependence of the diffusion coefficients for individual metal constituents at different potentials expressed vs. the RHE at the respective temperature: a) Cr, b) Fe, c) Ni.
• The kinetic parameters at the inner layer/electrolyte interface are more significantly affected by the applied potential, their evolution with this parameter being to a certain extent non-monotonous (Figure 10). In the passive range, the rate constants involving Cr exhibit the lowest values i.e. the chromium dissolution reaction at the inner layer/electrolyte interface is the slowest, in accordance to the well-known fact of Cr enrichment in the inner layer. Conversely, the rate constants of the iron dissolution reaction are the highest indicating an agreement with the fact that iron is mainly dissolving through the inner layer and subsequently re-depositing to form the outer layer, especially at the highest temperatures (given the fact that its solubility decreases with temperature). The
RESEARCH REPORT VTT-R-04098-07
20 (27)
values of the rate constants agree within the order of magnitude with the mean values of the respective rate constants of dissolution of interstitial cations and generation of cation vacancies via cation ejection in the electrolyte estimated earlier on the basis of impedance data [5]. In the transpassive range, the rate constants for Cr dissolution increase significantly also in accordance to the well-known fact that the main part of the corrosion release in this region is due to the leaching of hexavalent Cr into the electrolyte. Conversely, the rate constants for dissolution of Fe and Ni are smaller in the transpassive range, indicating a lower solubility of Fe(III) and Ni(II) from the inner layer in such conditions. The apparent activation energies for the reactions at the inner layer/solution interface are somewhat larger than those at the inner interface especially in the passive range. As the differences are rather small, given the uncertainty associated with these values, they will not be commented further.
1.7 1.8 1.9 2.0 2.1 2.2 2.3 2.420
30
40
50
60
70
80
0.2 V 0.4 V 0.6 V 0.8 V
E /
kV c
m-1
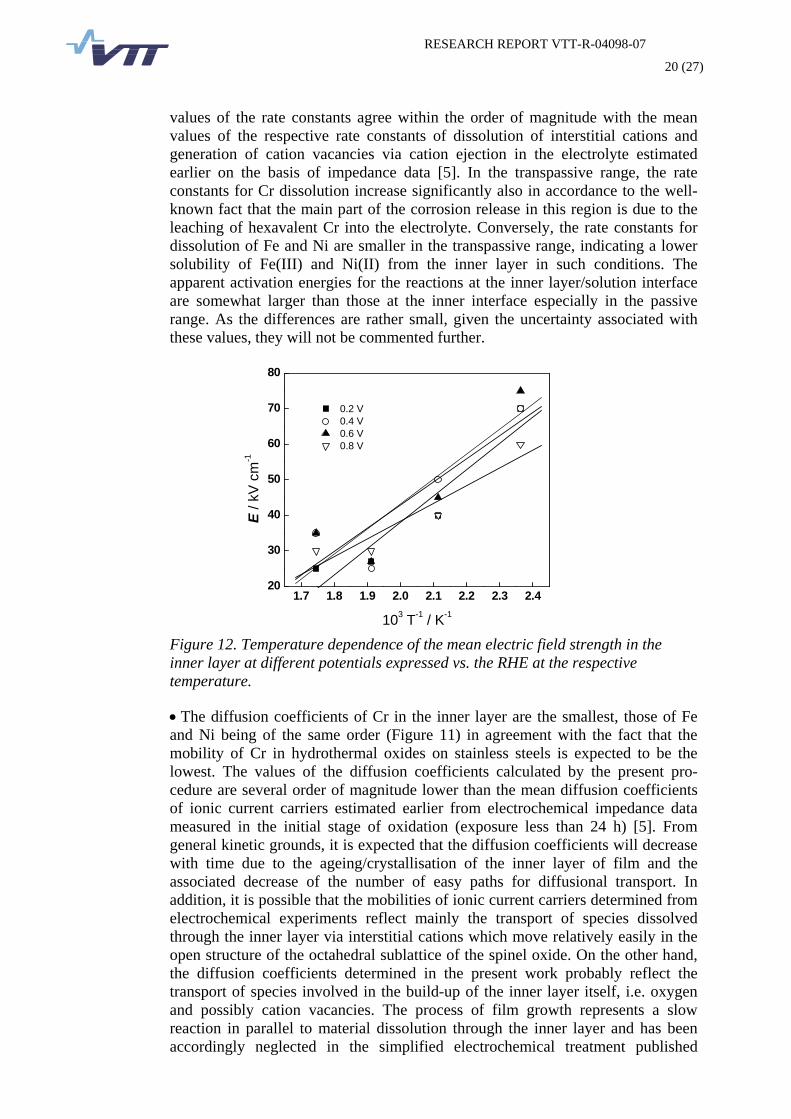
103 T-1 / K-1 Figure 12. Temperature dependence of the mean electric field strength in the inner layer at different potentials expressed vs. the RHE at the respective temperature.
• The diffusion coefficients of Cr in the inner layer are the smallest, those of Fe and Ni being of the same order (Figure 11) in agreement with the fact that the mobility of Cr in hydrothermal oxides on stainless steels is expected to be the lowest. The values of the diffusion coefficients calculated by the present pro-cedure are several order of magnitude lower than the mean diffusion coefficients of ionic current carriers estimated earlier from electrochemical impedance data measured in the initial stage of oxidation (exposure less than 24 h) [5]. From general kinetic grounds, it is expected that the diffusion coefficients will decrease with time due to the ageing/crystallisation of the inner layer of film and the associated decrease of the number of easy paths for diffusional transport. In addition, it is possible that the mobilities of ionic current carriers determined from electrochemical experiments reflect mainly the transport of species dissolved through the inner layer via interstitial cations which move relatively easily in the open structure of the octahedral sublattice of the spinel oxide. On the other hand, the diffusion coefficients determined in the present work probably reflect the transport of species involved in the build-up of the inner layer itself, i.e. oxygen and possibly cation vacancies. The process of film growth represents a slow reaction in parallel to material dissolution through the inner layer and has been accordingly neglected in the simplified electrochemical treatment published
RESEARCH REPORT VTT-R-04098-07
21 (27)
earlier. Indeed, if the time constant of the transport process is represented in analogy to the treatment in Ref. 5 as τ = (2K2 D)-1 with /K FE RT , using the estimates from
=r
Figure 11 and Figure 12 leads to values of τ greater than 200 ks. In other words, this time constant would appear in the impedance spectra in the µHz range and is thus not accessible in the normal time scale of the measurements. • The apparent activation energies of the diffusion coefficients of individual constituents are of the order of 45-55 kJ mol-1 (or 0.45-0.55 eV) indicating that the mechanism involves grain boundaries or analogous high energy short circuit paths through the inner layer, since the diffusion coefficients for lattice diffusion are normally considerably larger. As the inner layer is most probably nanocrystalline [19], the fraction of grain boundaries in it is rather large. The dimensions of the grain boundaries become comparable to those of the grains, and thus a significant fraction of the atoms lie in the disordered region of the boundaries and can be expected to contribute to the conductivity [20]. For such geometries, a grain boundary conductivity which differs by several orders of magnitude greater from that in the bulk will translate into a similar alteration in the overall ionic conductivity of the specimen [19,20]. • The field strength in the inner layer is almost independent on the applied potential which justifies the assumption of the MCM and the Point Defect Model that the space charge due to ionic defects is effectively screened by the associated electronic defects [5-8,11,12]. In accordance to the previous calculations based on impedance data [5], the field strength in the inner layer decreases quasi-linearly with increasing temperature, well in accordance with the validity of the low-field limit of the transport equations confirming the basic hypothesis of the model in that temperature range. The estimates of the field strength are ca. a factor of 2 smaller than those listed in Ref. 5. This may indicate that either the field strength in the inner layer decreases with the time of oxidation due to ageing and recrystallisation of the film, or that the values given in our previous work are more characteristic of the barrier layer at the alloy/film interface than of the whole inner layer. In that respect, as discussed also in the Introduction, it is useful to underline that the model proposed in Ref. 5 regarded the film as composed of a very thin barrier-like semiconductor layer adjacent to the alloy interface and a much thicker outer layer that was supposed to be formed by re-precipitation of cations dissolving through the barrier layer. In the present treatment, the barrier layer is in fact neglected and it is instead assumed that a substantial part of the whole film (the inner layer) grows via solid state diffusion-migration, whereas the remaining part is formed by re-precipitation. Indeed, attempts to discuss the oxide on stainless steels in high-temperature water as consisting of four layers have been published in the literature [21,22], and the present treatment can be regarded as a simplified versions of such concepts.
Table 5. Apparent diffusion coefficients of the individual metallic constituents in the outer layer at 300 °C.
• The values of the apparent diffusion coefficients in the outer layer of the oxide at 300°C (Table 5) are close to those estimated from the interpretation of mass gain and/or thickness vs. time data for oxidation of stainless steel in nuclear power
RESEARCH REPORT VTT-R-04098-07
22 (27)
plant coolants at comparable temperatures based on a parabolic growth law [1,2,23]. Their variation with potential is negligible which supports the hypothesis that the potential drop in the outer layer can be omitted from the simplified approach outlined in the present paper. Since the bilayer structure of the oxide film was evident only at a temperature of 300°C, the activation energies for the transport in the outer layer could not be determined at this stage. The values of the apparent diffusion coefficients for Fe and Cr are quite similar to each other, and those for Ni are significantly lower indicating that nickel is retained in the outer layer phase enhancing its stability and leading its stoichiometry towards that of trevorite.
The proposed model was also employed to predict the depth profiles of the oxides formed on AISI 304 during a 10,000 h exposure to a simulated PWR water with or without the addition of Zn (Figure 8) using the boundary conditions listed in Table 6. The parameter values calculated from the comparison of the model predictions and the experimental results for those oxides are collected in Table 7.
Table 6. Summary of the boundary conditions at the alloy/inner layer and outer layer/electrolyte interfaces for the films on AISI 304 in simulated PWR water. The boundary condition for Zn at the inner layer/outer layer interface is also included.
Table 7. Kinetic and transport parameters of the individual metallic constituents of the oxide formed on AISI 304 during 10,000 h exposure to simulated PWR water with or without the addition of 30 ppb Zn at 260°C.
Parameter no Zn 30 ppb Zn 1011 k1,Cr / cm4 mol-1s-1 7.0 0.85 1011k1,Fe / cm4 mol-1s-1 3.5 1.0 1011k1,Ni / cm4 mol-1s-1 1.0 0.18 1011k3,Cr / cm s-1 2.1 0.80 1011k3,Fe / cm s-1 2.4 2.5 1011k3,Ni / cm s-1 2.2 1.0 Er
The effect of Zn in suppressing the growth of the inner layer of the film is expressed through the substantial decrease of the values of the rate constants parameters at both the alloy/inner layer and inner layer/electrolyte interface. The diffusion coefficients of individual species in the inner layer are also considerably lower in the presence of Zn. It is worthwhile to mention that the values of the diffusion coefficients of the inner layer in the absence of Zn are much lower in the present case (10,000 h oxidation) when compared to the case treated above (72 h oxidation). This fact points to a decrease of the conductive paths in the inner layer of the oxide during growth and remains to be modelled quantitatively since the microstructure of the layers has not been taken into account in the present version of the model. The apparent diffusion coefficients of individual species during the outer layer growth are also substantially lower in the presence of Zn. This fact can be tentatively explained by assuming that the incorporation of Zn in the layers occurs via sequential filling and emptying of available empty cation interstices and/or cation vacancies: Mi
•• → Mx+aq + Vi + (x-2)e´ (7)
(dissolution of a divalent cation, Fe or Ni, and creation of an empty interstice) Vi + Zn2+
aq → Zn i•• (8)
(incorporation of a foreign cation in that interstice) MIII
M → My+aq
+ VM´´´ + (y-3)e´ (9)(dissolution of a trivalent cation, e.g. Fe or Cr, and creation of a cation vacancy) VM´´´ + Zn2+
aq → Zn ́M (10)(incorporation of a Zn by filling the vacancy) According to the MCM, divalent interstitial cations are generated at the alloy / barrier layer interface
m → Mi
•• + 2em + Vm
transported outward through the layers and consumed by reaction (7). On the other hand, cation vacancies generated by reaction (9) are transported inward and consumed at the alloy / barrier layer interface generating normal lattice positions
VM´´´ + m → MM + 2em + Vm
Thus the incorporation of Zn in a lattice vacancy at the inner layer / coolant interface will slow down the transport of cation vacancies in the inner layer by acting as an additional sink at their source. On the other hand, the incorporation of Zn in an interstice will slow down the transport of interstitial cations by acting as an additional sink of such cations at the inner layer / outer layer or outer layer/coolant interfaces. Either way, the incorporation of Zn will slow down the solid state point defect transport in the oxide by decreasing the concentration of point defects.
RESEARCH REPORT VTT-R-04098-07
24 (27)
9 Conclusions The basic approach presented in this report is focused on the inner compact layer of oxide having a uniform composition. Although there are some observations that the absence of a pronounced outer oxide layer will enhance the overall alloy corrosion rate, it can be safely assumed that the overall alloy corrosion rate is limited by the rates of the net processes in this inner layer. The importance of the oxide film on stainless steels in LWRs is, however, not limited to the formation, growth, and stability of the compact layer. The outer layer is not considered to be part of the passivating oxide film, although that layer may be important in order to prevent direct chemical attack of the protective inner layer in oxidising environments in which transpassive corrosion processes take place. The outer layer is a result of the interaction of the environment with the oxide film. This interaction is of utmost importance for the modelling of the activity build-up. The pick-up and release of radioactive nuclides (and other ions) will depend on the diffusion from the outer oxide surface into the material. The surface concentration of such species will be a function of their concentration in the water, the extent of surface complexation, and the transport rate into the material. The results described in the present report indicate that the proposed framework can serve as a modelling approach to the incorporation of electrolyte-originating species in both the outer and inner layers. This has been demonstrated by successfully predicting both the depth profiles of the main constituent elements, Fe,Cr and Ni, and the corresponding profile of an electrolyte originating species, Zn, incorporated during long-term growth of the oxide on stainless steel in simulated PWR water. The next step of this investigation is to attempt at calculating the kinetic and transport parameters of such minor species in short-term experiments in order to test the ability of the proposed model approach to predict the initial stages of their incorporation and the effects of this process on the film growth and restructuring.
10 Summary A quantitative procedure of determination of kinetic and transport parameters for individual alloy constituents during anodic film growth on stainless steels in light reactor water is developed. It is based on in-depth compositional data for oxides obtained from ex-situ analyses using Auger Electron Spectroscopy and X-ray photoelectron spectroscopy. The growth of the inner compact layer is described as a sequence of interfacial reactions and transport driven by homogeneous diffusion-migration mechanism. Based on the Mixed-Conduction Model (MCM) for oxide films, a fitting procedure for the calculation of the in-depth distribution of the individual alloy constituents in the inner layer is put forward. The effects of temperature and applied potential on the kinetic and transport parameters in the inner layer are assessed. In addition, the growth of an outer layer consisting of crystallites with pores filled with electrolyte in between is described formally as a diffusion process and the transport parameters characterising this process are estimated. The estimates of the kinetic and transport parameters obtained are discussed in relation to the corrosion mechanism of the steel and the incorporation of electrolyte-originating species in the bilayer oxide film. Using the proposed quantitative procedure, the kinetic and transport parameters of long-term (up to
RESEARCH REPORT VTT-R-04098-07
25 (27)
10, 000 h) film growth and restructuring on AISI 304 stainless steel in simulated PWR water with or without zinc addition are also estimated on the basis of a quantitative comparison of the model predictions and literature data on the in-depth concentration profiles of the constituent elements. The obtained values are discussed in terms of the effect of Zn on the growth rate of the inner and outer layers of the corrosion film.
11 Nomenclature Aki pre-exponential factors of the temperature dependence of the rate
constants, i=1Fe,1Ni,1Cr,3Fe,3Ni, 3Cr, cm4 mol-1 s-1 or cm s-1
DCr diffusion coefficient of Cr in the inner layer, cm2 s-1
DCr,OL apparent diffusion coefficient of Cr in the outer layer, cm2 s-1 DFe diffusion coefficient of Fe in the inner layer, cm2 s-1 DFe,OL apparent diffusion coefficient of Fe in the outer layer, cm2 s-1 DNi diffusion coefficient of Ni in the inner layer, cm2 s-1 DNi,OL apparent diffusion coefficient of nickel in the outer layer, cm2 s-1
DO,i pre-exponential factors of the temperature dependence of the diffusion coefficients in the inner layer, i=Fe,Ni,Cr, cm2 s-1
EA,k1Cr apparent activation energy of the rate constant k1,Cr, J mol-1
EA,k1Fe apparent activation energy of the rate constant k1,Fe, J mol-1 EA,k1Ni apparent activation energy of the rate constant k1,Ni, J mol-1 EA,k3Cr apparent activation energy of the rate constant k3,Cr, J mol-1
EA,k3Fe apparent activation energy of the rate constant k3,Fe, J mol-1 EA,k3Ni apparent activation energy of the rate constant k3,Ni, J mol-1 EA,DCr apparent activation energy of DCr, J mol-1
EA,DFe apparent activation energy of DFe, J mol-1 EA,DNi apparent activation energy DNi, J mol-1 Er
field strength in the inner layer, V cm-1 F Faraday number, 96487 C mol-1
k1,Cr rate constant of oxidation of Cr at the alloy/inner layer interface, cm4 mol-1 s-1
k1,Fe rate constant of oxidation of Fe at the alloy/inner layer interface, cm4 mol-1 s-1
k1,Ni rate constant of oxidation of Ni at the alloy/inner layer interface, cm4 mol-1 s-1
k3,Cr rate constant of dissolution of Cr at the inner layer/electrolyte interface, cm s-1
k3,Fe rate constant of oxidation of Fe at the inner layer/electrolyte interface, cm s-1
k3,Ni rate constant of oxidation of Ni at the inner layer/electrolyte interface, cm s-1
L inner layer thickness, cm R universal gas constant, 8.314 J mol-1 K-1 T temperature, K Vm,MO molar volume of the phase in the inner layer, cm3 mol-1
X formal valency state of Fe in the inner layer yCr mass fraction of Cr in the oxide normalised to the total mass
fraction of cations
RESEARCH REPORT VTT-R-04098-07
26 (27)
yFe mass fraction of Fe in the oxide normalised to the total mass fraction of cations
yNi mass fraction of Ni in the oxide normalised to the total mass fraction of cations
yZn mass fraction of Zn in the oxide normalised to the total mass fraction of cations
yCr,a mass fraction of Cr at the alloy/oxide interface yFe,a mass fraction of Fe at the alloy/oxide interface yNi,a mass fraction of Ni at the alloy/oxide interface yCr,OL/E mass fraction of Cr at the outer layer/electrolyte interface
normalised to the total mass fraction of cations yFe,OL/E mass fraction of Fe at the outer layer/electrolyte interface
normalised to the total mass fraction of cations yNi,OL/E mass fraction of Ni at the outer layer/electrolyte interface
normalised to the total mass fraction of cations yZn,OL/E mass fraction of Zn at the outer layer/electrolyte interface
normalised to the total mass fraction of cations
12 References 1. H.-P. Hermansson, M. Stigenberg and G. Wikmark, in Water Chemistry of
Nuclear Reactor Systems 7, London: British Nuclear Energy Society, 1996, p.141.
2. K. Lundgren, T. Kelen, M. Gunnarsson and E. Ahlberg, in CHIMIE 2002, "La chimie de l'eau dans les réacteurs nucléaires -Optimisation de l'exploita-tion et développements nouveaux", 22-26 April, 2002, Avignon, France (CD-ROM publication).
3. K. Lundgren, H. Wijkström, and G. Wikmark, in Proc. International Conference "Water Chemistry of Nuclear Reactor Systems", San Francisco, CA, Oct. 11-14, 2004, Paper 2-14 (CD-ROM publication).
4. B. Stellwag, Corros. Sci., 40, 337 (1998). 5. M. Bojinov, P. Kinnunen, K. Lundgren, and G. Wikmark, J. Electrochem.
Soc., 152, B250 (2005). 6. B. Beverskog, M. Bojinov, P. Kinnunen, T. Laitinen, K. Mäkelä and
T. Saario, Corros. Sci., 44, 1923 (2002). 7. M. Bojinov, P. Kinnunen and G. Sundholm, Corrosion, 59, 91 (2003). 8. I. Betova, M. Bojinov, P. Kinnunen, K. Mäkelä and T. Saario,
J. Electroanal. Chem., 572, 211 (2004). 9. L. Zhang and D.D. Macdonald, Electrochim. Acta, 43 (1998) 2661. 10. L. Zhang and D.D. Macdonald, Electrochim. Acta, 43 (1998) 2673. 11. D.D. Macdonald, J. Electrochem. Soc., 139, 3434 (1992). 12. D.D. Macdonald, J. Pure Appl. Chem., 71, 951 (1999). 13. M. Bojinov, P. Kinnunen, K. Lundgren, and G. Wikmark, “Characterisation
and modelling of oxide films on stainless steels and nickel alloys in light water reactors”, Research Report BTUO73-041285, VTT Technical Research Centre of Finland, Ch. 7, p. 119.
14. Z. Szklarska-Smialowska, K. Chou and Z. Xia, Corros. Sci., 32, 609 (1992). 15. B. Beverskog, I. Puigdomenech, Corrosion, 55, 1077 (1999). 16. M. Bojinov, P. Kinnunen, T. Laitinen, K. Mäkelä, M. Mäkelä, T. Saario and
P. Sirkiä, Corrosion 57, 387 (2001).
RESEARCH REPORT VTT-R-04098-07
27 (27)
17. S.E. Ziemniak and M. Hanson, Corros. Sci., 44, 2209 (2002). 18. S.E. Ziemniak and M. Hanson, Corros. Sci. 48,2525 (2006) 19. J. Philibert, Solid State Ionics, 117, 7 (1999). 20. J. Maier, Progr. Solid State Chem., 23, 171 (1995). 21. B. Beverskog, in Proc. International Conference "Water Chemistry of
Nuclear Reactor Systems", San Francisco, CA, October 10-14, 2004, Paper 2.7 (CD-ROM publication).
22. M. Bojinov and B. Beverskog, in Passivation of Metals and Semi-conductors, and Properties of Thin Oxide Films, P. Marcus, V. Maurice, Eds., Elsevier, 2006, pp. 431-436.
23. Y. Hemmi, Y. Uruma and N. Ichikawa, J. Nucl. Sci. Technol., 31, 443 (1994).