MIXED IONIC AND ELECTRONIC CONDUCTING ELECTRODE
STUDIES FOR AN
ALKALI METAL THERMAL TO ELECTRIC CONVERTER
A Dissertation
by
YUYAN GUO
Submitted to the Office of Graduate Studies of Texas A&M University
in partial fulfillment of the requirements for the degree of
DOCTOR OF PHILOSOPHY
December 2006
Major Subject: Chemistry
MIXED IONIC AND ELECTRONIC CONDUCTING ELECTRODE
STUDIES FOR AN
ALKALI METAL THERMAL TO ELECTRIC CONVERTER
A Dissertation
by
YUYAN GUO
Submitted to the Office of Graduate Studies of Texas A&M University
in partial fulfillment of the requirements for the degree of
DOCTOR OF PHILOSOPHY
Approved by: Co-Chairs of Committee, Timothy R. Hughbanks Michael Schuller Committee Members, Manuel P. Soriaga
David W. Goodman Head of Department, Emile A. Schweikert
December 2006
Major Subject: Chemistry
iii
ABSTRACT
Mixed Ionic and Electronic Conducting Electrode Studies for an Alkali Metal Thermal
to Electric Converter. (December 2006)
Yuyan Guo, B.S., University of Science & Technology, Beijing;
M.S., University of Science & Technology, Beijing
Co-Chairs of Advisory Committee: Dr. Timothy R. Hughbanks Dr. Michael Schuller
This research focuses on preparation, kinetics, and performance studies of mixed
ionic and electronic conducting electrodes (MIEE) applied in an alkali metal thermal to
electric converter (AMTEC). Two types of MIEE, metal/sodium titanate and metal/β″-
alumina were investigated, using Ni, Cu, Co and W as the metal components. Pure metal
electrodes (PME) were also studied, including Ta, Ni, Nb, Ir, W and MoRe electrodes.
The stability of MIEE/β′′-alumina solid electrolyte (BASE) interface was studied in
terms of the chemical potential of Na-Al-Ti-O system at 1100K (typical AMTEC
operating temperature). Ni metal was compatible with sodium titanate and BASE and
displayed the best initial performance among all tested PMEs. Ni/sodium titanate
electrodes with 4/1 mass ratios of metal/ceramic performed best among all tested
electrodes. Scanning Electron Microscope (SEM) observations showed that grain
agglomeration, which is the main mechanism for electrode degradation, occurred in all
tested electrodes. Ceramic components were able to effectively limit the growth of
metal grains and resulted in a long lifetime for MIEEs. Ni particles in the MIEE formed
iv
a network microstructure that was close to the theoretical morphology of the ideal
electrode. A model based on percolation theory was constructed to interpret and predict
the performance of MIEEs.
The electrode kinetics was studied and a theoretical expression for the interface
impedance was derived for both PME and MIEE, using electrochemical impedance
spectroscopy (EIS). The conductivity of the Na2Ti3O7 and Na2Ti6O13 mixture was
measured. The average activation energy for the bulk conductivity was 0.87ev. Finally,
theoretical analysis clarified that the transfer coefficient α value change would cause at
most a few percent change in the electrode performance parameter B.
vi
ACKNOWLEDGMENTS
I would like to thank my research advisor Dr. Michael Schuller for providing me the
opportunities and environment for performing good research and in particular for his
guidance and support throughout the period of my studies.
I would also like to thank Dr. Hughbanks for his advice on research attitude and
scientific integrity, as well as the time and effort he devoted to me. I greatly appreciate
Dr. Guillemette for his patience and guidance on the electron microprobe usage.
I would like to acknowledge my colleagues and friends, Scott Coughlin, Tejas Shah,
Chunsheng Wang, Xiaole Chen, Jack Baricuatro, Li Zhu, Jingyi Shen and Liang Zhao,
for their help, kindness and encouragement.
Finally, I would like to thank my parents and sister, for their unwavering love,
support and encouragement throughout my life. It is to them that I owe many of my
accomplishments.
vii
TABLE OF CONTENTS Page
ABSTRACT…………………………………………………………………………. iii
DEDICATION………………………………………………………………………. v
ACKNOWLEDGMENTS…………………………………………………………… vi
TABLE OF CONTENTS……………………………………………………………. vii
LIST OF FIGURES…………………………………………………………………. ix
LIST OF TABLES.…………………………………………………………………. xiv
CHAPTER
I INTRODUCTION………………………………………………………… 1
1.1. Motivation….………………………………………………………... 2 1.2. Alkali Metal Thermal to Electrical Conversion……………………... 2 1.3. β″-alumina Solid Electrolyte(BASE)………………………………... 6 1.4. Key Issues in AMTEC Performance Operation…………………....... 12 1.5. AMTEC Electrode Studies………………………………………….. 15 1.6. Sodium Titanate Materials…………………………………………... 19 1.7. Objective…………………………………………………………….. 22
II EXPERIMENTAL………………………………………………………... 24
2.1 Experimental Apparatus…………………………………………….. 24 2.2 Techniques …………………………………………………………. 27
III PREPARATION OF MIXED IONIC AND ELECTRONIC ELECTRODES…………………………………… 41
3.1 Introduction…………………………………………………………. 41 3.2 Experimental………………………………………………………... 48 3.3 Results and Discussion...…………………………………………… 50 3.4 Summary and Conclusions……………………………………….… 84
viii
CHAPTER Page
IV KINETIC STUDIES OF MIXED IONIC AND ELECTRONIC ELECTRODES…………………………………….. 87
4.1 Introduction…………………………………………………………... 87 4.2 Experimental…………………………………………………………. 87 4.3 Results and Discussion………………………………………………. 89 4.4 Summary and Conclusions…………………………………………... 117
V PERFORMANCE STUDIES OF MIXED IONIC AND ELECTRONIC ELECTRODES………………………..…………... 119
5.1 Introduction………………………………………………………….. 119 5.2 Experimental………………………………………………………… 121 5.3 Results and Discussion………………….…………………………... 122 5.4 Summary and Conclusions………………………………………….. 168
VI FINDINGS AND CONCLUSIONS………………………………………. 170
REFERENCES……………………………...………………………………………. 173
APPENDIX A……………………………………………………………………...... 182
APPENDIX B………………………………………………………………………... 189
VITA………………………………………………………………………………… 193
ix
LIST OF FIGURES
FIGURE Page
1.1. Schematic diagram of AMTEC……………………………………………. 3
1.2. Picture of AMTEC cell with 7 BASE tubes ………………………………. 6
1.3. Ideal crystal structure of β-alumina and β″-alumina………………………. 7
1.4. Site model of conduction plane of β″-alumina……………………………. 9
1.5. Crystal structure of Na2Ti3O7……………………………………………… 21
2.1 Schematic drawing of the sodium exposure text cell……………………… 26
2.2 (a) Charge transfer electrochemical process. (b) Randles’ equivalent circuit. (c) responded electrochemical impedance spectrum, Nyquist plot and (d) Bode plots…………………………..…………….…. 28
2.3 Pathway of a general electrochemical process…………………………… 32
2.4 Equipment of electrochemical impedance spectrum. 1.electrochemical interface(ECI) 2.frequency response analyzer (FRA) 3.computer and software……..………………... 33
2.5 Schematic drawing of the sputtering process.…………………………..… 37
2.6 Schematic diagram of the Coulter counter…………………..……………. 40
3.1 Schematic diagram of SETC electrodes…….…………………………..… 49
3.2 Chemical potential diagrams for (a) the Na-Al-O system. (b) the Na-Ti-O system at 1100K………..………………..………………. 54
3.3 Chemical potential diagrams for the Na-Al-Ti-O system at 1100K…........ 57
3.4 Impedance spectra for different tested metal electrodes, at 850oC electrode temperature and 285oC pool temperature…………….……….... 61
3.5 Impedance spectra change with experiment time for a Ta electrode……... 61
x
FIGURE Page
3.6 a) Series resistance Rs and b) apparent charge transfer resistance Ract change with experiment time for tested metal electrodes …………….. 62
3.7 Scanning electron microscope images for Ir, Ta, Nb and Ni electrodes………………………………….………... 65
3.8 Impedance spectra of Ni/sodium titanate electrodes with different Ni/sodium titanate mass ratios…………………...…………. 67
3.9 a) Series resistance Rs and b) apparent charge transfer resistance Ract change with time for Ni/sodium titanate electrodes with the mass ratios of 2/1, 3/1 and 4/1………………………………….… 68
3.10 Microstructure of Ni/sodium titanate electrode with the mass ratios of 4/1, after testing in a SETC over 60 days…………………... 70
3.11 Scheme of the mixed ionic and electronic electrode, and different types of clusters formed by the particles…………………………. 72
3.12 The percolation thresholds of the ionic and electronic conductors within the electrode as a function of particle size ratio……………………. 76
3.13 The particle size distribution of milled sodium titanate powder…………... 78
3.14 SEM image of the Ni/sodium titanate electrode with 4/1 mass ratios after tested in the SETC over 60 days…………………….. 78
3.15 Schematic of contact area between ionic and electronic particles………… 80
3.16 Calculated reaction area vs. volume fraction of metal. The packing density ε is set at 0.61 and the contact angle θ is set at 15o……………………………………………. 81
3.17 The particle distribution of Ni and sodium titanate mixture with the mass ratios of 4:1. The Ni particle purchased is 5-15μm…………………. 83
4.1 Scheme of the experimental cell for sodium titanate conductivity measurements……………………………………………….. 88
4.2 X-ray diffraction pattern of raw sodium titanate powder…………………. 89
xi
FIGURE Page
4.3 Impedance spectra of sodium titanate measured at different temperature. (a) full spectra measured at 614 and 672K. (b) high frequency part. (c) full spectrum measured at 1068K. (d) Bode plot measured at 1068K………………………………………….. 91
4.4 Equivalent circuit for the impedance spectrum of sodium titanate ionic conductor………………………………………….… 93
4.5 Arrhenius plots of bulk and total conductivities for sodium titanate…….… 95
4.6 Crystal structures of Na2Ti3O7 and Na2Ti6O13 sodium titanates…………... 98
4.7 Impedance spectra of Ni electrode measured at 850oC. The solid diamonds (♦) represent the experimental data; the open triangles (Δ) are calculated using the equivalent circuit in Figure 4.8; the two semicircles are the theoretical impedance spectra of equivalent circuits of charge transfer and sodium transport impedance respectively…………………………..…. 100
4.8 Equivalent circuit for interpreting and fitting the electrochemical spectrum of a Ni electrode…………..…………….…. 100
4.9 The changes of series resistance Rs, charge transfer resistance Rct and diffusion resistance Rd with experiment time for a Ni electrode…………….………………………….. 101
4.10 Schematic representation of the electrode reaction process………………. 103
4.11 Arrhenius plot for sodium transport in the Ni electrode at SETC conditions………..………………………………………………. 109
4.12 Impedance spectra of different MIEEs………………..…………………... 110
4.13 Cathode Tafel plot for Ni/sodium titanate electrode with 4/1 mass ratios……………………………………………………….. 116
5.1 a) The impedance spectra of TiN electrodes. b) B value versus experiment time………………………...………….…… 123
5.2 a) The impedance spectra of W/β′′-alumina electrode with W/β′′ ratios of 3/1. b) B value versus experiment time…………………… 125
xii
FIGURE Page
5.3 SEM images of W/β′′-alumina sample with W/β′′ ratios of 3/1 before testing in the SETC……………..………………..…… 126
5.4 a) The impedance spectra of Cu/β′′-alumina sample with Cu/β′′ ratio of 1/1. b) The impedance spectrum measured on t-to=7d, and its deconvoluted spectra for charge transfer and sodium transport processes. c) B value versus experiment time…….…………………………………… 128
5.5 SEM images of Cu/β′′-alumina sample with Cu/β′′ ratio of 1/1, a) before and b) after testing in the SETC…………………………. 130
5.6 a) The impedance spectra of Ni/β′′-alumina electrode with Ni/β′′ ratios of 3/1. b) The impedance spectra measured on t-to=2d and 3d, and their deconvoluted spectra for charge transfer and sodium transport processes. c) B value versus experiment time.……..……………………………….… 133
5.7 SEM images for Ni/β′′-alumina sample with Ni/β′′ ratios of 3/1 after testing in the SETC…………………………………..…. 135
5.8 a)The impedance spectra of Ni/Cu/β′′-alumina electrode with Ni/Cu/β′′ ratios of 3/3/2. b) The impedance spectrum measured on t-to=8d, and its deconvoluted spectra for charge transfer and sodium transport processes. c) B value versus experiment time………………………..……………….. 138
5.9 SEM images for Ni/Cu/β′′-alumina sample with Ni/Cu/β′′ ratios of 3/3/2 a) before and b) after testing in the SETC….….……....…... 139
5.10 a)The impedance spectra of Co/Cu/β′′-alumina sample with Co/Cu/β′′ ratios of 3/3/2. b) The changes of extracted Ract, Rs, Rct, Rd versus experiment time. c)B value versus experiment time………………………...………….……. 142
5.11 SEM images for Co/Cu/β′′-alumina sample with Co/Cu/β′′ ratios of 3/3/2 a) before and b) after testing in the SETC………………… 144
xiii
FIGURE Page
5.12 a) The impedance spectra of Cu/sodium titanate sample with Cu/ST ratio of 1/1. b) The impedance spectrum measured on t-to=6d, and its deconvoluted spectra for charge transfer and sodium transport processes. c) B value verses with experiment time………………………………..…… 147
5.13 SEM images for Cu/sodium titanate electrode a) before and b) after testing in SETC…………………………………………….…. 149
5.14 a) The impedance spectra of Ni/sodium titanate electrode with Ni/ST ratios of 4/1. b) The changes of extracted Rs, Rct, Rd versus experiment time c) B value versus experiment time………………...………….……………. 152
5.15 SEM images of the Ni/sodium titanate sample with 4/1 ratios of Ni/ST after testing in the SETC…….…………..………..…... 153
5.16 The impedance spectra of Ni/Cu/sodium titanate electrode with Ni/Cu/ST ratios of 3/3/2. b) The changes of extracted Rs, Rct and Rd versus experiment time c) B value versus experiment time………………………...………….…… 155
5.17 SEM images for Ni/Cu/sodium titanate sample with Ni/Cu/ST ratios of 3/3/2 a) before and b) after testing in the SETC…………………. 157
5.18 a) The impedance spectra of Ni/Cu/sodium titanate electrode with Ni/Cu/ST ratios of 3/3/3. b) The changes of extracted Rs, Rct and Rd, versus experiment time. c) B value versus experiment time………………………………………… 159
5.19 SEM images for Ni/Cu/sodium titanate sample with Ni/Cu/ST ratios of 3/3/3 a)before and b)after testing in the SETC……..………….…. 160
5.20 a) The impedance spectra of Co/Cu/sodium titanate electrode with Co/Cu/ST ratios of 3/2/1. b) The impedance spectrum measured on t-to=7d, and its deconvoluted spectra for charge transfer and sodium transport processes…………………………... 163
5.21 a) The impedance spectra of Co/Cu/sodium titanate electrode with Co/Cu/ST ratios of 3/4/1. b) The changes of extracted Rs, Rct and Rd with experiment time……………………………………… 164
xiv
LIST OF TABLES
TABLE Page
1.1 Some physical properties of β-alumina …………………………………… 10
3.1 Physical properties of metals studied in this research, including melting point(Tm), electrical resistance(R) and coefficient of thermal expansion (CTE) at different temperature, vapor pressure (Pvap) at 1273K and surface-self diffusion coefficient(Ds) at 1273K……………………………. 45
3.2 Equilibrium partial pressure of oxygen (2OP ) of reactions
in the Na-Al-O system at 1100K……………………...…………………… 52
3.3 Equilibrium partial pressure of oxygen (2OP ) of reactions
in the Na-Ti-O system at 1100K…..……………………………………….. 53
3.4 Minimum Gibbs free energy changes ( rxnGΔ ) of reactions in the Ni-Ti-Al-O system at 1100K……………………………………….. 57
3.5 Equilibrium partial pressure of oxygen (2OP ) of
metal oxides at 1100K……………………………………………………... 59
4.1 The parameters in used the equivalent circuit…………………………….. 94
4.2 Summary of the sodium titanate conductivity measured in the literature………………………………………………….. 96
1
CHAPTER I
INTRODUCTION
1.1 Motivation
As researchers continue to push technological limits to probe the far reaches of our
solar system, significant challenges emerge. One such challenge is associated with the
way in which these spacecraft are powered. The most common source of power for
these probes, which derived from solar illumination, becomes an inefficient energy
source as the distance from the sun increases. Radioisotope thermoelectric generators
(RTG) that have been put to use in deep space exploration vehicles such Pioneer (1972),
Voyager (1977) and Galileo (1977), are considered high in mass and low in conversion
efficiency.1,2 Because of these shortcomings, NASA’s Space Nuclear Initiative (SNI)
has been making efforts to develop more advanced power systems technologies for
future missions that may involve travel to the farthest planets of our solar system and
beyond. These technologies that are pursued in space power point to higher reliability,
higher density, higher efficiency, lower cost and lower volume. The Alkali Metal
Thermal to Electric Converter (AMTEC) is one of these technologies and has the
potential to meet all these goals and objectives.3,4
AMTEC was first developed at the Ford Scientific Laboratory in Dearborn, Michigan
in 1968 and was further supported by NASA work at the Jet Propulsion Laboratory
(JPL) in the early 1980s. Since that time, several companies and laboratories throughout
This dissertation follows the style and format of Journal of the Electrochemical Society.
2
the world have studied and further developed AMTEC’s power generation process.5-8
Currently, conversion efficiencies have been demonstrated as high as 22% in the
laboratory with open circuit voltages in single electrochemical cells up to 1.6V and
current densities up to 2.0A/cm2. With a few improvements, AMTEC is expected to
yield power efficiencies as high as 30 percent and a power density of approximately 80
watts per kilogram in the near future, which would significantly reduce overall system
mass. What makes AMTEC even more appealing is that it is a static energy conversion
device and fuel source insensitive in that it can utilize heat from nearly any source,
including fossil fuel, the sun, radioisotopes, or a nuclear reactor.4,9-11 With all these
advantages combined, AMTEC appears to be extremely promising for use as an
electrical power system on further deep space mission and terrestrial application.
1.2 Alkali Metal Thermal to Electric Converter
AMTEC, originally designed to be a space power generator to fulfill the
requirements of diverse space missions, is a high-temperature regenerative concentration
cell that employs an alkali metal working fluid (such as sodium or potassium) to directly
convert heat to electricity. It can provide efficiencies close to the theoretical Carnot
efficiency and is capable of high power density and low mass.9-12
1.2.1 AMTEC Operating Principles
AMTEC operation is based on the principle of sodium concentration cells, in which
the driving force is the sodium pressure difference between the anode and cathode. The
device uses an alkali metal conducting ceramic, polycrystalline β′′-alumina, as the
3
electrolyte. With the formula of Na2(Mg, Li)O•5Al2O3, β′′-alumina has mobile Na+ ions
in its structure, which results in it being an excellent sodium ion conductor, but a poor
electronic conductor.(further details of β′′-alumina can be found in next section.) The
principles of AMTEC operation are shown in Figure 1.1.
In this device, sodium is contained in a sealed loop, which is divided into high and
low temperature regions. β′′-alumina used as the partition between the high and low
pressure areas is a solid electrolyte and coated on both sides with porous electrodes.
Figure 1.1. Schematic diagram of AMTEC.
e
Na Liquid Tl, Pl
Cooling (T=400-700K )
e + Na Gas
Load Na+ ion
Pump
Na Liquid Th, Ph
Na→Na+ + e
β′′-Al2O3
Na+ + e→ Na
Heating (T=900-1200K )
4
High pressure sodium is oxidized at the anode, becoming a sodium ion and releasing an
electron in the high temperature region (900-1200K), shown in reaction (1.1). The
released electron flows to the cathode through the external load, producing electrical
work. The sodium ion passes through the β′′-alumina solid electrolyte (BASE) and
recombines with the electron from the external load to form neutral sodium on the low
pressure side of BASE. This neutral sodium then flows from the cathode to the
condenser in the low temperature region (400-700K) and is pumped back to the high
temperature region. The electrode reactions and overall cell reaction are shown in
reaction (1.1), (1.2) and (1.3).4,9-12
Anode reaction: Na(Phigh) → Na+ + e (1.1)
Cathode reaction: Na+ + e → Na(Plow) (1.2)
Cell reaction: Na(Phigh) → Na(Plow) + Work (1.3)
The open circuit potential ocE can be expressed as:
low
highhoc P
PF
RTE ln= (1.4)
where R is the gas constant, F is the Faraday constant, Th is the temperature of AMTEC
hot side, and Phigh and Plow are the vapor pressure of sodium at the anode and cathode,
respectively.
1.2.2 AMTEC Equipment
An AMTEC device generally contains several BASE tubes connected in series to
generate the desired voltage to meet the specified task requirement. A typical AMTEC
device, as shown in Figure 1.2, consists of an evaporator, condenser, liquid-return artery
5
(wick), BASE tubes (7 tubes in this example), porous electrodes, current collectors, α-
alumina insulators, and metal braze rings.
The evaporator is located at the bottom of the device while the condenser is on the
top. The BASE tubes, electrically connected in series, are brazed to a stainless steel
support plate and insulated electrically from the plate by high quality, high purity α-
alumina. The thermal energy is input via the cell hot plate at the bottom of the unit and
transported to the BASE tubes, which are covered by thin porous electrode on the inner
and outer surface as anode and cathode films respectively. High pressure sodium vapor
is oxidized within the BASE tube causing sodium ions to pass through the BASE to the
outer surface. Sodium ions combine with the electrons to form neutral sodium on the
cathode and flow to the condenser, located on the top of the device. The metal felt wick
is located in the central tube and serves as a means to pump the sodium working fluid
from the condenser back to the evaporator.
Several solid metallic rings around the evaporator enhance the heat conduction path
between the BASE tubes support plate and the cell evaporator, increasing both the
evaporator temperature as well as the sodium vapor pressure at the anode. The conical
evaporator provides a larger surface area for the evaporating liquid sodium to return
from the condenser. Finally, encompassing the cell is an axial radiation shield serving to
diminish parasitic heat losses to the heat sink.6,13,14
6
1.3 β′′-alumina Solid Electrolyte (BASE)
BASE is a low electronic conductivity yet high ionic conductivity material. This
material is the heart of the AMTEC. In β′′-alumina, sodium ions are highly mobile and
thus readily produce current when an electric field is applied. In this section, we will
introduce the crystal structure, basic physical and chemical properties, and degradation
of β′′-alumina in the AMTEC.
β-alumina family refers to a series of sodium aluminates with closely related
structures and chemical properties, with the chemical formula of Na2O•x(Al2O3) (x=5-11).
In this family, the most important members are β′′-alumina and β-alumina, with β′′-
Figure 1.2. Picture of AMTEC cell with 7 BASE tubes.
7
alumina possessing the ability to convert to β-alumina at high temperature.15-23 The
structures of these two materials are shown in Figure 1.3.
β-alumina β″-alumina
Figure 1.3. Ideal crystal structure of β-alumina (left) and β″-alumina(right).
8
1.3.1 Crystal Structure
β′′-alumina has a rhombohedral symmetry and with ideal composition of
Na2O•5Al2O3, the lattice constants are a=5.59Å, c=33.85Å. It is often soda deficient
and is normally stabilized by the addition of MgO and/or Li2O, normally 7.5% Na2O and
0.1-0.5% MgO or Li2O. A typical composition of β′′-alumina is Na1.67Mg0.67Al10.33O17.
The basic crystal structure of β″-alumina is composed of three Al–O blocks which
are separated by two sodium planes, as reported by Yamaguchi in 1968.24 Each Al–O
block consists of four close-packed oxygen layers with Al3+ ions occupying the
octahedral sites as well as the tetrahedral sites. Al3+ and O2- ions are packed in the same
fashion as in MgAl2O4 spinel, with the only difference being the replacement of Mg on
tetrahedral sites with Al.
The spinel-type blocks are separated by two kinds of sodium planes. One has Na+
and O2- ions while the other contains only Na+ ions, although both are loosely packed.
In these planes, there are three kinds of sites for Na+ ions, called BR(Beevers-Ross),
aBR(anti-Beevers-Ross) and mO(mid-oxygen) sites, shown in Figure1.4. Na+ ions are
preferentially located at the BR site at low temperature, while at high temperature, Na+
ions are statistically distributed over the three sites.18 Thus Na+ can be very easily
transported along the plane, leading to the high ionic conductivity shown by β″-alumina.
However, the conductivity is limited to this plane and movement along the c axis is
exceedingly difficult, therefore, this material is highly anisotropic.
9
β-alumina is in a hexagonal form, and the lattice constants are a=5.59Å, c=22.53Å
for the ideal composition of Na2O•11Al2O3, but it always contains excess soda, and this
nonstoichiometric composition is generally represented by Na1+xAl11O17+x/2 with x being
typically 0.2. β-alumina is the more commonly used ionic conducting material and is
already applied in several fields including high-energy batteries.25
1.3.2 Physical and Chemical Properties
β-alumina has been investigated widely and its properties are well known. Some of
the physical properties of β-alumina are given in Table 1.1. This table can be used as a
reference to consider β′′-alumina’s properties, since they are very similar and β′′-
alumina’s data are not readily available. Some researchers, however, have found that
β′′-alumina has lower ionic resistivity than β-alumina at moderate to elevated
temperature. The possible reason for this difference could be the greater number of Na+
in β′′-alumina and the charge of the compensating defects. The high defect charge in β-
Figure 1.4. Site model of conduction plane of β′′-alumina.
BR
−2O
5.58Ο
Α
aBR
mO
10
alumina could trap Na+ ions in their vicinity and reduce the number of interstitial Na+
ions available for an interstitialcy mechanism diffusion.17
β-alumina is stable at elevated temperatures, even in the presence of molten sodium,
and has thermodynamic stability essentially the same as Al2O3+ Na2O. Na+ ions in β-
alumina can be ion exchanged with other cations, such as Ag+, Cu+, K+, Ti+, Li+. At
room temperature, they can be exchanged by water and H3O+, resulting in the presence
of H2O and H3O+ in the conduction planes, which lead to an increase in resistivity.
Therefore, in our research, BASE tubes are stored in a dry atmosphere.
Table 1.1. Some physical properties of β-alumina.
Property Value
Melting Point ∼2253K
Density 3.26g/cm3
Coeff. Of expansion, a-axis @ 773∼873 K 7.7×10⁻⁶ /K
Coeff. Of expansion, c-axis @ 773∼873 K 5.7×10⁻⁶ /K
Calculated coeff. Of self-diffusion at 298K 4.0×10⁻⁷Cm2/sec
Activation energy of the self-diffusion 15.9kJ/mole (473-673K)
Na+ conductivity @298K 0.033ohm-1cm-1
Na+ conductivity @373K 0.0765ohm-1cm-1
Na+ conductivity @1000K 0.7ohm-1cm-1
11
1.3.3 Degradation
Due to it has a high melting temperature, good Na+ ion conductivity and low
reactivity, polycrystalline β′′-alumina is used in AMTEC as the solid electrolyte and
becomes the key to AMTEC operation. Unfortunately, BASE degrades over time during
the AMTEC operation, which reduces AMTEC efficiency. This degradation of BASE
can be thought of as two main mechanisms, thermal breakdown and chemical
contamination.26-28
Thermal breakdown involves several processes at AMTEC working temperature.
The first of these is sodium loss. Sodium in the BASE conductive plane could be lost
during AMTEC operation, which results in a decrease in the BASE’s ionic conductivity.
With sodium loss, the β″ phase converts to the β′ phase and finally to α-alumina, which
is not an ionic conductor.
The second process is the formation of molten dendrites. Due to the high
temperature and flow of the charge, molten sodium dendrites could be formed within the
BASE structure. As these dendrites increase in size and propagate through the structure,
they can ultimately cause an electrical short between the cathode and the anode causing
electrons to flow directly between these two surfaces and thus reducing the amount of
charge flowing through the external, load-bearing circuit.
The third process is crack formation. A crack is a void or discontinuity in a material
that has a propensity to grow or increase in size, which could cause the material to
finally rupture and fail. Sodium ion migration leads to intergranular weakening and
fracture. If the crack propagates through the thickness of the BASE tube, a short or
12
opening is created between high pressure and low pressure sodium regions of the cell,
which will result in leakage of Na vapor and reduced power output.
Finally, the fourth of these processes is microstructure change. β″-alumina is highly
anisotropic due to conductivity limited to the Na+ planes. In AMTEC, polycrystalline
β″-alumina is used to get good conductivity in all orientations. However, high
temperature combined with sufficiently long periods of time cause grain growth, and the
coalescence of grains may cause microscopic voids in the material thereby greatly
increasing resistance to ion transport.
In AMTEC devices, chemical contamination can occur when elements such as
chromium and manganese from stainless steel react with BASE and form Cr2O3•Al2O3
and MnAl2O4. These materials may also substitute for Na+ in the conduction layer of the
BASE crystal. Contaminants in the BASE like NaAlO2 also have a deleterious effect on
ionic conductivity, mechanical strength and chemical stability.
1.4 Key Issues in AMTEC Performance Operation
For an AMTEC device to be feasible for either space or terrestrial applications, it
requires a high power density and a long lifetime of 7-15 years. For this reason, research
efforts have been focused on improving AMTEC efficiency and lifetime.
The efficiency of AMTEC under load is the specific output power of the electrode
divided by the total heat input required per unit area of electrode, which given as
QTTCHFjjV
jV
lowhighpvap +−+Δ+=
)]([
*η (1.5)
13
Here, V and j are the output voltage and current density, F is Faraday constant, Cp is the
specific heat of liquid sodium, vapHΔ is the molar vaporization enthalpy of liquid
sodium, and Q is the parasitic heat losses.4
Based on this equation, there are two ways to raise the efficiency. One is improving
output voltage or current and the other is reducing the parasitic heat losses. Achieving
the former requires reducing electrochemical losses, while achieving the latter requires
reducing thermal losses. Moreover, there are some losses owing to degradation of
components such as the electrodes and the electrolyte over time.
Thermal losses in an AMTEC cell consist primarily of radiative loss (Qr) and
conductive loss (Qc), shown in equation (1.6).
rc QQQ += (1.6)
Conductive loss is the heat loss due to conduction from the hot region through the
output current leads and supporting structure for the BASE, which could result in a
condenser temperature higher than its optimum. Radiative loss is the heat loss due to
radiation from hot surfaces through the vapor space to the condenser. Qc is determined
by the dimensions and thermal conductivities of the electrical leads and structural
members of the device, while Qr is determined by knowledge of the emissivities of the
hot surfaces and condenser surfaces and the geometric configuration of the device.
Therefore, recent research on thermal losses is concentrated on constructing a thermal
model, describing and simulating thermal characteristics of components of cells, and
designing and optimizing systems.29-31 We will not focus on this aspect in this research.
14
Electrochemical losses are the losses related to electrochemical reactions and
transport processes. The core of an AMTEC cell is the electrode and BASE assembly.
Sodium oxidation and reduction, sodium vapor transport through the electrode material,
current collection and electron flow to and from the electrodes, all occur on the
electrode/BASE assembly and all contribute to the electrochemical losses and finally
determine current-voltage characteristics, i.e. electrical energy output.
Internal resistance of the cell includes pressure losses due to sodium flow through the
device, contact and sheet resistance, and potential-dependent resistance, which is
designated as the apparent charge-transfer resistance, Ract (interfacial kinetics losses and
flow of Na vapor through the electrode from the interface and then away from the
electrode surface). Therefore, it is very important to understand and improve these
electrochemical processes in order to minimize these losses and improve the efficiency
of AMTEC. The theory of kinetics and transport in the AMTEC electrode/BASE
assembly must be further developed to achieve these goals.
Most of the electrochemical losses can be minimized, although not eliminated, by
choosing the electrode material, morphology, and current collection network and
improving connecting technology. This research will focus on reducing electrochemical
losses by the choice of electrode materials and understanding electrode kinetics.
Another key issue for AMTEC is the degradation characteristics of the cells, which
determine the lifetime of an AMTEC power converter. This degradation includes
electrode performance degradation, capillary pumping system degradation and BASE
degradation, as described in the previous section. Previous AMTEC research has shown
15
that, over the time scales studied (up to 8000h), the electrode is the component most
likely to influence device performance and limit operating lifetime.32
AMTEC electrode degradation modes include growth of electrode grains, reduction
of electrode porosity, segregation of electrode components, evaporation of electrode
material, formation of new compounds, and separation between electrode and current
collector.
At AMTEC operating temperatures, grains of electrode materials will grow and
coalesce, which will dramatically reduce electrode performance. Grain coalescence
reduces the total reaction area and electrode porosity, and changes the pore size and
shape, which determines the efficiency of sodium transport and influences the potential
drop in the electrode. Additionally, electrode composition could be changed. Some
components could evaporate and leave the electrode or react with the environment to
form new compounds, which could be volatile or have low conductivity. Due to
different diffusion coefficients, electrode components can concentrate and create a non-
uniform structure. Finally, due to different thermal expansion coefficients, the electrode
and current collector can separate, which will greatly reduce the output current by
increasing the series resistance.33-38
1.5 AMTEC Electrode Studies
The above discussion shows that the electrode is a key issue in AMTEC
development, because it is the component most likely to influence AMTEC performance
and limit operating lifetime. Comparing anode and cathode, it is found that cathode is
16
more demanding, because sodium vapor activity is high at the anode and it is more
reversible. Therefore, the electrode development and degradation studies have focused
on the cathode.
An AMTEC electrode must meet the following requirements in order to achieve the
desired performance.39
1. The electrodes must be stable for long periods of time at AMTEC operating
temperate (700-1000oC for 15 years), which require the electrodes to have a high
melting temperature above AMTEC operating temperatures, a thermal expansion
coefficient near that of BASE, and very low vapor pressure at AMTEC
temperatures.
2. The electrode must be chemically and thermally compatible with other
components in the cell, including sodium and the BASE. It must not form new
phases with other components of the cell, which would adversely affect the
performance of the cell.
3. The electrode must provide reaction sites for sodium reaction and oxidation to
occur. Large reaction areas are necessary for producing high current at useful
voltages.
4. The electrode must provide paths for electrons from the sodium oxidation sites to
the current collector, and from the current collector to the sodium reduction sites,
which requires that the electrode must have good electronic conductivity.
17
5. The electrode must provide a means of sodium transport between the reaction
sites and vapor space. It requires that the electrode is capable of high rates of
ionic or diffusive transport of sodium.
Refractory metals and their alloys could meet these requirements, including Mo,
W, Ir, Ni, Ti, WRh2, and WRh3.40-44 Sputtered Mo electrodes have been studied widely
as applied to AMTEC, and have shown high power densities and the best initial
performance of all studied metal electrodes. However, molybdenum forms volatile Na-
M-O compounds during the AMTEC operation, which dramatically reduce Mo electrode
lifetimes.44,45 Similar behavior is also found in the W electrode system.38
Ceramic materials are another electrode candidate group, which are stable at
AMTEC operating temperatures and have thermal expansion coefficients comparable to
that of BASE. Some nitrides, oxides and carbides of transition metals (IV, V and VI
groups) have been investigated, such as TiN, TiC, NbN, NbC.46-49 Also, some ceramics
such as MoN, ZrN were considered as electrode materials, but MoN was found to have
positive Gibb’s free energy at AMTEC temperatures, and ZrN oxidizes at AMTEC
operating temperature. Currently, TiN has shown good performance for a long time and
is used as a standard AMTEC electrode.
For both metal and ceramic electrode materials, however, charge transfer reactions
occur only at electrochemically active sites, i.e. a point where the vapor space, the
electronic conductor, and the ionic conductor are in close contact, also called the triple-
phase boundary (TPB). Typically, for metal electrodes, the ratio of active site area to the
overall electrode area is about 10-4, which significantly limits the current production.
18
There are two possible approaches to increase the reaction site density. The first
method is to reduce the electrode particle size, for example, by using nano-particles.
Unfortunately, these small particles are more likely to grow or coalesce (sintering
behavior) during the AMTEC operation in addition to increasing the cost of AMTEC.
The second method is to develop mixed ionic-conducting and electronic-conducting
electrodes (MIEE). This mixed electrode offers the potential to increase reaction site
density per unit electrode surface area, since it can extend the active area three-
dimensionally into the electrode thickness, due to internal sodium ion transport.
Additionally, MIEE may maintain the porosity of the electrode by forming a framework
of ceramic to help control the sintering behavior of the metal and effectively adjust the
thermal expansion coefficient of the electrode to help reduce thermal stresses, which
could improve the lifetime of electrode. Although electrical resistance and sodium
conduction are both properties of the electrode, the physical morphology of the electrode
plays an equally important part. Characteristics of the electrode, such as the porosity,
thickness, grain size, and quality of contact at the electrode-electrolyte interface, can all
affect the conduction of both electrons and sodium to and from the reaction sites.
Therefore, developing an MIEE is an attractive alternative to improve the efficiency of
AMTEC.
The first step in the development of an MIEE is to find an appropriate sodium ion
conductor. Obviously, β″-alumina is the best candidate and at present, the Mo/β″-
alumina electrode is the only MIEE that has been investigated experimentally.
19
Unfortunately, this MIEE displayed inconsistent performance in the lab, the reasons for
which still being unclear.50
There are other sodium conductors, such as Na2Ti3O7, Na3PO4, Na2MoO4,
NASICON (Na1+xZr2(PO4)3-x(SiO4)x 0<x<3 ), and Na0.9Mg0.45Ti1.55O4. Among these
sodium conductors, some, such as Na3PO4, have melting points lower than AMTEC
operating temperatures, some have high vapor pressure at AMTEC temperatures, such as
Na2MoO4, and some have only one dimension sodium ion conductivity, such as
Na0.9Mg0.45Ti1.55O4. Sodium titanate (Na2Ti3O7 or Na2Ti6O13) appears to be a good
candidate, because of its high melting point, compatibility with BASE and low cost.51
Its properties will be described in next section. Since metal/sodium titanate MIEEs have
not been previously reported as electrode materials, this research focuses on preparation
and performance studies of these mixed electrodes for AMTEC operation.
1.6 Sodium Titanate Materials
Sodium titanates refer to a composition series of ternary oxides of sodium with
titanium dioxide, Na2O•nTiO2, (n=3∼8), which crystallize in a monoclinic structure.
Na2Ti3O7 is a member of this family, whose crystal structure was first reported in 1961
with unit-cell dimensions of a=8.571Å, b=3.804Å, c=9.135Å and β=101.57°.52 The
basic framework of Na2Ti3O7 is built up by three TiO6 octahedra-sharing edges at one
level, as shown in Figure 1.5. These units are joined to similar blocks above and below
by additional edge sharing, which forms zigzag strings extending in the direction of the b
axis. The strings are combined by sharing the corners of the octahedra to form staggered
20
sheets, which stack in the a-direction. These form a layered structure with the
composition (Ti3O7)2-. Sodium ions hold these layers together and occupy the interlayer
regions at the levels y=1/4 and 3/4.51 The crystal structure allows sodium mobility in the
interlayers. Therefore, sodium titanates have been used in ion exchange processes, as
ceramic capacitors, dielectric resonators in microwave oscillators band pass, reinforcing
agents of plastics, adiabatic materials and an oxygen electrode for potentiometric gas
sensors. 53-56
The crystal structure suggests that sodium titanates should be a sodium ion
conductor, since the sodium ion can move along the layers easily. However, only few
data are available in the literature about sodium titanate’s electrical properties up to now,
and these data are measured by different researchers and show inconsistence.57-59
Therefore, it is necessary to measure the conductivity of sodium titanate.
Sodium titanate has a high melting point of 1401K, which is higher than the AMTEC
operation temperature and since it is a ceramic, its thermal expansion coefficient should
be close to that of BASE, although the exact value is not available. Therefore, sodium
titanate could certainly be considered as ionic conductor candidate for an MIEE of
AMTEC.
Before making this statement however, the question of whether or not Na2Ti3O7 is
chemically compatible with other components in the cell, including sodium vapor, the
metal component in the electrode, and the BASE must be answered. Sodium titanate is a
stable chemical, and likely does not react with individual components of the cell, but
when all the components are present; it could cause a system-level affect or catalyze
21
some reactions that may not occur when simply examining the individual components.
In this research, we will calculate the reaction Gibbs free energy for all possible
reactions in Na-Al-Ti-O system and plot the chemical potential diagram to analyze the
stable chemical form or phases present in this system, as well as reactions possibly
occurring between electrode and electrolyte.
Figure 1.5. Crystal structure of Na2Ti3O7.
22
1.7 Objective
To improve AMTEC’s performance, a key issue is the development of a highly
efficient electrode, especially the cathode. In this research, the primary objective is to
develop metal/ceramic mixed ionic and electronic conducting electrodes, measure their
performances as a function of time, optimize their composition and analyze electrode
kinetics.
In the first part of this dissertation, the MIEE preparation is discussed. First we
select metal candidates based on their physical and chemical properties, and theoretically
analyze their stability and compatibility with other components in a MIEE. Then the
selected metal candidates are tested as AMTEC electrode and measure their
performance. Based on the performance and morphology of electrodes, the metal
component is determined. We use selected metals mixed with sodium titanate or β″-
alumina ceramic to prepare a series of MIEEs with different composition, and then the
relationship between the performance and composition are examined experimentally.
Finally, a theoretical model is developed to explain the experimental results and predict
the optimal composition for MIEEs.
In the second part of this dissertation, the kinetic mechanisms are identified for pure
metal electrodes and MIEEs. First, the ionic conductivity of sodium titanate used in this
research is measured in AMTEC conditions. Then, applying the electrochemical
theories into electrode systems and combining with experimental results, the kinetic
mechanisms of the pure metal electrode and MIEE are proposed and discussed. Finally,
23
the expression of the interface impedance is theoretically derived based on the proposed
kinetics for both pure metal electrode and MIEE.
The last part of this dissertation is the performance examination of different kinds of
MIEEs. In this part, two kinds of MIEEs are studied, metal/β′′-alumina and
metal/sodium titanate MIEEs, and for each kind of MIEE, a series of electrodes with
different compositions are prepared and tested. The functions of different metal
components in the MIEE are discussed and the performances of metal/β′′-alumina and
metal/sodium titanate MIEEs are compared. Finally the performance of all tested MIEE
are described and analyzed.
In summary, AMTEC electrode study is still in a fundamental stage. In this research,
we propose the MIEE for AMTEC operation and compare to the pure metal electrode.
By studying several reasonable MIEEs, we try to find the electrode with the best
performance and understand the electrochemical kinetic mechanisms.
24
CHAPTER II
EXPERIMENTAL
2.1 Experimental Apparatus
In order to accurately evaluate the performance of AMTEC electrodes, it is important
to isolate the electrode from other components. The Sodium Exposure Test Cell (SETC)
is specifically designed to simulate AMTEC electrode working conditions and examine
electrode performance, without having to run a complete AMTEC cell.60
The SETC consists of a stainless steel tube chamber with a length of 49cm and a
7.5cm diameter and a sodium containment, or sodium pool, as shown in the Figure 2.1.
α-alumina rods are used to support test samples and are held in the manifold with
Epoxy-Patch insulating epoxy, which forms a vacuum tight seal. The chamber is
evacuated and then heated to AMTEC operating temperatures, while the temperature of
sodium containment or pool is kept at AMTEC condenser temperatures.
The SETC is a non-power-producing cell, unlike AMTEC. Its anode and cathode are
in the same environment, which is similar to that of the cathode of AMTEC. Electron
flow is driven not by the difference of the sodium chemical potential, but by the external
power, applied as a voltage difference between the electrodes. The SETC provides a
sodium vapor pressure of the same order of magnitude as that found on the cathode side
of AMTEC cells. All processes occurring on the anode, cathode and BASE in a SETC
are the same as those in the AMTEC cell. The experimental results have proved that
performance of the electrode and the electrolyte in AMTEC cells can be tested in an
25
SETC, and performance parameters, which correlate with those taken from AMTEC
operation, can be calculated from data taken in an SETC.60 Therefore, all the
experimental results for electrode performance in this research are measured by the
SETC in our lab.
The chamber is lined with niobium or titanium metal to prevent volatiles from the
stainless steel such as chromium and manganese from contaminating the test samples.
The manifold also includes a pump out port and a sodium fill port. The pump-out port
connects to the turbo molecular vacuum pump that is backed by a roughing pump.
Before operation, the SETC needs to be baked out in order to remove the water and
inorganic contaminants in it, beginning with ~220ºC, then to ~440, ~660, ~880, and
finally ~1100ºC and holding each temperature for 4 hours. After the assembly is
outgassed and the temperature is reduced to ∼400ºC, approximate 20g of liquid sodium
is introduced into the sodium pool. Finally, the end of SETC having samples is heated
to the operating temperatures of 600-900ºC, while the sodium pool is kept at a
temperature of ∼300ºC.
There are 4 test samples in the chamber, which are placed in the hot end. Each
sample consists of a cylindrical β"-alumina solid electrolyte (BASE) tube with 4
electrode bands, each approximately 0.25cm wide, deposited on the outer surface of the
BASE and separated by 0.25cm bands of bare BASE. The electrodes are covered by Ni
or Cu metal mesh, which acts as the current collector. Ni or Cu leads are used to tie
these current collectors onto the BASE tube and are threaded through α-alumina rods to
the outside of the manifold, where they are connected to the EIS equipment.
26
Figure 2.1. Schematic drawing of the sodium exposure test cell.
Thermocouples Stainless Steel Chamber
α-Alumina rods
Test Sample
Hot End (∼8500C ) Cold End (∼3000C)
To Vacuum
Sodium FillSodium Pool
27
2.2 Techniques
2.2.1 Electrochemical Impedance Spectroscopy
Electrochemical Impedance Spectroscopy (EIS) has become a mature technique that
has been seen a tremendous increase in popularity in recent years. This method probes
the system response to the application of a small amplitude ac signal, which usually is a
voltage between 5 to 50 mV over a range of frequencies of 105 Hz to 10-3 Hz. The
response is the complex impedance (Z) that is defined as the ratio of voltage(V(ω)) to
current (I(ω)) and varies as the frequency(ω) of the applied voltage changes. The EIS
instrument records the exact impedance including the phase angle (φ(ω)), real (Zre) and
imaginary (Zim) components of the impedance at every frequency applied and displays
them graphically using two types of plots, the Nyquist plot (also known as complex
plane or Argand plots) and the Bode plot. The Nyquist plot is a graph of the imaginary
versus the real components of the impedance, plotted for various frequencies. That is,
each point on the Nyquist plot is the impedance at one frequency. The Bode plots are
log|Z| (magnitude) and phase angle φ(ω) verse log(ω).61-65 Figures 2.2(c) and (d) show
typical Nyquist and Bode plots.
EIS theory is based on analogies between the electrochemical process and networks
of electrical elements, such as resistors, capacitors and inductors, which are thought to
behave like the electrochemical cell. Therefore, an electrochemical system’s
performance can be represented by an equivalent circuit of electrical elements that pass
current with the same amplitude and phase angle as the real cell does under a given
excitation. For the very basic electrochemical process, which only includes one step,
28
that is, a charge transfer reaction on the interface between electrode and electrolyte, an
equivalent circuit, called the Randles’ circuit, is used to represent it. Figures. 2.2(a) and
(b) show the process and the circuit. The parallel elements are introduced because the
total current through the interface is the sum of distinct contributions from double-layer
charging, ic and the faradic process, if, which is the only charge transfer reaction here.
The double-layer capacitance is nearly a pure capacitance, hence it is represented in the
equivalent circuit by the element Cdl. A resistor Rct is used to represent the charge
transfer process. Of course, all of the current must pass through the solution resistance;
therefore Rs is inserted as a series element to represent this effect in the equivalent
circuit.
surfO
surfR
ne
Electrode
Electron Transfer
(a) Charge transfer reaction
O + ne ↔ R O ------- Oxidant R ------- Reductant
Figure 2.2. (a) Charge transfer electrochemical process. (b) Randles’ equivalent circuit. (c)
responded electrochemical impedance spectrum, Nyquist plot and (d)Bode plots.
29
(b) Randles’ equivalent circuit
ic
ic+ if
if
Rs Cdl
Rct
Zre
Rs Rs+ Rct
-ZIm
Low ω
1/ωp=RctCdl
High ω
(c) Nyquist plot
Figure 2.2. (Continued)
logω
LogZ
logω
Phase angle
(d) Bode plots
0
30
The impedance of this system is given as
222
2
222 1111)(
dlct
dlct
dlct
cts
dlcts CR
CRjCR
RRCjR
RjZωω
ωωω
+−
++=
++= (2.1)
2221 dlct
ctsre CR
RRZω+
+= (2.2)
222
2
1 dlct
dlctim CR
CRZωω+
−= (2.3)
There are two limits of the impedance, when ω=0, Zre=Rs+Rct, and Zim=0; when
ω=∞, Zre=Rs, and Zim=0. Analyzing Zre and Zim, equation 2.4 is found.
22
2
22⎟⎠⎞
⎜⎝⎛=+⎟
⎠⎞
⎜⎝⎛ −− ct
imct
sreRZRRZ (2.4)
Because Zim only has negative values, Equation 2.4 represents a semicircle centered
at 2ct
sRR + on the real axis and having a diameter of Rct, shown in Figure 2.2(c). The
intercept at high frequency (on the left) on the real axis gives the value of Rs, and the
intercept at the low frequency (on the right) is the sum of resistance of Rs and Rct.
Additionally, the point at the semicircle maximum, i.e, the higest Zim, corresponds to the
frequency ω=1/RctCdl. The Bode plots are shown in figure2.2 (d). The graph of log|Z|
versus logω contains two breakpoints, and the phase angle graph shows the phase angle
is 0o at both low frequencies and high frequencies and has a maximum when frequency
is equal to
s
cts
dlct RRR
CR+
=1ω (2.5)
31
It should be noted that the frequency corresponding to maximum of the phase angle is
different from that of maximum of the imaginary part of impedance. By analyzing
Nyquist and Bode plots, the values of elements in the equivalent circuit can be obtained.
These elements can represent all kinds of electrochemical processes occurring in the
electrochemical system.
For a real electrochemical system, an overall electrode reaction process that causes
the conversion of the oxidized species, O, to a reduced form R, is composed of a series
of steps, shown in Figure 2.3. In general, the current (or electrode reaction rate) is
governed by the rates of processes such as
1. Mass transfer (e.g. species O from the bulk solution to the electrode surface).
2. Electron transfer at the electrode surface.
3. Chemical reactions preceding or following the electrode transfer. These might
be homogeneous processes or heterogeneous ones on the electrode surface.
4. Other surface reactions, such as adsorption, desorption, or crystallization
(electrodeposition).
The EIS results can be complicated for an AMTEC electrode, but by using equivalent
circuits, it is possible to separate and quantify the individual resistances for each
electrochemical step, if they have sufficiently different time constants. Further, we can
gain information as to what kind of steps really occurred in the SETC, which is the most
important advantage of EIS over other laboratory techniques. Additionally, we can
determine system kinetics and calculate kinetic parameters, such as activation energy of
32
the electrode reaction, the transfer coefficient α, the diffusion coefficient, and other basic
kinetic parameters for an electrochemical reaction.
Another advantage of EIS is that the excitation waveforms used have a very small
magnitude and cause only minimal perturbation to the electrochemical test system,
thereby obtaining the response of the system following the perturbation near steady state.
This approach is different from other electrochemical techniques, such as potential
sweeps, potential steps, or current steps, which drive the electrode to a condition far
from equilibrium, and for which the response is usually a transient signal.66
Electrode surface region
Bulk
Electron Transfer
Electrod
ne
Chemical Reactions
Desorption
Adsorption
surfOO′ bulkO
Mass Transfer
adsO′
adsR′ surfRR′ bulkR
Adsorption
Desorption
Chemical Reactions
O ----oxidized species R---- Reduced species
Figure 2.3. Pathway of a general electrochemical process.
33
Other advantages of this technique are rapid acquisition of data, accuracy,
reproducibility, effectiveness in low conductivity media and that it is non-destructive.
Therefore, EIS is a very effective tool for characterizing a real electrochemical system
and was used throughout this study.
Figure 2.4 shows the EIS instrumentation used in our lab. It includes a Solartron
1287 Electrochemical Interface (ECI), which is a high accuracy and wide bandwidth
potentiostat/galvanostat capable of handling sample polarization and measurements, and
a Solartron 1250 Frequency Response Analyzer (FRA), which is used to generate and
measure the ac signals. The computer and software are for controlling the ECI and FRA
and recording and displaying measurement results. The impedance results were
analyzed using Z-plot and complex nonlinear least-squares (CNLS) software.
Figure 2.4. Equipment of electrochemical impedance spectrum. 1. electrochemical
interface (ECI) 2. frequency response analyzer (FRA) 3. computer and software.
34
2.2.2 Scanning Electron Microscope
The Scanning Electron Microscope (SEM) is capable of producing high resolution
topographic electron images, where its high resolution and depth of field give it a great
advantage over optical microscopy. The instrument includes an electron gun, a series of
magnetic lenses, a set of scanning coils, detectors, amplifiers, and monitors. The
electron gun is on the top of the vacuum column, and it emits a beam of high energy
electrons. This beam travels downward through a series of magnetic lenses designed to
focus the electrons into a fine probe incident on the surface of the specimens. Scanning
coils move the focused beam back and forth across the specimen. As the electron beam
hits each spot on the sample, secondary electrons and backscattered electrons are emitted
from its surface. The detectors count these electrons and send the signals to an amplifier
and to the monitors. The final image is built up from the number of electrons emitted
from each spot on the sample.67
The SEM can create secondary electron (SE) images, backscattered electron (BSE)
images and characteristic x-ray maps. SE images are sensitive to surface topography,
because the number of secondary electrons emitted is dependent on the surface
topography. Thus SE images are used primarily for displaying topographic data, which
can show a well-defined, three-dimensional appearance. The BSE images are used
primarily for providing composition information, because the BSE yield varies
monotonically with the atomic number. Characteristic x-ray maps can identify elements
present in the sample and their distribution.
35
In this research, we use this technique to analyze morphology characteristics of
electrode film, including the particle size, particle distribution, electrode thickness,
porosity and composition change.
2.2.3 Sputtering
Sputtering is a physical vapor deposition technique, discovered in the 1850's. With
the advent of modern vacuum technology, it has become one of the most widely used
techniques for depositing thin films with high quality. Sputtering works by bombarding
a target material with high-energy particles such that atoms or molecules are ejected and
condense on a substrate as a thin film.68-71
As shown in Figure 2.5, sputtering is performed in a vacuum chamber, in which
sputtered material, usually called the target, working gas and substrate are located. The
vacuum chamber is first evacuated to a base pressure of 10-6 to 10-10 torr, depending
upon the process, and then backfilled by the working gas to a pressure of between 10-3
and 10-1 torr. A negative potential, typically between 0.5 and 5 kV, is applied to the
target, and the substrate is grounded, so target and substrate work as a cathode and
anode. The working gas, typically Ar, is ionized, forming a glow discharge plasma.
Positive Ar ions in the plasma are accelerated and drawn towards the target and strike it
with a kinetic energy of several hundred eV. This powerful impact will dislodge atoms
of the target into the vapor phase. The dislodged target atoms will have substantial
kinetic energies and transport to the substrate through a region of reduced pressure.
When they arrive at the substrate, they condense, nucleate and grow to form a thin film.
Generally, the sputtered layers adhere well to the substrate.
36
Sputtering approaches include diode sputtering, radio frequency (RF) sputtering,
magnetron sputtering and reactive sputtering. Magnetron sputtering is the current
workhorse of the sputter deposition field, used in perhaps 95% of all sputtering
applications. Our device is a magnetron sputtering.
The most important parameters controlling the growth and properties of the films by
sputter deposition processes are: 1) target voltage and current, 2) working gas partial
pressure and flow rate, and 3) substrate temperature and substrate bias. Therefore, by
adjusting these parameters, it is possible to use sputtering to deposit films with
extremely high quality.
There are a few limitations on sputtering as a deposition technique. For example,
organic solids are frequently unable to withstand ion bombardment and some materials
are incompatible with good vacuum because of their volatility. In general, sputtering is
a versatile process applicable to thin film deposition of electrically conducting and
insulating materials, elemental materials, alloys, and compounds.
We used a Hummer 8 magnetron sputtering (Anatech, Ltd) to deposit Mo, MoRe, Ta,
Nb, WRe and Ir electrodes on BASE tubes and disks in this research.
38
2.2.4 Flame Spraying
Flame spraying is the most basic form of thermal spraying. It generally uses an
oxyacetylene flame to melt and propel a coating material in the form of powder or wire
at high velocity onto a substrate where solidification occurs rapidly, forming either a
protective coating or a bulk shape. Flame spraying results in fine, chemically
homogeneous coatings, where there is no change in composition with thickness. But due
to low flame temperatures and medium particle velocity, the coating could be low
density and have low adhesion.69-70
Because considerable heat is imparted to the substrate and the solidification occurs
rapidly, thermal degradation of substrate properties and the coating could occur. Both
the substrate and coating contract upon cooling, which can generate high residual
stresses if a significant difference in coefficients of thermal expansion exists and these
stresses can lead to coating delamination. Additionally, a metal substrate or coating
could be oxidized in the deposition process. However, flame spraying is simple in
principle and operation, and system and production costs are low, comparing to other
thermal spraying, such as plasma spraying.
In this research, we use this technique to deposit most of mixed metal and ceramic
electrodes on the BASE surface.
39
2.2.5 Coulter Counter
A Coulter counter is an apparatus to count and size particles and cells, utilizing the
technology known as the Coulter principle (electrical sensing zone method). This
technology was originally developed by Wallace H. Coulter as a method to count blood
cells, and later it was transferred into industrial applications. Now, it has become the
accepted "reference method" throughout the world for particle size analysis and widely
used in both industrial particle characterization and for biological applications, providing
the highest resolution available for particle sizing and counting.72-73
The Coulter method is based on measurable changes in electrical resistance as
nonconductive particles suspended in a conductive solution are swept through a small
aperture of known diameter and length. Figure 2.6 is a diagram of the Coulter counter,
including a conductive solution, two electrodes and a glass aperture tube. Two
electrodes are submerged in the solution and separated by the glass aperture tube. When
voltage is applied between them, a "sensing zone" is created around the aperture.
Particles being measured are suspended in the conductive solution. If a vacuum is
applied to the top of the glass tube, the solution with the suspended particles will flow
into the glass tube through the aperture. As each particle passes through the aperture it
displaces its own volume of electrolyte, momentarily increasing the resistance of the
aperture and a voltage pulse is measured. This pulse’s amplitude is directly proportional
to the volume of the particle. Scaling these pulse heights in volume units enables a size
distribution to be acquired and displayed. In addition, if a metering device is used to
40
draw a known volume of the particle suspension through the aperture, a count of the
number of pulses will yield the concentration of particles in the sample.74
The method has been utilized to characterize thousands of different industrial
particulate materials: drugs, pigments, fillers, toners, foods, abrasives, explosives, clay,
minerals, construction materials, coating materials, metals, filter materials, and many
others have all been analyzed by the coulter principle.75 In fact, the method can be used
to measure any particulate material that can be suspended in an electrolyte. Particles can
routinely be measured having the size as small as 0.4 µm and as large as 1200 µm in
diameter.
We used this technique to measure the particle distribution of our sodium titanate and
mixtures of metal and sodium titanate.
Figure 2.6. Schematic diagram of the Coulter counter.
External Electrode
Internal Electrode
Orifice Glass tube
Electrolyte with suspended particles
To Vacuum
U
41
CHAPTER III
PREPARATION OF MIXED IONIC AND ELECTRONIC
ELECTRODES
3.1 Introduction
A key component of achieving high efficiency in an AMTEC device is its cathode.
The basic requirements for an AMTEC electrode are having a melting temperature
higher than the operating temperature of AMTEC, 1123-1223K, and being stable for a
long periods of time at those operating temperatures. The electrode also should be
chemically and thermally compatible with other components in the cell, including
sodium and BASE. It must not form new phases with other components of the cell
which would adversely affect the performance of the cell. Additionally, the electrode
should have good electronic conductivity, very low vapor pressure at AMTEC
temperatures and capability of high rates of ionic or diffusive transport of sodium.39
For mixed ionic and electronic electrodes, the electronic component is generally a
metal, which provides a conduction path for electrons, and the ionic component is a
ceramic material, which provides the Na+ transport path. The properties of these two
components and their interaction with the BASE determine the performance of the
electrode. In this chapter, we first investigated the compatibility of components in the
mixed electrode, in which we calculated Gibbs free energy and constructed chemical
potential diagrams for different systems. Second, we examined selected pure metal
electrodes and their performance, and selected the best metal candidate for a MIEE.
42
Third, we discussed the preparation of a series of mixed electrodes with different
compositions using selected metal with sodium titanate, and measured their
performance. Finally, we developed a theoretical model based on percolation theory,
which we construct to predict and explain the experimental results and indicate the
optimal composition for a MIEE.
3.1.1 Metal Component Selection
In order to meet the requirements of an AMTEC electrode, both physical and
chemical properties of prospective metals must be considered, such as coefficient of
thermal expansion, vapor pressure, and reactivity.
The coefficient of thermal expansion (CTE) is an important factor for electrode
selection. Although the electrode film is very thin, hence not subject to great internal
stresses, the CTEs of the electrode and BASE still need to match each other in order for
the electrode to remain bonded to the BASE during the AMTEC operation, especially
during periods of thermal cycling. Low vapor pressure helps ensure that a sufficient
amount of electrode remains after an extended period at high temperature and reduces
the chance of contaminating other components in the cell. A low surface-self diffusion
coefficient corresponds to slow sintering behavior, helping to maintain a stable physical
morphology over the lifetime of the electrode, especially in the reaction area at the three-
phase boundary between electrode, electrolyte, and sodium vapor space. Other
necessary characteristics of electrode materials include inertness with respect to sodium
and BASE and no dissociation at AMTEC operating temperatures.
43
Table 3.1 lists the properties of all metals with a melting point higher than 1273K,
including electrical resistance, thermal expansion coefficient, vapor pressure and
surface-self diffusion coefficient, relevant to AMTEC operation. Na-β”-alumina is
included at the bottom of the table for comparison. It is found that iridium and niobium
both provide a close match to BASE’s thermal expansion, and possess low vapor
pressure and surface-self diffusion coefficients, similar to molybdenum’s, which has
been used as an AMTEC electrode and exhibits adequate sintering behavior.
Additionally, iridium also has a low electrical resistance, while niobium provides a
higher electrical resistance. Combining all these properties, iridium offers a good
possibility for AMTEC electrode candidates. Niobium may be a good candidate too,
though its electrical resistance is not very low. Hafnium, tantalum and zirconium also
have similar CTE to BASE, but hafnium possesses a very large electrical resistance. For
these reasons, tantalum, iridium and niobium have been examined as electrode materials
in this research.
Rhodium, platinum, rhenium, ruthenium and vanadium metals all have low vapor
pressure, along with relatively low electrical resistances and surface-self diffusion
coefficient, but their CTEs are higher than that of BASE. These metals might be
effective if alloyed with the metal having low CTE, such as tungsten or molybdenum.
For the purpose of this research, WRe, WRh, and MoRe alloy electrodes were all tested.
Metals with higher surface-self diffusion or thermal expansion coefficients that don’t
match the electrolyte are not qualified for AMTEC metal electrodes, but may be suitable
in a MIEE electrode with ceramic material. The ceramic component is able to form a
44
framework to help control the sintering behavior of the metal, and effectively adjust the
CTE of the electrode to help reduce thermal stresses. Ni is such a metal, and thus could
be a candidate material for the metal component in a MIEE.
In summary, due to low vapor pressure, surface-self diffusion coefficient, similar
thermal expansion coefficient to that of BASE and relative low electrical resistance,
iridium, niobium and tantalum appear to have potential to conduct good performance in
an AMTEC power system. Therefore, the performances of these metals were tested as
AMTEC electrode materials in this research. Nickel metal has also been investigated as
a MIEE component candidate due to the idea that the two components, metal and
ceramic, might restrict each other and possibly result in good performance. Additionally
WRe, WRh, and MoRe alloy electrodes appeared promising due to their ability to
achieve the desired thermal expansion coefficient and were thus examined as well.
All the preceding discussion of metal electrode selection is only based on their
physical properties. According to the AMTEC electrode requirements, the chemical
properties of these metals are also needed to examine. The chemical potential diagram
will provide this information.
45
Table 3.1. Physical properties of metals studied in this research, including melting
point(Tm), electrical resistivity(R) and coefficient of thermal expansion (CTE) at
different temperature, vapor pressure (Pvap) at 1273K, and surface-self diffusion
coefficient(Ds) at 1273K.
Electrode Tm(K)b R(μΩ*cm)bCTE(10-6/K)b T(K)a Pvap(torr)c Ds(cm2/s)b,d
Beryllium(Be) 1560 26 17 973 1.49E-04
Chromium(Cr) 2133 47 9.4 925 5.72E-06 2.20E-7
Copper(Cu) 1358 8.1 20.3 1250 6.17E-05 1.87E-9
Cobalt(Co) 1767 26.5 14.0 673 8.53E-08 7.98E-13
Hafnium(Hf) 2500 84.4 6.3 673 5.23E-16
Iridium(Ir) 2720 15.1 7.2 773 3.07E-17 1.00E-9
Iron(Fe) 1809 105.5 14.6 1073 2.11E-06 1.50E-5
Molybdenum(Mo) 2888 31 5.75 1273 4.92E-17 6.90E-10
Nickel(Ni) 1728 45.5 16.3 1173 9.41E-08 5.80E-6
Niobium(Nb) 2740 59.7 7.72 1073 1.57E-19 4.10E-10
Palladium(Pd) 1827 40 13.6 1273 8.80E-07
Platinum(Pt) 2043 43.1 10.2 1273 1.28E-12 1.40E-7
Rhenium(Re) 3453 4.7 8.5 373 6.63E-22
Rhodium(Rh) 2239 14.6 9.8 773 1.16E-12 3.00E-9
Ruthenium(Ru) 2583 7.7 9.6 293 2.19E-16
Tantalum(Ta) 3253 35 6.6 773 1.68E-23 2.70E-8
Thorium(Th) 2028 14 11.2 293 1.50E-15
Titanium(Ti) 1940 165 9.9 1073 1.05E-09
Tungsten(W) 3660 33 4.6 1273 2.72E-25 2.30E-13
Vanadium(V) 2175 10.4 1173 4.02E-11
Zirconium(Zr) 2125 44 5.9 293 4.84E-15
Na-β′′-Al2O3 2253 8.6 1273 a Both electrical resistance and CTE are given at this temperature. b From Ref. 76. c From Ref. 77. d. From Ref 78.
46
3.1.2 Chemical Potential Diagram
Before using metal and sodium titanate to make the mixed electrode, we must
examine if they could co-exist and be stable at AMTEC operating temperatures. At
AMTEC temperatures, molecules have high kinetic energy and are able to diffuse
rapidly or react with each other. This diffusion and reaction could dramatically degrade
electrode performance. The chemical stability of the electrode is quite important for
obtaining good performance of high temperature electrochemical cells.
If chemical reactions occur between the electrolyte and electrode in high temperature
electrochemical cells under operating conditions, the product phase(s) would be very
difficult to identify it in situ. Although microstructure and composition identification
could be examined after the operation, the product phase(s) could be stable only at
operating temperatures. So the post-test examination might not give us enough
information to understand the behavior of the electrode during the operation. Chemical
potential diagrams have been proposed as a thermodynamic way of examining the
thermodynamic stability of electrode-electrolyte interfaces.
For high temperature electrochemical cells, when the chemical potential relations
among the species across interfaces deviates from equilibrium, the difference provides
the driving forces for formation of new phases. When there arises a chemical potential
gradient, this provides the driving force for chemical diffusion. Thus, chemical potential
diagrams can demonstrate the following information:
47
1. Chemical phases present in the system. The chemical potential diagram consists of
stability polygons for compounds, which illustrates the stable phases under
experimental conditions.
2. Reactions possibly occurring between electrode and electrolyte as a function of
polarization. Usually, polarization of electrochemical cells can be related to a
change in chemical potential of a particular species associated with ionic carriers in
the electrolyte. Therefore, an appropriate chemical potential diagram can illustrate
the effect of polarization on chemical stability of the interface.
3. Reaction products arrangement or reaction steps. When reactions actually occur at
interfaces, there arise chemical potential gradients across the interface. If a reaction
proceeds slowly enough to be followed by diffusion of elements involved, reaction
products can be arranged so as to give gradual changes of chemical potentials,
which shows in chemical potential diagram.
Therefore, the use of chemical potential diagrams provides a powerful basis of
applying thermodynamic considerations to practical materials problems.
48
3.2 Experimental
3.2.1 Electrode Preparation
Pure metal electrodes, such as Ta, Nb, Ir, WRh, WRe and MoRe were sputtered in
our lab using the Hummer 8 turbo sputtering system (Anatech, Ltd). Ni electrodes were
fabricated by evaporation in Southwest Impreglon, Houston.
Sodium titanate powder was purchased from Strem chemicals Inc., with a particle
size as large as 37μm. To improve MIEE performance, these powders were milled in
ethanol solution by steel balls of different size for a few days, followed by drying and
grinding. These milled sodium titanate powders were mixed with pure metal powders at
calculated mass ratios by ball-milling for a day, then dried and ground again. The
particle size distribution was measured by a Coulter Multisizer in Mechanical
Engineering Department, TAMU. The mixed powders were deposited on the β″-
alumina tube outside wall by flame spray at Hitemco Inc or Alamo Supply, in Houston,
Texes.
3.2.2 Setup and Measurement
The SETC was set up as described in Chapter II. Each sample consists of a
cylindrical β"-alumina tube with 4 electrode bands, approximately 0.25cm wide,
deposited on the outer surface of BASE and separated by 0.25cm spaces and covered by
Ni metal mesh or Cu mesh as the current collector. Ni or Cu leads are used to tie these
current collector on to the β"-alumina tube and threaded through α-alumina rods to out
of the manifold, shown in Figure 3.1.
49
Electrochemical impedance measurements were performed using a Solartron 1250
Frequency Analyzer and a Solartron 1287 Electrochemical Interface in the frequency
range between 105Hz and 0.1Hz. A small amplitude (10mv) sinusoidal wave output was
superimposed on the applied dc potential. Impedance was measured every day for each
electrode to record their performance over time, but the overall experiment running time
can differ based on sample performance and other factors. The electrode temperature
was around 850oC and the pool temperature was 290oC. The SETCs had fluctuations in
temperature control, such that these temperatures varied in the range of 840-860oC and
280-305oC.
The microstructures of electrodes before and after testing in the SETC were observed
by a microprobe in the Geology and Geophysics department, TAMU. This electron
microprobe is a four-spectrometer Cameca SX50 equipped with a PGT energy dispersive
system and a dedicated Sun workstation.
β″-Alumina Tube
Electrodesα-alumina rods
Lead
Figure 3.1. Schematic diagram of SETC electrodes.
50
3.3 Results and Discussion
3.3.1 Calculation of Chemical Potential Diagrams
The chemical potential diagrams are plotted based on the calculation of Gibbs free
energy of reactions and equilibrium partial pressure of oxygen. The detailed calculations
are displayed in appendix A.
Chemical Potential Diagram for the Na-Al-O System at 1100K. ⎯ For the Na-Al-O
system, all possible reactions and calculated equilibrium partial pressure of oxygen for
each reaction are listed in Table 3.2. The thermodynamic properties of β- and β″-
alumina have been measured by several authors79-81 and reviewed recently by
Barsoum.82 Although the thermodynamic properties of β-alumina (Na2Al22O34) have
been well established, those of β″- alumina (NaAl5O8) have not been clarified yet. The
thermodynamic data of β-and β″-alumina adopted in this calculation are from Barsoum’s
evaluation and Itoh’s measurements80 respectively.
Figure 3.2(a) shows the chemical potential diagram for the Na-Al-O system at
1100K. This diagram shows that β″-alumina is thermodynamically stable at this
temperature but its stability region is very narrow. Therefore β″-alumina is easy to
convert to its neighbors NaAlO2 and Na2Al22O34. Additionally, with the temperature
increase, the stability region of β″-alumina will become narrower and finally become a
line at some temperature, which means β″-alumina is not a stable phase at that
temperature and decomposes into NaAlO2 and Na2Al22O34. This is in agreement with
the experimental results of Barsoum, who found that at low temperatures, β″-alumina is
thermodynamically stable, while at high temperatures (around 1773K), and this phase
51
decomposes into β- alumina and NaAlO2. Thus, chemical potential diagram provides
theoretical evidence for BASE degradation in AMTEC.
The equilibrium oxygen partial pressure over β″-alumina is a function of the sodium
partial pressure. The slope of stability range of β″-alumina is –4, which means that a
slight change in the sodium partial pressure gives rise to a drastic change in the
equilibrium oxygen pressure. In AMTEC, the vapor pressure of sodium ranges from 1
to 10-5 atm.38, 44,83 Figure 3.2(a) indicates that to keep β″-alumina within its stability
field, the oxygen partial pressure should be maintained at low levels ( 28102
−<OP atm)
depending on the sodium partial pressure.
Chemical Potential Diagram for the Na-Ti-O Systems at 1100K. ⎯ For the Na-Ti-O
system, well-defined thermodynamic data are not available. There are only a few
literature sources concerning this system and they differ from each other. In this
research, these thermodynamic data were assessed before calculation, and then the most
reasonable ones were adopted, but no experimental measurements were done in our lab.
Therefore, the chemical potential diagram of the Na-Ti-O system, shown in Figure
3.2(b), may not be as accurate as the Na-Al-O system. All reactions and their
equilibrium partial pressure of oxygen are listed in Table 3.3.
It is found that Na2Ti2O5 is not present in this diagram, although it reacts with
sodium or other compounds and is listed in Table 3.3. This means this compound is not
stable at this temperature in our system. Although it could be formed at this
temperature, it will convert to other sodium titanates, which is in agreement with the
results of Eriksson and Pelton.84 They assessed the Na2O-TiO2 phase diagram, and
52
found that there is not Na2Ti2O5 compound present in it. This agreement indicates that
our calculation is valid. Figure 3.2(b) shows that Na2Ti3O7, Na2Ti6O13 and TiO2 are
stable at AMTEC condition, depending on the real oxygen partial pressure.
Table 3.2. Equilibrium partial pressure of oxygen ( 2OP ) of reactions in the
Na-Al-O system at 1100K.
Reaction Partial Pressure of Oxygen (atm)
2Al(l)+ 3/2O2(g)→ α-Al2O3(s) 04.42log2
−=OP
2Al(l)+ 3/2O2(g)→ γ-Al2O3(s) 59.41log2
−=OP
2Na(g) + 1/2O2(g)→Na2O(s) NaO PP lg449.26log2
−−=
Na(g) +Al(l) + O2(g)→NaAlO2(s) NaO PP lg56.42log2
−−=
Na(g) +5Al(l) + 4O2(g)→NaAl5O8(s)a NaO PP lg4111.42log
2−−=
2Na(g) +22Al(l) + 17O2(g)→Na2Al22O34(s)b NaO PP lg17201.42log
2−−=
4Na(g) + NaAl5O8(s) + O2(g)→5NaAlO2(s) NaO PP lg434.44log2
−−=
12Na(g) + 5Na2Al22O34(s) +3O2(g)→22NaAl5O8(s) NaO PP lg418.45log2
−−=
20Na(g) + Na2Al22O34(s) + 5O2(g)→22NaAlO2(s) NaO PP lg493.44log2
−−=
2Na(g) + Al2O3(s) + 1/2O2(g)→2NaAlO2(s) NaO PP lg447.45log2
−−=
2Na(g) +5Al2O3(s) + 1/2O2(g)→2NaAl5O8(s) NaO PP lg498.49log2
−−=
2Na(g) +11Al2O3(s) + 1/2O2(g)→Na2Al22O34(s) NaO PP lg477.55log2
−−=
a.From Ref. 80 b.From Ref. 82
53
Table 3.3. Equilibrium partial pressure of oxygen (
2OP ) of reactions in the Na-Ti-O
system at 1100K.
Reaction Partial Pressure of Oxygen (atm)
Ti(s)+ O2(g)→TiO2(s) 36.35log2
−=OP
2Na(g) + 1/2O2(g)→Na2O(s) NaO PP lg449.26log2
−−=
2Na(g) +Ti(s) +3/2O2(g)→Na2TiO3(s) NaO PP lg3411.39log
2−−=
2Na(g) +2Ti(s) +5/2O2(g)→Na2Ti2O5(s) NaO PP lg5490.37log
2−−=
2Na(g) +3Ti(s) +7/2O2(g)→Na2Ti3O7(s) NaO PP lg7444.37log
2−−=
2Na(g) +6Ti(s) +13/2O2(g)→Na2Ti6O13(s) NaO PP lg13454.36log
2−−=
2Na(g) + Na2Ti2O5(s) +1/2O2(g) →2Na2TiO3(s) NaO PP lg422.45log2
−−=
2Na(g) + 2Na2Ti3O7(s) +1/2O2(g) →3Na2Ti2O5(s) NaO PP lg436.44log2
−−=
4Na(g) + Na2Ti3O7(s) +O2(g) →3Na2TiO3(s) NaO PP lg496.44log2
−−=
2Na(g) + Na2Ti6O13(s) +1/2O2(g) →2Na2Ti3O7(s) NaO PP lg407.48log2
−−=
4Na(g) + Na2Ti6O13(s) +O2(g) →3Na2Ti2O5(s) NaO PP lg471.46log2
−−=
10Na(g) + Na2Ti6O13(s) +5/2O2(g) →6Na2TiO3(s) NaO PP lg478.45log2
−−=
2Na(g) + TiO2(s) + 1/2O2(g) →Na2TiO3(s) NaO PP lg458.46log2
−−=
2Na(g) + 2TiO2(s) + 1/2O2(g) →Na2Ti2O5(s) NaO PP lg406.48log2
−−=
2Na(g) + 3TiO2(s) + 1/2O2(g) →Na2Ti3O7(s) NaO PP lg450.49log2
−−=
2Na(g) + 6TiO2(s) + 1/2O2(g) →Na2Ti6O13(s) NaO PP lg470.50log2
−−=
54
-45
-40
-35
-30
-25
-20
-9-8-7-6-5-4-3-2-10LogPNa/atm
Log
P O2/a
tm
β, Na2Al22O34
NaAlO2
Al2O3
Na2O
Al
β", NaAl5O8
-45
-40
-35
-30
-25
-20
-9-8-7-6-5-4-3-2-10LogPNa/atm
LogP
O2/a
tm
TiO2
Ti
Na2Ti6O13
Na2Ti3O7Na2TiO3
Na2O
Figure 3.2. Chemical potential diagrams for (a) the Na-Al-O system. (b) the Na-Ti-O
system at 1100K.
(a) Chemical Potential Diagram for the Na-Al-O system at 1100K.
(b) Chemical Potential Diagram for the Na-Ti-O system at 1100K.
55
Chemical Potential Diagram for the Na-Ti-Al-O Systems at 1100K. ⎯ For the
Na-Ti-Al-O system, there may be some quaternary oxides present, such as NaAl5Ti2O12
and Na2Al2Ti6O16, but thermodynamic data are not available for these compounds. If
these compounds do exist, they generally could be synthesized by solid oxide reactions
at elevated temperature. We assume that these two compounds just start being formed at
1100K, which in fact is too low temperature for ceramic oxide formation. Based on this
assumption, we estimated the minimum Gibbs free energy of formation for these two
compounds at 1100K, listed in Table 3.4.
When chemical potential diagrams of the Na-Al-O and the Na-Ti-O systems are
superimposed in Figure 3.3, some compounds coexist at some regions and they could
react each other. These reactions are listed in Table 3.4. Calculation of the Gibbs free
energy of reaction for all these reactions (see calculation in Appendix A) shows that all
rxnGΔ are greater than 0, which means these reactions are unlikely to occur in our
system. Therefore, at each point in Figure 3.3, one compound in the Na-Al-O system
and another compound in the Na-Ti-O system are in equilibrium with each other, except
in the low sodium pressure region, in which TiO2 and Al2O3 are present. When these
two systems overlap, TiO2 and Al2O3 could react with each other and form Al2TiO5,
Al2Ti7O15 or Al3Ti5O2 compounds. Because this region is far away from our
experimental conditions, thus, any change would not affect our experimental results.
Additionally, there are no thermodynamic data available for these compounds.
Figure.3.3 illustrates that the stability region of Na2Ti6O13 is far from that of β″-
alumina, suggesting the decomposition of Na2Ti6O13 is thermodynamically favored
56
during operation. Furthermore, if the decomposition reaction rate is high enough at
experiment temperature, Na2Ti6O13 will not be present. Figure 3.3 also shows that the
stability region of Na2Ti3O7 is overlapped with β″-alumina stability region. In the
overlap section, Na2Ti3O7 is stable with β″-alumina; while in the left section, Na2Ti3O7
thermodynamically converses to Na2TiO3. However, because the equilibrium line
between Na2Ti3O7 and Na2TiO3 is so close to the line of NaAlO2 and β″-alumina, the
driving force of Na2Ti3O7 conversion is very small. Therefore, it is believed that
Na2Ti3O7 is basically stable with β″-alumina at our experimental conditions.
It was reported that the Na2MoO4 treated Mo electrodes exhibit high electrode
activity, due to the high Na+ conductivity of Na2MoO4. Unfortunately, sodium
molybdenum oxides can not thermodynamically be in equilibrium with a Mo/BASE
interface, which results in the degradation of the electrochemical activity.85 Figure 3.3
illustrates that sodium titanate is thermodynamically favored to be stable with BASE,
which confirms that Na2Ti3O7 sodium titanate is a promising candidate of MIEE for
AMTEC.
57
-45
-40
-35
-30
-25
-20
-9-8-7-6-5-4-3-2-10LogPNa/atm
LogP
O2/a
tm
Al
TiO2
Ti
Na2Ti6O13
Na2Ti3O7
Na2TiO3
Na2O
÷∅alumina
NaAlO2 Al2O3
÷"
Table 3.4. Minimum Gibbs free energy changes ( rxnGΔ ) of reactions in the
Ni-Ti-Al-O system at 1100K.
Reaction rxnGΔ (kJ)
2Na(g)+2Al(s)+6Ti(s)+8O2(g)→Na2Al2Ti6O16(s) -6050a
Na(g)+5Al(s)+2Ti(s)+6O2(g)→NaAl5Ti2O12(s) -4908.18a
5NaAlO2(s)+2Na2TiO3(s)→NaAl5Ti2O12(s)+8Na(g)+2O2(g) 172
2NaAlO2(s)+6Na2TiO3(s)→Na2Al2Ti6O16(s)+12Na(g)+3O2(g) 344
22Na2Ti3O7(s)+Na2Al22O34(s)→11Na2Al2Ti6O16(s)+24Na(g)+6O2(g) 3001
11Na2Ti6O13(s)+Na2Al22O34(s)→11Na2Al2Ti6O16(s)+2Na(g)+1/2O2(g) 2858
44/3Na2Ti3O7(s)+5Na2Al22O34(s)→22Na2Al2Ti6O16(s)+52/3Na(g)+13/3O2(g) 3184
22/3Na2Ti6O13(s)+5Na2Al22O34(s)→22NaAl5Ti2O12(s)+8/3Na(g)+2/3O2(g) 3069
a This is the standard Gibbs Free Energy of formation.
Figure 3.3. Chemical potential diagrams for the Na-Al-Ti-O system at 1100K.
58
Metal Stability at 1100K. ⎯ From Figure 3.2(a) and 3.2(b), it is found that Al and
Ti cannot be used as AMTEC electrodes thermodynamically, because these metal
stability requires a very low level of oxygen pressure so that they are easily oxidized at
AMTEC conditions. We calculated the equilibrium oxygen partial pressure for oxides of
metal candidates at our experimental conditions, listed in Table 3.5.
It is found that Ni metal is stable with oxygen partial pressures lower than 10-14atm,
and Cu stable at oxygen partial pressures lower than 10-9atm, which means they are
stable as pure metals at AMTEC conditions. The same situation is also for metal Ir and
Co. Therefore, these four metals can be used as AMTEC electrodes. Zirconium has
been discussed above and could be a candidate, since it has a similar CTE with BASE,
but the thermodynamic calculation shows that it requires very low equilibrium partial
pressures of oxygen. Therefore, thermodynamics favorites it present as an oxide at
AMTEC operation conditions.
The equilibrium lines between Nb and its oxides are just in the AMTEC condition,
where oxygen partial pressures are close to 10-28atm. Nb and its oxides both could be
stable in AMTEC condition, depending on the real oxygen pressure in the system. The
similar situations are for Ta and Ta2O5 and V and its oxides. Therefore, Nb, Ta and V
could be used in AMTEC, though there are concerns about oxide formation.
All these discussions are based on the thermodynamic calculations. In fact, kinetics
also determines whether a reaction occurs or not. If the reaction rate is very slow, this
reaction can be considered as not occurring, although thermodynamically favored to
occur.
59
Table 3.5. Equilibrium partial pressure of oxygen (2OP ) of metal oxides at 1100K.
Reaction Partial Pressure of Oxygen (atm)
Cu(s)+ 1/2O2(g)→ CuO(s) 51.5log2
−=OP
2Cu(s)+ 1/2O2(g)→ Cu2O(s) 39.8log2
−=OP
3Co(s)+ 2O2(g)→ Co3O4(s) 6.11log2
−=OP
Co(s)+ 1/2O2(g)→ CoO(s) 8.14log2
−=OP
Ir(s)+ O2(g)→ IrO2(s) 4.2log2
−=OP
Ni(s)+ 1/2O2(g)→ NiO(s) 35.13log2
−=OP
Nb(s) + 1/2O2 (g)→ NbO (s) 4.30log2
−=OP
Nb(s) + O2 (g)→ NbO2 (s) 3.28log2
−=OP
2Nb(s) + 5/2O2 (g)→ Nb2O5 (s) 97.26log2
−=OP
Ta(s) + O2 (g)→ TaO2 (s) 05.11log2
−=OP
2Ta(s) + 5/2O2 (g) → Ta2O5 (s) 7.29log2
−=OP
V(s) + 3/2O2 (g) → V2O3 (s) 7.29log2
−=OP
V(s) + 2O2 (g) → V2O4 (s) 2.25log2
−=OP
Zr(s) + O2 (g) → ZrO2 (s) 2.42log2
−=OP
60
3.3.2 Pure Metal Electrodes
Ta, Ni, Nb, Ir, W and MoRe metal electrodes were examined in this research and
some of their Nyquist plots are shown in Figure 3.4, which are typical impedance spectra
for porous metal electrodes.86 The impedance spectra are very similar for all measured
metal electrodes, and are composed of two characteristic semi-circular curves with two
real axis intercepts and a short inductive tail at high frequency. From AMTEC
electrochemical theory,87 the difference between the high and low frequency intercepts
can be interpreted as the apparent charge transfer resistance, Ract, of the electrode, which
is a resistance including both charge transfer and sodium transport effects. The high
frequency intercept value is interpreted as the series resistance Rs, including lead
resistance, contact resistances of the leads to the current collector and the current
collector to the metal film, and part of the uncompensated BASE resistance. The tail at
high frequency is an inductance, caused by the ringlike nature of the contact wire and
electrode film around the BASE tube. Figure 3.4 shows that all tested metals have
similar impedance spectra, but the values of Rs and Ract are different, which means that
these metals performed differently.
For the same metal electrode, the impedance spectra also varied with time, generally
showing increasing Rs and Ract. Figure 3.5 shows the impedance change with time for a
Ta electrode. It is found that Rs and Ract both increase with time. For comparison, we
plotted graphs of Rs and Ract vs. experiment time for all measured electrodes, shown in
Figure 3.6 (a) and (b) respectively.
61
-2.5
-2.0
-1.5
-1.0
-0.5
0.0
0.53.0 4.0 5.0 6.0 7.0 8.0 9.0 10.0
Real Impedance(ohm.Cm2)
Imag
inar
y Im
peda
nce(
ohm
.Cm
2 ) Ta Ni Nb
Ir W MoRe
-6.0
-4.0
-2.0
0.0
6.0 8.0 10.0 12.0 14.0 16.0 18.0 20.0 22.0 24.0
Real Impedance(ohm)
Imag
inar
y Im
peda
nce(
ohm
)
to=0 t-to=1d t-to=4d t-to=7d t-to=10d t-to=15d t-to=18d t-to=20dt-to=22d t-to=25d t-to=26d t-to=28d t-to=32d t-to=36d t-to=40d t-to=42dt-to=44d t-to=47d t-to=50d t-to=53d t-to=54d t-to=55d t-to=56d t-to=60d
Figure 3.5. Impedance spectra change with experiment time for a Ta electrode.
Figure 3.4. Impedance spectra for different tested metal electrodes, at 850oC electrode
temperature and 285oC pool temperature.
62
0.0
1.0
2.0
3.0
4.0
5.0
6.0
7.0
8.0
0 10 20 30 40 50 60 70
Experiment time(Day)
Rs(
Ohm
.Cm
2 )
Ta Ni Ir Nb W MoRe
(a)
0.0
1.0
2.0
3.0
4.0
5.0
6.0
7.0
8.0
0 10 20 30 40 50 60 70
Experiment time(Day)
Rac
t(Ohm
.Cm
2 )
Ta Ni Ir
Nb W MoRe
(b)
Basically, Rs doesn’t vary too much with experiment time for most tested metal
electrodes, such as Ta, Nb, Ir and W. It fluctuated slightly with time at the beginning of
the experiment, which could be the period of electrode maturity, and then it remained
constant. The MoRe electrode has a Rs of about 5.2 ohm·cm2 at the beginning, and then
Figure 3.6. a) Series resistance Rs and b) apparent charge transfer resistance Ract
change with experiment time for tested metal electrodes.
63
after running 16 days, Rs increased with time sharply and finally stabilized at 6.3 ohm·cm2.
This jump of Rs value may be due to the electrode film debonding from the current
collector, which increases the contact resistance between the current collector and the
electrode film. The Ni electrode is an exception, because its Rs increased almost linearly
by 50% in 20 days. Ni metal has a larger thermal expansion coefficient (16.3×10⁻⁶ K-1),
substantially greater than those of BASE(8.6×10⁻⁶ K-1), as discussed in section 3.1. Such
a large difference in thermal expansion coefficient could produce insufficient contact
between electrode film and BASE at high temperature. Figure 3.6(b) illustrates Ract
changes with time. It is found that Ract increased with operating time rapidly for most of
the metal electrodes, except W. WRe electrodes were also tested, but performed very
poorly; Ract was as large as a few hundred, and is not listed in Figure 3.4 and 3.6.
Summarizing tested metal electrodes, it was found that Ir, Nb and Ta did not perform
as well as expected. Significant agglomeration of grains occurred after 14 days running
in SETCs for these three electrodes, as seen in SEM images in Figure 3.7. The extent of
grain growth is consistent with the sample’s surface-self diffusion coefficients listed in
Table 3.1. For example, Ta has the largest surface-self diffusion coefficient of 2.70×10⁻⁸
cm2/s at 1273K, and its grains became very large after running, while for the Ir sample
with surface-self diffusion coefficients of 1.00×10⁻⁹ cm2/s, the grain boundary still can be
seen. At high temperature, metal grain coalescence occurred in the electrode film, which
resulted in a decrease in the total number of grains and total triple phase reaction area
and then led Ract to increase. At the same time, the big grains can block Na gas diffusion
from the reaction site, which also cause Ract increase. These origins of electrode
64
degradation determine the lifetime of an AMTEC electrode. For W electrodes, Ract
decreased slightly with time. The reason could be the better contact between W and the
BASE, which results in the triple phase reaction area increasing with time. Because W
has a very small vapor pressure and self-diffusion coefficient in AMTEC temperature, W
particles have very slow grain growth.
The Ni sample was run for only 20 days in this test, but compared to the other tested
samples, it exhibited the best performance at the beginning, with the lowest Rs and Ract,
although these two parameters both increased with time of operation. Since Ni has
somewhat larger thermal expansion and diffusion coefficients, grain growth and
electrode delamination occurred in this sample, as shown in Figure 3.7, explaining that
Rs and Ract increased with time. Therefore, Ni itself is not a good candidate for AMTEC,
which requires Ract and Rs and their degradation with time to be as small as possible.
However, a mixed Ni/sodium titanate electrode might retain its initial good performance
for a long time.
Sodium titantate may provide a means of controlling the sintering behavior of metals
and maintain the porosity of the electrode by forming a ceramic formwork, which would
reduce the increase of Rs and Ract with time and keep the best performance for a long
time. Additionally, based on the metal stability calculation, it is known that Ni is very
stable in any AMTEC condition. It should not be oxidized to form volatile NaxNiOy
compounds with sodium at the AMTEC operating temperature, as occurs in Mo
electrodes. Therefore, Ni is selected as component with sodium titanate to make the
mixed electrode in this study.
65
Pre-test Ir sample ×5000 SE image Post-test Ir sample×5000 SE image
Pre-rest Ta sample ×5000 SE image Post-test Ta sample ×5000 SE image
2μm SE 15kV 2μm SE 15kV
Figure 3.7. Scanning electron microscope images for Ir, Ta, Nb and Ni electrodes.
66
Pre-test Nb sample ×5000SE image Post-test Nb sample ×5000 SE image
Pre-test Ni sample × 5000 SE image Post test Ni sample ×5000 SE image
Figure 3.7. (Continued)
2μm SE 15kV2μm SE 15kV
2μm SE 15kV 2μm SE 15kV
67
3.3.3 Mixed Ionic and Electronic Conducting Electrodes
We tested Ni/sodium titanate electrodes with the Ni/sodium mass ratios of 2:1, 3:1,
and 4:1, labeled as N21, N31 and N41 electrode respectively. Their impedance spectra
are shown in Figure 3.8. N41electrode displayed the smallest impedance and performed
best, followed by N21 electrode and the worse one is N21 electrode. Figure 3.9(a) and
(b) are the plots of Rs and Ract changes with experiment time for these mixed electrodes
and pure Ni electrodes for comparison. N31 and N41 electrodes had the very stable
performance; their Rs and Ract change slightly over 45 days, satisfying our goal of
AMTEC electrodes running over 1000 hours without degradation.
-9.0
-8.0
-7.0
-6.0
-5.0
-4.0
-3.0
-2.0
-1.0
0.0
1.00.0 5.0 10.0 15.0 20.0 25.0 30.0 35.0 40.0
Real impedance(ohm.cm2)
Imag
inar
y Im
peda
nce(
ohm
.cm
2 )
N21
N31
N41
Figure 3.8. Impedance spectra of Ni/sodium titanate electrodes with different Ni/sodium
titanate mass ratios.
68
0.0
2.0
4.0
6.0
8.0
10.0
12.0
0 10 20 30 40 50 60
Experiment time(Day)
Rs
(ohm
.cm
2)
N21 N31
N41 Ni(a)
0.1
1.0
10.0
100.0
0 10 20 30 40 50 60
Experiment time(Day)
Rac
t /(o
hm.c
m2 )
N21 N31N41 Ni
(b)
Figure 3.9. a) Series resistance Rs and b) apparent charge transfer resistance Ract change
with time for Ni/sodium titanate electrodes with the mass ratios of 2/1, 3/1 and 4/1.
69
For N21 electrodes, Rs and Ract increased with experiment time rapidly and they
performed even worse than pure Ni electrode, which indicated that the addition of
sodium titanate did not make the role as we expected, neither increasing the reaction area
nor restricting Ni grain growth. In these electrodes, it seems that the substitution of
sodium titanate for some Ni particles reduces the conductivity of the electrode, and
occupies some positions on the interface between electrode and BASE so that the triple
phase boundary reaction area decreases.
For N31 electrodes, the electrode conductivity is comparable to the pure Ni
electrodes, but the Ract is still greater than that of a pure Ni electrode. This indicates that
the amount of Ni in the mixed electrode should not be less than 75% mass percent, i.e.
75% mass percent Ni is the minimum to guarantee good electrode conductivity, while
this amount seems to be insufficient to increase the electrode reaction area.
For N41 electrodes, the Rs and Ract both are smaller and more stable than those of
pure Ni metals. In these mixed electrodes, it seems that the sodium titanate restricts the
growth of Ni grains so that the electrode retains its good behavior for a long time and
greatly increases the reaction area to make Ract decrease significantly.
The microstructure of this electrode confirmed this explanation, shown in Figure
3.10 and observed after tested over 60 days. In Figure 3.10(a), the white grains are Ni,
such as B and C particles, while the gray grains are the sodium titanates, such as A
particles. It is found that these two types of particles interwove with each other, which
effectively blocks particle agglomeration. For example, the sodium titanate particle A is
70
at the neck between the Ni particles B and C. It successfully restricted the B grain
further connecting with C and becoming larger.
×2000 BSE image
×2000 Ti x-ray map ×2000 Ni x-ray map
Figure 3.10. Microstructure of Ni/sodium titanate electrode with the mass ratios of
4/1, after testing in a SETC over 60 days.
A
B
C
71
3.3.4 Theoretical Analysis of the Optimum Composition for MIEEs
For the mixed conducting cathode, the phenomena that take place in the
electrochemical process include 1) transport of electrons from the current collector (Ni
mesh) to the reaction site through an electronic conductor (Ni); 2) transport of Na+ ions
from the electrolyte to the reaction site through the ionic conductor (Na2Ti3O7); 3)
electrochemical reactions at an electrochemically active site; 4) the reaction product,
sodium vapor, diffuses from the reaction site to the outside surface of electrode through
pores present in the electrode. Therefore, the best MIEE should effectively support
those four processes with as small resistance as possible.
In a MIEE there are three cluster types formed by mixed metal and ceramic particles,
shown in Figure 3.11. We will focus on the ionic conductor, though similar conditions
apply to the electronic conductors. Type A clusters are not interrupted through the
electrode, present many branches, and connect with each other to form a network, which
provides ion paths directly from the electrolyte to the current collector. Type B clusters
are shorter chains connected only to the electrolyte, which bring Na+ ions only though a
fraction of the electrode. Finally, type C clusters are completely isolated from the
electrolyte and current collector; they do not assist in ionic conduction.
72
Two parameters are of great importance for good electrode performances: a large
three-phase boundary area, which is the active area for the electrochemical reaction, and
high ionic and electronic conductivities. In order to have good conductivity, particles of
the same type (electronic conductor or ionic conductor) have to touch each other so that
a network is formed through the electrode, such as the type A clusters, which can
effectively supply electrical charges to the whole electrode. Moreover, adequate contact
between particles of different types ensures that a large active reaction area is formed.
Therefore, having both the electron and the ion conduction paths continuous throughout
the electrode is necessary for good performance, i.e., a large number of A-clusters must
be present in the electrode for both types of conductor. Mathematical modeling shows
Figure 3.11. Scheme of the mixed ionic and electronic electrode, and different
types of clusters formed by the particles.
B
A
Porous Current Collector
Ionic Conductor
Electronic Conductor
BASE
Na+
Na+
Na+
C
73
that there is a critical value for the volume fraction of electronic or ionic conducting
particles, under which the particles form only B- and C-clusters in the electrode. Only
above this threshold is a network of A-clusters formed. This critical value of the volume
fraction (Vc) is referred as the percolation threshold. Percolation theory shows that
above the percolation threshold, some of the physical properties of system will change
sharply and will scale according to the universal law bcVV )( −∝Φ , where Φ represents
a physical property, such as the electrical or thermal conductivity and the exponent b is
insensitive to the microstructure of the composite.88-89 For a MIEE, there are two
percolation thresholds present, one for the electronic conductor and another for the ionic
conductor. A sharp increase in the performance has been predicted to occur at the
percolation thresholds and there is a window of compositions between the percolation
thresholds in which the performance is predicted to be very high. Additionally, the
pores in the electrode also need to satisfy percolation theory. But since the size, shape
and number of pores are controlled by the fabrication techniques, we don’t consider its
effect on the optimal performance of the electrode in this model. In fact, for sputtering
or flame spray fabrication technique, the deposited film has 30-40% void density, which
could higher than the percolation thresholds for the pores.
Some researchers have applied the theory of percolation threshold in studying the
properties of composite materials.90-93 In this research we developed a model to assess
the optimum composition of an AMTEC electrode, based on the theories of percolation
and binary random packing of spheres.
74
The model is valid between the percolation thresholds of the ionic and the
electronic conductors and is based on the following assumptions: (1) steady state
conditions;(2) one-dimensional model as a function of the electrode thickness (x) (3)
uniformity of temperature, pressure, reactant and product concentration;(4) each of the
two conducting phases within the electrode is considered as continuous and
homogeneous, having a resistivity independent of the x coordinate; 5) the particles that
form the electrode are spherical, and 6) all particles of the same type have the same
diameter.
For the mixed electrode consisting of spherical electronic conductors, i.e. metal
particles of radius re and spherical ionic conductors, i.e. ceramic particles of radius ri, the
particle coordination numbers are calculated using the following equations proposed by
Bouvard et al.94
ZZZnZ ei
eei =− (3.1)
2)1(33
λiii nn
ZZ−+−
+= (3.2)
2
2
)1()3(3
λλ
iie nn
ZZ−+−
+= (3.3)
where the indexes i and e represent the ionic and electronic conductors, respectively. Zi-e
is the average number of electronic particles in contact with an ionic particle. Zi and Ze
are the coordination numbers of ionic and electronic particles, respectively, i.e. the
average number of contacts of both ionic and electronic particles with an ionic particle
(Zi) or an electronic particle (Ze). Z is the overall average coordination number, which is
75
6 for binary random packing of spheres. The parameter λ is the particle size ratio,
ie rr /=λ and ni is the number fraction of ionic particles, which is related to the volume
fraction Vi by equation (3.4). The relationship between ni and ne, or Vi and Ve is shown
in Equation (3.5).
ei
ii VV
Vn+
= 3
3
λλ
ei
ee VV
Vn+
= 3λ (3.4)
and 1=+ ei nn 1=+ ei VV (3.5)
Additionally, there are two more types of coordination number needed to mention,
which are the average coordination number of same type particles, Zi-i and Ze-e. Zi-i is the
average number of ionic particles in contact with an ionic particle, and Ze-e is the average
number of electronic particles in contact with an electronic particle. These two
coordination numbers are directly related to the percolation threshold. Relationships
between Zi-i and the percolation threshold have been found by different researchers and
there are discrepancies among them. Kuo et al evaluated all these works and concluded
that it is more accurate that the percolation threshold of ionic or electronic particles is
obtained under the condition of Zi-i=1.764 or Ze-e=1.764 respectively.95 The relationship
is the following, and it is based on the model of Suzuki and Oshima.96
2)1( λii
iii nn
ZnZ−+
=− )1(
)1(2
ii
iee nn
nZZ−+
−=− λ
(3.6)
Combining equations (3.4) and (3.6), it is found that the percolation threshold is a
function of the particle size ratios. We calculated the theoretical percolation threshold of
ionic and electronic conductors corresponding to all possible particle size ratios, and
76
plotted in Figure 3.12. The area limited by these two threshold lines is the predicted
high performance range. When λ=1, the percolation threshold of volume fraction is
Vic=Vec=0.294, i.e. if the two kinds of particles have the same size, the electrodes with
electronic particle volume fractions of 0.294 to 0.706 should display good performance.
0.294
0.294
0
0.2
0.4
0.6
0.8
1
0 0.5 1 1.5 2 2.5 3 3.5 4particle size ratio( re/ri )
volu
me
frac
tion
of m
etal
0
0.2
0.4
0.6
0.8
1
volume fraction of ceram
ic
Vec
Vic
Electronic percolation threshold
Ionic percolation threshold
High performance range0.510
0.143
In this research, the purchased sodium titanate has a large particle size, as large as 37
μm. Our previous research results found that such large grain size in an electrode led to
very poor performance. Therefore, the powders were ball-milled before being used to
make the mixed electrodes. The particle distribution of milled sodium titanate was
measured, shown in Figure 3.13. It is seen that the average particle size of milled
sodium titanate is about 5μm, but most of the particles are around 2μm. The distribution
Figure 3.12. The percolation thresholds of the ionic and electronic conductors
within the electrode as a function of particle size ratio.
77
of particles smaller than 1.5μm is not accurate due to the limitations of the measurement
equipment, so there could be more particles smaller than 2μm. Additionally, the flame
spraying deposition process favors depositing the smaller particles on the BASE surface.
Thus, it is reasonable to believe that most of sodium titanate practically deposited on the
electrodes are 2μm or smaller. The Ni has the particle size of 5∼15μm, thus the particle
size ratio of Ni to sodium titanate should be larger than 2.5. Based on Figure 3.12, the
electrode should have at least 0.510 volume fraction of Ni and 0.143 volume fraction of
sodium titanate, in order to produce high performance. In this research, we tested
electrodes with the Ni/sodium titanate mass ratios of 2:1, 3:1 and 4:1, which correspond
to Ni volume fractions of 0.47, 0.57 and 0.64 respectively. Since the volume fraction of
0.47 is smaller than percolation threshold of 0.510, few A clusters should be present in
this electrode, which could cause the poor conductivity and small reaction area. We
observed these results in our experiments, in which the conductivity of the N21 electrode
is very poor and much lower than pure Ni electrode, discussed in previous section. For
N31 and N41 electrodes, both metal and ceramic have the volume fraction greater than
their percolation threshold, therefore, these electrodes should perform better and have a
large number of A clusters. Figure 3.14 shows the physical morphology of N41
electrode after testing in a SETC over 60 days. It is found that Ni particles connected
with each other and formed a network covering the whole area, which are A clusters
defined previously. Therefore, this electrode has a high conductivity and large reaction
area.
78
0
50
100
150
200
250
300
350
400
0.00 5.00 10.00 15.00 20.00 25.00
Diameter(μm)
Inte
nsity
(cou
nts)
Milled Sodium Titanate Powderd=2.147
d=5.07
×2000 SE image
Figure 3.13. The particle size distribution of milled sodium titanate powder.
Figure 3.14. SEM image of the Ni/sodium titanate electrode with 4/1 mass ratios
after testing in the SETC over 60 days.
10 μm SE 15kV 176pA
79
Since reaction area or active area (A) is a very important parameter that affects the
performance of electrodes, we also calculated it in this simulation. For a MIEE, the total
reaction areas are the sum of the reaction area at the interface between the electrode and
electrolyte, i.e. the traditional triple phase boundary reaction area, where the electrons
combine with Na+ ions from BASE and release Na gas, and the reaction area between
electronic and ionic conductors within the electrode. In this simulation, we don’t count
the former reaction area at the interface, since the latter one is unique for the MIEE.
The reaction area per unit volume is proportional to the number of contact points per
unit volume between electronic and ionic conductors, multiplied by the probability that
an electronic and an ionic conductor particle belong to type A-clusters:
eieii PPZnA −∝ (3.7)
The number of particles per unit volume (n*) is given by equation (3.8)
])1([ 3334
*
λπε
iii nnrn
−+= (3.8)
where ε is the packing density, which depends on the particle size and size ratio. The
probability that an ionic conductor particle belongs to an A-cluster above the percolation
threshold is evaluated by Bouvard as
( ) 4.05.2)2/2(1 iii ZP −−= (3.9)
Combining equations (3.1), (3.7), (3.8) and (3.9), we obtain equation (3.10)
eiei
ei PPZZZnnSnA *= (3.10)
80
where S is the contact area between a Ni particle and a sodium titanate particle. Figure
3.15 shows this contact area schematically. The contact area is determined by the
contact angle (θ) and the radius of the smaller particle: 22 )(sinθπrS = , where θ is
assumed as a constant in this simulation.
We calculated reaction areas for MIEEs with all kinds of composition and various
particle dimensions, shown in Figure 3.16. A is zero when the volume fraction is less
than the percolation thresholds, where the probability P is zero. (Equation (3.9) has been
slightly modified so that P=0 at the percolation thresholds.) It is found that the reaction
area A has the maximum value with the volume fraction change. For example, if two
components have the same particle size, i.e. λ=1, the maximum A is obtained when the
electrode has equal volume fractions of electronic and ionic components, i.e., Vi=Ve=0.5.
If the two components have different particle sizes, i.e., when λ is varied between 1 and
4, we can find that the volume fraction of Ni corresponding to the maximum A shifts to
rθ Contact
area
Figure 3.15. Schematic of contact area between ionic and electronic particles.
81
Figure 3.16. Calculated reaction area change with the volume fraction of metal. The
packing density ε is set at 0.61 and the contact angle θ is set at 15o.
the right side, the high value side. When λ=4, a volume fraction of 0.75 for Ni is
required to reach the maximum reaction area.
0.47 0.57 0.640.0E+00
5.0E+03
1.0E+04
1.5E+04
2.0E+04
2.5E+04
3.0E+04
3.5E+04
4.0E+04
4.5E+04
5.0E+04
0 0.1 0.2 0.3 0.4 0.5 0.6 0.7 0.8 0.9 1
volume fraction of metal
A re
actio
n ar
ea(m
2 /m3 )
de=di=2μm
de=3μm di=2μm
de=4μm di=2μm
de=5μm
de=6μm di=2μm
de=7μm di=2μmde=8μm
de=di=5μm
Figure 3.16 also shows that the value of maximum reaction area decreases with
increasing particle size ratio. From λ=1 to 4, the maximum A value is largest when two
components have the same particle size. Additionally, the maximum reaction area also
decreases with increasing particle size, when the particle size ratio is fixed. For
example, when λ=1, the value of maximum A is sharply reduced to less than half if the
particle size increases from 2μm to 5μm. It is reasonable, since as the particle size
increases, the number of particles in a unit volume decreases, which causes contact area
to decrease. Therefore, summarizing above discussion, it is found that in order to obtain
82
the best performance, the electrode should consist of two components with the same size
and volume fractions, and this particle size should be as small as possible.
In this research, we tested electrodes with Ni volume fractions of 0.47, 0.57 and 0.64
respectively. Figure 3.16 shows that reaction area is increasing from Ve=0.47 to 0.64 for
all the electrodes with Ni particle sizes from 4-8μm, which is in agreement with our
experimental results, shown in Figure 3.9. This explained that N41 electrode performed
better than N31 electrode, even both electrode compositions are in the high performance
region.
Carefully observing the curves of A vs. Vi for the electrode with Ni particle size from
5 to 8μm, it is found that the volume fraction of 0.47 is below the percolation threshold
and A is zero for this electrode. It is different with the experimental results, in which
electrochemical reaction did occur and Ract is as large as 35ohm.cm2. Additionally, the
experimental results showed that the N41 electrode performed much better than the N31
electrode, but it is not very evident in this theoretical simulation.
Generally speaking, in our electrode, the particles do not have an exactly spherical
shape, nor is the diameter exactly defined; on the contrary there is a distribution around a
mean value. These factors can influence the percolation thresholds in a real electrode.
Figure 3.17 shows the particle size distribution in N41 electrode. It is found that
particles have different sizes over a large range, which definitely affects the accuracy of
the percolation threshold calculation. Compared to the sodium titanate particle
distribution, Figure 3.11, we found a wider distribution of mixed particle sizes between
2μm and 5μm. Since most of sodium titanate particles are around 2μm, it is apparent
83
that some Ni particles are less than 5μm. Due to the smaller Ni particle present, the
particle ratio λ could be less than 2.5. Figure 3.12, shows that 0.47 volume fraction is
the percolation threshold corresponding to λ=2.1. Therefore, A-clusters could be formed
and provide reaction area in these electrode. Additionally, in our model, we only count
the A-cluster’s contribution to the electrode performance, excluding the B-clusters. If
the electrode thickness is small compared to the particle diameter, the length of B-
clusters through the electrode is significant for a wide range of compositions outside the
percolation thresholds. Thus even if A-clusters are not present, the B-clusters would
contribute to the transport of electrons and ions and the electrochemical reaction through
the electrode. Additionally, we mentioned above that A calculated did not include the
reaction area at the interface, but in fact, it did exist and contributed to the reaction area.
0
50
100
150
200
250
300
350
0.00 5.00 10.00 15.00 20.00 25.00
Diameter(μm)
Inte
nsity
(cou
nts)
Ni:T=4:1 Ni=5-15um
Figure 3.17. The particle distribution of Ni and sodium titanate mixture with the
mass ratios of 4:1. The Ni particle purchased is 5-15μm.
84
The percolation theory requires that the thickness of electrode is much greater than
the particle size. The thicker the electrode, the more accurate this model. Under those
conditions, if the volume fraction is greater than the percolation threshold, the reaction
area and the conductivity will jump sharply up by several orders of magnitude. But our
mixed electrode has a thickness of between 10 and 20μm, which just a few times the
electrode particle size. Thus, only a few electrode particles are packed in the thickness
direction and the randomness of particle packing is very high in such a system, which
could cause behavior far different from the theoretical calculation in this model. In
summary, all these factors could result in the discrepancy between the experimental
results and theoretical simulation.
Although there is some discrepancy present, this model is in agreement with the
experimental results for most cases, based on our experimental results. Therefore, it is
useful and can be employed to predict the performance of all kind of MIEE.
3.4. Summary and Conclusions
Chemical potential diagrams have been plotted for the Na-Al-O and Na-Ti-O ternary
systems and the Na-Al-Ti-O quaternary system, based on the calculation of Gibbs free
energy. At AMTEC conditions, the stability region of β″-alumina is very narrow.
Whether it is present as β″-alumina or converts to β-alumina and NaAlO2 is dependent
on the real oxygen and sodium vapor partial pressures in the system. Sodium titanate
Na2Ti3O7 is thermodynamically stable at AMTEC operating conditions and also
compatible with BASE, thus, it can be used as the ionic component in a mixed
85
conducting cathode for AMTEC. Al and Ti are not thermodynamically favored for use
as AMTEC electrodes, because they are very easily oxidized, since their metal phase
stability requires a very low level of oxygen pressure. Ta, Nb and V could be used in
AMTEC, depending on the real sytem conditions. Metal Ni, Cu, Ir and Co can be
present at any AMTEC condition.
Ta, Ni, Nb, Ir, W and MoRe electrodes have been tested in SETCs. Ir, Nb and Ta did
not perform as well as expected. They degraded rapidly due to significant grain
agglomeration. Ni was selected as the metal component in a MIEE, since it has the best
initial performance among these tested pure metal electrodes, and it also
thermodynamically compatible with sodium titanate and BASE, although Ni
agglomeration occurred during the test.
Therefore, different compositions of Ni/sodium titanate mixed electrodes were tested
in SETCs. It is found that sodium titanate particles effectively reduce Ni particle
agglomeration. Among tested Ni/sodium titanate electrodes, the ones with mass ratios
of 4/1 performed best. We found that the 75% mass of Ni produced good electrode
conductivity. Based on the percolation theory, a model was constructed to interpret the
performance of these mixed electrodes and find the optimum composition. The
percolation threshold of volume fraction was calculated for both components, which
varies with particle size ratio. The composition window corresponding to high
performance is defined for a wide range of particle size ratios. The reaction area within
the electrode was calculated based on the model. It is found that the reaction area
decreases with increasing particle size or particle size ratio. The model also predicted
86
that the best performance electrode should consist of two components with the same
volume fraction and same particle size, and this particle size should be as small as
possible.
87
CHAPTER IV
KINETIC STUDIES OF MIXED IONIC AND ELECTRONIC
ELECTRODES
4.1 Introduction
Based on the experimental results and analysis in Chapter III, it is found that
Ni/sodium titanate mixed electrodes with appropriate composition performed much
better than pure Ni metal electrodes. It is known that the electrode behavior is controlled
by its kinetics, but the kinetics of an AMTEC electrode is still unclear. Therefore, in this
chapter, we proposed possible electrode kinetic mechanisms, and derived the theoretical
expressions for the interface impedance for both pure metal and mixed electrodes.
Based on its stable chemical and physical properties, sodium titanate was selected as
the Na+ ion conductor in MIEEs. But the most important property, Na+ ion conductivity,
is still unsure for this compound, although its layered crystal structure suggests it is a
good Na+ ion conductor. Up to now, few literatures reported the electrical properties of
sodium titanate, and these data are inconsistent.57-59 Therefore, we also measured the
conductivity of sodium titanate and discussed the results in this chapter.
4.2 Experimental
4.2.1 Measurement of Na2Ti3O7 Ionic Conductivity
The purchased sodium titanate powder were milled, dried, and ground, as described
in Chapter III. The ground powders were pressed into pellets (12mm in diameter and
88
∼2mm in thickness) and sintered at 1273K for 18hrs in air. Two sides of the sintered
pellets were sputtered with thin Ta layers, which served as electrodes. Ni mesh was used
as the current collector. The sample is shown in Figure.4.1. The conductivity was
measured from 600K to 1150K at the same conditions as a SETC.
4.2.2 Composition Analysis of Sodium Titanate
Composition analyses of the milled powder were carried out by X-ray diffraction
(XRD). XRD data were collected at room temperature using a Bruker-AXS D8 Powder
diffractometer with Cu Kα1 X-rays (λ=1.5405Å), and a 2θ scanning step of 0.04o/4s
from 5o to 70o. Sodium titanate phases were identified by comparison with the Joint
Committee for Powder Diffraction Studies (JCPDS) cards.
The SETC setup procedures and the preparation and performance measurement of
pure metal and mixed electrodes were already discussed in Chapter III.
Figure 4.1. Scheme of the experimental cell for sodium titanate conductivity measurements.
Ta Electrode
Ni Mesh
Ni Wire
Sodium Titanate Pellet
89
4.3 Results and Discussion
4.3.1. Ionic Conductivity of Sodium Titanate
The sodium titanate pellets shrank during the sintering process; their diameter was
reduced 6∼8%. The final density of the sample was approximately 85% of the
theoretical densities.
The XRD analyses found that there are mainly two phases in our powder, Na2Ti3O7
and Na2Ti6O13, shown in Figure 4.2. Since they are both monoclinic structures, a semi-
quantitative chemical analysis was performed using the ratios of intensities of the 100
peak of each components. This analysis indicated the ratio of Na2Ti3O7 to Na2Ti6O13
was 1/2 by mass.
0
100
200
300
400
500
600
5 10 15 20 25 30 35 40 45 50 55 60 65 70
Two Theta(degree)
Inte
nsity
(cou
nts)
(200
)
(011
)
(020
)
(100
)
(101
)
(020
)
(110
)
(311
)
(402
)
(404
)(6
02)
(320
)
(201
)
Na2Ti3O7
Na2Ti6O13
Figure 4.2. X-ray diffraction pattern of raw sodium titanate powder.
90
The measured impedance spectra are shown in Figure 4.3. Each impedance
spectrum consists of a depressed semicircle in the high-frequency range and a line in the
low-frequency range. The radius of the semicircle and its intercept at high frequency
decreased with temperature increase. These spectra are in agreement with other research
reports and one kind of typical spectra for a pure ionic conductor.86 In principle, a
semicircle between the origin and the intercept would be observed if much higher
frequencies were used in the experiment. The high-frequency limit should be as high as
0.1GHz because the conventional value of geometric capacitance (Cgeo) is about 10pF
for ceramic materials. The high-frequency limit imposed by the equipment used in this
study (100kHz) is not sufficient to observe this phenomenon. This missed semicircle
corresponds to the polarization of sodium titanate grain interiors, i.e. the bulk conduction
process, and the intercept represents the total ionic resistance of sodium titanate bulk
grains, while the semicircle present is usually assigned to the relaxation process in the
sodium titanate grain boundaries, i.e., grain boundary conduction. The tail at low
frequency is related to the polarization of the electrode/sodium titanate interface.86
Figure 4.3 (a) is the spectra measured at low temperatures (614 and 672 K). The data are
somewhat messy at low frequency due to noise, which decreases as temperature
increases. The enlarged plot shows that the spectra did not end at the origin and it is
very clear when the spectrum measured at high temperature, shown in Figure 4.3(b) and
(c), which was measured at 1068K.
91
-0.80
-0.60
-0.40
-0.20
0.000.00 0.20 0.40 0.60 0.80 1.00 1.20 1.40 1.60 1.80 2.00 2.20 2.40
Real Impedance(×106ohm)
Imag
inar
y Im
peda
nce(×1
06 ohm
)
T=614K
T=672K
(a)
-120.0
-100.0
-80.0
-60.0
-40.0
-20.0
0.00.0 20.0 40.0 60.0 80.0 100.0 120.0
Real Impedance(×103ohm)
Imag
inar
y Im
peda
nce(×1
03 ohm
)
T=614T=672K
(b)
Figure 4.3. Impedance spectra of sodium titanate measured at different temperature (a)
full spectra measured at 614 and 672K. (b) high frequency part. (c) full spectrum
measured at 1068K. (d) Bode plot measured at 1068K.
92
-15.0
-10.0
-5.0
0.0210.0 215.0 220.0 225.0 230.0 235.0 240.0 245.0 250.0 255.0
Real Impedance(ohm)
Imag
inar
y Im
peda
nce(
ohm
)
Experimental dataFitted curve
T=1068K
(c)
210
220
230
240
250
260
1.00E-01 1.00E+00 1.00E+01 1.00E+02 1.00E+03 1.00E+04 1.00E+05
Frequency(Hz)
Impe
danc
e(oh
m)
Experimental dataFitted curve
T=1068K
(d)
Figure 4.3. (Continued)
93
The depressed semicircle is indeed the arc of a circle with the center some distance
below the x-axis, which is very commonly observed in most ceramic materials and
generally fitted by a constant phase element (CPE) in parallel with a resistance. A CPE
is a non-intuitive circuit element that was invented to describe non-ideal capacitive
behavior. Mathematically, a CPE's impedance is given by
])([1 pjTZ ω= (4.1)
where T has the numerical value of the admittance )1( Z at ω=1 rad/s. The units of T
are S·sp. p is an exponent between 0 to 1 and when it is equal to 1, the CPE turns into a
real capacitor. Equation (4.1) determines the phase angle of the CPE impedance has a
value of -(90*p) degrees, independent of the frequency. This property gives it the name
CPE.61,86
Based on above analysis, an equivalent circuit model (ECM) was constructed to fit
the impedance spectra, shown in Figure 4.4, which consists of a resistance in series with
two similar sections. Each of these sections is comprised of a resistance and a CPE in
parallel. The section of Rbd in parallel with CPEbd corresponds to the polarization of
Figure 4.4. Equivalent circuit for the impedance spectrum of sodium titanate ionic
conductor.
94
sodium titanate grain boundary, while the section of Rel in parallel with CPEel refers to
the electrode polarization process. Since the high frequency semicircle did not show in
our measurement, a resistance Rbk is used to represent it and its value is equal to the total
ionic resistance of sodium titanate bulk grains. The fitted curves for the Nyquist and
Bode plots are shown in Figure 4.3 (c) and (d) respectively. The level of agreement
between experiment and curve fit is quite satisfactory in terms of shape and distribution
of frequencies on the spectrum. Based on this equivalent circuit, all the parameters were
extracted, and listed in the Table 4.1. Comparing the bulk resistance Rbk to the boundary
resistance Rbd, we found that the resistance of the grain interior conduction is much
larger than that of the grain boundary, which means the sodium ion transport inside the
grain is more difficult than along the grain boundary.
In order to confirm the validity of these parameters, the impedance of grain boundary
CPE (CPEbd-T) was converted to the corresponding capacitance and compared to the
literature. Using equation 4.2 provided by the literature,97,98 we got the “true” grain
boundary capacitance of approximate 1nF, which is in the range of grain-boundary
capacitances of typical polycrystalline ceramic ionic conductors.86 Therefore, these
Table 4.1. The parameters used in the equivalent circuit
Rbk(Ω) Rbd(Ω) Rel(Ω) CPEbd-T CPEbd-p CPEel-T CPEel-p
Value 208 33 28 5.40E-05 0.575 0.062 0.56
Error% 0.11 0.98 7 5.18 1.03 2.42 3.2
95
parameters extracted in our experiment are valid. Based on the parameters of Rbk and
Rbd, the conductivity of sodium titanate is calculated.
pCR −= )(maxω (4.2)
)exp( RTE
Tao −=
σσ (4.3)
The conductivity is dependent on the temperature, as described by the Arrhenius law,
equation (4.3). Therefore, by plotting the logarithm of conductivity versus reciprocal
temperature we can get the activation energy, shown in Figure.4.5, where the total
conductivity includes both bulk and grain boundary conductivities. The average activation
energy for the bulk and total conductivities are 0.87ev and 0.96ev, respectively.
Compared to the literature reports about the conductivity of sodium titanate, listed on
Table 4.2, our results are higher than most of them, but not unreasonable.
-5.0
-4.0
-3.0
-2.0
-1.0
0.0
1.0
0.6 0.8 1 1.2 1.4 1.6 1.8 2
1000/Temperarure(K)
Log(σT
) ( K
/Ohm
)
bulk total
Eatotal=0.96ev
Eabulk=0.87ev
Figure 4.5. Arrhenius plots of bulk and total conductivities for sodium titanate.
96
Table 4.2. Summary of the sodium titanate conductivity measured in the literature
Composition Measurement Technique
Measurement Temperature (K)
Activation Energy (eV) Authors Date
Na2Ti3O7 EIS 500~750 bulk+boundary 0.70
S.Kikkawa et al57 1985
400~475 0.36 475~650 0.70 Na2Ti3O7
d.c. conductivity measurement 650~800 0.33
S. Pal et.al58 1989
Na2Ti3O7 EIS 293~493 bulk+boundary 1.3
K.Byrappa et al59 1997
Na2Ti3O7 EIS 700K~1000K bulk+boundary 0.79~0.80
A-L.Sauvet et al102 2004
Na2Ti3O7 +Na2Ti6O13
EIS 740~970K bulk+boundary 0.62
J. Ramirez-Salgado et al99 2004
Na2Ti3O7 +Na2Ti6O13
EIS 600~1150K bulk+boundary 0.96
Guo and Schuller TBD
Comparing to J. Ramirez-Salgado’s results,99 who measured the conductivity of a
sodium titanate mixture, the activation energies obtained in this research are higher than
theirs. The difference could be caused by the composition of the sample measured.
Their sample consisted with the mixture of 3/1 ratios of Na2Ti3O7 to Na2Ti6O13 by mass,
while our ratio was only 1/2 of Na2Ti3O7 to Na2Ti6O13 by mass. Our sample has less
amount of Na2Ti3O7, which results in the higher activation energy, since Na2Ti3O7 has
higher conductivity than Na2Ti6O13. Additionally, they only measured the total
conductivity, which includes the bulk and boundary contribution together. The
conductivity of the grain boundary is affected by some factors, such as the synthesis
97
method, sintering procedure and boundary size and shape. Therefore, the bulk
conductivity is used to represent the material’s conductivity, not the boundary
conductivity.
The sodium titanates Na2TinO2n+1 (n=3~8), crystallize in a monoclinic structure, in
which TiO6 octahedra share edges to form layered lattices and sodium occupies the
interlayer regions. With different values of n, the crystal structure changes. For n=3 or
4, the structure consists of (Ti3O7)2- layers held together by sodium ions. With a low
sodium metal content (n=6-8), tunnel structures (Figure.4.6.) are observed, which we
would expect to exhibit low conductivity and good chemical stability.100,101 Therefore, a
mixture of Na2Ti3O7 and Na2Ti6O13 should have lower conductivity than pure Na2Ti3O7.
Based on the somewhat inconsistent literature, the activation energy of Na2Ti3O7 is
between 0.70-0.80 ev. Therefore, our mixture’s bulk conductivity activation energy of
0.87ev is consistent with its composition and literature values.
Figure 4.5 also shows that the bulk resistance dominates the high temperature region,
since it is approximately equal to the total resistance. This indicates that the grain
boundaries have very good conductivity at high temperature. At AMTEC working
temperatures (~1120K), only about 10% of the resistance is contributed by the grain
boundary. It is reported that relatively small grains or discrete boundaries have a small
resistance.103
99
4.3.2 Pure Metal Electrode Kinetic Mechanism
In this research, we tested some pure metal electrodes, including Ni, Ta, W, Ir, and
Nb. Based on the data in Chapter III, it is known that the Ni electrode displayed the best
initial performance and was selected as the metal component for a MIEE. Here, we use
it as an example to analyze the kinetic mechanisms of pure metal AMTEC electrodes. In
fact, Figure 3.2 shows all the metal electrodes have very similar electrochemical spectra,
which indicates they have the same kinetic mechanisms.
Figure 4.7 shows the electrochemical spectrum (solid diamonds) of a Ni electrode.
Deconvoluting this spectrum, two arcs (solid line) are obtained, which indicates that at
least two processes contribute to the electrode polarization. Based on electrochemical
theory, the high frequency impedance generally is related to charge transfer, and the low
frequency impedance is related to mass transfer. Combining electrochemical theory
with complex nonlinear least squares analysis, the equivalent circuit is created, shown in
Figure 4.8. It is used to model the impedance spectrum (open triangles), and it produces
excellent agreement with the experimental results. Figure 4.7 also shows that the charge
transfer resistance is smaller than the diffusion resistance, which means Na diffusion in
the electrode is more difficult than the electrode reaction. In fact, the same phenomenon
was found for all tested pure metal electrodes. For a pure metal porous electrode, the
charge transfer reactions only can occur at the interface of BASE, electrode and vapor
space. The Na vapor will diffuse from the interface to the electrode surface through the
pores in the electrode. Na is not soluble in the electrode, so cannot be transported
100
through the metal. The experimental results indicate that although the reaction area at
the interface is limited, the Na gas diffusion rate is slow enough to limit the current.
-1.0
-0.5
0.0
0.54.0 4.5 5.0 5.5 6.0 6.5 7.0 7.5 8.0
Real Impedance(ohm.cm2)
Imag
inar
y Im
peda
nce(
ohm
.cm
2 )
Experimental data
Fitted data
Rct Rd
Figure 4.7. Impedance spectra of Ni electrode measured at 850oC. The solid diamonds
(♦) represent the experimental data; the open triangles (Δ) are calculated using the
equivalent circuit in Figure 4.8; the two semicircles are the theoretical impedance
spectra of charge transfer and sodium transport impedance respectively.
Figure 4.8. Equivalent circuit for interpreting and fitting the electrochemical
spectra of a Ni electrode.
101
Physical parameters for pure metal electrode processes were extracted from the
fitting routine and plotted as a function of time in Figure 4.9. They all increase with
experimental time and the reasons were already discussed in Chapter III.
0.0
1.0
2.0
3.0
4.0
5.0
6.0
0 2 4 6 8 10 12 14 16 18 20
Experiment time(Day)
Impe
danc
e(oh
m.c
m2 )
Rs Rct Rd
In the equivalent circuit, Figure 4.8, the constant phase elements are used to
represent the capacitive behavior of the electrode process. The literature reported that a
CPE is generally used in an inhomogeneous system to account for factors, such as
surface roughness, varying thickness or composition, or a distribution of reaction
rates.104 It has been shown that the exponent p in the equation (4.1) is equal to 1/(D-
1),105 where D is the fractal dimension. For an absolutely flat surface the fractal
dimension (D) is 2.0 and p=1, which is a capacitor, while for a highly contorted surface
(D=3), and p=0.5, it produces an infinite length Warburg element, which corresponds to
Figure 4.9. The changes of series resistance Rs, charge transfer resistance Rct and
diffusion resistance Rd with experiment time for a Ni electrode.
102
charge carrier diffusion through a thick material, such as a thick porous electrode. Our
experimental results show that p is between 0.52 to 0.69, corresponding to a D of 2.92 to
2.45, which indicates that our electrode/electrolyte interface could be really rough and
fractal.
It is also possible that the CPE in our system is caused by varying thickness or
composition of the electrode film, which has been reported for a coating with varying
composition along the coating thickness.106 Our SEM images show that the thickness of
the electrode is not uniform, but this may result from the sample preparation for SEM
observation. Therefore, we can not conclude if this factor contributes to the CPE effect
in our work.
In order to analyze and interpret the experimental results, it is necessary to derive a
theoretical expression for the impedance of electrode process. For pure metal electrodes,
the electrode process consists of a charge transfer reaction at the interface triple phase
boundary and sodium vapor transport in the porous electrode, shown in Figure 4.10.
Sodium vapor transport in the porous electrodes might include the following three steps:
1. Surface diffusion of sodium on the electrode particles.
2. Desorption of sodium from the electrode particles.
3. Vapor phase transport in the pores of the electrode.
We use two reactions to represent electrode process. The first reaction is charge
transfer (Na+ ion reduction at the cathode) and the second reaction represents the Na
vapor transport in the electrode, which includes all three steps described above.
103
(4.4)
(4.5)
Electrochemical theory107 defines the current as
])0([RTP
kCknFAiii inbNaf −=−= +
sr (4.6)
where n is the number of electrons involved in the electrode reaction, which is 1 in
reaction (4.4); F is the Faraday constant; A is the interface area; kf and kb are the
potential-dependent rate constants for the forward and backward reactions:
)](exp[ oof EEnfkk −−= α )]()1exp[( o
ob EEnfkk −−= α (4.7)
kb
kf Na+ + e Naads
k-2
k2Naads Navap
Vacuum
e-
Na+
Na
NaNaNa
BASE Electrode
Figure 4.10. Schematic representation of the electrode reaction process.
104
where ko and Eo are the standard electron transfer rate constant and standard potential,
respectively. )0(+NaC is the concentration of Na+ ions at the BASE/electrode interface.
We assume that the interface concentration of Na+ ions is equal to the bulk concentration
in the BASE during electrode reaction process, since the concentration of mobile Na+
ions in BASE is approximately 9M, and the diffusion rate of Na+ in BASE is very high.
Pin is the sodium vapor pressure at the interface. α is the charge transfer coefficient, and
f= F/RT.
In AC impedance, a small AC perturbation signal is applied and the current and
concentrations oscillate around steady-state values:
iii ~+= ininin PPP ~+= EEE ~+= (4.8)
where )exp(~0 tjIi ω= )exp(~
0 tjPPin ω= )exp(~0 tjEE ω=
Differentiation of equation (4.6) , gives
dtdP
RTknFA
dtdE
RTPnfkCnfknFA
dtdi inbin
bNaf −−−−= + ])1()0([ αα (4.9)
Since ijdtid
dtiid
dtdi ~~)~( ω==
+= , and the similar relationships exist for
dtdE
and dt
dPin ,
inbin
bNaf PRTkE
RTPnfkCnfk
nFAi ~~])1()0([~
−−−−= + αα (4.10)
The interface impedance of pure metal electrode Z is
iEZ ~~
−= (4.11)
105
from equations (4.10) and (4.11) , we obtain
[ ]
[ ] iP
RTPkCknFk
RTPkCkAFnRTZ
in
inbNaf
b
inbNaf
~~
/)1()0(
/)1()0(22
×−+
+
−+=
+
+
αα
αα (4.12)
Let
[ ] ctinbNaf
f RRTPkCkAFn
RTZ =−+
=+ /)1()0(22 αα
(4.13)
[ ] iP
RTPkCknFkZ in
inbNaf
bd ~
~
/)1()0(×
−+=
+ αα (4.14)
Zf is the impedance due to the charge transfer reaction. At equilibrium, oiii ==sr
, thus Zf
turns into the charge transfer resistance Rct , i.e. cto
f RnFiRTZ == . Zd is the impedance
related to the Na vapor pressure change with current, thus which is corresponding to the
Na transport in the porous electrode.
df ZZZ += (4.15)
Therefore, the interface impedance comes from the charge transfer and Na diffusion,
which is in excellent agreement with the experimental results.
In order to obtain ipin~~
, reaction (4.5) is taken into account. Assuming this process
obeys first–order kinetics, the reaction rate is expressed as
RTPk
RTPkv Nain
222 −−= (4.16)
and the change of sodium pressure at the interface with time is described as
106
RTPk
RTPk
nFAi
RTdtdP Nainin
22 −+−= (4.17)
PNa is the pressure of sodium at outside surface of the electrode.
At equilibrium, i=0 and 0=dt
dPin ,
22
2
KPP
kkP Na
Nain == − (4.18)
where 2
22
−
=kkK , the equilibrium constant for reaction (4.5).
By introducing the alternating component, Eq(4.17) can be modified as
RTPk
RTPPk
nFAii
RTdtPPd Nainininin
22
~~)~(−+
+−
+=
+ (4.19)
by substitution of Eq. (4.8) and (4.18) into Eq. (4.19)
inPi
nFARTkj ~
~2 =+ω (4.20)
Substituting equation (4.20) into (4.14),
[ ] [ ] 2122
22
122
22
)1()0()1()0(
1
kPCRTKTR
AFnjPCRTKTR
AFnZ
inNainNa
d
ααωαα −++−+=
++
(4.21)
where b
f
kk
K =1 , the equilibrium constant for reaction (4.4).
therefore,
dd
ctdf
RCj
RZZZ1
1
++=+=
ω (4.22)
107
where
[ ]inNad PCRTKTR
AFnC )1()0(122
22
αα −+= + (4.23)
[ ]inNad PCRTKAkFn
TRR)1()0(12
22
22
αα −+=
+
(4.24)
Considering the series resistance Rs, the inductance of the lead L and a double-layer
capacitance Cdl, the total impedance of the pure metal electrode is
dd
ctdl
st
RCj
RCj
RLZ1
11
1
++
+++=
ωω (4.25)
The equivalent circuit corresponding to equation (4.25) is the same as Figure 4.8, which
proves the validity of the equivalent circuit used to fit experimental results in this
research. The more important thing is the physical meanings of the parameters in the
equivalent circuit are understood.
Compare equation (4.13) to (4.24), it is found that
2kk
RR b
ct
d = (4.26)
The experimental data have shown that Rd is greater than Rct for pure metal electrodes,
which means that kb is greater than k2. kb is the potential-dependent rate constant for the
backward reaction, while k2 is the reaction rate constant for Na vapor transport into
vacuum. In fact, reaction (4.5) is not a single reaction, and might include sodium vapor
surface diffusion, desorption and diffusion in the pores of the electrode. Therefore, it is
very complicated and strongly dependent on the properties of electrode itself, such as
electrode morphology and Na diffusion coefficient on the electrode. In contrast, Rct is
108
more related to the properties of the system, such as temperature and Na+ concentration,
based on the equation (4.13). This is in agreement with experimental results. For all
tested pure metal electrodes, charge transfer resistances were very similar, since all
electrode were measured at same temperature and using same BASE, while the diffusion
resistances were highly variable.
Substituting equation (4.18) into (4.23), the following equation is obtained
[ ]2122
22
/)1()0( KPCRTKATRFnC NaNad αα −+= + (4.27)
It shows that the diffusion capacitor is not just related to sodium vapor diffusion, but
also to the charge transfer process, since it consists of two items. If K1, the equilibrium
constant of the charge transfer reaction is large, and K2, the equilibrium constant of
sodium transport, is small, the electrode will have a large capacitance. A large K1 means
the charge transfer reaction can produce enough Na vapor, while small K2 means the
adsorbed Na vapor is difficult to transport through the electrode, therefore, the adsorbed
Na vapor must accumulate in the electrode, or there is a lag-time of sodium
concentration in the pore with respect to the current, which results in capacitive
behavior. K1 is only determined by potential and temperature, independent on the
properties of individual electrode, thus a large diffusion capacitance is related to a small
equilibrium constant of sodium transport process. Additionally, because in
Na
PP
K =2 and
the sodium pressure PNa at the electrode surface is only dependent on the temperature,
the small K2 means the vapor pressure on the interface is high. Therefore, the diffusion
capacitance can be used to estimate the interface pressure of sodium vapor. For
109
example, a large diffusion capacitance indicates the interface vapor pressure of sodium is
high. The significance of this discovery is the vapor pressure at interface, which is not
directly measured by any experiment, could be estimated from impedance data.
According to EIS theory, for a RC loop, the point at the semicircle maximum
corresponds to the frequency ω=1/RC. Therefore,
ddd CR
1=ω (4.28)
By substituting Eq. (4.23) and (4.24) into (4.28),
2kd =ω (4.29)
dω can be extracted from EIS results and thus the value of the rate constant k2 for
sodium transport through the electrode is obtained. In order to find the relationship
between k2 and temperature, we measured the impedance at different temperatures for Ni
electrodes and the results are shown in Figure 4.11. The relationship of k2 with
temperature obeys Arrhenius’ law, indicating that although Na transport might include
several steps, the entire process is controlled by a single activation energy.
0.0
1.0
2.0
3.0
4.0
0.8 0.85 0.9 0.95 1 1.05 1.1 1.151000/T(K-1)
lnk 2
Experimental dataLinear (Experimental data)
Ea=99.4kJ/mole
Figure 4.11. Arrhenius plot for sodium transport in the Ni electrode at SETC conditions.
110
4.3.3 Mixed Electrode Kinetic Mechanisms
Figure 4.12 shows the impedance spectra for different mixed ionic and electronic
electrodes. It is found that they are similar in shape and can also be deconvoluted into
two semi-circles. This implies the electrode process still consists of two steps, a charge
transfer reaction (4.4) and sodium vapor transport reaction (4.5), which also includes
sodium surface diffusion, desorption, and vapor transport. The difference with the pure
metal electrode is the reaction sites, i.e. triple-phase boundaries, are not only at the
electrode/BASE interface, but also within the electrode, since the sodium ions can
transport into the electrode by the ionic conductor, and the produced sodium vapor
doesn’t have to transport through the entire electrode thickness to arrive at the electrode
surface. Therefore, reactions (4.4) and (4.5) both occur at the interface and within the
electrode.
-10.0
-8.0
-6.0
-4.0
-2.0
0.05.0 10.0 15.0 20.0 25.0 30.0
Real Impedance(ohm)
Imag
inar
y Im
peda
nce(
ohm
)
Cu/Ni/b" Cu/b"Ni/b" Cu/Co/b"Cu/Na2Ti3O7 Ni/Na2Ti3O7Ni/Al/Na2Ti3O7 Ni/Cu/Na2Ti3O7Co/Cu/Na2Ti3O7
Figure 4.12. Impedance spectra of different MIEEs.
111
If the reactions occur at the interface, the current ini is already described in Equation
(4.6). If the reactions occur within the electrode, the current eli is expressed by the
equation (4.30)
])()([00∑∑>>
−=−= +
xel
b
xNafelelelel xP
RTk
xCknFAiiisr
(4.30)
The total current produced by this electrode is
])()([])0([
)()(
00∑∑>>
−+−=
−+−=+=
++
xel
b
xNafel
inbNafin
elelininelin
xPRTkxCknFA
RTPkCknFA
iiiiiiisrsr
(4.31)
where Ain is the total reaction area at the interface. It is assumed that every reaction site
within the electrode has the same area, Ael, which is the area of the single reaction site
within the electrode. )0(+NaC and Pin are still the concentration of Na+ ions and sodium
pressure at the interface, and )0(+NaC is a constant. )(xC
Na+ and )(xPel represent the
Na+ ions concentration and sodium vapor pressure at the reaction sites within the
electrode, not at the interface. )(xCNa+ is a function of the location of reaction site and
time, but in order to simply the situation, we assume it is a constant and equal to the Na+
ion concentration in the sodium titanate.
Differentiation of equation (4.31) and combination with ijdtdi ~ω= , yields
])(~~[~)]()1()([~0∑>
+−+−++−=x
elelininb
elinelin xPAPART
nFkEiinfiinfi
ssrrαα (4.32)
The interface impedance of mixed electrode Z still consist of two parts, Zf and Zd,
112
df ZZZ += (4.33)
)()1()(1
elinelinf iinfiinf
Z ssrr+−++
=αα
(4.34)
i
xPAPA
iiiikZ x
elelinin
elinelin
bd ~
)(~~
))(1()(0∑>
+
+−++= ssrr
αα (4.35)
Zf is the charge transfer impedance. At equilibrium, i=0, ctf RnFiRTZ ==
0
. Zd is the
impedance related to the Na transport in the porous electrode.
For a MIEE, if the reaction sites of reaction (4.5) are at the interface, the reaction rate
is the same with equation (4.16); if the reaction sites are within the electrode, the rate is
expressed as
RTPk
RTxPkv Nael
222)(
−−= (4.36)
the change of sodium pressure at the interface with time is described as
RTPk
RTPk
nFAi
RTdtdP Nain
in
inin22 −+−= (4.37)
RTPk
RT
xPk
nFAi
RTdt
xPdNax
el
el
elxel
20
20
)()(−
>> +−=∑∑
(4.38)
At equilibrium, i=0 and 0)(==
dtxdP
dtdP elin ,
2
)(KPxPP Na
elin == (4.39)
By introducing the alternating component, and substitution, it yields
113
in
in
in Pi
nFARTkj ~
~2 =+ω (4.40)
∑>
=+
0
2 )(~~
xel
el
el xPi
nFARTkjω (4.41)
using the ratio rules on equation (4.40) and (4.41) produces
∑∑>>
+=
++
=+
00
2 )(~~~
)(~~~~
xelelinin
xelelinin
elin
xPAPAi
nFRT
xPAPAii
nFRTkjω (4.42)
Substituting equation (4.42) into (4.35),
dd
d
RCj
Z1
1
+=
ω (4.43)
where
⎥⎦
⎤⎢⎣
⎡+−++=
+−++=
∑∑>>
++
00122
22
)]()[1(])()0([
)])(1()([
xelelinin
xNaelNain
elinelinb
d
xPAPAxCACARTKTRFn
iiiiRTknFC
αα
ααssrr
(4.44)
⎥⎦
⎤⎢⎣
⎡+−++
=
+−++=
∑∑>>
++
0012
22
22
2
)]()[1(])()0([
)])(1()([
1
xelelinin
xNaelNain
elinelinb
d
xPAPAxCACARTKkFn
TR
kiiiiRTknF
R
αα
ααssrr
(4.45)
It is seen that Cd and Rd are not just related to sodium transport process, but also to the
properties of charge transfer reaction, such as Ain, Ael and )(xCNa+ .
114
Therefore, the mixed electrode impedance has the same form as a pure metal
electrode, shown in equation (4.25), but every parameter has a different meaning. The
equivalent circuit, Figure 4.8 is also useful for the mixed electrode spectrum. In the
above deduction, )(xCNa+ is considered as a constant. In fact, for a real mixed electrode,
)(xCNa+ generally changes with the location x and with time. Therefore, the impedance
should be equal to equation (4.46).
i
xC
iiiiARTk
RCj
RZ xNa
elinelin
elf
dd
ct ~)(~
))(1()(11 0
∑>
+
+−+++
++= wwrr
ααω (4.46)
The third item in this equation corresponds to Na+ ion transfer in the ionic conductor.
It could be a line with a slope of 1, which corresponds to the semi-infinite line Warburg
diffusion, or it also could be a semicircle in the Nyquist plot. In this case, the impedance
spectrum includes three semicircles. Sometimes, the third semicircle is overlapped by
the sodium vapor transport semicircle, i.e. they have very similar time constants. In this
case, it is difficult to distinguish them and Rd extracted from this spectrum has errors.
Comparing Rct for these two systems, equations (4.13) and (4.34), it seems that
mixed electrode can have smaller Rct values, since equation (4.34) has more items in the
denominator. For a mixed electrode system, both metal and ceramic particles contact
with BASE, and the ceramic contact area can not provide reaction sites, therefore, Ain
should be smaller than that of the pure metal electrode, and thus ini as well. Only when
the ini is similar for these two systems, or the eli can compensate for this difference, will
the mixed electrode system have a smaller charge transfer resistance than a pure metal
115
electrode system, which provides the theoretical interpretation for the experimental
results of larger charge transfer resistance for a MIEE comparing to a pure metal
electrode.
In order to obtain a small Rct for the mixed electrode, keep Ain and Ael as large as
possible. How to obtain a large Ael is related to the particle sizes and composition for
both components, discussed in Chapter III, in which the particles of the same type
(electronic conductor or ionic conductor) have to touch each other so that a network is
formed through the electrode, and adequate contact between the particles of different
types ensures that a large active reaction area is formed. A large Ain requires that the
interface area should be occupied by metal particles as much as possible. Combining
those two requirements, it is found that the ionic particles should form a tree type
structure from the interface to surface, in which the root is on the interface, and branches
are all through the whole electrode. If the interface areas are all occupied by the ionic
particles, the two types of particles form more C clusters, this electrode will have a very
large Rct. Therefore, it can be concluded that the mixed electrode is more dependent on
the microstructure.
For the mixed electrode system, equations (4.26) and (4.29) still work. However, if
k2 is needed to be evaluated from equation (4.29), it would be not as accurate as for the
pure electrode system, because Na+ ion transfer in the ionic conductor is not considered
in the mixed electrode kinetics.
In this study, we also calculated another kinetic parameter, the charge transfer
coefficient α, for the Ni/sodium titanate MIEE. It is calculated based on the Tafel
116
behavior of the electrode, described in equation (4.47), and we obtained α is equal to
0.34 at 1123K, shown in Figure 4.13.
ηαnfii −= 0lnln (4.47)
α is an important parameter and related to a large number of equations and
conclusions for AMTEC studies, but it has never been measured in the literature and is
usually assumed to be equal to 0.5 in all AMTEC theory. Therefore, our experimental
result of 0.34, not 0.5, would cause the correction of the equations and conclusions
involving α. How α affects these equations and conclusions will be discussed in
Chapter V.
y = -3.5136x - 6.4996R2 = 0.9799
-6.5
-6
-5.5
-5
-4.5
-4
-0.50-0.45-0.40-0.35-0.30-0.25-0.20-0.15-0.10-0.050.00voltage(V)
ln(-C
urre
nt) (
A)
α=0.34
Figure 4.13. Cathode Tafel plot for Ni/sodium titanate electrode with 4/1mass ratios.
117
4.4 Summary and Conclusions
The conductivity has been measured for a sodium titanate mixture of Na2Ti3O7 and
Na2Ti6O13 with a mass ratio of 1:2 at the AMTEC operating conditions. The average
activation energy for the bulk and total conductivities are 0.87ev and 0.96ev,
respectively. At AMTEC working temperatures (~1120K), the conductivity of the grain
boundary is much higher than that of the bulk. Only about 10% of the total resistance is
contributed by the grain boundary.
Theoretical expressions for the interface impedance of the electrode process have
been derived to interpret the experimental results for both pure metal electrode and
mixed electrode. For a pure metal electrode, the interface impedance consists of charge
transfer resistance and sodium transport impedance, which is the transport resistance in
parallel with the transport capacitance. For a mixed electrode, the electrode impedance
consists of charge transfer resistance, sodium transport impedance and the impedance of
sodium ion transfer in the ionic conductor of the electrode. The transport resistance and
the capacitance are not only related to the transport process, i.e. the sodium vapor
pressure at the interface or within the electrode, but also related to the charge transfer
properties. For most of tested electrodes, the rate constant of sodium transport is smaller
than that of sodium oxidation, based on the experimental results that the radius of
semicircle at low frequency is generally larger than that at high frequency. For a pure
metal electrode, a method is provided to estimate the sodium vapor pressure at the
electrode/electrolyte interface by measuring electrode impedance and extracting the
diffusion capacitance. The rate constant of sodium transport can also be calculated from
118
the impedance, which is equal to the frequency of the semicircle maximum point at low
frequency range. Although sodium transport in the electrode includes several steps of
adsorption, desorption and vapor transport in the pores, the entire process is controlled
by a single activation energy of 99.4kJ/mol for a Ni electrode.
Although the mixed electrode extends the reaction area from the interface to the
thickness of the electrode, it might have a larger charge transfer resistance, which
depends on the microstructure of the electrode. A tree type structure for ionic particles
could result in a small charge transfer resistance. Therefore, the mixed electrode is more
dependent on the microstructure than the pure metal electrode.
119
CHAPTER V
PERFORMANCE STUDIES OF MIXED IONIC AND ELECTRONIC
ELECTRODES
5.1 Introduction
As described in Chapter I, mixed electrodes are able to increase the reaction area and
reduce electrode degradation by limiting the sintering behavior of the metal component.
But the mixed electrode system is more complicated than the traditional single-phase
metal electrode, since it has more components. The electrode performance is not only
dependent on electrical resistance and sodium conduction, but also on the physical
morphology of the electrode, such as the porosity, thickness, grain size, and quality of
contact at the electrode-electrolyte interface, all which can affect the conduction of both
electrons and sodium to and from the reaction sites.
Two parameters are generally used to evaluate the performance of an electrode, Rs
and Ract. Rs is the series resistance, including all contact resistances. Ract is a
combination of the charge transfer resistance and the sodium diffusion resistance. We
used Rs and Ract to evaluate the performance of pure metal electrodes and MIEEs in
Chapter III. But the evaluation is only valid when all these electrodes are measured at
the same temperature including both electrode and sodium pool temperatures, because Rs
and Ract vary with temperature. Therefore, researchers in JPL developed another
parameter, B, to evaluate electrode performance independent of the electrode and sodium
pool temperature.36 B is the normalized exchange current density, which is normalized
120
to the sodium collision rate and reaction rate at unit activity of sodium. The units of B
are AK1/2/(m2Pa) or AK1/2/N and it is calculated using equation (5.1).
el
eloo
PTJ
B2/1
= (5.1)
In this equation, Tel and Pel are the temperature and sodium pressure at the electrode,
ooj is the exchange current at an equilibrium potential obtained with saturated sodium
vapor in contact with the electrode, defined by researchers in JPL. B is a sensitive
measurement of the electrode performance. Large changes in B reflect relatively small
changes in electrochemical cell performance until the exchange current drops significantly.
The research at JPL indicated that the B value is approximately independent of electrode
temperature, but our experimental results did not support this claim.
In the derivation of equation (5.1), the charge transfer coefficient α is assumed equal
to 0.5, but some experimental results indicated that α has significant scatter from 0.3 to
0.7.107 Our experimental results showed that α≈1/3 at 1123K for the Ni/sodium titanate
electrodes in Chapter IV. The value of α change will result in the change of B value.
Since B is the main parameter used to evaluate AMTEC electrode performance, it is
worth understanding its validity and the effect of α on B.
In this chapter, two kinds of MIEEs were tested and discussed. One is metal mixed
with β′′-alumina and the other is metal mixed with sodium titanate. For all tested
electrodes, the impedance spectra were measured, B values were calculated, electrode
performance was evaluated and the microstructures were observed before and after
121
electrodes testing in SETCs. Finally, the effect of the charge transfer coefficient α on B
was discussed.
5.2 Experimental
The following chemicals were used as purchased:
Nickel powder 2.2∼3.0μm(99.9%, Alfa Aesar)
Nickel powder 3∼7μm(99.9%, Alfa Aesar)
Nickel powder 5∼15μm(99.8%, Alfa Aesar)
Aluminum powder 3.0∼4.5μm (97.5%, Alfa Aesar)
Cobalt powder ∼1.6μm (99.8%, Alfa Aesar)
Cupper powder 1∼1.5μm (99%, Alfa Aesar)
Sodium titanate powder(99.7%, Strem chemicals Inc )
For metal/β′′-alumina electrodes, W/β′′-alumina, Cu/β′′-alumina, Ni/β′′-alumina,
Cu/Ni/β′′-alumina and Cu/Co/β′′-alumina were tested. Some of them were fabricated by
electrophoresis in Ionotec, England and others were deposited by flame spraying in
Hitemco, Houston.
For metal/sodium titanate electrodes, Ni/sodium titanate, Cu/sodium titanate,
Ni//Cu/sodium titanate, and Co/Cu/sodium titanate were tested. All metal/sodium
titanate electrodes were deposited by flame spraying deposition technique in Hitemco or
Alamo Supply, Houston. The detailed electrode compositions and experiment durations
are listed in appendix B.
122
5.3 Results and Discussion
5.3.1 TiN Electrode
TiN electrodes were examined in this research as a reference for evaluating the
performance of other electrodes, since it is the current standard AMTEC electrode. The
impedance spectra of these electrodes exhibit the Ract increased with experiment time
rapidly, shown in Figure 5.1(a). This trend is clearer in the plot of B value vs. time,
shown in Figure 5.1(b), which includes results for several TiN electrodes. It is found
that TiN electrodes performed very well initially, and then degraded rapidly with time.
The final B value is around 10 after 20 days of testing. This rapid significant
degradation is the reason why we need to discover new electrode materials to improve
the AMTEC electrode performance and lifetime.
5.3.2 Metal/β′′-alumina MIEEs
W/β′′-alumina MIEEs. ⎯ Metal W and its alloys were studied as AMTEC
electrodes, and displayed notable performance. Thus, we selected it to fabricate a mixed
electrode with β′′-alumina. These electrodes have been tested with mass ratios of W to
β′′-alumina of 1/1, 3/2, 3/1, and 4/1. They were fabricated by electrophoresis at Ionotec,
England. Unfortunately, the adhesion of the electrode film to BASE was very low,
which resulted in poor performance for most tests of these electrodes. The sample with
3/1 ratios performed better. Figure 5.2(a) shows its impedance spectra measured at
304oC pool temperature and 904oC electrode temperature.
123
-3.0
-2.0
-1.0
0.0
1.05.0 7.0 9.0 11.0 13.0 15.0
Real Impedance(ohm)
Imag
inar
y Im
peda
nce(
ohm
)
to=1d t-to=3d t-to=4d t-to=5d t-to=6d t-to=7d t-to=8d t-to=9d t-to=10d t-to=12d
t-to=14d t-to=15d t-to=18d t-to=20d t-to=22d t-to=24d t-to=25d t-to=27d t-to=28d
(a)
0.0
20.0
40.0
60.0
80.0
0 10 20 30 40 50 60
Experiment Time(Day)
B
test2test3test4
(b)
Figure 5.1. a) The impedance spectra of TiN electrodes. b) B value versus experiment time.
124
These spectra can be deconvoluted into two depressed semi-circles, one related to the
charge transfer process at high frequency range, and the other related to sodium
diffusion in the electrode at low frequency range. It is found that the high frequency
circle (the charge transfer circle) is very depressed, compared to the normal impedance
spectra of a MIEE. This phenomenon could result from surface roughness or varying
thickness or composition of the electrode film. The depressed semicircle is indeed the
arc of a circle with the center some distance below the x-axis. For a very smooth
surface, the circle is an exact semicircle, i.e., the center of the circle is on the x-axis.
When the surface roughness increases, the center of the circle moves below the x-
axis.86,105 A highly depressed circle corresponds to a very rough, fractal surface.
Therefore, our W/β′′-alumina spectra reflect a rough electrode surface, which is
consistent with the SEM observations.
The spectra also illustrate that Ract increases with experiment time, which indicates
that this electrode degrades rapidly. B values of this electrode are as low as 5, shown in
Figure 5.2(b), which is much lower than that of the standard TiN electrode.
Figure 5.3 includes the SEM images of this sample before testing in the SETC. The
raw mixed materials have 75% W by mass, but these images reveal an inadequate
amount of W deposited into the electrode, which suggests that the electrophoresis
deposition technique did not work well for W/β′′-alumina mixture deposition. This lack
of W probably played a major role in the poor performance of the electrodes.
125
-15.0
-10.0
-5.0
0.00.0 5.0 10.0 15.0 20.0 25.0 30.0 35.0 40.0 45.0
Real Impedance(ohm)
Imag
inar
y Im
peda
nce(
ohm
)
to=1d t-to=2d t-to=4d t-to=5d t-to=7d t-to=10d t-to=12d
(a)
0.00
1.00
2.00
3.00
4.00
5.00
6.00
0 2 4 6 8 10 12 14 16 18
Experiment time(Day)
B
(b)
Figure 5.2. a) The impedance spectra of W/β′′-alumina electrode with W/β′′ ratios of
3/1. b) B value versus experiment time.
126
Pre-test sample ×2000 SE image ×2000 Ni x-ray map
×2000 Al x-ray map ×2000 W x-ray map
Figure 5.3. SEM images of W/β′′-alumina sample with W/β′′ ratios of 3/1 before
testing in the SETC.
10 μm Al 15kV 10 μm W 15kV
10 μm SE 15kV 176pA 10 μm SE 15kV
127
Cu/β′′-alumina MIEEs. ⎯ Due to the high electrical conductivity and
thermodynamical stability at AMTEC conditions, metal copper is an alternative to Ni as
the metal component of a MIEE. Cu/β′′-alumina electrodes were tested in this research
with the ratio of Cu to β′′-alumina of 1/1 and fabricated by flame spraying deposition
technique. The impedance spectra, shown in Figure 5.4(a), were measured at 855oC
electrode temperature and 294-300oC pool temperature. Due to vacuum pump problems,
this test was run only a few days.
The spectrum consists of two depressed semi-circles, the high frequency charge
transfer circle and the low frequency diffusion circle, which is in agreement with
impedance spectra of normal mixed electrodes as discussed in Chapter IV. Thus the
deduced electrode kinetics is also useful for this electrode.
The spectra show the Ract decreases with time, meaning the electrode matures with
time. Deconvoluting these spectra, the charge transfer resistance and diffusion
resistance are obtained, shown in Figure 5.4(b). It is found that the value of Rct is very
close to Rd value for this electrode. Such large Rct could due to insufficient amounts of
Cu in this electrode, thus increasing the mass percentage of Cu may reduce it. The kinetics
equation (4.26) proposed in Chapter IV displays the reaction rate constant of sodium
oxidation kb is close to rate constant of sodium vapor diffusion k2, if Rct is similar to Rd.
The B value, shown in Figure 5.4(c) is around 8, which is lower compared to the
standard TiN electrode. Therefore, the performance of Cu/β′′-alumina electrode is not
satisfied with AMTEC requirements. But compared to the W/β′′-alumina electrode,
Cu/β′′-alumina performs slightly better.
128
-8.00
-6.00
-4.00
-2.00
0.0010.00 15.00 20.00 25.00 30.00 35.00
Real impedance(ohm)
Imag
inar
y Im
peda
nce(
ohm
)to=1d
to=2d
to=3d
to=5d
to=6d
to=7d
to=8d
(a)
-8.0
-6.0
-4.0
-2.0
0.010.0 15.0 20.0 25.0 30.0 35.0
Real Impedance(ohm)
Imag
inar
y Im
peda
nce(
ohm
) Experimental datacharge transfer impedancediffusion impedance
(b)
Figure 5.4. a) The impedance spectra of Cu/β′′-alumina electrode with Cu/β′′ ratio of
1/1. b) The impedance spectrum measured on t-to=7d, and its deconvoluted spectra for
charge transfer and sodium transport processes c) B value versus experiment time.
129
0.00
2.00
4.00
6.00
8.00
10.00
0 1 2 3 4 5 6 7 8 9 10Experiment time(Day)
B
(c)
The SEM images in Figure 5.5 show the physical morphology of this electrode
before and after testing in the SETC. For the original pre-test sample, its microstructure
is basically satisfactory, with Cu distributed uniformly and close to the desired amount.
The porosity in the electrode is also appropriate. This means the flame spray deposition
technique works for the Cu/β′′-alumina mixture deposition. The SEM images of the
post-test sample reveal that the particle size of Cu is significantly increased compared to
the microstructure of the original sample. Since this sample was only tested 10 days in
the SETC, such large change of Cu particles indicates its grain growth rate is very
significant, which could lead to very rapid degradation. Therefore, we believe the
Cu/β′′-alumina electrode is not a good electrode for AMTEC operation.
Figure 5.4. (Continued)
130
Pre-test sample ×500 BSE image ×2000 BSE image
×2000 Cu x-ray map ×2000 Al x-ray map
(a)
10 μm Cu 15kV 10 μm Al 15kV
10 μm BSE 15kV 20μm BSE 15kV
Figure 5.5. SEM images of Cu/β′′-alumina sample with Cu/β′′ ratio of 1/1, a) before and
b) after testing in the SETC.
131
Post-test sample ×500 BSE image ×2000 BSE image
×2000 Cu x-ray map ×2000 Al x-ray map
(b)
Figure 5.5. (Continued)
10 μm BSE 15kV20μm BSE 15kV
10 μm Cu 15kV 10 μm Al 15kV
132
Ni/β′′-alumina MIEEs. ⎯ These electrodes have been fabricated by both
electrophoresis and flame spraying deposition techniques, but the electrophoretically
deposited electrode films were very thin and adhered poorly to the BASE, which
resulted in poor performance. Flame spraying deposited electrode displayed better
adhesion and higher performance. Therefore, the behaviors of the electrodes deposited
by flame spraying are analyzed here. We tested these electrodes with Ni to β′′-alumina
ratios of 1/1, 3/2, and 3/1. Based on the experimental data, the best performance belongs
to the electrode with the Ni/β′′ ratios of 3/1. Its impedance spectra are shown in Figure
5.6(a), measured at 302oC pool temperature and 850oC electrode temperature.
For this electrode, the charge transfer resistance is much smaller than the diffusion
resistance, which means sodium diffusion in this electrode is the rate limiting step.
Additionally, the impedance measured on Jan 5th suddenly increased, which is mainly
due to an increase of the diffusion impedance, shown in Figure 5.6(b). This could result
from a reduction of electrode porosity during the test.
The initial B is around 15 for Ni/β′′ electrode, shown in Figure 5.6(c). Compared to
the Cu/β′′ electrode, the Ni/β′′ electrode displayed a much smaller Rct, but a larger Rd.
Thus, the rate constant k2 of the sodium vapor transport reaction (4.5) is smaller than that
of Cu/β′′ electrode, which means sodium transport is more difficult in the Ni/β′′
electrode than the Cu/β′′ electrode. However, the apparent charge transfer resistance Ract
is similar for both electrodes, which are around to 14Ω. The B values for Ni/β′′
electrode are slightly larger than that of Cu/β′′ electrode, which indicates that these two
electrodes have the similar performance.
133
-10.0
-8.0
-6.0
-4.0
-2.0
0.00.0 5.0 10.0 15.0 20.0 25.0 30.0
Real Impedance(ohm)
Imag
inar
y Im
peda
nce(
ohm
) to=1dt-to=1.5dt-to=2dt-to=3d
(a)
-10.0
-8.0
-6.0
-4.0
-2.0
0.00.0 5.0 10.0 15.0 20.0 25.0 30.0
Real Impedance(ohm)
Imag
inar
y Im
peda
nce(
ohm
) experimental data on t-to=2dcharge transfer impedance on t-to=2ddiffusion impedanceon t-to=2dexperimental dataon t-to=3dcharge transfer impedanceon t-to=3ddiffusion impedanceon t-to=3d
(b)
Figure 5.6. a) The impedance spectra of Ni/β′′-alumina electrode with Ni/β′′ ratios
of 3/1. b) The impedance spectra measured on t-to=2d and 3d, and their deconvoluted
spectra for charge transfer and sodium transport processes. c) B value versus
experiment time.
134
0.00
5.00
10.00
15.00
20.00
0 1 2 3 4
Experiment time(Day)
Btest1test2
(c)
Figure 5.7 displays the microstructure of a tested Ni/β′′-alumina electrode. It
illustrates that grain coalescence for both Ni and β′′-alumina particles. With the sample
testing in the high temperature SETC, grain coalescence occurred, which reduced the
electrode porosity and then made the sodium transport more difficult. At the beginning
of this process, it would not significantly affect the number of reaction sites, thus the
charge transfer resistance change slightly, which could explain the significant increase of
the diffusion resistance on Jan 5th.
Ni particles coalesced and formed a network from the current collector to the
interface of BASE. This interaction improves the electrode conductivities for both ionic
and electronic. Also, the networks of Ni and β′′-alumina were interwoven, which
enlarges the reaction area. This behavior could interpret the small charge transfer
resistance for Ni/β′′-alumina electrode.
Figure 5.6. (Continuted)
135
Post-test sample ×500 SE image ×2000 SE image
×2000 Al x-ray map ×2000 Ni x-ray map
Figure 5.7. SEM images for Ni/β′′-alumina sample with Ni/β′′ ratios of 3/1 after testing
in the SETC.
10 μm SE 15kV20μm SE 15kV
10 μm Al 15kV 10 μm Ni 15kV
136
Ni/Cu/β′′-alumina MIEEs. ⎯ In these electrodes, Cu is added as the second metal
in order to improve the adhesion of the electrode film, because Cu/β′′-alumina electrode
displayed a good adhesion. For the Ni/β′′-alumina electrode with the Ni/β′′ ratios of 3/1
discussed previously, if half of its Ni is replaced by Cu, it forms Ni/Cu/β′′-alumina
electrodes with 3/3/2 ratios of Ni to Cu to β′′. These electrodes were tested at 855oC
electrode temperature and 295oC sodium pool temperature.
The impedance spectra and deconvoluted spectra of this Ni/Cu/β′′ electrode are
shown in Figure 5.8 (a) and (b), respectively. Compared Figure 5.8(b) to the Cu/β′′
electrode spectrum, Figure 5.4(b), we found that the charge transfer resistance Rct of
Ni/Cu/β′′ electrode is reduced, but their diffusion resistance Rd is similar. Compared to
Ni/β′′-alumina electrode, Figure 5.6(b), the Rct of Ni/Cu/β′′ electrode is increased, while
Rd is decreased.
Combining these results, we found that the electrode containing Cu had a small
diffusion resistance, while the electrode containing Ni had a small charge transfer
resistance and with the amount of Ni component increase, Rct decreases; with the Cu
amount increase, Rd roughly decreases. It seems that Cu particles are more involved in
sodium transport process, while Ni particles contribute more to the charge transfer
reaction. k2 is larger in the electrode having Cu particles, which may suggest that the
sodium vapor diffusion or desorption on Cu particles is easier than on Ni particles.
137
The B values for this electrode are similar to that of Cu/β′′ and Ni/β′′ electrodes.
Therefore, it is concluded that Ni/Cu/β′′ electrode did not make progress with
performance compared to Cu/β′′ or Ni/β′′ electrodes.
The SEM images of Ni/Cu/β′′ electrode before and after the test are shown in Figure
5.9(a) and (b). The SEM images of pre-test sample show that the Ni, Cu and β′′ were all
deposited on the BASE with the desired mass ratio and they basically distributed
uniformly over the whole electrode, which means that flame spraying is suitable for
depositing a mixture with multiple components. The images of the post-test sample
demonstrated that metal and ceramic particles both grew during the SETC test. Each
type of particles connected and formed networks, which limited the further growth of
grains. The grain boundaries still can be seen in this sample. Therefore, the extent of
the grain growth is smaller than that of the pure metal electrode. It is also found that Ni
and Cu particles coexistence in all images. For example, Ni and Cu are both present in
the “key” shaped particles at the center of the SE image in Figure 5.9(b). This behavior
is not observed for other electrodes with two metals. The most possible reason is the
metal Ni and Cu alloyed during the test.
138
-6.0
-5.0
-4.0
-3.0
-2.0
-1.0
0.0
1.05.0 10.0 15.0 20.0 25.0
Real Impedance(ohm)
Imag
inar
y Im
peda
nce(
ohm
)to=1d
t-to=2d
t-to=3d
t-to=4d
t-to=5d
t-to=6d
t-to=7d
t-to=8d
(a)
-6.0
-5.0
-4.0
-3.0
-2.0
-1.0
0.05.0 7.0 9.0 11.0 13.0 15.0 17.0 19.0 21.0 23.0 25.0
Real Impedance(ohm)
Imag
inar
y Im
peda
nce(
ohm
)
Experimental data
Charge transfer impedance
Diffusion impedance
(b)
0.00
5.00
10.00
15.00
20.00
0 1 2 3 4 5 6 7 8 9 10
Experiment time(Day)
B
(c)
Figure 5.8. a) The impedance spectra of Ni/Cu/β′′-alumina electrode with Ni/Cu/β′′ ratios
of 3/3/2. b) The impedance spectrum measured on t-to=8d, and its deconvoluted spectra
for charge transfer and sodium transport processes. c) B value versus experiment time.
139
Pre-test sample ×2000 BSE image ×2000 Al x-ray map
×2000 Ni x-ray map ×2000 Cu x-ray map
(a)
10 μm BSE 15kV 10 μm Al 15kV
10 μm Ni 15kV 10 μm Cu 15kV
Figure 5.9. SEM images for Ni/Cu/β′′-alumina sample with Ni/Cu/β′′ ratios of 3/3/2
a) before and b) after testing in the SETC.
140
Post-test sample ×2000 BSE image ×2000x Al x-ray map
×2000 Cu x-ray map ×2000 Ni x-ray map
(b)
Figure 5.9. (Continued)
10 μm Cu 15kV 10 μm Ni 15kV
10 μm Al 15kV10 μm BSE 15kV
141
Co/Cu/β′′-alumina MIEEs. ⎯ Metal Co is the first using in an AMTEC electrode
in this research. The electrodes were tested having ratios of Co to Cu to β′′-alumina of
3/3/2, the same ratio used with Ni/Cu/β′′-alumina electrode discussed previously.
Co/Cu/β′′ electrode was tested over 70 days at 867oC electrode temperature of and
300oC pool temperature.
The impedance spectra are shown in Figure 5.10(a). By deconvoluting the spectra,
the series resistance Rs, charge transfer resistance Rct and diffusion resistance Rd were
obtained and were all plotted verse experiment time in Figure 5.10(b), as well as Ract. It
is found that Rs and Rd are basically stable for the entire experiment period, while the
other two resistances increased gradually with experiment time for the first 35 days and
then stabilized. Comparing this electrode’s initial performance to that of Cu/β′′ and
Ni/Cu/β′′ electrodes, we found that Co/Cu/β′′ electrode has similar Rd to Cu/β′′ or
Ni/Cu/β′′ electrodes, while its Rct is much smaller than that of the Cu/β′′ electrode, and
slightly lower than the Ni/Cu/β′′ electrode. This indicates that the role of Co might be
similar to Ni in those mixed electrodes, which is more related to charge transfer process.
Unfortunately, we did not test Co/β′′-alumina electrode to prove this conjecture.
Additionally, the values of B are also close to those of Ni/Cu/β′′ electrodes, but this
electrode had a longer lifetime. The B values decreased for the first 30 days and then
stabilized, shown in Figure 5.10(c). To summarize, Co/Cu/β′′-alumina electrode’s
performance is similar to Ni/Cu/β′′-alumina electrodes, but it degrades slowly.
142
The microstructure of this electrode before and after testing was shown in Figures
5.11(a) and (b). The SEM images for the pre-test sample are very similar to
Ni/Cu/β′′electrode. Metal particles are small and spherical, while β′′-alumina particles
have the varying size and shape. The microstructure of the electrode after testing shows
β′′-alumina particles grew and congregated to form a frame with Cu and Co particles
inserted in it, while Cu and Co particles remained the small size, which indicated that
β′′-alumina limited the growth of metal particles. The small size of the metal particles
most likely contributed to the slow degradation of this electrode.
-8.0
-6.0
-4.0
-2.0
0.0
5.0 10.0 15.0 20.0 25.0 30.0
Real Impedance(ohm)
Imag
inar
y Im
peda
nce(
ohm
)
to=1d t-to=5d t-to=6d t-to=7d t-to=11d t-to=15d t-to=17d t-to=19d t-to=21dt-to=23d t-to=25d t-to=27d t-to=29d t-to=31d t-to=35d t-to=40d t-to=44d t-to=46dt-to=48d t-to=56d t-to=66d t-to=74d
(a)
Figure 5.10. a) The impedance spectra of Co/Cu/β′′-alumina sample with Co/Cu/β′′
ratios of 3/3/2. b) The changes of extracted Ract, Rs, Rct, Rd versus experiment time. c) B
value versus experiment time.
143
0.0
5.0
10.0
15.0
20.0
0 10 20 30 40 50 60 70 80
Experiment time(Day)
Impe
danc
e(oh
m)
Rs Rct Rd Ract
(b)
0.00
5.00
10.00
15.00
20.00
25.00
0 10 20 30 40 50 60 70 80Experiment time(Day)
B
(c)
Figure 5.10. (Continued)
144
Pre-test sample ×2000 BSE image ×2000 Al x-ray map
×2000 Cu x-ray map ×2000 Co x-ray map
(a)
10 μm Cu 15kV 10 μm Co 15kV
10 μm Al 15kV 10 μm BSE 15kV
Figure 5.11. SEM images for Co/Cu/β′′-alumina sample with Co/Cu/β′′ ratios of
3/3/2 a) before and b) after testing in the SETC.
145
Post-test sample ×2000 SE image ×2000 Al x-ray map
×2000 Cu x-ray map ×2000 Co x-ray map
(b)
Figure 5.11. (Continued)
10 μm Al 15kV10 μm SE 15kV
10 μm Co 15kV10 μm Cu 15kV
146
5.3.3 Metal/Sodium Titanate MIEEs
Cu/Sodium Titanate MIEEs. ⎯ This electrode was investigated with a Cu to
sodium titanate (ST) ratio of 1/1 and its spectra are shown in Figure 5.12(a). It was
found that the spectra did not intercept the real impedance axis at the right side. This
failure to intercept is resulted from the low frequency limitation used in this
measurement, 0.1Hz, not being low enough. Simulating experimental spectrum from 10-
3 to 106Hz using the proposed equivalent circuit in Chapter IV generated a spectrum that
adequately matched the experimental data and intercepted the real impedance axis,
shown in Figure 5.12(b). Ract for this electrode was calculated from the extended low
frequency intercept.
The deconvoluted spectra exhibit the charge transfer resistance is smaller than the
transport resistance, the latter being more than twice of the former. Compared to the
Cu/β′′-alumina electrode, Cu/ST electrode has a larger Rd but their Rct values are very
close. According to the MIEE kinetic equation (4.26) described in Chapter IV, a large Rd
should correspond to a small k2. Based on equation (4.29), k2 can be evaluated from the
frequency at the maximum of the sodium transport semicircle. The experimental results
show the ratio of these specific frequencies is 1/4 for those two electrodes, thus the
sodium transport rate constant k2 for the Cu/ST electrode is only 1/4 of that for the
Cu/β′′-alumina electrode.
147
-12.0
-10.0
-8.0
-6.0
-4.0
-2.0
0.0
2.05.0 10.0 15.0 20.0 25.0 30.0 35.0 40.0 45.0 50.0
Real Impedance(ohm)
Imag
inar
y Im
peda
nce(
ohm
)
to=1d t-to=2d t-to=3d t-to=4d t-to=5d t-to=6d t-to=7d t-to=8dt-to=9d t-to=10d t-to=11d t-to=12d t-to=13d
(a)
-10.0
-8.0
-6.0
-4.0
-2.0
0.00.0 5.0 10.0 15.0 20.0 25.0 30.0
Real Impedance(ohm)
Imag
inar
y Im
peda
nce(
ohm
) experiemental dataCharge transfer impedanceDiffusion impedancesimulated data
(b)
0.00
2.00
4.00
6.00
8.00
0 2 4 6 8 10 12 14
Experiment time(Day)
B
(c)
Figure 5.12. a) The impedance spectra of Cu/sodium titanate sample with Cu/ST ratioof 1/1. b) The impedance spectrum measured on t-to=6d, and its deconvoluted spectra forcharge transfer and sodium transport processes. c) B value versus experiment time.
148
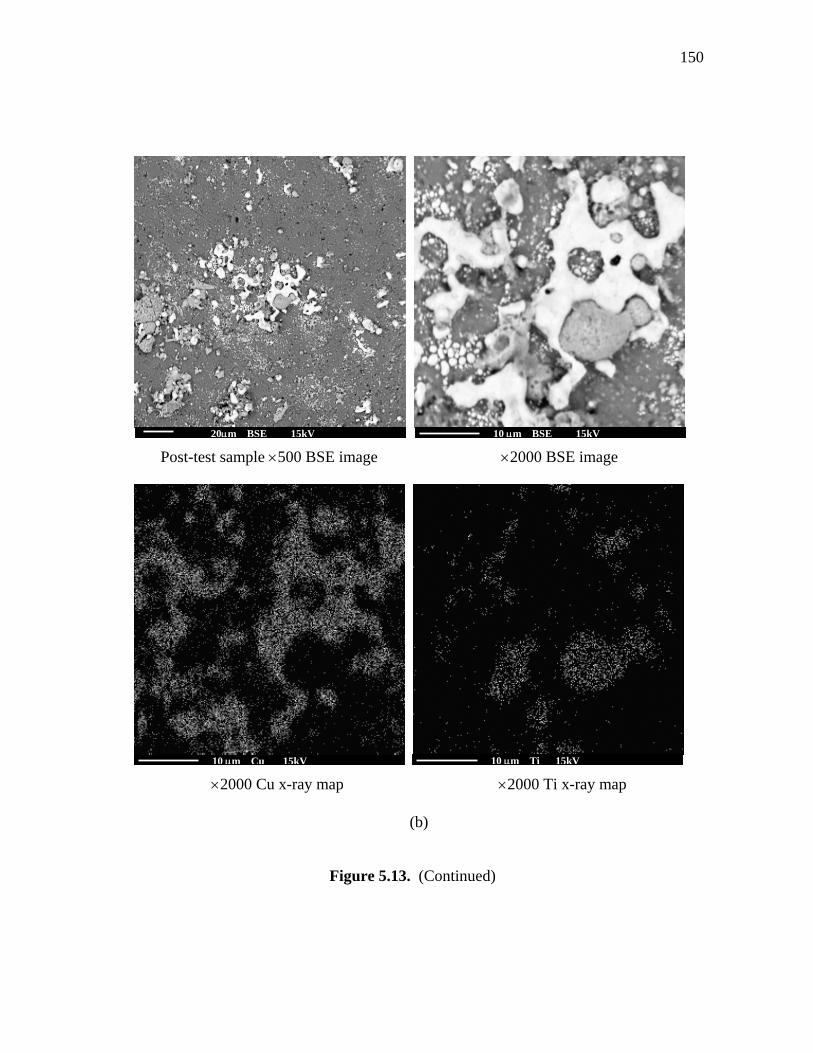
The large Rd can be explained from the electrode’s morphological characteristics,
shown in Figure 5.13. The pre-test SEM images show the electrode film is dense.
Sodium titanate is present as very large particles, which are connected together to form a
frame and the Cu particles are embedded in the frame or on the top of it. Thus the
porosity in this electrode is very low. Such a microstructure could result in a small
reaction area and difficult sodium transport within the electrode, but the adhesion of this
electrode to the BASE is good.
The SEM images for the post-test sample show that some area of the BASE is bald,
without the coverage of the electrode film. This loss occurred because the electrode film
stuck to the current collector and was separated from BASE during SETC disassembly or
during the process of making SEM samples. Figure 5.13(b) show that the Cu particles
aggregated together around the sodium titanate, shown in
The B value sharply decreased with experiment time as shown in Figure 5.12(c).
Compared to the Cu/β′′-alumina electrode, the Cu/ST electrode did not show any
improvement. The large particle size of sodium titanate could be the main reason for this
result.
149
Pre-test sample ×500 SE image ×2000 BSE image
×2000 Cu x-ray map ×2000 Ti x-ray map
(a)
10 μm Cu 15kV 10 μm Ti 15kV
10 μm BSE 15kV20μm SE 15kV
Figure 5.13. SEM images for Cu/sodium titanate sample a) before and b) after testing
in the SETC.
150
Post-test sample ×500 BSE image ×2000 BSE image
×2000 Cu x-ray map ×2000 Ti x-ray map
(b)
Figure 5.13. (Continued)
10 μm BSE 15kV20μm BSE 15kV
10 μm Cu 15kV 10 μm Ti 15kV
151
Figure 5.14 is the spectra of the electrode with a 4/1 ratio measured at 845oC
electrode temperature and 309oC pool temperature. It is found that the value of Rct is
about 0.1Ω, and Rd increases with experiment time from 1.5Ω to 2.5Ω. Such small Rct
and Rd had never been obtained in our tested electrodes previously. Its B values were as
high as 70 at initial, then decreased and finally stabilized around 50, which is much
higher than that of TiN electrode after 10-40 days testing at this temperature.
Carefully observing its spectra, it is found that the spectra are different from
traditional spectra of mixed electrodes in shape. The semicircle curves are hardly
depressed. We discussed the relationship of the depressed extent of the semicircle with
the surface roughness in Chapter IV, and concluded that a real semicircle without any
depression indicates the interface is smooth. Therefore, this electrode has a smooth
interface between electrode and electrolyte.
Figure 5.15 shows the electrode’s microstructure after testing. It is found that Ni
formed a complete network within the whole electrode, as did sodium titanate and they
were interwoven, which matches the designed ideal morphology for a high performance
electrode described in Chapter III.
152
-2.0
-1.0
0.0
1.02.0 3.0 4.0 5.0 6.0 7.0 8.0
Real Impedance(ohm)
Imag
inar
y Im
peda
nce
(ohm
)to=1dt-to=3dt-to=5dt-to=8dt-to=10dt-to=11dt-to=22dt-to=26dt-to=32dt-to=40dt-to=43dt-to=46dt-to=48dt-to=50dt-to=52dt-to=54dt-to=56dt-to=58d
(a
0.0
1.0
2.0
3.0
4.0
5.0
0 10 20 30 40 50 60 70Experiment time(Day)
Impe
danc
e(oh
m)
Rs Rct Rd (b)
0.00
20.00
40.00
60.00
80.00
0 10 20 30 40 50 60Experiment time(Day)
B
(c)
Figure 5.14. a) The impedance spectra of Ni/sodium titanate electrode with Ni/ST ratios
of 4/1 b) The changes of extracted Rs, Rct, and Rd, versus experiment time and c) B value
versus experiment time.
153
Post-test sample ×500 BSE image ×2000 SE image
×2000 Na x-ray map ×2000 Ni x-ray map
Figure 5.15. SEM images of the Ni/sodium titanate sample with Ni/ST ratios of 4/1
after testing in the SETC.
154
Ni/Cu/sodium titanate MIEEs. ⎯ The tested electrodes had Ni/Cu/Sodium titanate
ratios of 3/3/2 and 3/3/3. Cu was added to improve the adhesion of the electrode film to
the BASE. In all tested electrodes, the mass of Cu is same as that of Ni. The impedance
spectra of Ni/Cu/ST electrode with mass ratios of 3/3/2 were measured at 844oC
electrode temperature and 290oC pool temperature, shown in Figure 5.16.
The Ract value first decreased with time, then stabilized for 30 days and finally
slowly increased with experiment time. Since these two types of electrodes have the
same metal components and β′′-alumina even has a higher Na+ ion conductivity than
sodium titanate, it seems that the better performance should belong to Cu/Ni/β′′
electrode, but the experiment data show that Ni/Cu/ST electrode has the smaller Rs, Rct
and Rd. The electrode performance is not only dependent on the physical properties of
the electrode components, but also on the microstructure formed by these components
connection. Thus, the better performance of Ni/Cu/ST electrode suggests that metal Ni
and Cu combining with sodium titanate should display the sort of microstructure
favorable to charge transfer and sodium transport that was discussed in the theoretical
analysis of mixed electrode composition and kinetics in Chapter III.
The SEM images of this electrode are shown in Figure 5.17(a) and (b). The images
of the pre-test sample show that Ni, Cu and sodium titanate are all deposited on the
BASE with the desired ratio and all three particles are present as small spheres.
Compared to the particles in the Cu/sodium titanate electrode, the particle size of the
sodium titanate significantly decreased, although some big grains still are present. The
raw sodium titanate used in this electrode was ball-milled in the alcohol medium.
155
-10.0
-8.0
-6.0
-4.0
-2.0
0.0
5.0 10.0 15.0 20.0 25.0 30.0 35.0 40.0Real Impedance(ohm)
Imag
inar
y Im
peda
nce(
ohm
)
to=1d t-to=2d t-to=3d t-to=7d t-to=9d t-to=10d t-to=13d t-to=23dt-to=29d t-to=32d t-to=38d t-to=42d t-to=46d t-to=48d
(a)
0.0
3.0
6.0
9.0
12.0
15.0
0 10 20 30 40 50 60Experiment time(Day)
Impe
danc
e(oh
m)
Rs Rct Rd(b)
0.00
5.00
10.00
15.00
20.00
25.00
0 10 20 30 40 50 60Experiment time(Day)
B
(c)
Figure 5.16. a) The impedance spectra of Ni/Cu/sodium titanate electrode with
Ni/Cu/ST ratios of 3/3/2. b) The changes of extracted Rs, Rct, and Rd versus
experiment time. c) B value versus experiment time.
156
Ni and sodium titanate particles grew during the test, shown in Figure 5.17(b). The
amount of Cu in the post-test sample is much less than the pre-test sample, which could
be caused by Cu evaporation during the test. Cupper has a fairly high vapor pressure at
elevated temperature, three orders of magnitude larger than that of nickel. Insufficient
amount of the Cu in the electrode could result in Rct increase, but Ni was still present in
the electrode and played the role of electronic conductor. Additionally, previous
discussion indicated that the metal Ni is more related to the charge transfer process than
Cu. Therefore, this could be the reason of the Rct slowly increased near the end of test.
Another tested Ni/Cu/sodium titanate electrode has Ni/Cu//Sodium titanate ratios of
3/3/3. To reduce the sodium transport resistance, the amount of sodium titanate was
increased, compared to Ni/Cu/ST electrode with 3/3/2 ratios previously discussed. But
experiment data show that the addition of sodium titanate did not improve the electrode
performance. The spectra of Ni/Cu/ST electrode with 3/3/3 ratios and extracted Rs, Rct
and Rd changes with time are shown in Figure 5.18(a) and (b). It is found that Rs, Rct, Rd
and B are all very similar to those of Ni/Cu/ST with 3/3/2ratios, but after 30 days, these
resistances increased or B decreased with time more rapidly than the 3/3/2 electrode.
The SEM images of the pre-test sample are shown in Figure 5.19 (a). Compared to
the 3/3/2 electrode, it is found that the amount of sodium titanate seems not to be
increased, i.e., the extra amount of sodium titanate did not appear to deposit on the
BASE. The amount of Cu seems to be less than 3/3/2 electrode. The microstructure of
the post-test sample is similar with that of 3/3/2 electrode, shown in Figure 5.19 (b). Cu
evaporation and Ni particles coalescence also occurred in this electrode during the test.
157
Pre-test sample ×2000 BSE image ×2000 Ti x-ray map
×2000 Cu x-ray map ×2000 Ni x-ray map
(a)
Figure 5.17. SEM images for Ni/Cu/sodium titanate sample with Ni/Cu/ST ratios of
3/3/2 a) before and b) after testing in the SETC.
158
Post-test sample×2000 SE image ×2000 Ti x-ray map
×2000 Copper x-ray map ×2000 Nickel x-ray map
(b)
Figure 5.17. (Continued)
159
-6.0
-4.0
-2.0
0.0
2.05.0 10.0 15.0 20.0 25.0 30.0
Real Impedance(ohm)
Imag
inar
y Im
peda
nce(
ohm
)
to=1d t-to=2d t-to=3d t-to=5d t-to=8d t-to=9d t-to=13d t-to=16dt-to=21d t-to=22d t-to=26d t-to=28d t-to=30d t-to=34d t-to=37d t-to=39dt-to=42d t-to=44d t-to=46d t-to=48d t-to=50d t-to=52d
(a)
0.0
2.0
4.0
6.0
8.0
10.0
0 10 20 30 40 50 60days
Impe
danc
e(oh
m)
Rs Rct Rd
(b)
0.00
10.00
20.00
30.00
0 10 20 30 40 50 60Experiment time(Day)
B
test1test2
(c)
Figure 5.18. a) The impedance spectra of Ni/Cu/sodium titanate electrode with
Ni/Cu/ST ratios of 3/3/3. b) The changes of extracted Rs, Rct and Rd versus experiment
time. c) B value versus experiment time.
160
Pre-test sample ×2000 BSE image ×2000 Ti x-ray map
×2000 Cu x-ray map ×2000 Ni x-ray map
(a)
Figure 5.19. SEM images for Ni/Cu/sodium titanate sample with Ni/Cu/ST ratios of
3/3/3 a) before and b) after testing in the SETC.
161
Post-test sample ×2000 SE image ×2000 Ti x-ray map
×2000 Cu x-ray map ×2000 Ni x-ray map
(b)
Figure 5.19. (Continued)
162
Co/Cu/sodium titanate. ⎯ The electrodes tested in this research have two different
compositions, with the mass ratios of Co/Cu/ST of 3/2/1 and 3/4/1. The impedance
spectra of the electrode with 3/2/1 ratios are shown in Figure 5.20(a) and (b). For this
electrode, its Rct is larger than Rd, which is possibly caused by the insufficient amount of
electronic conductor, metals. Therefore, we increased the mass of metals in the
electrode, which generated the electrode with 3/4/1ratios.
The electrode with 3/4/1ratios displayed the good performance initially, but then
degraded rapidly, shown by its spectra in Figure 5.21(a). It did not make any progress
towards reducing Rct, i.e., increasing conductivity, compared to the electrode with 3/2/1
ratios. Figure 5.21(b) shows Rs, Rct and Rd change with time. Rct and Rd increase rapidly
and linearly with time after running 30 days. Such raid increase in Rct and Rd would
result this electrode complete failure.
163
-4.0
-3.0
-2.0
-1.0
0.0
1.06.0 8.0 10.0 12.0 14.0 16.0 18.0 20.0
Real Impedance(ohm)
Imag
inar
y Im
peda
nce(
ohm
)
to=1d
t-to=2dt-to=3d
t-to=4dt-to=5d
t-to=6dt-to=7d
t-to=8d
(a)
-4.0
-3.0
-2.0
-1.0
0.06.0 8.0 10.0 12.0 14.0 16.0 18.0
Real Impedance(ohm)
Imag
inar
y Im
peda
nce(
ohm
) Experimental dataCharge transfer impedanceDiffusion impedance
(b)
Figure 5.20. a) The impedance spectra of Co/Cu/sodium titanate electrode with
Co/Cu/ST ratios of 3/2/1. b) The impedance spectrum measured on t-to=7d, and its
deconvoluted spectra for charge transfer and sodium transport processes.
164
-20.0
-15.0
-10.0
-5.0
0.0
5.00.0 10.0 20.0 30.0 40.0 50.0 60.0 70.0
Real Impedance(ohm)
Imag
inar
y Im
peda
nce(
ohm
)
to=1d t-to=3d t-to=5d t-to=6d t-to=7d t-to=10d t-to=16d t-to=21d t-to=38dt-to=40d t-to=43d t-to=47d t-to=50d t-to=54d t-to=56d t-to=57d t-to=61d t-to=62dt-to=64d t-to=66d t-to=68d t-to=71d t-to=72d t-to=76d
(a)
0.0
5.0
10.0
15.0
20.0
25.0
30.0
35.0
0 10 20 30 40 50 60 70 80Experiment time(Day)
Impe
danc
e(oh
m)
Rs Rct Rd
(b)
Figure 5.21 .a) The impedance spectra of Co/Cu/sodium titanate electrode with
Co/Cu/ST ratios of 3/4/1. b) The changes of extracted Rs, Rct and Rd with
experiment time.
165
5.3.4 The Effect of Charge Transfer Coefficient α on B
B, the normalized exchange current density, is the only temperature independent
index available for evaluating AMTEC electrode performance, therefore, it is important
and necessary to clarify the validity of B. The transfer coefficient α, is a measure of the
symmetry of the energy barrier for a charge transfer reaction. In most electrochemical
systems, α turns out to lie between 0.3 and 0.7. For AMTEC, JPL assumed α is 1/2,
while this research measured α to be approximately 1/3. α is one of the factors that
affect B. If α is changed, B’s equation needs to be corrected.
B is defined in equation (5.1)
el
eloo
PTJ
B2/1
= (5.1)
Researchers in JPL defined ooJ as the exchange current at the equilibrium potential
obtained with saturated sodium vapor in contact with the electrode and it is defined in
equation (5.2),
α
⎟⎟⎠
⎞⎜⎜⎝
⎛=
Na
elo
oo P
PJJ (5.2)
oJ is the exchange current at actual equilibrium potential of the cell, defined in equation
(5.3)
act
elo FR
RTJ = (5.3)
Substituting equation (5.2) and (5.3) into Eq.(5.1), the following equation is obtained,
166
act
el
Nael
el
el
el
Na
elo
el
eloo
FRRT
PPT
PT
PPJ
PTJB ⎥
⎦
⎤⎢⎣
⎡=⎟⎟
⎠
⎞⎜⎜⎝
⎛== − αα
α
1
2/12/12/1
(5.4)
In a SETC, based on vapor kinetics theory, the sodium vapor pressure at the electrode is
Na
elNael T
TPP = . Therefore, equation (5.4) becomes
actNaNael
act
el
NaNa
elNa
el
FRPRTT
FRRT
PTTP
TB 21
22
1
2/1 αα
α
α
−+
− =
⎟⎟⎠
⎞⎜⎜⎝
⎛= (5.5)
This equation shows that B is a function of α. Therefore, B will change with α.
If 1αα = , actNa
Nael FRPRTTB 2
112
12
1
αα −+
= (5.6)
If 2αα = , actNa
Nael FRPRTTB 2
212
22
2
αα −+
= (5.7)
Divided (5.6) by (5.7), produces
221
221
222
211
212
2
1
αα
αααα
−
−+−+
⎟⎟⎠
⎞⎜⎜⎝
⎛=⎟⎟
⎠
⎞⎜⎜⎝
⎛⎟⎟⎠
⎞⎜⎜⎝
⎛=
Na
el
actNaNael
actNaNael T
TFRPRTT
FRPRTT
BB
(5.8)
This equation shows B monotonously increases with increasing α. Therefore, the
greater α, the greater B. In our SETCs, the pool temperature (TNa) is 285∼305oC, and
electrode temperature (Tel) is 840∼865oC. If α ranges between 0.3 and 0.7, the ratio in
equation (5.8) varies from 1 to 1.14, which means the values of B calculated at different
transfer coefficients are slightly different.
Taking the derivative of B with respect to α, yields
167
⎟⎟⎠
⎞⎜⎜⎝
⎛=
Na
el
TTB
ddB ln
21
α (5.9)
thus,
2lnln
2
α
αΔ
⎟⎟⎠
⎞⎜⎜⎝
⎛=⎟⎟
⎠
⎞⎜⎜⎝
⎛Δ=
Δ
Na
el
Na
el
TT
TT
BB (5.10)
In the temperature range described above, if α ranges from 0.3 to 0.7, the value of
BBΔ is in the range from 0 to 0.14, which means that the maximum change in B is 14%
due to changing α. For the most common temperature, Tel = 850oC and TNa = 300oC, the
B value at 2/1=α is 1.06 times the B value at 3/1=α .
B is a sensitive measure of the electrode performance. Large changes in B reflect
relatively small changes in electrochemical cell performance. Therefore, a 14% error in
B does not affect the evaluation of electrode performance. Additionally, other
measurement errors could affect the value of B, such as temperature and apparent charge
transfer resistance. Compared to the errors from these factors, it is believed that the
transfer coefficient α does not contribute significant errors to B. Therefore, equation
(5.11) is valid to calculate B.
⎥⎦
⎤⎢⎣
⎡⎥⎦
⎤⎢⎣
⎡==
act
el
Nael
el
FRRT
PPT
B2/1
(5.11)
168
5.4 Summary and Conclusions
We have investigated two types of MIEEs, metal/β′′-alumina electrodes and
metal/sodium titanate electrodes. For each type of electrode, different metals and
compositions are used to prepare a series of electrodes and their performance were
measured. The metals used were W, Ni, Cu and Co.
For metal/β′′-alumina electrodes, the performance was similar each other no matter
which metal or composition used and lower than the performance of standard TiN
electrode, or even a pure Ni electrode. The flame spraying deposition technique worked
for the fabrication of mixed electrodes with multiple components. The experiment
results indicated that Cu is capable of improving the electrode adhesion.
For metal/sodium titanate electrodes, Ni/sodium titanate preformed best. The
Ni/sodium titanate electrode with 4/1 mass ratio displayed a very good performance with
the initial B as large as over 60 and final B stable around 50, and a long lifetime, which
satisfy the requirement of AMTEC electrodes. It was found that the particle size and the
composition changed the performance of these electrodes significantly. Cu was added in
the electrode as the second metal to improve electrode adhesion, but it evaporated during
testing, which made the electrode performance degrade more rapidly. Additionally, the
electrodes with Cu had a lower sodium transport resistance. The kinetics suggested that
these Cu electrodes have a large rate constant for sodium transport. The electrodes with
Ni generally provide a small charge transfer resistance, which implies that Ni particles
are more related to the charge transfer reaction. The possible reason could be the Ni
particles form a network microstructure that is close to the theoretical morphology of the
169
ideal electrode. The experimental results proved that the performance of MIEEs is
strongly dependent on microstructure, as discussed in Chapter III. It is also found that
grain agglomeration occurred in all electrodes, and the ceramic components limited the
growth of metal grains, which results in a longer lifetime than the pure metal electrode.
Different values of the transfer coefficient α can cause variations in B values. For
standard SETC conditions, it will cause 6% change, while for normal SETC conditions,
it can produce a maximum change of 14%. Based on the error analysis, it is believed
that variations in α do not generate a significant effect on B.
170
CHAPTER VI
FINDINGS AND CONCLUSIONS
This research investigated pure metal electrodes, metal/sodium titanate, and
metal/β′′-alumina mixed conductor electrodes for AMTEC operation, measured their
performance, proposed kinetic mechanisms for electrode processes and calculated
optimum composition characteristics. The findings and conclusions are listed below:
i. Using thermodynamic theory, chemical potential diagrams were created for the
Na-Al-O, Na-Ti-O, and Na-Al-Ti-O systems at 1100K. Those diagrams illustrate that
β′′-alumina is stable over limited range of AMTEC operating conditoins. Ni and
Na2Ti3O7 are thermodynamically stable at AMTEC operating conditions and also
compatible with BASE.
ii. Based on the chemical and physical properties, metal Ta, Ni, Nb, Ir, W and
MoRe were studies as the electronic component-cadidates for MIEEs and tested in
SETCs. The experimental results showed that metal Ni is the best choice to be the
electronic conductor in a MIEE.
iii. Based on the percolation theory, a theoretical model was constructed. It
interpreted the performance differences of mixed conductor electrodes and predicted the
optimum particle size and composition range. The reaction area was evaluated for
electrodes with different compositions and particle sizes. The model shows that the
reaction area decreases with increasing particle size and particle size ratio. It also
predicts the electrode with two components has the best performance when these two
171
components have the same volume fraction and same particle size, and this particle size
should be as small as possible.
iv. For a mixture of Na2Ti3O7 and Na2Ti6O13 with mass ratio of 1/2, the average
activation energy for the bulk conductivity is 0.87ev. At AMTEC working temperatures
(~1120K), the conductivity of the grain boundaries is much higher than that of the bulk.
v. The pure metal electrodes and mixed conductor electrodes had similar
impedance spectra, which consist of two depressed semicircles. The semicircle at high
frequency is related to sodium charge transfer reaction, while the semicircle at low
frequency is related to sodium vapor transport through the electrode. The theoretical
expression for the impedance of the electrode processes has been derived.
vi. The pure metal electrodes and mixed conductor electrodes have similar electrode
kinetics mechanisms. The transport resistance is determined by not only electrode
transport characteristics but also charge transfer properties. For most of the tested
electrodes, the rate constant of sodium transport is smaller than that for sodium oxidation
reaction and can be calculated from the impedance spectra, which is equal to the
frequency of the maximum point on the semicircle at low frequency range. For a pure
metal electrode, the sodium vapor pressure at the electrode/electrolyte interface could be
estimated by measuring electrode impedance and extracting the diffusion capacitance.
vii. Sodium transport in the electrode is controlled by single activation energy of
99.4kJ/mol for a Ni electrode, although it might include several steps.
172
viii. All tested metal/β′′-alumina electrodes had similar and low performance. The
flame spraying deposition technique worked for the fabrication of mixed conductor
electrodes with multiple components.
ix. Ni/sodium titanate with the Ni/sodium titanate ratios of 4/1 displayed the best
performance and longest lifetime among all tested MIEEs, the pure metal electrodes and
standard TiN electrode. Ni particles are able to form a network microstructure that is
close to the theoretical morphology of the ideal electrode.
x. Grain agglomeration occurred in SETC testing for all electrodes, and sodium
titanate particles limited the growth of metal grains in mixed conductor electrode. The
performance of the mixed conductor electrode is strongly dependent on microstructure.
xi. Variations in transfer coefficient α do not generate a significant effect on B. At
traditional SETC conditions, variations of α causes 6% change in B, for the normal
SETC conditions, it produces a maximum change of 14%.
173
REFERENCES
1. R. K. Sievers, J. F. III Ivanenok, and T. K. Hunt, Mechanical Engineering
Magazine, 117(10), 70, (1995).
2. R. K. Sievers, R. J. Rasmussen, and C. J. Giglio, in Proceedings of the 33rd
Intersociety Energy Conversion Engineering Conference, 359, Colorado Springs,
CO, (1998).
3. C. P. Bankston, T. Cole, S. K. Khanna, and A. P. Thakoor, in Proceedings of the 1st
Symposium on Space Nuclear Power Systems, 393, Albuquerque, NM, (1984).
4. J. W. Suitor, M. Shirbacheh, R. M. Williams, and C. P. Bankston, AMTEC
Technology Development Plan, Jet Propulsion Laboratory, Pasadena, CA, (1990).
5. R. D. Cockfield, and E. W. Tobery, in Proceedings of the Space Technology and
Applications International Forum, 1482, Albuquerque, NM (2000).
6. J. Tournier and M. S. El-Genk, in Proceedings of the 33rd Intersociety Energy
Conversion Engineering Conference, 057, Colorado Springs, CO, (1998).
7. C. S. Mayberrt, J. Merrill, D. Radzykewycz, and K. Reinhardt, Renewable Energy,
23, 451, (2001).
8. K. Hyder, R. L. Wiley, G. Halpert, D.J. Flood, and S. Sabripour, Spacecraft Power
Technologies, Imperial College Press, London (2000).
9. N. Weber, Energy Conv., 14, 1, (1974).
10. T. Cole, Science, 221, 915, (1983).
11. C. P. Bankston, T. Cole, R. Jones, and R. Ewell, J. Energy, 7, 442, (1983).
174
12. C. B. Vining, R. M. Williams, M. L. Underwood, M. A. Ray, and J. W. Suitor, J.
Electrochem. Soc., 140, 2760, (1993).
13. J. M. Tournier and M. S. El-Genk, Energy Conversion & Management, 40, 139,
(1999).
14. J. M. Tournier and M. S. El-Genk, in Proceedings of the Space Technology and
Applications International Forum, 1552, New York (1998).
15. Solid Electrolytes, S. Geller, Editor, Springer-Verlag Press, Berlin, Germany (1977).
16. T. Cole, N. Weber, and T. K. Hunt, in Fast Ion Transport in Solids, Electrodes and
Electrolytes, P. Vashishta, J. N. Mundy, and G. K. Shenoy, Editors, p277, Elsevier
North Holland, Amsterdam (1979).
17. J. T. Kummer, in Progress in Solid State Chemistry, H. Reiss and J. O. McCaldin,
Editors, 7, p141, Pergamon Press Inc., New York, (1972).
18. T. Kudo and K.Fueki, Solid State Ionics, Kodansha, Tokyo (1990).
19. J. L. Sudworth, and A. R. Tilley, The Sodium Sulfur Battery, Chapman and Hall,
New York (1985).
20. C. Subbarao, Solid Electrolytes and Their Applications, Plenum Press, New York,
(1980).
21. T. Hattori and M. Ishigame, Solid State Ionics, 109, 197, (1998).
22. J. P. Boilot, A. Kahn, J. Thery, R. Collongues, J. Antoine, D. Vivien, C. Chevrette
and D. Gourier, Electrochimica Acta, 22, 741, (1977).
23. J. D. Hodge, J. Am. Ceram. Soc., 66(3), 166, (1983).
24. G. Yamaguchi, and K. Suzuki, Bull. Chem. Soc, Japan, 41, 93, (1968).
175
25. J. T. Kummer, and N. Weber, U.S. Patent 3413150, (1968).
26. R. M. Willams, M. A. Ryan, M. L. Homer, L. Lara, K. Manatt, V. Shields, R. H.
Cortez, and J. Kulleck, in Proceedings of the 33rd Intersociety Energy Conversion
Engineering Conference, 333, Colorado Springs, CO (1998).
27. M. A. K. Lodhi, P. Vijayaraghavan and A. Dalogu, Journal of Power Sources, 93,
41, (2001).
28. R. M. Willams, M. L. Homer, J. Kulleck, L. Lara, A. K. Kisor, R. H. Cortez, V. B.
Shields, and M. A. Ryan, in Proceedings of the Space Technology and Applications
International Forum, 1408, Albuquerque, NM (2000).
29. M. A. K. Lodhi and A. Dalogu, Journal of Power Sources, 85, 203, (2000).
30. M. A. K. Lodhi and A. Dalogu, Journal of Power Sources, 91, 99, (2000).
31. P. E. Hausgen and J. G. Hartley, in Proceedings of the 36th Intersociety Energy
Conversion Engineering Conference, 513, Savannah, GA (2001).
32. M. A. Ryan, V. B. Shields, R. H. Cortez, L. Lara, M. L. Homer, and R. M. Williams,
in Proceedings of the Space Technology and Applications International Forum,
1377, Albuquerque, NM (2000).
33. M. A, Ryan, A. Kisor, R. M. Williams, B. Jeffries-Nakamura, and D. O′Connor, in
Proceedings of the 29th Intersociety Energy Conversion Engineering Conference, 2,
877, Monterey, CA (1994).
34. V. B. Shields, M. A. Ryan, R. M. Williams, and M. L. Homer, in Proceedings of the
34th Intersociety Energy Conversion Engineering Conference, 1999-01-2703,
Vancouver, British Columbia (1999).
176
35. M. A. Ryan, V. B. Shields, R. H. Cortez, L. Lara, M. L. Homer, and R. M. Williams,
in Proceedings of the 34th Intersociety Energy Conversion Engineering Conference,
1999-01-2704, Vancouver, British Columbia (1999).
36. R. M. Williams, B. Jeffries-Nakamura, M. L. Underwood, C. P. Bankston, H.
LeDuc, and J. T. Kummer, J. Electrochem. Soc., 137, 1716, (1990).
37. M. A, Ryan, B. Jeffries-Nakamura, R. M. Williams, M. L. Underwood, D. O′Connor
and S. Kittert, J. Electrochem. Soc., 142, 4252, (1995).
38. R. M. Williams, B. L. Wheeler, B. Jeffries-Nakamura, M. E. Loveland, C. P.
Bankston, and T. Cole, J. Electrochem. Soc., 135, 2736, (1988).
39. B. Firbig, M. Schuller, M. A, Ryan, R. M. Williams, and P. Hudson, in Proceedings
of the Space Technology and Applications International Forum, 99-105, Woodbury,
NY (1999).
40. Space Nuclear Power System, Orbit Book, C. P. Bankston, M. S. El-Genk, and M.
D. Hoover, Editors, Ch18., Malabar, FL (1987).
41. M. A, Ryan, B. Jeffries-Nakamura, R. M. Williams, M. L. Underwood, D.
O’Connor and S. Kikkert, in Proceedings of the 27th Intersociety Energy
Conversion Engineering Conference, 3, 3.7, San Diego, CA (1992).
42. B. L. Wheeler, R. M. Williams, B. Jeffries-Nakamura, J. L. Lamb, M. E. Loveland,
C. P. Bankston, and T. Cole, J. Appl. Electrochem., 18, 410, (1988).
43. R. M. Williams, B. Jeffries-Nakamura, M. L. Underwood, B. L. Wheeler, M. E.
Loveland, S. J. Kikkert, J. L. Lamb, T. Cole, J. T. Kummer, and C. P. Bankston, J.
Electrochem. Soc., 136(3), 893, (1989).
177
44. R. M. Williams, G. Nagasugramanian, S. K. Kahanna, C. P. Bankston, A. P.
Thakoor, and T. Cole, J. Electrochem. Soc., 133, 1587, (1986).
45. J. R. Mcbride, R. F. Novak, D. J. Schnatz, W. B. Copple, J. T. Brockway, N. Arnon
and G. A. Grab, in Proceedings of the 24th Intersociety Energy Conversion
Engineering Conference, 683, Washington, DC (1989).
46. O. Asakami, K. Tsuchida, T. Togawa, and A. Kato, J. Mater. Sci. Lett., 8, 1141,
(1989).
47. O. Asakami, K. Tsuchida, and A. Kato, J. Mater. Sci. Lett., 9, 892, (1990).
48. H. Nakata, T. Nagata, K. Tsuchida, and A. Kato, J. Appl. Electrochem., 23, 1251,
(1993).
49. K. Tsuchida, T. Nagata, and A. Kato, J. Mater. Sci., 33, 755, (1998).
50. T. K. Hunt, Research on Materials Related to the Sodium Heat Engine: Final
Report, LBL-21232, Lawrence Berkeley National Laboratory, Berkeley, CA (1986).
51. H. Izawa, S. Kikkawa, and M. Kolzuml, J. Phys. Chem., 86, 5023, (1982).
52. S. Anderson, and A. D. Wadsley, Acta Crystallogr., 14, 1245, (1961).
53. R. D. Adams, R. Layland, M. Danot and C. Payen, Polyhedron, 15, 2567, (1996).
54. J. P. Shim, J. S. Lee, H. K. Kee, and S.G. Park, Synthetic Metals, 71, 2261, (1995).
55. J. Majer, M. Holzinger, and W. Sitte, Solid State Ionics, 74, 5, (1994).
56. J. Ramirez, and P. Fabry, Sensors and Actuators B, 77, 339, (2001).
57. S. Kikkawa, F. Yasuda, and M. Koizumi, Mater.Res. Bull., 20,1221, (1985).
58. S. Pal, S. D. Pandey, and P. Chand, Solid State Communications, 69(12), 1203,
(1989).
178
59. K. Byrappa, B. S. Ravi Raj, W. Rajeev, A B Kulkarni, R.R. Clemente, and S. Gali,
Indian J. Phys., 71A(2), 131, (1997).
60. M. A. Ryan, R. M. Williams, L. Lara, R. H. Cortez, M. L. Homer, V. Shields, J.
Miller, and K. S. Manatt, in Proceedings of the 33rd Intersociety Energy Conversion
Engineering Conference, 335, Colorado Springs, CO (1998).
61. B. Rodgers, www.consultrsr.com/resources/eis, [Accessed August 2006].
62. Gamry Instruments, www.gamry.com/App_Notes/Index.htm, [Accessed August 2006].
63. Impedance Spectroscopy: Theory, Experiment, and Applications, 2nd ed., E.
Barsoukov and J. R. Macdonald, Editors, John Wiley & Sons Inc., Hoboken, NJ
(2005).
64. Physical Electrochemistry Principles, Methods and Applications, I. Rubinistein,
Editor, Marcel Dekker. Inc. New York (1995).
65. Modern Aspects of Electrochemistry, J.O’M. Bockris, B.E. Conway, and E. R.
White, Editors, 32, Kluwer Academic, New York (1999).
66. C. W. Wang, A. Rakotondrainibe, J. A. Appleby, and F. E. Little, J. Electrochem.
Soc., 147(12), 4432, (2000).
67. S. J. Reed, Electron Microprobe Analysis, 2nd ed., Cambridge Press, New York
(1993).
68. M. Ohring, The Materials Science of Thin Films, Academic Press, San Diego, CA
(1992).
179
69. Handbook of Deposition Technology for Films and Coatings: Science, Technology
and Applications, 2nd ed., R. F. Bunshah, Editor, Noyes Publications, Park Ridge,
NJ (1994).
70. D. M. Mattox, Handbook of Physical Vapor Deposition (PVD) Processing, Noyes
Publications, Park Ridge, NJ (1998).
71. Scienc Projects, www.science-projects.com/Coulter/Coulter.htm, [Accessed August 2006].
72. Beckman Coulter Inc., www.beckman.com/products/pr1.asp, [Accessed August 2006].
73. GMI Inc, www.gmi-inc.com/CliniLab/Coulter%20Multisizer%203%20Counter.html,
[Accessed August 2006].
74. J. Nuyttens, http://openchemist.net/chemistry/coulter, (2004).
75. A. Lobeiras and J. Sabau, in 6th World Congress of Chemical Engineering
www.beckman.com/literature/Bioresearch/ta-104.pdf, Melbourne, Australia (2001).
76. Smithells Metal Reference Book, 7th ed., E. A., Brandes and G. B. Brook, Editors,
Butterworth-Heinemann, Oxford (1997).
77. Wikipedia, en.wikipedia.org/wiki/Vapor_pressures_of_the_elements_(data_page),
[Accessed August 2006].
78. G. Neumann, and G. M. Neumann, Surface Self Diffusion of Metals, Diffusion
Information Center, Bay Village, OH (1972).
79. N. S. Choudhury, J Electrochem. Soc., 133, 425, (1986).
80. M. Itoh, K. Kimura and Z. Kozuka, Trans. JIM, 26, 353, (1985).
81. G. M. Kale, Metall. Trans. B, 23B, 833, (1992).
82. M. Barsoum, J. Mater. Sci., 25, 4393, (1990).
180
83. R. M. Williams, C. P. Bankston, S. K. Khanna and T. Cole, J Electrochem. Soc.,
133, 2253, (1986)
84. G. Erisson, and A. D. Pelton, Metall. Trans., 24B, 795, (1993).
85. H. Yokokawa, T. Horita, N. Sakai T. Kawada, and M. Dokiya, Solid State Ionics,
78, 203, (1995).
86. Impedance Spectroscopy: Emphasizing Solid Materials and Systems, J. R.
Macdonald, Editor, John Wiley & Sons Inc., New York (1987).
87. R. M. Williams, M. E. Loveland, B. Jeffries-Nakamura, M. L. Underwood, C. P.
Bankston, H. LeDuc, and J. T. Kummer, J. Electrochem. Soc., 137, 1709, (1990).
88. D. Stauffer and A. Aharony, Introduction to Percolation Theory, 2nd ed., CRC
Press. LLC, Boca Raton, FL (1994).
89. G. Grimmett, Percolation, 2nd ed., Springer-Verlag Press, Berlin, Germany (1999).
90. P. Costamagna, M. Panizza, G. Cerisola, and A. Barbucci, Electrochimica Acta, 47,
1079, (2002).
91. S. Sunde, J. Elecrochem. Soc., 143(3), 1123, (1996).
92. P. Costamagna, P. Costa and E. Arato, Electrochimica Acta, 43, 967, (1998).
93. D. He and N. N. Ekere. J. Phys. D: Appl. Phys., 37, 1848, (2004).
94. D. Bouvard and F. F. Lange, Acta Metall.Mater., 39(12), 3083, (1991).
95. C. H. Kuo and P. K. Gupta, Acta Metall.Mater, 43(1), 397, (1995).
96. M. Suzuki and T. Oshima, Powder Technology, 35, 159, (1983).
97. C.S. Hsu and F. Mansfeld, Corrosion, 57, 747, (2001).
181
98. P. Pasierb, S. Komornicki, R. Gajerski, and S. Kozinski, J. Electroceram., 8, 57,
(2002).
99. J. R. Salgado, E. Djurado, and P. Fabry, J. Eur. Ceram. Soc, 24, 2477, (2004).
100. G. H. Li, and J. M. Hong, Mat. Res. Bull. 34, 2341, (1999).
101. C. E. Bamberger, G.M. Begun, J. Am. Ceram. Soc. 70, C-48–C-51, (1987).
102. A-L. Sauvet, S. Baliteau, C. Lopez and P. Fabry, J. Solid State Chemistry, 177,
4508, (2004).
103. C. H. Chen and K. Amine, Solid State Ionics, 144, 51, (2001).
104. C-H. Kim, S-I. Pyun, and J-H. Kim, Electrochimica Acta, 48(23), 3455, (2003).
105. W. H. Mulder, J. H. Sluyters, T. Pajkossy and I. Nyikos, J. Electroanal. Chem.,
285, 103, (1990).
106. C. A. Schiller and W. Strunz, Electrochimica Acta, 46(24-25), 3619, (2001).
107. A. J. Bard, and L. R. Faulkner, Electrochemical Methods: Fundamentals and
Applications, 2nd ed., John Wiley & Sons Inc., New York (2001).
108. NIST, webbook.nist.gov/chemistry, [Accessed August 2006].
109. NIST-JANAF Thermochemical Tables, M. W. Jr. Chase, Editor, American
Chemical Society, Woodbury, NY (1998).
110. R. D. Holmes, H. C. O’Neill, and R. J. Arculus, Geochimica et Cosmochimica
Acta, 50, 2439, (1986).
182
APPENDIX A
CALCULATION OF GIBBS FREE ENERGY
Table A.1. Thermodynamic properties of compound in the Na-Al-Ti-O system
Heat Capacity Cp=a+(b×10-3)T+(c×105)T-2+d/T1/2+(e×108)T-3 Chemical
Formular )15.298(o
f HΔkJ/mole
)15.298(oSJ/mole/K a b c d e
)1100(of GΔkJ/mole
Ref
O2 205.1 29.659 6.137 -2.196 0 108 Na(s)
(298-370K) 51.46 72.637 -9.492 -12.594 108
Na(l) (370-1170.5K) 40.257 -28.238 -0.799 108
Na(g) 107.3 153.67 5.865 108
β-Ti(s) 30.72 23.057 5.541 -0.561 108
Al (298-933K) 0 28.27 28.089 5.415 -2.774 0 108
Al (933-2790.8K) 31.751 3.936×10⁻⁸ 5.480×10⁻⁸ 108
Na2O -417.98 75.04 -267.206 109
TiO2(rutile) -944.747 50.29 -744.803 109 Continued on next page
183
Heat Capacity
Cp=a+(b×10-3)T+(c×105)T-2+d/T1/2+(e×108)T-3 Chemical Formular
)15.298(of HΔ
kJ/mole )15.298(oS
J/mole/K a b c d e
)1100(of GΔkJ/mole
Ref
γ-Al2O3(s) -1656.9 52.3 -1313.99 109
NiO(s) -140.6 110
Cu2O(s) -170.71 92.36 -88.331 109
CuO(s) -156.06 42.59 -58.542 109
Na2TiO3(s) -1586.8 123.5 198.9 -59.49 -644.3 8.505 -1223.7 84
Na2Ti2O5(s) -2539.7 173.6 272.6 -1282.7 -1.576 -1983.8 84
Na2Ti3O7(s) -3490.5 233.9 367.2 -1940.3 -1.371 -2748.2 84
Na2Ti6O13(s) -6322.9 398.6 483.0 55.45 -90.96 -4991.0 84
NaAlO2(s) -1133.19 70.4 -890.6 80
NaAl5O8(s) -4523.73 148.56 351.9 24.65 -191.84 -3542.4 80
Na2Al22O34(s) -19145.5 583.14 1451.1 90.69 -826.34 -15029.4 82
184
Calculation of Gibbs Free Energy of Formation at 1100K.
According to the thermodynamic theory, the standard Gibbs free energy of
compound formation is defined as
[ ]∑ ×−+Δ=Δ elementso
compoundoo
fof TScoeffTSTTHTG )()()()( (A.1)
where, )(TH ofΔ is the standard enthalpy of formation, and defined as
[ ][ ]
elementsoo
compoundooo
fof
HTHcoeff
HTHHTH
∑ −×−
−+Δ=Δ
)15.298()(
)15.298()()15.298()( (A.2)
)(TS o is the standard entropy and defined as
∫+=T poo dT
TC
STS298298)( (A.3)
For example, we use above three equations to calculate the standard Gibbs free
energy of formation of NaAl5O8 compound, all data listed in Table A.1.
Na(l) +5Al(l) + 4O2(g)→NaAl5O8(s)
[ ][ ] [ ][ ]
2
858585
)15.298()1100(4
)15.298()1100(5)15.298()1100(
)15.298()1100()15.298()1100(
Ooo
Aloo
Naoo
ONaAloo
ONaAlofONaAl
of
HH
HHHH
HHHH
−−
−−−−
−+Δ=Δ
∫∫
∫∫
∫∫
∫∫
−−
−+=
−−
−+Δ=Δ
1100
15.298
1100
15.298
1100
15.298
1100
15.298
1100
15.298
1100
15.298
1100
15.298
1100
15.298
2
85
2
8585
)(4)(5
)()(-4523730
)(4)(5
)()()15.298()1100(
dTTCdTTC
dTTCdTTC
dTTCdTTC
dTTCdTTCHH
OpAlp
NapONaAlp
OpAlp
NapONaAlpofONaAl
of
185
/mol-4575.62kJ
26433981526335
109174.102465.09.351-45237301100
15.298
27
85
=
×−×−−
⎟⎟⎠
⎞⎜⎜⎝
⎛ ×−++= ∫
−
dTT
TTONaAl
KmoleJ
dTT
TT
dTT
TCSS
ONaAl
ONaAl
pONaAlONaAl
//8.527
)109174.102465.09.351(56.481
)()15.298()1100(
85
858585
1100
15.298
27
1100
15.298
=
×−++=
+=
∫
∫−
οο
[ ]
molkJ
molekJmolekJ
SSSTSH
G
Oo
Alo
Nao
ONaAlo
ONaAlof
ONaAlof
/4.3542
/10)9.246*4426.76*5377.978.527(1100/62.4575
)1100(4)1100(5)1100()(1100)1100(
)1100(
3
28585
85
−=
×−−−×−−=
−−−×+Δ=
Δ
−
For some compounds, their thermodynamic data are not available. For example,
Na2O(s)+Al2O3 (s)+6TiO2(s)→Na2Al2Ti6O16(s)
Assuming Na2Al2Ti6O16 could begin to form at 1100K, so
0)1100( =Δ rxnG
06)1100(22216622 ,3,,, =Δ×−Δ−Δ−Δ=Δ o
TiOfo
OAlfo
ONafo
OTiAlNafrxn GGGGG
oTiOf
oOAlf
oONaf
oOTiAlNaf GGGG
22216622 ,3,,, 6 Δ×+Δ+Δ=Δ
molekJ
G oOTiAlNaf
/01.6050
)803.744(699.1313206.2671662,
−=
−×+−−=Δ (A.4)
186
In fact, Na2Al2Ti6O16 formation requires a higher temperature, thus 16622, OTiAlNafGΔ
calculated in equation (A.4) is the minimum Gibbs formation free energy of
Na2Al2Ti6O16.
Calculation of Gibbs Free Energy of Reaction at 1100K.
∑∑ Δ×−Δ×=Δ )tan()( tsreacGcoeffproductsGcoeffG ofr
ofp
orxn (A.5)
QRTGG orxnrxn ln+Δ=Δ (A.6)
Where Q is the reaction quotient.
For example,
2Na(g) +1/2O2(g)+ Na2Ti6O3(s)→2Na2Ti3O7(s)
kJ
GGGG ogNaf
oOTiNaf
oOTiNaf
orxn
13.537
865.52)0.4991()2.2748(2
)1100(2)1100()1100(2 )(1362732
−=
×−−−−×=
Δ×−Δ−Δ×=Δ
kJPPkJ
kJPP
kJ
QRTGG
NaO
NaO
orxnrxn
]ln2ln21[101100314.813.537
]1ln[101100314.813.537
ln
2
2
3
22/13
+×××−−=
×××+−=
+Δ=Δ
−
− (A.7)
When this reaction is at equilibrium, 0=Δ rxnG . So above equation (A.7) becomes to
]ln2ln21[101100314.813.5370
2
3NaO PP +×××−−= −
and then
187
NaO PP log40.51log2
−−=
This equation shows the relationship between the oxygen partial pressure and sodium
partial pressure at equilibrium. We calculated equilibrium oxygen partial pressure for
reactions in the Na-Al-O, Na-Ti-O, and selected metal systems and listed the results in
Table 3.2, 3.3 and 3.4 respectively.
When chemical potential diagrams of the Na-Al-O and Na-Ti-O systems are
superimposed, the stability region of NaAlO2 and Na2TiO3 are overlapped. The possible
reaction between them is listed below
2NaAlO2(s) +6Na2TiO3(s)→Na2Al2Ti6O16(s)+12Na(g)+3O2(g)
QRTGG orxnrxn ln+Δ=Δ
33
312
3,,)(,,
)ln3ln12(101100314.851.3145
)ln(
6212)1100(
2
2
2216622
−− +××+=
+
Δ−Δ−Δ+Δ=Δ=Δ
ONa
ONa
oTiONaf
oNaAlOf
ogNaf
oOTiAlNafrxnrxn
PP
PPRT
GGGGGG
)loglog4(303.23101100314.851.31452
3ONa PP +××××+= − (A.8)
If 0)1100( <Δ Grxn , it means this reaction could spontaneously occur at the experimental
conditions, otherwise, it can not. Therefore, we try to calculate the minimum GrxnΔ in
our experiment conditions. Observing equation (A.8), it is found that the minimum
GrxnΔ is obtained when sum of 2
loglog4 ONa PP + is minimum. For every value of PNa
and 2OP in the overlapped region, the )1100(GrxnΔ reaches the minimum, when the
condition is on the equilibrium line between NaAlO2 and NaAl5O8 (β″-alumina), the
188
right boundary of the overlap region. On this line, the pressure of oxygen and sodium
obeys the following equation,
NaO PP log434.44log2
−−= (A.9)
by substitution equation (A.9) into equation (A.8), we get 086.343)1100( >=Δ kJGrxn ,
this is the minimum GrxnΔ could be obtained at our experiment conditions and it is still
greater than 0. Therefore, this reaction can not spontaneously occur in our experiment.
All the reactions listed in Table 3.4 were calculated and found that none of them
would occur at our experiment conditions. So the compounds in this quaternary system
are as stable as they are in tertiary systems.
189
APPENDIX B
Table B.1. Summary of Metal/β′′-alumina Samples
SETC
NO. Components
Metal/β′′-alumina
mass ratio
Experiment
durations
28 W/β′′-alumina 3/1 9
30 W/β′′-alumina 3/1 11
36 Ni/β′′-alumina 3/1 10
37 Ni/β′′-alumina 3/1 30
49 Cu/β′′-alumina 1/1 11
52 Cu/β′′-alumina 1/1 13
49 Ni/Cu/β′′-alumina 3/3/2 11
50 Ni/Cu/β′′-alumina 3/3/2 90
49 Co/Cu/β′′-alumina 3/4/1 11
49 Co/Cu/β′′-alumina 3/3/2 11
50 Co/Cu/β′′-alumina 3/3/2 90
52 Co/Cu/β′′-alumina 3/3/2 13
190
Table B.2. Summary of Metal/Sodium Titanate Samples
SETC
NO. Components
Metal/ Sodium Titanate
mass ratio Pass
Experiment
durations
29 Cu/Sodium Titanate 1/1 20
49 Cu/Sodium Titanate 1/1 3 10
52 Cu/Sodium Titanate 1/1 4 15
49 Co/Cu/Sodium Titanate 3/3/2 3 10
51 Co/Cu/Sodium Titanate 3/3/2 4 15
52 Co/Cu/Sodium Titanate 3/3/2 5 15
49 Co/Cu/Sodium Titanate 3/4/1 3 10
50 Co/Cu/Sodium Titanate 3/4/1 3 90
49 Co/Cu/ Sodium Titanate 3/2/1 3 10
50 Co/Cu/Sodium Titanate 3/2/1 3 90
51 Co/Cu/Sodium Titanate 3/2/1 4 15
54 Ni/Cu/Sodium Titanate 3/3/2 4 30
55 Ni/Cu/Sodium Titanate 3/3/2 4 60
55 Ni/Cu/Sodium Titanate 3/3/3 3 60
55 Ni/Cu/ Sodium Titanate 3/3/3 4 60
191
Table B.3. Summary of Ni/Sodium Titanate Samples SETC
NO. Name
Ni/Sodium Titanate
mass ratio Pass Particle Size
Experiment
durations
36 N4 4/1 5
37 N4 4/1 30
57 S3NT 4/1 3 3-7 μmNi 65
58 NT12 4/1 6 5-15μmNi 55
58 NT15 4/1 9 5-15μmNi 55
69 R55 4/1 3 July 23 mixture 12
69 R56 4/1 3 July 23 mixture 12
71 R65 4/1 3 2-3μmNi 18
71 R63 4/1 10 2-3μmNi 18
71 R69 4/1 10 3-7μmNi 18
72 R64 4/1 3 5-15μmNi 52
72 R68 4/1 3 3-7μmNi 52
72 R60 4/1 4 2-3μmNi 55
72 R66 4/1 10 2-3μmNi 55
73 R79 4/1 3 2-3μmNi 97
73 R74 4/1 5 July 23 mixture 97
73 R78 4/1 8 5-15μmNi 97
74 R76 4/1 2 2-3μmNi 97
74 R75A 4/1 8 July 23 mixture 97
74 R75B 4/1 10 July 23 mixture 97
75 R81 4/1 3 2-3μmNi 49
75 R83 4/1 3 2-3μmNi 49
75 R87 4/1 3 July 23 mixture 49
75 R84 4/1 5 2-3μmNi 49
76 R82 4/1 3 2-3μmNi 50
76 R88 4/1 3 July 23 mixture 50
76 R90 4/1 4 July 23 mixture 50
Continued on next page
192
SETC
NO. Name
Ni/Sodium titanate
Ratio(mass%) Pass Particle Size
Experiment
durations
34 N3 3/1 2 60
36 N3 3/1 5
37 N3 3/1 30
39 N3 3/1 3 6
39 N4 3/1 4 6
58 L3NT 3/1 3 5-15umNi 3
58 L5NT 3/1 5 5-15umNi 5
31 N2 2/1 5
32 N4 2/1 4 12
32 N6 2/1 6 12
33 N 2/1 13
34 N22 2/1 2 45
July 23 mixture: 135g Ni (<1μm)+265g Ni(2-3μm)+100g sodium titanate (milled over 6 days).
193
VITA
Yuyan Guo was born in Taiyuan, ShanXi province of P.R. China on August 15,
1976. She received her B.S. in metallurgical engineering with honors in 1997 and an
M.S. in materials science & engineering in 2000 from the University of Science &
Technology, Beijing (Beijing, China). Her Ph.D. work was performed under the
guidance of Dr. Michael Schuller and Dr. Timothy R. Hughbanks in the chemistry
department at Texas A&M University (College Station, Texas, USA) and was completed
in December of 2006. Her permanent address is the following:
Beijing Tongzhou District Xinhualian Jinyuan, #20 Building, Apt #151
Beijing, 101101
P. R. China.