+ All Categories
Home > Documents > Mixed-methods evaluation of a nurse-pharmacist managed ... · Mixed-methods evaluation of a...

Mixed-methods evaluation of a nurse-pharmacist managed ... · Mixed-methods evaluation of a...

Date post: 06-Jul-2018
Category:
Upload: ngoquynh
View: 212 times
Download: 0 times
Share this document with a friend
323
Mixed-methods evaluation of a nurse-pharmacist managed pain clinic Muhammad Abdul Hadi Submitted in accordance with the requirements for the degree of Doctor of Philosophy The University of Leeds School of Healthcare March 2014
Transcript

Mixed-methods evaluation of a nurse-pharmacist managed

pain clinic

Muhammad Abdul Hadi

Submitted in accordance with the requirements for the degree of

Doctor of Philosophy

The University of Leeds

School of Healthcare

March 2014

- ii -

The candidate confirms that the work submitted is his own, except where work

which has formed part of jointly-authored publications has been included. The

contribution of the candidate and the other authors to this work has been

explicitly indicated below. The candidate confirms that appropriate credit has

been given within the thesis where reference has been made to the work of

others. To date, the following papers have been published.

Peer-reviewed publications

HADI, M.A., ALLDRED, D.P., BRIGGS, M., MUNYOMBWE, T.,CLOSS,

S.J. 2014. Effectiveness of pharmacist-led medication review in chronic

pain management: Systematic Review and Meta-Analysis. The Clinical

Journal of Pain DOI: 10.1097/AJP.0000000000000063

HADI, M.A., ALLDRED, D.P., BRIGGS, M., CLOSS, S.J. 2014. Mixed-

methods research in Pharmacy Practice: Recommendations for quality

reporting (Part 2). International Journal of Pharmacy Practice, 22, 96-100

HADI, M.A., ALLDRED, D.P., BRIGGS, M., MARCZEWSKI, K., CLOSS,

S.J. 2013. Mixed-methods evaluation of nurse-pharmacist managed pain

clinic: Design, rationale and limitations. Canadian Pharmacists Journal,

46,1-5.

HADI, M.A., ALLDRED, D.P., BRIGGS, M., CLOSS, S.J. 2013. Mixed-

methods research in pharmacy practice: Basics and beyond (Part 1).

International Journal of Pharmacy Practice, 21,341-345

HADI, M.A., ALLDRED, D.P., BRIGGS, M., CLOSS, S.J. 2012.

Effectiveness of pharmacist-led medication reviews in improving patient

outcomes in chronic pain: A Systematic review protocol. Canadian

Pharmacists Journal, 145, 264-267

HADI, M.A., ALLDRED, D.P., BRIGGS, M., CLOSS, S.J. 2012. A

combined nurse-pharmacist led pain clinic: joint venture of public-private

sector. International Journal of Clinical Pharmacy, 34; 1-3

- iii -

Conference abstracts

HADI, M.A., ALLDRED, D.P., BRIGGS, M., Marczewski, K., CLOSS, S.J.

2014. Clinical and sociodemographic characteristics of patients referred

to a community-based pain clinic. The British Pain Society’s Annual

Scientific Meeting; April 29- May 1; Manchester Central, Manchester,

United Kingdom [Accepted]

HADI, M.A., ALLDRED, D.P., BRIGGS, M., Marczewski, K., CLOSS, S.J.

2014. An analysis of the nature of recommendations made at a nurse-

pharmacist managed pain clinic. Health Services Research and

Pharmacy Practice Conference; April 3-4; University of Aberdeen,

Aberdeen, United Kingdom [Accepted]

HADI, M.A., ALLDRED, D.P., BRIGGS, M., CLOSS, S.J. 2013.

Systematic review of pharmacist-led medication review in chronic pain

management: Preliminary findings. Health Services Research and

Pharmacy Practice Conference; May 9-10; University of Central

Lancashire, Preston, United Kingdom

Other publications

HADI, M.A., ALLDRED, D.P., BRIGGS, M., CLOSS, S.J. 2012. A model

for a pain management clinic led by the combined efforts of a pharmacist

and a nurse. The Translator, 6, 3.

HADI, M.A., ALLDRED, D.P., BRIGGS, M., CLOSS, S.J. 2012. Is

pharmacist-led medication review effective for chronic pain management

among adult patients? A systematic review.

PROSPERO:CRD42012001957. Available from

http://www.crd.york.ac.uk/PROSPERO/full_doc.asp?ID=CRD420120019

57

The author of this thesis was the first and corresponding author for all the

publications. He drafted the papers, revised as per supervisors’ feedback,

formatted according to the journal style, submitted to the respective journals,

and answered the quires raised by the editorial office, reviewers and the

production office.

- iv -

This copy has been supplied on the understanding that it is copyright material

and that no quotation from the thesis may be published without proper

acknowledgement.

The right of Muhammad Abdul Hadi to be identified as Author of this work has

been asserted by him in accordance with the Copyright, Designs and Patents

Act 1988.

© 2014 The University of Leeds and Muhammad Abdul Hadi

- v -

Acknowledgements

First and foremost, I would like to thank ALLAH ALMIGHTY for blessing me with

health and wisdom, without which none of this would have been possible.

I do not have words to thank my supervisors Prof. José Closs, Prof.

Michelle Briggs and Dr. David Alldred for their encouragement, help, guidance

and immense support throughout these years. It was a great learning

experience which I enjoyed a lot. I also received excellent support from Kathryn

Marczewski, Clinical Nurse Specialist at the pain clinic – thanks Kath for

everything. I am also thankful to Dr. David Clarke, then the postgraduate

research tutor of the School of Healthcare, for encouraging me to apply for the

scholarship and School of Healthcare for awarding me with the scholarship. I

would also like to thank all the staff members at the School’s research and

innovation office especially Ruth Allcroft and Helen Simpson for providing

excellent logistical support.

I am grateful to my parents Dr. Jawed Batish and Samina Firdous for all

the sacrifices that they made so that we get the best. You guys are indeed the

greatest blessing of ALLAH and a source of inspiration. I would like to thank my

better half, Saleha Mazhar, for her kind understanding, support and most

importantly accepting my lack of concentration during our conversations. I hope

that it will get better once I am done with my PhD. Thank you very much for

hanging in there. My daughters, my two little angels, Ayma and Zahra - seeing

you has been a source of happiness and relief. I would like to thank my brother

Muhammad Saadi and my sister Sundas Muddasar for their moral support. I am

also grateful to my friends Long Chiau Ming, Jaqui Long, Rebecca Dickinson,

Alexia Burton, Mohammad, Tahir Khan and Emily for their friendship and

support.

Last but not least, I would like to express my gratitude to all the patients who

participated in this study.

- vi -

Abstract

Background: Under-treatment of chronic pain within the community is a global

problem. There is a growing interest to evaluate the role of nurses and

pharmacists in chronic pain management with an aim to improve access to and

quality of pain services.

Aim: The research presented in this thesis had two aims: first, to evaluate the

effectiveness of pharmacist-led medication review in chronic pain management;

second, to evaluate the impact of a community based nurse-pharmacist

managed pain clinic.

Methods: A systematic review and meta-analysis was conducted to evaluate

the effectiveness of pharmacist-led medication review in chronic pain

management. For the second aim, a mixed-methods study consisting of a

quasi-experimental design and a qualitative descriptive design was undertaken.

Pain intensity was the primary outcome. The secondary outcomes included:

physical functioning; emotional functioning; quality of life; chronic pain grade

and patient satisfaction. Patient satisfaction was evaluated using face-to-face,

semi-structured qualitative interviews.

Results: Of the 578 papers screened, five RCTs were included in the

systematic review and three in the meta-analysis. Compared to the control, the

meta-analysis found that patients in the intervention group had: a statistically

significant reduction in pain intensity of 0.8 point (95% CI -1.28 to -0.36) and

0.7 point (95% CI -1.19 to -0.20) at 3-months and 6-months respectively; and

4.84 point (95% CI, -7.38 to -2.29) at 3-months and -3.82 point (95% CI, -6.49

to -1.14) at 6-months improvement in physical functioning.

Seventy nine patients with a mean age of 46.5 years (SD ±14.4) took part in

the quasi-experimental study. Thirty-six and 9 patients completed discharge and

3-month follow-up assessments respectively. Compared to baseline, statistically

significant reductions were noted for two of the four outcome measures: pain

intensity (P=0.02), and interference of pain with physical functioning (P=0.02)

on discharge from the service. The majority of the patients were, in general,

satisfied with the service. Four contributing factors to patient satisfaction were

- vii -

identified: ample consultation time; in-depth specialised knowledge; listening

and understanding to patients’ needs; and a holistic approach.

Conclusion: Community-based pain clinics managed by a nurse and

pharmacist have the potential to improve chronic pain management in the

community by providing timely access to a specialised pain service, ensuring

safe and effective use of analgesics (medication reviews) and promoting self-

management (patient education). Both pharmacist-led medication review and

nurse-pharmacist managed pain clinics can reduce pain intensity and improve

physical functioning The long term impact of the pain clinic could not be fully

elucidated from this research as the planned follow-up data collection could not

be completed due to decommissioning of the service.

- viii -

Table of Contents

Acknowledgements ......................................................................................... v

Abstract ........................................................................................................... vi

Table of Contents .......................................................................................... viii

List of Tables ................................................................................................. xiii

List of Figures ............................................................................................... xiv

List of Appendicies ........................................................................................ xv

List of Abbreviations .................................................................................... xvi

CHAPTER 1

INTRODUCTION ....................................................................................... 2

1.0 Background ......................................................................................... 3

1.1 About the author and his PhD journey ................................................. 7

1.1.1 Author’s research paradigm: Pragmatism ................................. 8

1.2 Structure of the thesis and writing style.............................................. 10

CHAPTER 2

LITERATURE REVIEW ........................................................................... 14

2.1 Introduction ........................................................................................ 14

2.2 Literature search ................................................................................ 16

2.3 Prevalence of chronic pain ................................................................. 17

2.4 Economic and societal burden of chronic pain ................................... 18

2.5 Management of chronic pain .............................................................. 20

2.5.1 Barriers to effective chronic pain management ....................... 22

2.5.2 Chronic pain management: The UK perspective .................... 24

2.6 The role of pharmacists in chronic pain management ........................ 25

2.6.1 Descriptive observational studies ........................................... 27

2.6.2 Randomised controlled trials (RCTs) ...................................... 30

2.6.3 Systematic reviews ................................................................. 32

2.7 Role of nurses in chronic pain management ...................................... 33

2.7.1 Randomised controlled trials .................................................. 35

2.7.2 Systematic reviews ................................................................. 40

2.8 Combined nurse-pharmacist managed pain clinics ............................ 43

2.8.1 The nurse-pharmacist managed pain clinic (NPMPC) ............ 45

2.8.2 Research evidence ................................................................. 47

2.9 Aims and objectives ........................................................................... 48

- ix -

CHAPTER 3

EFFECTIVENESS OF PHARMACIST- LED MEDICATION REVIEW

IN CHRONIC PAIN MANAGEMENT: SYSTEMATIC REVIEW AND

META-ANALYSIS ................................................................................... 51

3.1 Introduction ....................................................................................... 51

3.2 Systematic review: An overview ......................................................... 51

3.2.1 Systematic reviews in evidence-based medicine .................... 54

3.1.3 The review protocol: Rationale and importance ...................... 55

3.2 Rationale for the review ..................................................................... 56

3.2.1 Aim and objectives ................................................................. 58

3.3 Methods ............................................................................................. 58

3.3.1 Study selection ....................................................................... 58

3.3.2 Types of participants .............................................................. 60

3.3.3 Outcome measures ................................................................ 60

3.3.4 Assessment of risk of bias ...................................................... 60

3.3.5 Data extraction ....................................................................... 61

3.3.6 Data synthesis ........................................................................ 61

3.4 Results ............................................................................................... 64

3.4.1 Study characteristics .............................................................. 64

3.4.2 Nature and delivery of intervention ......................................... 67

3.4.3 Risk of bias ............................................................................. 72

3.4.4 Outcomes assessment ........................................................... 76

3.4.4.1 Pain intensity ............................................................... 76

3.4.4.2 Physical functioning..................................................... 78

3.4.4.3 Patient satisfaction ...................................................... 80

3.4.4.4 Quality of life ............................................................... 81

3.4.4.5 Adverse effects ........................................................... 82

3.5 Discussion ......................................................................................... 87

3.5.1 Main results ............................................................................ 87

3.5.2 Implications for pharmacy practice and policy ........................ 92

3.5.3 Implications for future research .............................................. 94

3.6 Limitations.......................................................................................... 96

3.7 Conclusion ......................................................................................... 97

CHAPTER 4

METHODOLOGY .................................................................................. 100

4.1 Introduction ...................................................................................... 100

4.2 Research methodology .................................................................... 101

- x -

4.2.1 Qualitative research methodology ........................................ 101

4.2.2 Quantitative research methodology ...................................... 105

4.2.3 Mixed-methods research methodology ................................. 107

4.2.3.1 Typologies of mixed-methods research ..................... 108

4.3 Rationale for choosing mixed-methods design ................................ 110

4.4 Rationale for choosing embedded design ........................................ 113

4.4.1 Rationale for choosing quasi-experimental design ............... 115

4.4.2 Rationale for choosing qualitative description ....................... 118

CHAPTER 5

METHODS ............................................................................................. 122

5.1 Introduction ...................................................................................... 122

5.2 Research ethics and governance approval ...................................... 123

5.2.1 Informed consent .................................................................. 124

5.2.2 Right of withdrawal ............................................................... 125

5.2.3 Confidentiality and data protection........................................ 125

5.3 Quasi-experimental study ................................................................ 126

5.3.1 Patient recruitment ............................................................... 126

5.3.1.1 Inclusion criteria ........................................................ 127

5.3.1.2 Exclusion criteria ....................................................... 127

5.3.2 Sampling .............................................................................. 127

5.3.3 Sample size .......................................................................... 129

5.3.4 Data collection ...................................................................... 131

5.3.4 Outcome measures .............................................................. 133

5.3.4.1 Sociodemographic and clinical data .................................. 135

5.3.4.2 Pain intensity ............................................................. 135

5.3.4.3 Physical functioning................................................... 136

5.3.4.4 Emotional functioning ................................................ 138

5.3.4.5 Quality of life ............................................................. 140

5.3.4.6 Chronic Pain Grade questionnaire (CPG) ................. 142

5.4 Data analysis................................................................... 143

5.5 Descriptive qualitative study ............................................................ 144

5.5.1 Selection of patients ............................................................. 145

5.5.1.1 Inclusion criteria ........................................................ 145

5.5.1.2 Exclusion criteria ....................................................... 145

5.5.2 Sampling .............................................................................. 146

5.5.3 Sample size .......................................................................... 150

- xi -

5.5.4 Interviews ............................................................................. 151

5.5.5 Data management ................................................................ 154

5.5.6 Data analysis ........................................................................ 155

CHAPTER 6

RESULTS OF QUANTITATIVE PHASE ............................................... 163

6.1 Introduction ...................................................................................... 164

6.2 Sociodemographic characteristics of the patients ............................ 165

6.2 History of chronic pain and other medical problems ......................... 167

6.3 Outcome measures.......................................................................... 171

6.3.1 Pain intensity ........................................................................ 171

6.3.2 Physical functioning .............................................................. 173

6.3.3 Anxiety and Depression ........................................................ 176

6.3.4 Chronic pain grade ............................................................... 179

6.3.5 Quality of life ......................................................................... 180

6.4 Nature of intervention ....................................................................... 184

6.5 Summary of key findings .................................................................. 187

CHAPTER 7

FINDINGS OF THE QUALITATIVE PHASE .......................................... 190

7.1 Introduction ...................................................................................... 190

7.3 Key themes ...................................................................................... 192

7.3.1 Impact on life ........................................................................ 192

7.3.1.1 Interference with physical functioning ........................ 193

7.3.1.2 Interference with employment ................................... 194

7.3.1.3 Interference with family life ........................................ 195

7.3.1.4 Interference with social life ........................................ 197

7.3.1.5 Interference with sleep .............................................. 199

7.3.1.6 Interference with mood .............................................. 199

7.3.1.7 Theme summary ....................................................... 201

7.3.2 Barriers to effective pain care ............................................... 202

7.3.2.1 Healthcare professional-related barriers .................... 203

7.3.2.3 Theme summary ....................................................... 214

7.3.3 Experiences at the nurse-pharmacist managed pain clinic ... 215

7.3.3.1 Satisfaction with the service ...................................... 217

7.3.3.2 Issues with the pain clinic .......................................... 222

7.3.3.3 Theme summary ....................................................... 223

- xii -

CHAPTER 8

DISCUSSION ........................................................................................ 225

8.1 Introduction ...................................................................................... 226

8.2 Discussion ....................................................................................... 227

8.2.1. Learning experience during PhD: A reflective account ....... 227

8.2.2 A word on methodology ........................................................ 227

8.2.3 Sociodemographic and clinical characteristics of the

patients ................................................................................. 228

8.2.4 Outcomes assessment ......................................................... 231

8.2.5 Barriers to effective pain management ................................. 233

8.2.5.1 Patient satisfaction with service ................................. 237

8.3 Key findings from the three sections of the thesis: Patients’

views and outcomes ...................................................................... 238

8.4 Conclusion ....................................................................................... 239

8.5 Limitations........................................................................................ 241

8.6 Recommendations for future research ............................................. 244

8.7 Recommendations for policy and practice ....................................... 245

8.8 Dissemination plan .......................................................................... 246

References .................................................................................................... 248

Appendices ................................................................................................... 268

- xiii -

List of Tables

Table 3.1. Characteristics of included studies .................................................. 70

Table 5.2. Example of coding ......................................................................... 158

Table 6.1. Sociodemographics of patients ..................................................... 166

Table 6.3. Comparison of pain intensity scores at the baseline and

discharge ............................................................................................... 172

Table 6.4. Comparison of pain interference with physical functioning at

baseline and discharge .......................................................................... 175

Table 6.5. Categorization of patients based on HADS-A scores at the

baseline and discharge .......................................................................... 177

Table 6.6. Categorization of patients based on HADS-D scores at the

baseline and discharge .......................................................................... 178

Table 6.7 Comparison of chronic pain grade at the baseline and discharge .. 180

Table 6.8. Comparison of quality of life at baseline and discharge ................. 182

Table 6.9. Care process at the pain clinic ...................................................... 185

Table 7.1. Sociodemographic characteristics of participants .......................... 191

Table 8.1. Key findings from the three sections of the thesis ......................... 238

Table 8.1. Dissemination plan ........................................................................ 247

- xiv -

List of Figures

Figure 3.1. Basic steps in conducting a systematic review ............................... 54

Figure 3.2. Work flow of this systematic review ................................................ 63

Figure 3.3. PRISMA flow diagram .................................................................... 66

Figure 3.4. Risk of bias in included trials across each domain ......................... 73

Figure 3.5. Risk of bias across individual trials ................................................. 75

Figure 3.6. Meta-analysis of pain intensity at 3-month and 6-month ................ 84

Figure 3.7. Meta-analysis of physical functioning at 3-month and 6-month ...... 85

Figure 3.8. Meta-analysis of patient satisfaction at 3-month ............................. 86

Figure 5.1. The research process ................................................................. 134

Figure 5.2. Framework of maximum variation sampling ................................. 149

Figure 6.1. Stratification of patients in various age groups ............................. 165

Figure 6.2. Stratification of patients based on pain duration in years ............. 168

Figure 6.3. Chronic pain sites in patients referred to the pain clinic ................ 169

Figure 6.4. Source of referral to the pain clinic ............................................... 169

Figure 6.5. Stratification of patients based on clinically important changes

in average pain intensity ........................................................................ 173

Figure 6.6. Stratification of patients based on clinically important changes

in overall pain interference with daily activities ...................................... 176

Figure 6.8. Comparison of QoL at the baseline and discharge. ...................... 181

Figure 6.9. Number of pharmacological recommendations made at the

pain clinic ............................................................................................... 186

Figure 7.1. Sub-themes within the impact on life theme ................................. 193

Figure 7.2. Sub-themes within barriers to effective pain care theme .............. 202

Figure 7.3. Sub-themes within experiences at the pain clinic theme .............. 216

- xv -

List of Appendicies

Appendix I. Search strategy for Medline…………………………………………269

Appendix II. Risk of bias assessment form………………………………….…...270

Appendix III. Letter of invitation to participate in the study……........……….....271

Appendix IV. Invitation to take part in a follow-up assessment........................272

Appendix V. GP information sheet...................................................................273

Appendix VI. Patient information sheet............................................................274

Appendix VII. Patient information sheet - Phase 2 ..........................................278

Appendix VIII. Patient consent form - Phase 1................................................282

Appendix IX. Patient consent form - Phase 2..................................................283

Appendix X. Patient sociodemographic and clinical questionnaire…………...284

Appendix XI. Clinical data collection form (Baseline).......................................285

Appendix XII. Clinical data collection form (Discharge)...................................286

Appendix XIII. Ethical approval........................................................................287

Appendix XIV. NHS research governance approval........................................290

Appendix XV. Letter of access for research....................................................292

Appendix XVI. NHS ethics approval – Substantial amendment.......................294

Appendix XVII. Brief Pain Inventory (BPI)........................................................296

Appendix XVIII. Hospital Anxiety and Depression Scale (HADS) ....................298

Appendix XIX. SF-36......................................................................................299

Appendix XX. Chronic Pain Grade questionnaire............................................305

Appendix XXI. Topic guide for qualitative interviews.......................................306

- xvi -

List of Abbreviations

BPI Brief pain inventory

BP Bodily pain

BPS The British Pain Society

CBT Cognitive behavioural therapy

CMO Chief Medical Officer

DRP Drug related problem

GP General practitioner

GH General health

HADS Hospital anxiety and depression scale

HCP Healthcare professional

HRQoL Health related quality of life

IASP International Association for the Study of Pain

IRAS Integrated research application system

IMMPACT Initiative on methods, measurement, and pain assessment

in clinical trials

MH Mental health

MRC Medical research council

NRES National research ethics service

NRS Numerical rating scale

NHS National health services

NPMPC Nurse-pharmacist managed pain clinic

OGSR Office of grants and scholarly research

PCT Primary care trust

PF Physical functioning

RP Physical role

- xvii -

QoL Quality of life

QM Quality Metric Incorporated

R&D Research and development

RP Role-Physical

RCT Randomised controlled trial

SF-36 Short- form 36

TTM Transtheoretical model

VT Vitality

1

CHAPTER 1

INTRODUCTION

2

CHAPTER 1

INTRODUCTION

This thesis presents research work carried out for the author’s PhD degree

undertaken at the School of Healthcare, University of Leeds, Leeds, UK. The

School of Healthcare’s Pain research group and, partly by, the Medicines

Management research group, supported the author for his PhD degree to

specifically build on the former group’s earlier work on an innovative community-

based, nurse-pharmacist managed pain service. Therefore, the focus of the

studentship and subsequent research study was to develop further evidence on

the effectiveness of the nurse-pharmacist managed pain clinic.

This introductory chapter provides a brief overview of the prevalence and

socioeconomic burden of chronic pain, the challenges in relation to its

management, and the role of pharmacists and nurses in chronic pain

management. Following this is a description of the research paradigm/world

view which guided this research. A brief account of the author’s journey through

his PhD is then described and finally, a summary of the contents of each

chapter is provided.

3

1.0 Background

Being a subjective and personal experience, pain is a difficult phenomenon to

define and measure. The International Association for Study of Pain (IASP) has

defined pain as “an unpleasant sensory and emotional experience associated

with actual or potential tissue damage, or described in terms of such damage”

(IASP subcommittee on Taxonomy, 1979). Chronic pain has been defined as

continuous, long-term pain of more than 12 weeks (3-months) or after the time

that healing would have been thought to have occurred in pain after trauma or

surgery (The British Pain Society, 2006). The 3-month cut off to differentiate

chronic pain from acute is not universal and a 6-month cut-off has also been

used (Merskey and Bogduk, 1994, Breivik et al., 2006). Furthermore, defining

chronic pain solely by duration has also been challenged, as ‘duration’ solely

neither reflects the multi-dimensional nature of chronic pain nor indicates

whether or not long-term pain is clinically significant (Turk and Rudy, 1988, Turk

and Melzack, 2001). Nonetheless, to date, duration-based definitions, although

questionable, are frequently used to describe chronic pain in both research and

clinical practice settings. Chronic pain is broadly categorised into two types:

nociceptive pain and neuropathic pain. Nociceptive pain is caused by damage

to body tissue and usually described as a sharp, aching, or throbbing pain.

Neuropathic pain results when there is actual nerve disease or damage and is

often described as spontaneous burning pain (IASP subcommittee on

Taxonomy, 1986, Merskey and Bogduk, 1994).

The growing prevalence of chronic pain presents a significant threat to

public health globally. Worldwide, the point prevalence estimates derived from

population-based studies vary considerably, ranging from 2% to over 55%

4

(Verhaak et al., 1998, Elliott et al., 1999, Blyth et al., 2001, Catala´ et al., 2002,

Moulin et al., 2002, Eriksen et al., 2003, Breivik et al., 2006, Neville et al., 2008).

This wide variation in the prevalence of chronic pain is principally attributed to

the differences in the definitions of chronic pain used, types of populations

studied, and the survey methodology used (Johannes et al., 2010). In the USA,

a recent internet-based survey estimated weighted point prevalence of chronic

pain to be 30.7% (95% CI, 29.8–31.7) with a higher prevalence among females

(34.3%) than males (27.4%) (Johannes et al., 2010). In Europe, a survey

reported that chronic pain affected 19% of adults (Breivik et al., 2006). In the

UK, it has been estimated that five million people develop chronic pain each

year (Chief Medical Officer for England, 2008). Estimation of chronic pain

burden in the community is essential so that necessary healthcare and social

services can be developed to effectively manage the problem.

Chronic pain often interferes with daily activities and is associated with

loss of productivity, work absenteeism, carer burden and high utilisation of

healthcare resources (Steenstra et al., 2005, Breivik et al., 2006). It was

estimated that lost productive work due to arthritis cost the US economy US$

7.1 billion (£4.3 billion) during 2003-04 (Ricci et al., 2005). In the UK, the indirect

cost of back pain alone was estimated to be more than £10 billion (Mainiadakis

and Gray, 2000). Furthermore, chronic pain is the second most common reason

for claiming incapacity benefit in the UK (Chief Medical Officer for England,

2008). In terms of burden on healthcare systems, chronic pain accounted for 4.6

million appointments per year within primary care in the UK at a cost of around

£69 million on appointments alone. In 2007, the National Health Services (NHS)

in England spent £584 million on 67 million prescriptions for analgesic and anti-

inflammatory drugs (Chief Medical Officer for England, 2008).

5

Given these negative consequences of chronic pain both on individuals

and society, timely and effective management of chronic pain is crucial. Chronic

pain is primarily managed within primary care. However, suboptimal and

inadequate management of chronic pain within primary care has been reported

in the literature (Breivik et al., 2006, McDermott et al., 2006). Barriers to

effective pain relief are multifactorial and include: clinician related-barriers;

patient related-barriers and healthcare system-related barriers (Glajchen, 2001).

Clinician-related barriers include: inadequate knowledge and assessment skills,

negative attitudes toward prescribing of opioid analgesics, and fear of regulatory

scrutiny for prescribing controlled substances (Von Roenn et al., 1993,

Cleeland, 1993, Glajchen, 2001). Patient related-barriers include:

communication problems, psychological issues such as anxiety, depression and

anger, and other issues such as non-compliance with the prescribed medication

and fear of addiction, tolerance and side effects (Ward et al., 1993, Glajchen,

2001). Healthcare system related-barriers include: inaccessibility and

unaffordability of multidisciplinary pain clinics, lack of neighbourhood

pharmacies, non-availability of high doses of opioids at the pharmacy (not

relevant in the UK), and long waiting times for appointments in secondary care

(Glajchen, 2001). These multifactorial problems make chronic pain

management challenging.

In terms of chronic pain management in the UK, the CMO’s annual report

of 2008 was the first government document that highlighted the issues of

inadequate pain management in primary care and the lack of clear clinical

standards for chronic pain management, and called for immediate action to

address these issues (Chief Medical Officer for England, 2008). The report also

directed the relevant agencies to improve the quality of local pain services.

6

Subsequent to the CMO’s report, the National Pain Audit was conducted to

assess the nature and quality of, and access to chronic pain services in the UK.

The audit also found a “clear variation in provision of service and no agreed

standards of care” (Price et al., 2012, P. 5).Additionally, the audit also found

that a number of services were not even meeting the minimum requirement for

an effective pain service set by the International Association for the Study of

Pain (IASP) and the Faculty of Pain Medicine of the Royal College of

Anaesthetics (Price et al., 2012), indicating a considerable room for

improvement in the delivery of chronic pain services.

Within the NHS, there has been a desire to shift the focus of care from

hospitals to the community to reduce the burden on secondary care and to

improve timely access to care. To accomplish this and to meet patients’ growing

expectations, given the economic constraints, the roles of nurses and

pharmacists within the healthcare system has evolved and become more

patient centred, leading to the development of a number of nurse-led and

pharmacist-led services. These reforms began in 2000 when the Department of

Health (DoH) published health services plan for the NHS incorporating a

proposal to extend nurses’ role within the NHS (Department of Health, 2000).

In the context of chronic pain management, there is a growing interest

among researchers to evaluate these nurse and/or pharmacist managed

services as chronic pain is often inadequately managed in primary care. The

research work conducted and presented in this thesis is a small step towards

improving chronic pain management in community. Firstly, a systematic review

evaluating the effectiveness of pharmacist-led medication review in chronic pain

management is presented (Chapter 3). Secondly, the effectiveness of a

community based nurse-pharmacist managed pain clinic, one of the initiatives of

7

the local primary care trust (PCT) to improve access to quality pain service,

reduce burden on secondary care and waiting times, is evaluated. The specific

aims and objectives are outlined in section 2.9. A brief historical overview of the

development of the clinic and its working is outlined in the next chapter (section

2.8.1).

1.1 About the author and his PhD journey

Like most of the children born in Pakistan, I was raised to become a medical

doctor. To fulfil my father’s dream, who is a physician himself, I worked hard but

was unable to secure admission in a medical college. Subsequently, I joined a

pharmacy school at a local university in 2002. On the first day of my university, I

made a promise to my father that I would complete a PhD to fulfil his dream. At

that time, I had no idea what a PhD was except that it would enable me to write

“Dr” before my name. That is how I initially acquired the idea and motivation of

doing a PhD.

My first experience with ‘research’ was during my Master’s degree

(Clinical Pharmacy) in Malaysia. It was short but an exciting experience which

gave me a glimpse of future PhD research. Subsequently, I developed an

interest in research and my motivation for doing a PhD also grew beyond

merely adding the “Dr” title before my name. After completing master’s degree, I

started looking for a PhD scholarship whilst working as a lecturer in Clinical

Pharmacy at a public university in Malaysia. Subsequently, I was awarded a

PhD scholarship by the School of Healthcare, University of Leeds. I chose this

project, a mixed-methods evaluation of a nurse-pharmacist managed pain clinic,

for two main reasons: 1) In the past, I was predominantly a quantitative

researcher with very limited experience of qualitative research, therefore, I saw

8

this project as a training opportunity to develop in-depth understanding of

qualitative, quantitative and mixed-methods methodologies and gain some

hands on experience in using different methodologies; 2) The project had

elements of both pharmacy practice research and health services research, my

areas of interest.

Over all, I enjoyed and learnt a lot during my PhD. But there were some

hard and long days as well. From applying for the scholarship to developing the

protocol, to submitting the applications for ethics and research governance

approval, to recruiting patients, to undertaking the qualitative and the

quantitative analysis, and to finally writing up thesis, it was a series of

challenges one after another. However, I received excellent support from family

and supervisors, which helped me to overcome these challenges. Publication of

my work in peer-reviewed journals gave me motivation and pushed me forward.

Ultimately, during the third year of PhD I was successful in applying for a

lecturer in pharmacy practice position in a reputable university. However,

moving countries with my family and starting a new job in the middle of thesis

write up was very challenging. Again support from family and supervisors

enabled me to overcome these challenges and complete my write-up.

1.1.1 Author’s research paradigm: Pragmatism

Being a practice researcher rather than a philosopher, this was the most difficult

and challenging part of the thesis perhaps due to author’s limited knowledge of

the subject area. The aim of this section was not to start a philosophical debate

to prove the superiority of one paradigm over another, rather the purpose of

including this section in the introduction chapter is to make the author’s stance

(philosophical assumptions) clear from the outset, enabling the reader to

meaningfully understand the research work detailed in the later chapters.

9

“A paradigm is a basic set of beliefs that guide action” (Guba, 1990, P. 17).

It is also known as philosophical assumptions, epistemologies and ontologies

(Crotty, 1998), broadly conceived research methodologies and alternative

knowledge claims (Creswell, 2003). There are various research paradigms,

descriptions of which are beyond the scope of this thesis. Among the most

commonly used paradigms are (Creswell, 2007): Positivism - claims of

knowledge are based on cause and effect thinking and reductionism, often

associated with quantitative approaches (Phillips and Burbules, 2000);

Constructivism - individuals seek understanding of the world in which they live

and work; Advocacy/participatory – which states that the research should have

an action agenda to help people involved in the research study (study

participants) (Kemmis and Wilkinson, 1998); and Pragmatism - focuses on the

outcomes of the research and chooses methods on the principle of “what-

works”. The key features of pragmatism are as follows (Creswell, 2007):

Pragmatism is not associated with any specific system of philosophy and

reality.

Researchers using pragmatism as their research paradigm are free to

choose the methods and procedures that are most suitable in answering

the research question.

Pragmatic researchers can use multiple methods of data collection and

analysis within a research study, if deemed necessary.

Pragmatist researcher believes that the research is not free from social,

political and historical contexts.

In this thesis, the author has taken the stance of a pragmatist researcher –

where the research question dictates the choice of methods used. Methods

10

belonging to different research paradigms were chosen because of their

suitability to answer the research questions. For example, a meta-analysis was

undertaken, typically associated with positivist paradigm, to evaluate the

effectiveness of pharmacist-led medication review in chronic pain management

(See chapter 3). Whereas, a qualitative approach was adopted to explore

patients’ views about their experiences of the nurse-pharmacist managed pain

clinic, typically associated with the constructivist paradigm (See chapters 4 and

7).

1.2 Structure of the thesis and writing style

This thesis consists of eight chapters. At the beginning of each chapter, a brief

summary about the contents of the chapter is provided to facilitate reading. A

third person objective style has been adopted throughout the thesis. The author

has identified himself in this thesis as “the author” and/or MAH, except for this

chapter where first person style has been used occasionally as well.

Chapter 1: Introduction

This chapter provides contextual background of the study. A brief account of the

author’s journey through his PhD is presented. Following that, the world

view/paradigm governing the whole thesis is explained. Finally, a brief

description of the contents of each chapter of this thesis is outlined.

Chapter 2: Literature review

In this chapter, the objectives of conducting the literature review and the search

strategy used for searching electronic databases are presented. To give the

reader a broader picture of the roles of nurses and pharmacists in chronic pain

management, studies describing and/or evaluating their roles are summarised

11

in this chapter. Then the historical background and working of the nurse-

pharmacist managed pain clinic under investigation is explained. Finally, the

aims and objectives of the present study in relation to the limitations of the

current evidence supporting the clinic’s effectiveness are outlined.

Chapter 3: Effectiveness of pharmacist-led medication review in chronic

pain management: a systematic review and meta-analysis

This chapter presents the rationale, aim and objectives, methods, and results of

a systematic review undertaken to evaluate the effectiveness of pharmacist-led

medication review in chronic pain management. Implications of findings on

clinical practice are discussed and recommendations for future research are

also suggested.

Chapter 4: Methodology

In this chapter, a brief overview of various research methodologies available to

healthcare researchers is presented. The selection of a particular research

methodology, mixed-methods, underpinning this study is justified in relation to

the aim and objectives of the study. Finally, the rationale for selecting an

embedded design for this study is described together with the selection of

specific quantitative (quasi-experimental) and qualitative (descriptive qualitative)

designs is justified.

Chapter 5: Methods

In this chapter, the choice of particular methods used in this study, from sample

size calculation to data analysis is debated and justified. Although in the same

chapter, the methods used within quantitative and qualitative phases are

12

presented separately to improve clarity. The steps taken to ensure ethical

conduct of the study are also outlined.

Chapter 6: Results - Quantitative

As the name suggests, this chapter presents results of the quasi-experimental

study (quantitative phase). Tables and figures are used, where necessary, to

illustrate and summarise findings. In order to facilitate reading, the chapter is

divided into small sections in line with the research questions.

Chapter 7: Findings - Qualitative

In this chapter, the findings of the qualitative descriptive study are presented.

Anonymised quotations from patients’ interviews are also given to support

findings of the study.

Chapter 8: Discussion

In this chapter, findings of both quantitative and qualitative phases are

discussed. Limitations to this study are highlighted and recommendations for

future research are described. Plans for dissemination of research findings are

also outlined.

13

CHAPTER 2

LITERATURE REVIEW

14

CHAPTER 2

LITERATURE REVIEW

2.1 Introduction

The literature review is an important component in designing and conducting a

research study as it allows the researcher to place his work in context of what is

already known, preventing duplication and allowing meaningful comparisons

with other studies in the similar area of research.

This chapter presents a critical summary of existing literature on various

aspects of chronic pain including its epidemiology and management with the

aim of highlighting the growing socioeconomic burden of chronic pain and

challenges in its management. There were four objectives for conducting the

literature review:

I. To obtain an overview of chronic pain prevalence and challenges in its

management

II. To gather evidence on the role of pharmacists and nurses in chronic pain

management.

III. To inform the development of the methodology for the current study.

IV. To identify key outcome measures commonly used to evaluate the

effectiveness of chronic pain management interventions.

The first two objectives are comprehensively dealt with in this chapter. The

remaining two objectives are related to the methodology and methods of the

present study and are discussed in detail in the methodology (Chapter 4) and

methods (Chapter 5) chapters, where an overview of various research

15

methodologies in healthcare research is provided and selection of a particular

methodology and methods is debated and justified.

This chapter begins with a detailed account of the search strategy employed

to identify relevant articles. In order to facilitate easy comprehension for readers

the chapter is divided into two sections: Chronic pain burden and its challenges;

and the role of nurses and pharmacists in chronic pain management. In the first

section, the prevalence of chronic pain, health resource utilisation due to

chronic pain and its impact on physical and emotional functioning (quality of life)

are discussed to establish the scope of the problem. Current challenges in

chronic pain management within primary care are also discussed. The second

section critically assesses current research evidence to support the role of

nurses and pharmacists in chronic pain management. Following this, the

working of the nurse-pharmacist managed pain clinic under investigation, is

explained. The limitations of the research evidence supporting the pain clinic

are then highlighted, leading to the aim(s) and objectives for this study.

16

2.2 Literature search

In order to ensure a robust and in-depth search of the literature, in line with the

search objectives, the search strategy was divided into three groups. In the first

group, literature related to the prevalence and socioeconomic burden of chronic

pain was searched and reviewed. The rationale for presenting epidemiological

aspects of chronic pain and existing challenges in its management is to highlight

the necessity for development of innovative services to reduce disease burden

and ensure optimum care. In the second group, papers evaluating the roles of

general practitioners (GPs), multidisciplinary pain clinics, nurses and

pharmacists in chronic pain management were searched. In the third and final

group, literature related to the methodological innovations in health services

research in general and chronic pain in particular were searched with an aim to

inform methodology, methods, outcome measures and scales for the present

study. Electronic databases including Medline (via Ovid), EMBASE (via Ovid),

Cochrane Library, Cumulative Index to Nursing and Allied Health Literature

(CINAHL) (via EMBSCO), Google Scholar and PsycINFO were searched from

the date of their inception. Each of these databases was searched from the date

of their inception to January 2011. However, the literature search and review

was regularly updated throughout the study period in order to keep abreast with

the latest research in the field. The key terms used were: chronic pain; non-

malignant pain; quality of life; physical functioning; emotional functioning;

anxiety; depression; pain management; non-pharmacological management;

pharmacological management; multidisciplinary pain clinic; interdisciplinary pain

clinic; nurse-led; nursing interventions; pharmacist-led; pharmaceutical care;

medicines management; pharmacist; community; pain scales; outcome

measures. These search terms were combined with Boolean operators such as

17

AND, OR and NOT to refine search results wherever necessary. In addition to

the search of electronic databases, websites of the British Pain Society, the

American Pain Society and the International Association for Study of Pain

(IASP) were also searched. Reference lists of relevant articles were also

searched to identify any additional articles. The retrieved articles were critically

appraised.

2.3 Prevalence of chronic pain

Keeping in view the growing prevalence, multidimensional nature as well as

complexity of its management, chronic pain has become a challenging issue not

only for the patients but also for the healthcare professionals and systems, and

society. A considerable increase in the prevalence of chronic pain has been

reported over the past two decades. A study conducted in the US reported an

increase in the prevalence of chronic low back pain alone from 3.9% in 1992 to

10.2% in 2006 (Freburger et al., 2009). Likewise, a two to fourfold increase in

the prevalence of chronic pain has also been reported in the UK (Harkness et

al., 2005). As mentioned earlier in chapter 1 (section 1.0), owing to differences

in definitions of chronic pain, variation in study populations and the research

methodology used for surveys, the estimated prevalence of chronic pain varies

substantially, ranging from 2% to 55% (Verhaak et al., 1998, Elliott et al., 1999,

Blyth et al., 2001, Catala´ et al., 2002, Moulin et al., 2002, Eriksen et al., 2003,

Breivik et al., 2006, Neville et al., 2008). Recent studies from the US (Johannes

et al., 2010) and the Europe (Breivik et al., 2006) have estimated the prevalence

of chronic pain to be approximately one in three and one in five respectively. In

Europe, the prevalence of chronic pain was highest in Norway (30%) and least

in Spain (12%) (Breivik et al., 2006). These studies also reported a higher

prevalence of chronic pain among females compared to males. In addition to

18

female gender, other significant predictors of chronic pain include: old age, poor

housing and type of employment (Price et al., 2012). In Europe, back pain was

noted to be the most common type of chronic pain followed by knee pain

(Breivik et al., 2006).

In the UK, it has been estimated that chronic pain of moderate to severe

intensity affects 7.8 million people (Chief Medical Officer for England, 2008). In

2011, the National Health Survey in England reported that chronic pain affects

more than 14 million adults (Bridges, 2012). The National Health Survey further

reported that 31% men and 37% women suffer from chronic pain, with older

people more likely to report chronic pain than younger people (Bridges, 2012).

The National Pain audit reported the average annual incidence estimated at

8.3% with the average annual recovery rate of 5.4% (Price et al., 2012). The

growing prevalence would require additional human and financial resources to

cater for patients’ needs, putting an additional burden on the healthcare system.

2.4 Economic and societal burden of chronic pain

Loss of productivity, carer burden and high utilisation of healthcare resources

are often associated with chronic pain (Steenstra et al., 2005). Additionally,

chronic pain patients have been reported to have poorer health related quality of

life compared to the patients with other chronic diseases (Laas et al., 2009). In

terms of loss of productivity, 9.9 million work days are lost annually in Australia

(van Leeuwen et al., 2006) and one million in Denmark due to chronic pain

(Eriksen et al., 2003). Breivik et al. (2006) reported that the mean number of

work days lost, among 15 European countries and Israel, in the past 6 months

was highest in Finland (19.8 days) and lowest in France (5 days). Furthermore,

one in four participants reported that pain had an impact on their employment

status. Similarly, in the UK, it has been estimated that 25% of chronic pain

19

patients will lose their jobs because of pain (Chief Medical Officer for England,

2008).

A number of studies have estimated the economic burden due to work

absenteeism and loss of productivity associated with chronic pain (Maniadakis

and Gray, 2000, Walker et al., 2003, Phillips, 2009, Gaskin and Richard, 2012).

In the UK, the indirect cost of back pain alone was estimated to be £10.7 billion

(Maniadakis and Gray, 2000). In the US, a recent study reported that the value

of lost productivity due to pain ranged from $299 to $335 billion (£182.4 billion to

£216.5 billion) (Gaskin and Richard, 2012). Although significantly less than the

indirect costs, the direct costs associated with chronic pain are quite substantial.

In 2007, The National Health Service (NHS) in England spent £584 million on

67 million prescriptions for analgesics (Chief Medical Officer for England, 2008).

In Australia, the direct cost of lower back pain alone in 2001 was estimated to

be AU$ 1.02 billion (£56.4 million) with an overall cost of AU$9.17 billion (£5.06

billion) (Walker et al., 2003). In the US, the overall annual cost associated with

chronic has been estimated to range from $560 to $635 billion (£ 341 billion to

£387 billion), more than the annual costs of heart disease ($309 billion; £188

billion), cancer ($243 billion; £148 billion), and diabetes ($188 billion; 114

£billion) (Gaskin and Richard, 2012).

The utilisation of healthcare resources by chronic pain patients is

significantly more than other chronic diseases with women utilizing more

healthcare resources than men (Blyth et al., 2004, Eriksen et al., 2004, Breivik

et al., 2006, Kaur et al., 2007, Price et al., 2012). In Denmark, patients with

chronic pain had on average 12.8 contacts per year with a primary healthcare

provider compared with 7.3 for the control group (Eriksen et al., 2004).

Australian data showed that compared to non-chronic pain patients, chronic

20

pain patients were five times more likely to visit the Accident and Emergency

department (Blyth et al., 2004). Data from Europe (n=4780) demonstrated that

more than half (54%) of the respondents had seen two to six different doctors

for their pain and 60% visited their doctors two to nine times in the past 6

months due to pain (Breivik et al., 2006) .

Given this high economic and societal burden of chronic pain, early and

effective management of chronic pain is crucial not only for improving patient

outcomes but also for avoiding unnecessary humanistic and financial burden on

the healthcare system and society.

2.5 Management of chronic pain

Chronic pain is commonly managed within primary care. However, given

the complex nature of chronic pain, care provided within the primary care is

often suboptimal and inadequate (Breivik et al., 2006, McDermott et al., 2006).

This is primarily because treatment approaches in primary care are usually uni-

disciplinary and are often based on the biomedical model, which assumes that

the presentation of chronic pain is due to a specific physical pathology. The

treatment is then targeted to rectify that physical pathology either

pharmacologically or surgically (Gatchel and Okifuji, 2006). However, this

approach is not applicable to all cases of chronic pain, because it is not always

possible to identify a specific physical cause (Gatchel and Okifuji, 2006). The

alternative, biopsychosocial pain model assumes that the clinical presentation of

chronic pain is a result of complex interactions among physiological,

psychological and social factors. An effective treatment modality should

therefore focus on all three areas (Turk and Gatchel, 2002, Gatchel, 2005).

21

In theory, multidisciplinary pain clinics based on the biopsychosocial

model can effectively manage chronic pain. Various systematic reviews have

documented the effectiveness of multidisciplinary pain management

programmes/clinics in various settings and chronic pain conditions (Flor et al.,

1992, van Tulder et al., 1997, Guzmán et al., 2001, Thomsen et al., 2001,

Scascighini et al., 2008). Multidisciplinary pain clinics have been reported to

reduce pain intensity ranging from 14% (Moore et al., 1984) to 60% (Tollison et

al., 1985), with an average reduction of 20% to 30% (Flor et al., 1992). Flor et

al. (1992) reported, in a meta-analysis, a 65% increase in physical activity in

patients receiving multidisciplinary pain treatments compared to a 35% increase

in patients receiving conventional medical care. Similarly, return to work rate

was reported to be higher in patients in multidisciplinary programmes compared

to conventional medical treatments (mean 66% vs. 27% respectively).

More recently, Scascighini et al. (2008) conducted a comprehensive

systematic review of RCTs to evaluate the effectiveness of multidisciplinary pain

programmes in chronic pain management. The review included 35 studies but

the authors were unable to undertake meta-analysis due to heterogeneity in

study design, patient population and nature of the intervention. The authors

drew conclusions on the effectiveness of the multidisciplinary interventions

based on a four level rating system (strong evidence, moderate evidence,

limited evidence and no evidence) developed by Cochrane Back Review Group

(van Tulder et al., 2003). They reported: strong evidence (multiple high quality

RCTs with consistent results) supporting superiority of multidisciplinary

treatment compared with waiting list control (WLC) and treatment as usual

(TAU); moderate evidence (one high quality RCT and one or more low quality

RCTs with consistent results) in favour of multidisciplinary pain clinics compared

22

with non-multidisciplinary treatments (e.g. physiotherapy with discussion group,

patient education). In terms of aetiology of chronic pain, patients with

fibromyalgia and/or chronic back pain were likely to gain more benefit from

multidisciplinary treatment modalities compared with patients with other chronic

pain diagnoses (moderate evidence). For mixed chronic pain patient population,

limited evidence (one high quality RCT, or multiple low quality RCTs with

consistent findings, or contradictory outcomes of studies with high and low

quality) supporting effectiveness of multidisciplinary treatment compared with

WLC or TAU was reported. Furthermore, comprehensive inpatient programmes

were found to be more effective than the outpatient programmes (moderate

evidence). However, neither the duration of programme nor the programme

components influenced the effectiveness of the programme. The authors

highlighted the need for internationally recognised standards of multidisciplinary

programmes to ensure better outcomes for chronic pain patients. Notably, trials

were not excluded based on their quality therefore many of the RCTs included

in the systematic review may have lacked quality in design or

execution/reporting.

Finally, in addition to clinical effectiveness, multidisciplinary pain clinics

have been found to be cost effective (Gatchel and Okifuji, 2006). However,

timely acceptable access and affordability of such multidisciplinary pain clinics

remains an issue.

2.5.1 Barriers to effective chronic pain management

As mentioned earlier (Chapter 1, section 1.1), there are a number of barriers

related to the healthcare-systems, clinicians and patients which interfere with

achieving optimal pain relief (Glajchen, 2001). Clinicians’ inadequate knowledge

and limited assessment skills are frequently seen as barriers to effective

23

management of chronic pain. In a survey in the UK, GPs described

helplessness and dissatisfaction with their ability to manage chronic pain

patients (Stannard and Johnson, 2003). In another study in the USA, 88% of the

physicians reported that their training in pain management as poor in medical

school, and 73% felt that residency training was fair or poor (Von Roenn et al.,

1993, Von Gunten and Von Roenn, 1994). Other clinician-related barriers

include: negative attitudes toward prescribing of opioid analgesics (due to fear

of abuse and addiction), and fear of regulatory scrutiny for prescribing controlled

substances (Von Roenn et al., 1993, Cleeland, 1993, Glajchen, 2001).

Patient-related barriers include: communication problems, psychological

issues such as anxiety, depression and anger; and other issues such as non-

adherence with the prescribed medication and fear of addiction, tolerance and

side effects (Ward et al., 1993, Glajchen, 2001). Anxiety and depression are

frequently occurring co-morbidities and are associated with chronic pain

(Sagheer et al., 2013, Wong et al., 2011). In the UK, 49% of chronic pain

patients experience depression (Chief Medical Officer for England, 2008).

Adherence with the prescribed medicines is essential for effective pain relief.

However, non-adherence with the prescribed medicines and abuse of opioid

analgesics by the chronic pain patients have frequently been reported in the

literature (Berndt et al., 1993, Broekmans et al., 2009, Couto et al., 2009). A

retrospective analysis of 938,586 patients’ urine test samples to estimate

compliance with prescribed opioid analgesics, found that 3 out of 4 patients

were not taking their medicines as prescribed by their clinicians and 38% of

patients had no detectable level of prescribed medicine (Couto et al., 2009).

More importantly, 29% had a non-prescribed medication present and 27% had a

drug level higher than expected in their urine samples. However, the study did

24

not explore the reasons for non-adherence and abuse of opioid analgesics.

Fear of addiction and intolerance towards the side effects might be responsible,

at least in part, for the above mentioned findings.

Healthcare system-related barriers include: inaccessibility and

unaffordability of multidisciplinary pain clinics, lack of a neighbourhood

pharmacy, non-availability of high doses of opioids at the pharmacy, and long

waiting times for appointments in secondary care (Glajchen, 2001). The waiting

time for six months or more from the time of referral to treatment is associated

with a worsening of health-related quality of life and psychological wellbeing.

(Lynch et al., 2008). In Canada, the median waiting time for a first appointment

in public multidisciplinary pain treatment facilities was six months, 12 times

more than similar private facilities (Peng et al., 2007). Unfortunately, no

established benchmarks or guidelines for acceptable wait times specific to the

treatment of chronic pain exist (Lynch et al., 2007). However, generic standards

are followed in the UK (Price et al., 2012), usually 18 weeks. (Price et al.,

2012). These multifactorial problems make chronic pain management

challenging.

2.5.2 Chronic pain management: The UK perspective

The access to and quality of pain services in the UK is a matter of deep

concern. In 2008, there was one pain specialist for 32,000 people in pain (Chief

Medical Officer for England, 2008). The National Pain Audit found a lack of clear

standards of care and variation in access to multidisciplinary care. Of the 204

pain services evaluated, the audit reported that only 40% of clinics in England

met the minimum criteria for multidisciplinary clinics by having a psychologist, a

physiotherapist and a physician (Price et al., 2012). Furthermore, 80% of clinics

in England and 50% in Wales met the 18 week generic standard waiting time.

25

The report also found that many of the chronic pain services were not even

meeting the minimum criteria for an effective pain service as outlined by the

IASP and the Faculty of Pain Medicine of the Royal College of Anaesthetists.

The report made a number of recommendations aiming to improve access to

and quality of pain services in the UK. The key recommendations included:

information about local pain services should be made readily available to

patients; the Royal College of Anaesthetists should adopt IASP guidance on

minimum waiting times for pain services; service commissioners should

integrate physiotherapy and psychology services into local care pathways for

pain; and every specialist pain service should be supported by a medical

consultant to provide expert advice.

Given the limited capacity of GPs, the lack of pain specialists and issues

surrounding accessibility and affordability of multidisciplinary pain clinics, the

role of pharmacists and nurses has grown significantly in the past decade. In

the following sections, the evidence to support the roles of nurses and

pharmacists in chronic pain management, both independently or as part of

multidisciplinary teams, is explored.

2.6 The role of pharmacists in chronic pain management

Until recently, and still in some developing countries, the role of pharmacists

within healthcare systems globally was limited to the dispensing of medications.

Although dispensing of medications still remains an important responsibility of

pharmacists, with the introduction of the concept of pharmaceutical care, the

focus of pharmaceutical services has shifted from products to patients.

Consequently, a number of patient-oriented pharmacist-led services have been

developed in both hospital and community settings. Pharmaceutical care is

defined as “the responsible provision of drug therapy for the purpose of

26

achieving definite outcomes that improve a patient's quality of life” ” (Hepler and

Strand, 1990, P. 539). These outcomes include: curing and/or preventing

disease; slowing down its progress; and an elimination or reduction of a

patient's symptomatology (Hepler and Strand, 1990). The basic essence of

pharmaceutical care is that the pharmacist develops, implements and monitors

a therapeutic plan in consultation with the patient, with the patient playing an

active role in decision making. The aim of pharmaceutical care is to identify,

prevent and resolve actual or potential drug related problems (Hepler and

Strand, 1990). More recently, terms such as “medicines management” and

“medicines optimisation” have frequently been used in literature to describe

pharmacist’s activities to promote safe and effective use of medicines (Barber,

2001).

In the context of chronic pain, the role of pharmacists in its management

has expanded significantly in the past two decades. Research evidence to

support the role of pharmacists in chronic pain management is also growing.

During the literature search, both observational studies and randomised

controlled trials evaluating the effectiveness of the role of the pharmacists in

chronic pain management were found. Based on the literature review,

pharmacist-led interventions for chronic pain management can be broadly

categorised into two categories: medication review and prescribing; and

educational interventions. However, in most instances medication review and

patient education were delivered concurrently as part of pharmacist-led

interventions. These interventions have been delivered either independently or

as part of multidisciplinary teams in different settings. In the following

paragraphs, research studies evaluating the role of pharmacists in chronic pain

management are critically reviewed. A description of the nature of the

27

intervention(s) and settings has also been provided to highlight the variations in

the nature, mode and delivery of pharmacist-led interventions in chronic pain

management. A systematic review evaluating the effectiveness of pharmacist-

led medication review is presented in the next chapter (Chapter 3).

For clarity, studies evaluating the role of pharmacists in chronic pain

management have been divided into two sections: Descriptive observational

studies and randomised controlled trials.

2.6.1 Descriptive observational studies

The literature review found a few observational studies, described below, which

only described the nature of pharmacist-led intervention in chronic pain

management without providing any significant data to support their

effectiveness.

Weitzel et al. (2004) described the development and working of a

pharmacist-managed headache clinic in an interdisciplinary community health

centre affiliated with the University of Florida, USA. The clinic was established in

2000 on the request of the clinical nurse practitioner and followed a stratified

care approach for the management of migraine. In the stratified care approach,

patients were stratified and treated based on the severity of their migraine

(Lipton et al., 2000). In terms of the working of the clinic, patients were referred

to the pharmacist by the patients’ primary care physician (PCP), and during the

initial one hour long consultation, the pharmacist conducted a medication review

and obtained a headache history. The pharmacist, in consultation with the

patient, developed a therapeutic plan based on the available guidelines. During

follow up appointments, the pharmacist reviewed the pharmacotherapeutic plan

and adjusted it according to the patients’ needs. From 2000 to 2003 the clinic

28

enrolled 37 patients. Pharmacist’s recommendations included: requested non-

pharmacologic treatment for 1 patient, addition of immediate-relief drug therapy

for 20; addition of prophylactic drugs for 14; modification of treatment regimen

for 7; and referral to consultant for 3 patients. Twenty-six patients (70%)

reported a decrease in headache frequency and severity, while the rest reported

no change. The main focus of the paper was to describe the nature of service

rather than to evaluate its effectiveness.

Similarly, three more studies (Rapoport and Akbik, 2004, Dole et al.,

2007, Fan and Elgourt, 2008) described the working of a pharmacist managed

pain clinic with little or no data to support their effectiveness. Rapoport and

Akbik (2004) described a pharmacist-managed pain clinic within a

multidisciplinary pain service, consisting of a neurologist, a psychiatrist, an

anaesthesiologist, an anaesthesiology fellow and two pharmacists, at a

Veterans Affairs medical centre in Boston, USA. Fan and Elgourt (2008)

described a pain management pharmacy service in a community hospital in the

USA and Dole et al. (2007) described a pain service with a pharmacist with

prescribing authority in Mexico. In all three studies, the role of the pharmacist

was to develop a therapeutic plan, monitor outcomes, adjust medicines as per

the requirement, prevent the abuse of opioid analgesics, improving adherence

to prescribed medication, refill prescriptions, prevent drug related problems and

side effects, and make referrals to other healthcare professionals if necessary.

The overall aim of these services was to ensure effective, efficient and

adequate analgesia to all patients referred to these services. Dole et al. (2007)

also reported a significant reduction in pain intensity scores (Mean difference

1.1; SD ± 2.5), measured on a 1 to 10 visual analogue scale (VAS) (P < 0.001),

and the pain service generated an overall profit equivalent to a 9% return on

29

investment (annual revenue $107,550 (£65,755); annual salary

$98,851(£60,437).

In the UK, McDermott et al. (2006) described a method of identifying

chronic pain patients in primary care and the feasibility and acceptability of a

pharmacist-led medication review in one general practice in Aberdeenshire,

Scotland, UK. Chronic pain patients were identified using a Microsoft Access

based Audit Tool (NIMROD). In total, the case notes of 132 patients were

reviewed and the pharmacist made 192 recommendations about the safe and

appropriate use of medications. Of these 192 recommendations, 108 (56%)

were directly related to the use of analgesics. However, outcomes such as pain

intensity and physical functioning were not measured. This was the first study in

the UK to report a method for the identification of chronic pain patients in the

general practice and was therefore instrumental in the development of an RCT,

which evaluated the effectiveness of pharmacist-led medication reviews in the

primary care setting (described below; section 2.6.2).

In addition to descriptive studies, one quasi-experimental study using a

single group pre-test post-test design and multiple outcome measures was also

found (Chelminski et al., 2005). Typical single group pre-post study designs lack

control group and randomization, which threatens the validity and reliability of

the findings (Fisher et al., 2002). Nevertheless, such studies are important in

providing important information about the nature of the intervention and patient

population, the suitability of the intervention in the desired population, and, most

importantly, informing the design of future RCTs (Shadish et al., 2002).

Chelminski et al. (2005), in the USA, evaluated a primary care based multi-

disciplinary disease management programme for chronic pain patients with a

high burden of psychiatric comorbidity. The multi-disciplinary team consisted of

30

patient’s primary care physician (PCP), a clinical pharmacist, a psychiatrist with

a sub-specialisation in pain management and a programme assistant with

training in health behaviour. The aims of the programme were to: prevent

substance (opioids) abuse; titrate patients’ pain medications to ensure optimal

analgesia; and identify and manage patients with depression. Once enrolled,

participants were asked to complete the Brief Pain inventory (BPI) (Cleeland

and Ryan, 1994), the Centre for Epidemiological Studies-Depression Scale

(CESD) (Radloff, 1977) and the Pain disability Index (PDI) (Tait et al., 1987) at

baseline and 3-month follow up. Substance abuse was monitored through

clinical history and urine toxicological screening (UTS). Eighty five patients

enrolled in the study with an average baseline pain score of 6.5. Fifteen patients

withdrew from the study after identification of substance abuse. At 3-month

follow-up, the authors reported a statistically significant (p=0.003) 1 point

reduction in pain score, from 6.5 to 5.5 on an 11 point NRS. Importantly, the

reduction in the pain score was statistically significant but not clinically

significant. However, there were significant improvements in mean PDI score

(p<0.001) and CESD score (p<0.001). Remarkably, the proportion of depressed

patients fell from 79% to 54% (p=0.003). However, substance abuse was

reported in 32% of the patients.

2.6.2 Randomised controlled trials (RCTs)

In healthcare research, RCTs are considered the gold standard to evaluate the

effectiveness of an intervention. In addition to a number of descriptive and

observational studies described above, a few randomised controlled clinical

trials evaluating the effectiveness of pharmacist-led interventions in chronic pain

management were also found (Gammaitoni et al., 2000, Hay et al., 2006,

Hoffmann et al., 2008, Petkova, 2009, Marra et al., 2012, Bruhn et al., 2013).

31

These RCTs vary in terms of the nature of the intervention, settings, patient

population, duration of follow-up, and outcome measures and scales used. A

detailed description of all of these trials, except for a trial by Petkova (2009) is

provided in the next chapter as they are part of the systematic review

undertaken as part of this thesis. The trial by Petkova (2009) did not fulfil the

inclusion criteria for the systematic review (described in the next chapter).

Although, the trial by Bruhn et al. (2013) was included in the systematic review,

the detailed results were published after its completion, therefore it was not

included in the data analysis and is briefly presented here.

In Bulgaria, Petkova (2009) conducted a randomised controlled trial to

evaluate the effectiveness of a community pharmacy-based pharmacist-led

education programme for arthritis patients. The educational leaflets were

prepared in the form of a self-study program based on the National Health

Insurance Fund for treatment of arthritis diseases (clinical paths for physical

treatment and rehabilitation of arthritis diseases and musculoskeletal system)

and by the Arthritis Foundation. However, the nature of education programme

was not described extensively. In total 90 patients were enrolled, 45 each in the

intervention and control groups. Neither the method of power calculation nor the

method for allocation concealment was reported. Furthermore, instead of

making comparisons between the intervention and control groups for all the

outcomes, comparisons within groups (pretest-posttest) were only reported.

Nevertheless, significant reduction in the frequency of ‘severe pain’ was

reported in the intervention group compared to the control, the only comparison

reported in paper. Therefore, in the presence of a high risk of selection and

reporting bias, the trial provided limited useful information about the

effectiveness of the intervention.

32

In the UK, Bruhn et al. (2013) conducted an exploratory trial to evaluate

the effectiveness of pharmacist-led medication review, with or without

pharmacist prescribing in primary care among patients with chronic pain .

Patients were randomised to one of the three arms: pharmacist medication

review and prescribing (prescribing arm); pharmacist medication review and

recommendations to the GP (review arm); and treatment as usual (TAU) arm. At

6 months follow-up, compared to the TAU, there was a significant reduction in

pain intensity in both the intervention groups (p=0.02). However, there was no

difference in the disability, measured by the chronic pain grade questionnaire

CPG (p=0.05). Similarly, there was no significant improvement in the SF-12

physical composite score (PCS) between the trial arms (p=0.75) and a slight

deterioration in SF-12 mental composite score (MCS) in the intervention arms,

and a statistically significant deterioration in the TAU arm (p= 0.002). Since it

was an exploratory trial the authors did not perform any power calculations,

leading to a higher risk of type II error.

2.6.3 Systematic reviews

During the literature search, two systematic reviews (Bennett et al.,

2011, Elias et al., 2011) were also found. Elias et al (2011) conducted a

systematic review to evaluate the impact of pharmacist-led interventions in the

management of osteoporosis. Since the focus of this thesis is on chronic pain,

therefore further details of the systematic review are not included here.

Bennett et al. (2011) conducted a systematic review to evaluate the

effectiveness of pharmacist-led educational interventions in chronic pain

management. They included RCTs in which educational interventions were

delivered by pharmacists independently or as part of a multicomponent

intervention to chronic pain patients (pain lasting ≥ 3 months). Four RCTs,

33

including one involving cancer patients, randomizing 400 patients in total were

identified. The authors undertook a meta-analysis and reported: on average, a

0.5 point reduction in pain intensity on a 0 to 10 numerical rating scale in the

intervention group compared to the control; more than 50% reduction in

adverse effects; and an approximately 1 point improvement in patient

satisfaction with treatment on a 0 to 10 rating scale. However, the interventions

had no effect on reducing pain interference with daily activities and improving

self-efficacy. Although the effect on pain intensity was statistically significant,

the authors were unable to demonstrate clinical significance of the interventions.

Furthermore, the effect of the intervention on “worst pain” and “current pain”

were not statistically significant - 0.11 and - 0.003 points, respectively. There

were two limitations in terms of the conduct of meta-analysis: Firstly, a RCT

involving cancer pain patients was included together with RCTs involving

chronic pain patients, leading to clinical heterogeneity. Secondly, the time points

at which follow-up measures were obtained varied between 1 to 16 weeks;

combing short-term trials with long-term trials is not recommended as it

produces a larger treatment effect than combining longer term trials alone

(Moore et al., 2010a).

From the above discussion, despite the highlighted limitations, it can be

concluded that there is a potential role of pharmacists in chronic pain

management. However, more evidence is required before a wider clinical role of

pharmacists in chronic pain management can be advocated.

2.7 Role of nurses in chronic pain management

Since the 1980s nurses have been actively involved in managing chronic pain

patients. However, over the past four decades, with changes in healthcare

systems globally, the role of nurses in chronic pain management has evolved

34

substantially and has become more independent (e.g. nurse prescribing),

although nurses still remain an integral part of most of the multidisciplinary pain

programmes (Middleton, 2004). Various nurse-led interventions have been

developed and evaluated in chronic pain management including the teaching of

coping strategies such as breathing exercises and relaxation, cognitive

behavioural therapy (CBT), sensorial stimulations, psycho-education, magnetic

therapy, guided imagery and music therapy, motivational interviewing, hypnosis

training and prescribing (Lefort et al., 1998, Schofield et al., 1998, Mannix et al.,

1999, Becker et al., 2000, Kim, 2001, Simmons et al., 2002, Wells-Federman et

al., 2002, McCaffrey and Freeman, 2003, Siedliecki and Good, 2006). Nurse-

prescribing in chronic pain is perhaps the most recent nursing intervention in

chronic pain management. Specialist pain nurses with prescribing authoritiy can

improve access to appropriate pain medicines, a barrier to effective pain

management (Stenner and Courtenay, 2008). In the UK, the two main forms of

nurse prescribing are: nurse independent prescribing (NIP), and nurse

supplementary prescribing (NSP) (Department of Health, 2006). NIP enables

nurses to prescribe any licensed medicine within their area of competence,

including thirteen controlled drugs (Department of Health, 2006). For NSP, any

medicine can be prescribed in line with the clinical management plan (CMP)

agreed between the physician, who makes the initial diagnosis, the nurse

prescriber and the patient.

Given that the nature of nurse-led interventions is quite diverse in chronic

pain management, a number of studies, both observational and RCTs have

been conducted to evaluate their effectiveness. The detailed presentation of all

these studies is beyond the scope of this thesis, therefore only key RCTs and

systematic reviews are briefly described below.

35

2.7.1 Randomised controlled trials

As mentioned above, a number of randomised controlled trials have been

conducted to evaluate the effectiveness of various nurse-led interventions in

chronic pain management. To avoid duplication, RCTs included in the

systematic reviews have been briefly discussed in the systematic review section

(section 2.6.2). The other key clinical trials are described below.

Jones et al. (2002) conducted an RCT and cost analysis to evaluate the

effectiveness of a nurse-led education programme in reducing the chronic use

of non-steroidal anti-inflammatory drugs (NSAIDs) by chronic pain patients in

general practice in Nottinghamshire, UK. Of the 237 patients randomised 222

completed the 6-month follow-up. Patients in the control group received simple

advice regarding the use of NSAIDs while the patients in the intervention group

received advice, from a nurse practitioner trained in musculoskeletal

assessment, on weight reduction, aerobic exercises, use of local heat and cold,

back and neck care, massage and relaxation techniques. In addition, a

therapeutic plan was drawn up in consultation with individual patients, tailored to

their needs, in the intervention group to stop or reduce the use of NSAID. The

intervention session lasted for 30-60 minutes. Change in NSAID use in 6-

months post intervention was the primary outcome measure. The secondary

outcome measures included changes in health status (measured by SF-36),

quality of life (measured with EQ-5D) and the cost of drug and health services.

Compared with control, an additional 28% of patients in the intervention group

either stopped taking NSAIDs or reduced their dosage more than 50% at 6

months post intervention without having a negative impact on health status and

quality of life. Furthermore, the authors reported a significant reduction in

NSAID prescription costs in the intervention group compared with the control

36

(median reduction in NSAID costs per patient of £-2.61 in the intervention

group was vs control over the 6-months). However, although non-significant, an

increase in the overall drug prescription costs was noticed in both groups.

Another RCT conducted in the UK by Ryan et al. (2006) evaluated the

effectiveness of a rheumatology expert nurse-led drug monitoring programme

and reported statistically significant improvement in the Arthritis Impact Scale in

the intervention group compared to the usual care group (p=0.03). In addition, a

mean improvement of 1.8 in the Rheumatology Attitude Index (RAI) score was

also reported in the intervention group compared to a mean deterioration of 0.3

in the usual care group. However, the change in the Disease Activity Scores

(DAS) was not statistically significant, in the intervention group compared with

the control, at 3 and 7 months follow-up but was significant at 12 months.

Furthermore, there were no differences in terms of the use of NSAIDs (61% in

the intervention group vs 53% in the control group) and steroids (39% in the

intervention group vs 38% in the control group) in both the groups. The trial

randomised 71 new RA patients who were about to start new disease modifying

anti-rheumatic therapy at a district general hospital. The intervention was based

on the Pendelton’s framework (seven consultation tasks), explained elsewhere

(Pendleton et al., 1984), to assess patients’ needs in addition to the monitoring

of drug safety delivered by a trained rheumatology expert nurse. Patients in the

control group received care from an outpatient staff nurse for drug safety

monitoring. Data were collected at the baseline, 3, 7 and 12 months.

Interestingly, despite the fact that one of the aims of the intervention was to

monitor drug safety, no data were reported on safety /adverse events. Mazzuca

et al. (2004) in the USA, similar to the findings of Ryan et al. (2006), also

documented a statistically significant reduction in the use of NSAIDs among

37

osteoarthritis patients in the intervention group (received nurse-led education on

non-pharmacological modalities including quadriceps strengthening exercises,

counselling on the principles of joint protection, and the use of thermal

modalities) compared to the control (26% in the intervention vs 5% in the control

; p=0.02).

The above mentioned trials reported positive outcomes in the nurse-led

intervention group. However, a few studies (4 studies) found during the

literature search failed to demonstrate the effectiveness of nurse-led

interventions.

Victor et al. (2005), in the UK, conducted a cluster randomised trial to

compare the effectiveness of a nurse-led primary care based education

programme, consisting of a home visit and four 1-hour teaching sessions, for

patients with osteoarthritis of the knee with a waiting list control group. In total,

193 patients (73 controls; 120 interventions) were recruited and followed up at

1,3, 6 and 12 months. Only 125 patients (53 controls; 72 interventions)

completed the 12 months follow up, dropout rate 35.2%. There were no

statistically significant differences between the intervention and control groups

in any of the outcome measures including the arthritis helpfulness index (AHI),

quality of life (measured by the SF-36), pain, disability and stiffness (measured

by WOMAC), and osteoarthritis knowledge at either 1-month or 12-month

follow-up. The authors linked the lack of benefit to the short duration of the

intervention and the heterogeneous nature of the population studied.

Tijhuis et al. (2002) compared the effectiveness of care provided by a

clinical nurse specialist with an inpatient team care and day patient team care in

patients with RA. In total, 210 (nurse specialist 71; inpatients 71; day patients

68) patients were recruited from the outpatient clinics of the rheumatology

38

departments of 6 hospitals in Leiden, The Netherlands. The clinical nurse

specialist provided information about RA, prescribed, in consultation with the

rheumatologist, and provided joint splints, adaptive equipment and other house

adaptations if necessary. On an average, the duration of care provided by the

nurse specialist was 12 weeks with a mean of 3 appointments per patient. Both

day care and inpatient care teams consisted of nurses, a rheumatologist, an

occupational therapist, a physical therapist, and a social worker. Both inpatients

and day patients were prescribed a treatment programme of equal intensity

tailored to the individual patient needs. Inpatients stayed overnight in the clinic

for 12 consecutive days. On the other hand, day care patients stayed for 3 days

a week (10am to 4pm) for 3 weeks with a fixed bed rest for 1.5 hours. After the

intervention, the patients in all three groups received routine treatment from

their rheumatologist. Outcomes were assessed at the baseline, 6, 12, 26 and 52

weeks. There were significant improvements in functional status (measured with

the Health Assessment Questionnaire (HAQ)), quality of life (measured with the

RAND 36-item Health Survey 1.0 and the Rheumatoid Arthritis Quality of Life

(RAQoL) questionnaire), health utility (measured with the Health Utility Index

scale) and disease activity (measured with the Disease Activity Score (DAS))

from the baseline (all p < 0.05). However, there were no significant differences

between the three groups for any outcome measure except for patient

satisfaction; where patients in the clinical nurse specialist care were significantly

less satisfied than the patients in the inpatient care and day care (P<0.001).The

reasons for dissatisfaction, however, were not explored. This was probably due

to the fact that the patients in the other two groups were provided with more

intense care compared to the patients in the clinical nurse specialist care. But

the clinical benefit of all the interventions was similar. Since there were no

significant differences in any of the clinical outcomes between the three groups,

39

the authors would have been able to make a strong case for nurse-led care for

patients with RA by performing the cost-minimization analysis.

In a German primary care setting, Leonhardt et al. (2008) conducted a

cluster randomised controlled trial to evaluate the effectiveness of a

Transtheoretical Model (TTM) based motivational counselling approach by

trained practice nurses to improve physical activity among patients with low

back pain (LBP). TTM is a theory based counselling technique designed to

promote physical activity (Prochaska and DiClemente, 1983), and is often used

in combination with motivational interviewing (Miller and Rollnick, 1991). This 3-

arm cluster RCT compared motivational counselling by trained nurses (Group

A) to general counselling by the GPs (Group B) and usual care (Group C). The

GPs in group A and B were trained in using German LBP guidelines. However,

in Group B, the nurses received additional training in TTM-based motivational

counselling. Patients had up to three counselling sessions with the nurses, 15 to

20 minutes each. In the usual care group, the GPs received LBP guidelines in

mail with no training with regards to its implementation. Outcome measures

included a total physical activity score measured with the Freiburger

Questionnaire on Physical Activity (FQPA) (primary outcome) and a mean self-

efficacy score (secondary outcome) measured on a 1 to 5 numerical rating

scale (NRS), assessed at baseline, 6 and 12 months. The trial recruited 1378

LBP patients both with acute and chronic symptoms. One hundred and sixty

seven (12.1%) patients dropped out by 12 months. There were significant

improvements in patients’ physical activity in all study arms both at 6 and 12

months compared to the baseline. However, there was no significant

improvement in physical functioning when compared with the control (usual

care) group, indicating the lack of intervention effect. The lack of benefit could

40

be partly explained by the inadequate performance of the practice nurses,

implementation barriers within German healthcare system and the

heterogeneous sample.

Sørensen and Frich (2008) performed a cost consequence analysis,

based on an RCT, of a nurse-follow up intervention for chronic pain patients

discharged from a multidisciplinary pain centre in Copenhagen, Denmark. In

total, 102 chronic pain patients attending a multidisciplinary pain centre at a

university hospital were randomised into a control and intervention group, and

followed up for two years. Over two years, the nurses visited patients 7 times in

total (every fourth month). The purposes of these visits were to: monitor

pharmacotherapy and side effects, and refer to the GP if required; reinforce

patients’ knowledge about chronic pain and coping strategies; and detect

symptoms depression associated with pain. There were no statistically

significant differences in the health status, measured by SF-36, between the two

groups. The cost of the nurse intervention was €35,000 (£29,066) over the two

years, with an average cost of €648 (£538) per patient. Although not statistically

significant, patients in the control group used more health resources worth

€7046 (£5851) compared with €4004 (£3325) (difference €3460 (£2873), 46%).

However, the overall cost of the intervention was much more than the savings

on the usage of other health resources. Therefore the intervention was not

deemed to be cost-effective.

2.7.2 Systematic reviews

The literature search found three systematic reviews (Sindhu, 1996,

Castillo-Bueno et al., 2010, Ndosi et al., 2011). One of the systematic (Sindhu,

1996) reviews evaluated the effectiveness of non-pharmacological nursing

interventions among patients with acute pain, therefore it is not presented here.

41

Castillo-Bueno et al. (2010) conducted a systematic review to evaluate

the effectiveness of nursing interventions, specifically non-pharmacological, in

the management of chronic pain. There are two important aspects in terms of

the design of the systematic review: Firstly, the authors used a six-month cut

off, instead of a more frequently used 3-month cut off, to define chronic pain in

the systematic review. Secondly, the inclusion criteria also included quasi-

experimental studies in addition to the RCTs. Of the 1666 articles retrieved,

eight randomised controlled trials were included in the review. The authors were

unable to undertake meta-analysis due to heterogeneity among the included

studies in terms of study population, nature of intervention and duration of

follow-up. Of the eight trials included, two trials evaluated the effectiveness of

music as a nursing intervention for the management of chronic pain (McCaffrey

and Freeman, 2003, Siedliecki and Good, 2006); one trial each evaluated

cognitive behavioural therapy (Becker et al., 2000), psycho-education

programme (Lefort et al., 1998), physical exercise programme (Simmons et al.,

2002), magnetic field therapy (Kim, 2001), guided imagery (Mannix et al., 1999),

and sensorial simulation (Schofield et al., 1998). The review found that the

cognitive behavioural and the sensorial stimulation programmes were effective

in reducing perceived pain, and psycho-education and music therapy

programmes reduced osteoarticular pain. Guided imagery and magnetic field

therapy benefited patients with chronic headache while physical exercise

programme improved mobility among elderly but did not relieve pain. However,

the clinical significance of these findings were not demonstrated in the review.

Furthermore, it should be noted here that, since the meta-analysis was not

undertaken, the findings of this systematic review were based on the findings of

small 1 to 2 individual trials for each nursing intervention. Therefore, no

conclusive evidence can be drawn to support the effectiveness of these

42

interventions in chronic pain management from this systematic review.

Furthermore, the cost-effectiveness of these findings were not demonstrated in

the review. Despite these limitations, the review authors concluded that these

interventions were effective, except the physical exercise programme, and

should be considered in addition to the standard pharmacological treatment for

the management of chronic pain. On the contrary, this author believes that the

use of these interventions in routine clinical practice should not be

recommended until more high quality evidence is available to support their

effectiveness.

Ndosi et al. (2011) conducted a systematic review of randomised

controlled trials to compare the effectiveness of nurse-led interventions with

usual care among rheumatoid arthritis patients. The review included 4 RCTs

involving 431 patients in total. The included trials had an overall low risk of bias

and followed up patients for 1 to 2 months. Three trials were reported from the

UK and one from the Netherlands. There were no statistically significant

differences between the groups (usual care vs nurse-led care) for the two

disease activity scores (DAS) primary outcomes; DAS 28 (ratio of means (RoM)

= 0.96, 95%CI [0.90–1.02], P= 0.16); and plasma viscosity (RoM = 1 95%CI

[0.8–1.26], p= 0.99). However, significant improvement was noticed in the

Ritchie Articular Index (RoM = 0.89, 95%CI [0.84–0.95], P<0.001) in the nurse-

led care group compared with the usual care group. Furthermore, statistically

significant improvements were found in the nurse-led care group compared to

the usual care group for quality of life (RAQoL RoM = 0.83, 95%CI [0.75–0.92],

P<0.001), patient knowledge (PKQ RoM = 4.39, 95%CI [3.35–5.72], P<0.001)

and fatigue (median difference = - 330, P= 0.02). However, statistically non-

significant differences were reported for other secondary outcomes including

43

functional status, stiffness and coping with arthritis. Interestingly, the results of

two of the secondary outcomes (satisfaction and pain) varied in their statistical

significance when assessed using different tools. In summary, the systematic

review and meta-analysis could not generate conclusive evidence to support the

nurse-led interventions in the management of RA, necessitating more good

quality RCTs to strengthen the evidence.

To summarise, the RCTs evaluating the effectiveness of the nurse-led

interventions have documented mixed results. The RCTs varied in terms of the

nature of intervention, patient population, duration of follow up, settings and

outcomes measures. Due to this heterogeneity, systematic review authors were

unable to undertake meta-analysis. Subsequently, no conclusive evidence can

be drawn from the existing literature. However, it would not be incorrect to

conclude here that there is a potential role for nurses in the management of

chronic pain, but more high quality research work is required to identify the type

of patients who could benefit more from such services.

2.8 Combined nurse-pharmacist managed pain clinics

Despite a number of studies supporting the role of nurses and pharmacists in

chronic pain management, examples of combined nurse-pharmacists managed

clinics are almost non-existent in the literature. This is perhaps due to the fact

that the role of pharmacists in chronic pain management is relatively new unlike

nurses who have traditionally been part of multidisciplinary pain management

teams. The author could only retrieve two studies evaluating the impact of

combined nurse-pharmacist managed pain clinics on patient reported

outcomes. One study was conducted by Weidemer et al. (2007) in the USA and

the other by Briggs et al. (2008) in the UK. The nature of the services, and type

of patients referred to the clinics were completely different in the two studies,

44

however there were some similarities in the roles of nurses and pharmacists

within both of the services. This study was conceived in order to address the

limitations of the Briggs et al. (2008) study and to further evaluate the

effectiveness of a nurse-pharmacist managed chronic pain service. Since this

study was based on the Briggs et al. (2008) study, the working of the clinic,

limitations to the current evidence are presented in more detail to give

contextual background and rationale for this study (described below; section

2.8.1).

In the USA, Weidemer et al. (2007) conducted a naturalistic prospective

study to evaluate the impact of a combined nurse practitioner (NP) and clinical

pharmacist run pain management clinic in a large primary care medical centre,

the Opioid Renewal Clinic (ORC) For the ORC, the NP and clinical pharmacist

developed and implemented a structured approach to prescribing and

monitoring of opioids to ensure their safe and effective use. The overall aim was

to reduce abuse of opioids among patients. The NP and clinical pharmacist

were supported by a multidisciplinary team of consultants (psychiatrist,

rheumatologist, orthopaedist and neurologist)Limitations of single group pre-

post study designs have already been discussed earlier in this chapter (section

2.6.1). Patients were referred to the programme by their primary care

practitioners (PCP).. A multidisciplinary pain management team arranged bi-

weekly meetings with a nurse practitioner and clinical pharmacist and advised

them on treatment plans. The authors reported that ‘aberrant’ behaviours were

resolved in 77 (45%) of the 171 patients with documented ‘aberrant’ behaviour.

Furthermore, significant pharmacy cost savings were also reported. Twenty-two

patients were further referred for addiction treatment. No data on pain relief and

physical functioning were reported.

45

2.8.1 The nurse-pharmacist managed pain clinic (NPMPC)

The foundation of the clinic was laid with the establishment of the Community

Pain Forum in 2001 (Closs et al., 2011). The forum then undertook focus group

interviews involving 72 healthcare professionals to assess local needs for the

provision of chronic pain service (Briggs et al., 2004). In 2004, upon completion

of the pain service needs assessment project, a multidisciplinary Chronic Pain

Steering Group was set up consisting of representatives of the primary care

trust (PCT) and the Leeds Teaching Hospitals NHS Trust (LTHT) (Closs et al.,

2011). The group developed guidelines for the management of chronic pain and

proposed the establishment of a community-based pain clinic, jointly managed

by a nurse and a pharmacist. Subsequently the clinic was established and

started receiving chronic pain patients in 2005.

In order to provide the best possible professional service, a district nurse

(KM) underwent a specialized pain management training programme at an

associated hospital pain clinic. The services of a community pharmacist were

secured through a working arrangement between Boots Pharmacy and the

PCT. The community pharmacist worked for one day per week at the pain clinic.

To ensure a smooth work flow, comprehensive referral pathways and clinical

guidelines were also developed. The patients with chronic pain were referred

by general practitioners (GPs) either to the pharmacist-nurse managed pain

clinic or to secondary care based on local guidelines. For example, patients with

malignant pain, or psychiatric disorder were directly referred to secondary care.

However, if deemed necessary, the nurse and/or the pharmacist could further

refer any patient to secondary care. Together with the referral note, the GPs

also sent the details of patients’ and current and past medical and medication

history to the clinic.

46

Prior to the first consultation, while waiting to be seen by the nurse and

the pharmacist, the clinical nurse specialist (CNS) administered the Brief Pain

Inventory (BPI) (Cleeland and Ryan, 1994) to assess pain intensity, severity and

interference with daily activities; and the Hospital Anxiety and Depression Scale

(HADS) (Zigmond and Snaith, 1983) to assess anxiety and depression

(emotional functioning) to all patients. During consultation, the pharmacist

obtained all relevant medication and medical history. The pharmacist then

discussed any adverse effects and the degree of pain relief with the current

prescribed medication with the patient. Issues such as adherence to the

prescribed medicines and use of any over the counter (OTC) medicine or

complementary and alternative therapy were also explored during the

consultations. The pharmacist then reviewed patients’ medicines, provided

medication counselling and checked for drug interactions with the aim of

ensuring optimal use of analgesics through a concordant approach. The nurse

educated the patient about pain, clarified any misconceptions, and supported

the development of skills needed to self-manage. Finally, the pharmacist and

nurse discussed the future treatment plan with the patient and, where needed,

made recommendations to the GP. Safety and suitability of analgesic use was

assessed based on medical and medication history before making any

recommendation. The common medication related recommendations included:

dose adjustment, stopping a particular analgesic and addition or substitution of

analgesics (opioid to non-opioid or NSAID and vice versa). The GP then

reviewed the treatment and changed it as appropriate. During the follow-up

visits, the patients were seen only by the clinical nurse specialist unless

considered necessary by the clinical nurse specialist. BPI and HADS were also

administered on follow-up visits to monitor progress with the treatment. During

the follow up visits the clinical nurse specialist reinforced self-management

47

skills, provided further patient education, resolved any issues with medication

use and monitored patients for any adverse events. On average, the first

session lasted for one hour and the follow-up sessions lasted for 30–40 minutes

and the patient was usually discharged after three to four sessions. The clinic

received more than 150 to 200 new patients every year.

In 2012, the local PCT decommissioned the service, despite the fact that

the pilot study showed favourable outcomes and a mixed-methods study, this

one, was going on at that time. The services of the nurse pain specialist were

transferred to the musculoskeletal services. However, pharmacist services were

discontinued, a decision not based on existing evidence which supports the role

of pharmacist in chronic pain management. How the termination of the service

affected this study is highlighted later in the thesis (Chapter 5).

2.8.2 Research evidence

A pilot study was conducted by Briggs et al. (2008) to evaluate the impact of the

nurse-pharmacist managed pain clinic on pain intensity, using a retrospective

single group pre-test-post-test design. A research nurse (JB) who was not

involved in delivering the service collected data by reviewing patients’ clinical

notes available at the pain clinic. Sixty five patients were included in the study

with a mean age of 57 (SD 15) years. The discharge pain score was only

available for 37 patients. The pain intensity was assessed using an 11-point (0

to 10) Numerical Rating Scale (NRS). The authors reported a significant

reduction in pain score from a mean of 8 upon referral to 6.3 at discharge

(P<0.0001). Furthermore, referrals to secondary care were also reduced. Of the

120 patients attending the clinic, only 13 were further referred to secondary

care. However, the pilot study provided limited information about the nature of

the intervention, sociodemographic and clinical characteristics of patients

48

referred to the clinic, and the clinical significance of the effect size. Additionally,

the retrospective study design, small sample size, and the use of pain scores

alone as an outcome measure, further limits the usefulness of the findings. The

present study was designed to address these issues and develop robust

evidence to establish the effectiveness (or otherwise) of the nurse-pharmacist

managed pain clinic described above.

2.9 Aims and objectives

After carefully reviewing the existing literature, two main research gaps were

identified. Firstly, there was a lack of clear evidence to support the effectiveness

of pharmacist-led medication review in chronic pain management as RCTs have

reported inconsistent results. Secondly, further research evidence was required

to support the effectiveness of the nurse-pharmacist managed pain clinic and to

overcome the limitations of Briggs et al. (2008). As mentioned earlier, this clinic

provided an excellent example of public-private sector partnership in healthcare

settings. This was another important reason to further evaluate the

effectiveness of the clinic, so that, if effective, more such services could be

established widely. This thesis was set to fulfil these research gaps. Therefore,

the first aim was to conduct a systematic review to evaluate the effectiveness of

pharmacist-led medication review in chronic pain management. The objectives

were:

1. Does pharmacist-led medication review decrease pain intensity?

2. Does it reduce medication-related adverse effects?

3. Does it improve patients’ physical functioning and quality of life?

4. Are patients satisfied with the service provided by pharmacists?

49

The second aim was to evaluate the impact of a nurse-pharmacist managed

pain clinic (NPMPC) on patient reported outcomes.

The objectives were to:

1. study the socioeconomic and clinical characteristics of patients attending

the NPMPC.

2. assess the impact of NPMPC on pain intensity.

3. evaluate the impact of NPMPC on physical functioning, emotional

functioning and health related quality of life (HRQoL).

4. explore issues around patients’ satisfaction with the pain management

service provided by NPMPC.

50

CHAPTER 3

EFFECTIVENESS OF PHARMACIST- LED MEDICATION

REVIEW IN CHRONIC PAIN MANAGEMENT: SYSTEMATIC

REVIEW AND META-ANALYSIS

51

CHAPTER 3

EFFECTIVENESS OF PHARMACIST- LED MEDICATION

REVIEW IN CHRONIC PAIN MANAGEMENT: SYSTEMATIC

REVIEW AND META-ANALYSIS

3.1 Introduction

As described in the earlier chapter, mixed results have been reported by

the randomised controlled trials (RCTs) evaluating the effectiveness of

pharmacist led medication review in chronic pain management. With the aim of

generating substantial evidence, a systematic review of RCTs evaluating the

effectiveness of pharmacist-led medication review in chronic pain management

is reported in this chapter.

The chapter begins with a brief general overview of systematic reviews

and the importance of the development of a systematic review protocol and its

registration. That is followed by the discussion on the rationale of undertaking

the present systematic review, and then its aim and objectives are presented.

Then methods and results are described in detail. Finally, the results are

discussed and implications for future research and practice are suggested.

3.2 Systematic review: An overview

Chalmers and Altman (1995) described systematic review as a review

that has been assembled using a systematic approach, thoroughly described in

the methods section, to minimize bias and random errors. It aims to identify and

summarise relevant research evidence against pre-determined inclusion criteria

52

with the intention of answering a particular review/research question (Higgins

and Green, 2011). Since systematic reviews use pre-set inclusion criteria and

systematic methods to minimize biases, the results obtained are more reliable

thus facilitating the decision making process. The systematic review differs from

traditional literature reviews and commentaries as being reproducible,

transparent and less biased. Systematic reviews not only collate research

evidence but also identify research gaps.

Until recently, systematic reviews were only used in medical research to

synthesize evidence on the effectiveness of healthcare interventions by

combining data extracted from controlled trials. However, with the growing use

of qualitative and mixed-methods research designs in healthcare to inform

policy and practice, systematic review methods for qualitative and mixed-

methods research have also been developed in the last decade (Gough et al.,

2012). The detailed description of each method is beyond the scope of this

thesis. The choice of which data (quantitative, quantitative or both) to be used is

primarily determined by the scope of the review and the review questions. A

number of methods are available for the synthesis of qualitative research

including Meta-ethnography (Noblit and Hare, 1988), Meta-study (Paterson et

al., 2001), Meta-narrative (Greenhalgh et al., 2005), Critical Interpretive

Synthesis (Dixon-Woods et al., 2006), Frame work synthesis (Brunton et al.,

2006) and Textual Narrative synthesis (Lucas et al., 2007). Broadly, there are

two approaches to integrate qualitative and quantitative data in mixed-methods

systematic reviews: Multilevel synthesis (Thomas et al., 2004) and parallel

synthesis (Noyes and Popay, 2007). Quantitative systematic reviews synthesise

data obtained from primary studies either narratively or statistically. The

quantitative data for systematic review can be extracted from both randomised

53

controlled trials (RCTs) and non-randomised studies (epidemiological studies).

However, being considered as the ‘gold standard’ for measuring effectiveness

of a intervention, RCTs are the most frequently used research methodology in

systematic reviews especially for ‘what works’ systematic reviews.

The statistical combination of data from two or more primary studies is

referred to as meta-analysis (Higgins and Green, 2011). Meta-analysis

generally produces a single estimate of treatment effect (Huque, 1988) thereby

increasing the power and precision of the results of primary studies (Higgins

and Green, 2011). Other advantages of meta-analysis include resolving

disagreements between results of different primary studies, if any, and

answering unaddressed questions of primary studies. Therefore it is not always

feasible or reasonable to conduct a meta-analysis due to variations in research

design, differences in study population and quality of reported data within

primary studies. Meta-analysis of studies at high risk of bias and in the presence

of publication bias may also not be appropriate and may be criticised for

combining ‘apples with oranges’ (Higgins and Green, 2011). Meta-analysis can

be misleading if the above mentioned issues are not carefully considered. If

statistical combination is not possible in a review, data are combined narratively.

The process involved in conducting a systematic review is similar irrespective of

the type of data to be combined. The basic steps involved in conducting a

systematic review are shown in Figure 3.1.

54

Defining the scope of the review and review questions

Developing a comprehensive search strategy

Defining explicit inclusion and exclusion criteria for including studies

Rigorously selecting studies based on the inclusion and exclusion

criteria

Extracting relevant data from included studies

Analysing and synthesising extracted data

Interpreting and disseminating the results

Figure 3.1. Basic steps in conducting a systematic review

55

3.2.1 Systematic reviews in evidence-based medicine

“Evidence-based medicine (EBM) is the conscientious, explicit and

judicious use of current best evidence in making decisions about the care of

individual patients. The practice of evidence-based medicine means integrating

individual clinical expertise with the best available external clinical evidence

from systematic research” (Sackett et al., 1996, P. 71). Over the past two

decades, there has been an enormous increase in the volume of health related

published research and consequently it has become increasingly difficult for

researchers and practitioners to keep abreast of the latest findings. It is

impossible for healthcare professionals and policy makers to have the time,

expertise and resources to locate, read, critically appraise and interpret all

relevant research findings to make an informed decision about patient care

based on current evidence (Higgins and Green, 2011). Systematic reviews can

potentially resolve this problem by identifying, critically appraising, and

synthesising the research evidence. Depending on the research question, well

designed and conducted systematic reviews may provide the best research

evidence (Merlin et al., 2009); therefore they have an important position in

evidence-based medicine in guiding healthcare policies and informing clinical

decision-making.

3.1.3 The review protocol: Rationale and importance

A systematic review protocol details the research questions, search

strategy, inclusion/exclusion criteria and planned data analysis (Higgins and

Green, 2011). The protocol should always be written in advance to ensure

transparency and reproducibility. The PRISMA (Preferred Reporting Items for

Systematic Reviews and Meta-Analyses) guidelines (Moher et al., 2009) also

recommend the development of and adherence to systematic review protocols

56

to avoid the introduction of bias. Changes in protocol may be necessary but

should always be reported together with the reason in the review (Moher et al.,

2009). Changes such as adding or removing outcomes, or performing

unplanned subgroup analyses have the potential to introduce bias and the

prospective registration/publication of protocols can help safeguard against

these biases as it allows the reader to compare what was planned (protocol)

with what has been reported in the finished systematic review (Stewart et al.,

2012). Furthermore, registration helps researchers in complying with PRISMA

guidelines and increasing awareness of their review (Stewart et al., 2012).

In order to ensure transparency and avoid duplication, the systematic

review protocol was registered with PROSPERO, an international register for

prospective registration of systematic reviews developed and maintained by the

National Institute of Health Research’s (NIHR) Centre for Reviews and

Dissemination (CRD) at the University of York, UK. (Registration number:

CRD42012001957) and published in the Canadian Pharmacists Journal (Hadi

et al., 2012). PROSPERO is the only international online resource to register

systematic reviews in healthcare (Centre for Reviews and Dissemination, 2012).

3.2 Rationale for the review

The management of chronic pain is complex as chronic pain does not

only interfere with physical functioning but also causes deterioration in

emotional functioning and quality of life. Accessibility and affordability of

multidisciplinary pain clinics further complicates its management. A large

European survey reported that one-third of the chronic pain patients were not

receiving any treatment and 40% were inadequately managed.

57

Medications are widely employed for the treatment of chronic pain and

pharmacists, being experts in pharmacotherapy, have a potential role in chronic

pain management by ensuring the safe and effective use of medicines. Sub-

optimal use of analgesics (Hanlon et al., 1996), inadequate monitoring of repeat

prescriptions (The Accounts Commission for Scotland, 1999), and self-

medication with over the counter (OTC) analgesics in combination with

prescribed analgesics resulting in overdosing (polypharmacy) (Porteous et al.,

2005) have been reported in the literature, and pose a threat to the successful

management of chronic pain.

Medication review is a structured critical examination of a patient’s

medicines with the aim of optimising medicines use, preventing medication-

related problems and reducing waste, in an agreement with the patient

(Taskforce on Medicines Partnership and The National Collaborative Medicines

Management Services Programme, 2002). Medication review has the potential

to overcome all the above mentioned obstacles in the management of chronic

pain. Theoretically, pharmacist-led medication review may improve pain-related

outcomes by optimising the choice and dose of analgesics, improving

adherence to prescribed medication, reducing adverse effects and resolving

drug-related problems (DRPs). However, limited and inconsistent clinical and

research evidence is available to support these claims in the context of chronic

pain (Suh et al., 2004, Weitzel et al., 2004, McDermott et al., 2006, Phelan et

al., 2008). A well conducted systematic review has the potential to generate

conclusive quality evidence to support, or refute, the effectiveness of

pharmacist-led medication review in chronic pain management. However, to

date, no systematic review has evaluated the effectiveness of pharmacist-led

medication review for chronic pain management. This systematic review was

58

undertaken to fulfil this important research gap and to resolve controversies

surrounding the effectiveness of pharmacist-led medication review in chronic

pain management.

3.2.1 Aim and objectives

As highlighted earlier, the aim of this systematic review was to evaluate

the effectiveness of pharmacist-led medication review in chronic pain

management in adult patients. The specific research questions were:

1) Does pharmacist-led medication review decrease pain intensity?

2) Does it reduce medication-related adverse effects?

3) Does it improve patients’ physical functioning and quality of life?

4) Are patients satisfied with the service provided by pharmacists?

3.3 Methods

3.3.1 Study selection

The following databases were searched using pre-defined search strategy. The

searches were conducted during April-June 2012.

MEDLINE (via Ovid) …….(1946 to June 2012),

EMBASE (via Ovid)…….. (1947 to April 2012)

Cochrane Central Register of Controlled Trials……. (Issue 6 of 12, June

2012)

Cumulative Index to Nursing and Allied Health Literature (CINAHL)

(via EMBSCO)….. (1960 to June 2012),

PsycINFO……….. (1806 to June 2012)

International Pharmaceutical Abstracts (via Ovid)…….. (1970 to June

2012)

59

Randomised controlled trials (RCTs) and non-randomised studies (quasi-

experimental, controlled before-and-after study) having at least one control

group were considered for inclusion. Non-randomised studies were only to be

considered for inclusion if less than three randomised controlled trials were

eligible for inclusion (Karjalainen et al., 2003). Waiting list controls, usual care,

attention only and any other active control were accepted as appropriate

controls. Studies were considered for inclusion if one of the arms received either

pharmacist-led medication review delivered independently, or as part of more

complex multidisciplinary interventions, provided that the pharmacist was part of

the multidisciplinary team. In addition to database searches, websites of

American, Canadian and Royal (British) Pharmaceutical societies were also

searched together with the reference lists of the retrieved articles to identify any

additional eligible studies. Studies published only in English language (full text

or abstract) were considered. The corresponding authors of the included studies

were contacted to obtain additional information where required and to identify

any other unpublished studies. An example of the search strategy is presented

in Appendix I.

The search strategy was developed in consultation with an experienced

health science librarian. The process of study selection involved three steps 1)

The author ran the pre-defined specific search strategy on each of the chosen

databases. All the searched results were exported to an Endnote file. 2) Study

titles and abstracts of the studies were screened independently by the author

and one of his supervisors (DPA). Disagreements were resolved through

discussion and if agreement was not reached, another supervisor (MB) was

consulted. Full texts of all studies considered potentially relevant studies were

60

retrieved. 3) Finally, the author and one of his supervisors (DPA) independently

selected studies meeting the pre-defined and pilot-tested inclusion criteria.

3.3.2 Types of participants

Studies involving chronic pain patients 18 years and older were included

regardless of their gender, type and aetiology of chronic pain. In this systematic

review, The International Association for the Study of Pain (IASP) definition of

chronic pain: “Pain without apparent biological value that has persisted beyond

the normal tissue healing time (usually taken to be 3 months)” was used

(International Association for the Study of Pain, 1986). Studies involving

patients with malignant or cancer pain were excluded as these would have

introduced clinical heterogeneity.

3.3.3 Outcome measures

The primary outcome measure was pain intensity measured using a

validated scale (e.g. numerical rating scale). The secondary outcome measures

included: 1) reduction in adverse effects; 2) physical functioning measured

using a validated scale (e.g. Brief Pain Inventory); 3) patient satisfaction using a

validated scale; and 4) quality of life measured using a validated scale (e.g. SF-

36).

3.3.4 Assessment of risk of bias

The risk of bias was assessed for all the included studies by the author

and checked by one of his supervisors (SJC) using a standardised form

(Appendix II). Bias is a “systematic error or deviation from the truth, in results or

inferences” (Higgins and Green, 2011, P.188). Bias attributed to a particular

design deficiency (e.g. lack of allocation concealment) may inflate the effect size

in one study and deflate it in another (Higgins and Green, 2011). A number of

61

scales and checklists exist in the literature to assess ‘quality’ or risk of bias in

randomised controlled trials but the use of these quality scales and checklists is

discouraged (Higgins and Green, 2011) as the scales give unreliable

assessments of validity (Jüni et al., 1999) and lack transparency (Higgins and

Green, 2011). Therefore, the risk of bias was assessed using the Cochrane

Collaborations’ tool for assessing risk of bias (Higgins and Green, 2011), a

domain-based evaluation rather than a checklist or scale, covering the following

criteria: 1) random sequence generation; 2) allocation concealment; 3) blinding

of participants and personnel; 4) blinding of outcome assessment; 5) incomplete

outcome data and; 6) selective reporting and other bias (e.g. baseline

differences between control and active arms, use of invalid questionnaires). For

cluster randomised controlled trials, risk of bias was assessed across additional

domains including loss of clusters and appropriate statistical analysis. Each

domain was assessed and categorised into low risk of bias, high risk of bias or

unclear risk of bias based on the recommendations of Higgins and Green

(2011). Disagreements were resolved through discussion and if consensus was

not reached a third reviewer (MB) was consulted.

3.3.5 Data extraction

Data was extracted by the author (MAH) and checked by one of his

supervisors (MB) using a standardised data collection form. The data collection

form was pilot tested. Disagreements were resolved through discussion, and if

no consensus was reached, opinion of a third reviewer (SJC) was requested.

3.3.6 Data synthesis

The data was analysed using the Cochrane Collaboration’s software

Review Manager (RevMan 5.1). For all continuous variables (e.g. pain

intensity), mean difference (MD) was calculated when outcomes were

62

measured using the same scale and standardised mean difference (SMD) when

different scales were used with corresponding 95% confidence intervals. For

dichotomous variables, relative risk (RR) with 95% confidence intervals was

calculated. Pooling of data using meta-analysis was performed depending on

the clinical homogeneity in terms of the population, intervention, outcome

measures and timing of outcome measures.

Clinical heterogeneity was determined by discussion among the author

and his supervisors, and clinically heterogeneous trials were not combined

statistically. Statistical heterogeneity was determined by using chi-square (χ2)

and I2 statistic. Statistical heterogeneity determined the choice of using random-

effects model or fixed-effects model for meta-analysis. A χ2

P value of greater

than 0.1 and an I2 value of less than 50% was used to indicate statistical

homogeneity (Higgins and Green, 2011). Random-effects model was used to

combine clinically homogeneous but statistically heterogeneous clinical trials,

whereas clinical and statistical homogenous trials were combined using the

fixed-effects model.

63

Figure 3.2. Work flow of this systematic review

64

3.4 Results

3.4.1 Study characteristics

Six hundred and sixty-four articles were retrieved through database

searches (578 after deduplication). Of these 578 articles, 27 were considered

relevant to the review after initial title and abstract screening. An additional five

articles were found through other sources including two each through author

contact and reference list searching, and one through website searching. Of

these 32 articles, nine reports from five studies met the inclusion criteria for

review (Marra et al., 2008, Bruhn et al., 2011b, Phelan et al., 2008, Hoffmann et

al., 2008, Hay et al., 2006, Bond et al., 2011, Bruhn et al., 2011a, Marra et al.,

2012, Gammaitoni et al., 2000). Figure 3 shows a PRISMA flow diagram to

explain the search process and the reasons for exclusion from the review. Two

trials were conducted in the UK (Hay et al., 2006, Bruhn et al., 2011a) and one

each in Canada (Marra et al., 2012), Germany (Hoffmann et al., 2008) and the

USA (Gammaitoni et al., 2000) .

The included studies consisted of three individually randomised (Hay et

al., 2006, Gammaitoni et al., 2000, Bruhn et al., 2011a) and two cluster

randomised controlled studies (Marra et al., 2012, Hoffmann et al., 2008)

randomising 1035 patients in total. All trials followed up the patients for at least

3 months. Three trials followed-up patients for 6 months and one trial for 12

months. All studies had their first follow-up at 3 months except for Hoffman et al

study (2008) where the first (and the last) follow-up was made at 4 months. In

total, 131 patients (12.7%) were lost to the first follow-up. Two trials included

patients with chronic pain of various aetiologies (Bruhn et al., 2011a,

Gammaitoni et al., 2000), another two involved patients with knee pain

65

associated with osteoarthritis (Hay et al., 2006, Marra et al., 2012) and one trial

involved chronic headache and migraine patients (Hoffmann et al., 2008). In

four trials where gender was reported, the majority of the participants were

females (61.8%). The mean age of participants varied between 62.7 years (SD

± 9.2) in Marra et al. (2012) study, 67.9 years (SD ± 8.2) in the Hay et al. (2006)

study and 42.70 years (SD ± 13) in the Hoffman et al. (2008) study. The study

by Bruhn et al. (2011) did not report age and participants in the Gammaitoni et

al. (2000) study ranged from 35-64years.

66

Figure 3.3. PRISMA flow diagram

67

3.4.2 Nature and delivery of intervention

In three trials (Bruhn et al., 2011a, Hay et al., 2006, Hoffmann et al.,

2008), the intervention group received pharmacist-led medication review alone

where as in the other two trials (Marra et al., 2012, Gammaitoni et al., 2000) the

intervention group received medication review as part of a multi-component

intervention. In the Gammaitoni et al. trial (2000), the intervention comprised of

two components. The first component was a specialised prescription service

provided by a palliative care pharmacy company (PainRxperts) which delivered

patients’ medication to their home or to the clinic, when requested. The aim of

the service was to improve accessibility to pain medicine and to reduce the

burden of managing medication treatment for clinical practice. The second

component was proactive monitoring of patients’ medication therapy for any

potential or actual drug related problem (DRP) by a palliative care trained

pharmacist, with an access to patients medical records, to ensure that the drug

therapy was achieving desired patient outcomes (i.e. improvement in quality of

life). In total, 81 phone calls were made by the pharmacist including 45 to

patients (mean 1.2 calls per patient) and 36 to the clinic staff. Majority of the

calls were made for patient monitoring/administration of Brief Pain Inventory

(BPI) (n=36), questions related to medication use (n=22) and delivery of

medications (n=11). On average, each contact with the patient lasted 12

minutes and 9 minutes for clinic staff. Fifteen out of sixteen recommendations

made to the clinic staff were accepted which included: addition of an adjuvant

(n=4), change drug (n=2), change dose (n=3), change frequency (n=2), dosing

conversion (n=5) The control group received usual care as prior to study with

the exception of filling in questionnaires at baseline and 3 months follow-up.

68

In the Marra et al. study (2012), the intervention comprised of two

components as well (medication review and physiotherapist guided exercise).

The patient had a face to face consultation with a pharmacist who educated

patients on various aspects of osteoarthritis (OA), conducted medication review

to ensure safe use of analgesics, referred patients to a physiotherapist-guided

exercise programme (second component) and requested patients’ primary care

physicians to approve their inclusion. It was not made clear whether the

pharmacists had an access to patients’ electronic medical records or not. Over

the 6 months follow-up period, 297 patient-pharmacist contacts were recorded

resulting in 255 comments and recommendations, including 49 medication-

related recommendations to patients’ primary care physician. The pharmacist

also followed-up with the patients each month for six months to monitor their

progress. The physiotherapist recommended an individualised home exercise

programme after a one-hour consultation with each patient. The participants

attended an exercise class twice per week for six weeks. Participants in the

control group received an educational leaflet on knee OA developed by the

Canadian Arthritis Society

In the Hay et al. study (Hay et al., 2006, Phelan et al., 2008), there were

two independent intervention groups: pharmacy review group and community

physiotherapy group. Data of the pharmacy review group were only extracted

for this systematic review. Together with an education leaflet, participants in the

pharmacy review group received an enhanced pharmacy review by an

experienced community pharmacist in general practice surgeries with access to

patients’ medical records. The trial protocol permitted three to six sessions of

approximately 20 minutes each over 10 week period. The pharmacist used a

pre-defined set of questions for initial assessment and optimized/changed drug

69

therapy, if necessary, based on an algorithm after accounting for personnel

preferences and clinical needs. In total, 335 pharmacist-patient consultations

took place (mean 3.2 per patient; range 2-5). The mean amount of time spent

per patient was around 63 minutes in 3 sessions. Participants in the control

group received the same education leaflet and a telephone call from a

rheumatology nurse to reinforce the advice on the leaflet within seven days of

randomization.

In the Hoffmann et al. study (2008), participants in the intervention group

received an individualised counselling session by trained community

pharmacists with the aim of optimising pharmacotherapy, promoting self-

management, goal setting and pacing activities. It was not clearly reported

whether the community pharmacists were given access to patients’ electronic

medical records or not. During intervention phase, each patient received

approximately two hours of counselling and each pharmacy counselled 4.6 ±

3.06 patients on average (range 1-15). Participants in the control group

continued to receive usual pharmaceutical consultations with pharmacists who

were not formally trained in headache/pain management.

In the Bruhn et al. study (Bruhn et al., 2011a, Bruhn et al., 2011b, Bond

et al., 2011), there were two independent intervention groups as well:

pharmacist medication review with recommendations to the GP and pharmacist

medication review with pharmacist prescribing. Pharmacists in the intervention

arms had access to patients’ medical records. Further data on the nature and

duration of the intervention were not available at that time. Authors were

contacted to obtain additional data but the request was declined due to

restrictions from the funding agency.

70

Table 3.1. Characteristics of included studies

Study/Year

country

Trial

design

Setting Sample recruited

(completed)

Follow

up

(months)

Intervention Dose of intervention Pharmacist

trained in

pain

management

Gammaitoni

et al/

2000

(USA)

I-RCT University

pain clinic

N=74

I=38 (20)

C=36(21)

3 MR through

telephone

interviews, and a

specialized

prescription

delivery service.

81 phone calls (45 to

patients and 36 to clinic

staff managing patients)

were made in 12 weeks.

Mean 1.2 calls per patient.

Yes

Hay et

al/2006

(UK)

I-RCT General

practice

N=325*

I=108(100,103,99)

C=108(92,98,90)

3, 6 and

12

MR and advised

patients face-to-

face individually

based on leaflet

3 to 6 sessions of 20min

each over 10 weeks

Not known

Hoffmann et

al/2008

(Germany)

CRCT Community

pharmacy

N=410

I=201 (163)

C=209 (194)

4 Face-to-face MR

plus advice on

pacing activities

and goal setting.

Each pharmacy

counselled on average

4.6±3.01 patients (range 1-

15) for 2hrs/per patient.

Yes

71

Bruhn et

al/2011

(UK)

I-RCT General

practice

N=196*

I=70(60,58)

I**=63(50, 49)

C=63(54,55)

3 and 6 MR plus

recommendations

to the GP

Data not available

Yes

Marra et

al/2012

Canada

C-RCT Community

pharmacy

N=139

I=73(72)

C=66(65)

3 and 6 MR + education+

Physiotherapist

guided exercise

297 pharmacist-patient

follow ups were

performed over 6 months

resulting in 355

recommendations to

patients’ primary care

physicians (4.8

recommendations/patient)

Yes

*Two intervention groups in trial. ** The second intervention group also received medication review as part of intervention. Data for only one

intervention group is presented here. I-RCT=Individual randomised controlled trial, C-RCT= Cluster randomised controlled trial, MR=

Medication review, GP=General Practitioner, I=Intervention group, C=Control group.

72

3.4.3 Risk of bias

Three trials (Marra et al., 2012, Hay et al., 2006, Gammaitoni et al., 2000)

described adequate methods for random sequence generation (Figure 3.4). Hay

et al. (2006) used a random number generator which allocated the participants

in intervention and control groups in pre-determined sequence blocks of six by

general practice. The study statistician generated values from a uniform (0, 1)

distribution in the Marra et al. (2012) study and a computer programme was

used to randomly assign the names to either the intervention group or the

control group in the Gammaitoni et al. (2000) trial. However, Gammaitoni et al.

(2000) did not describe how the selection of 107 patients from pain clinics was

undertaken prior to this random allocation to groups. Methods of random

sequence generation were not adequately explained by Bruhn et al. (2011a)

and Hoffman et al. (2008). Only Hay et al. (2006) described an adequate

method of allocation concealment (sequentially numbered opaque envelops).

Since Marra et al. (2012) and Hoffmann et al. (2008) were cluster randomised

trials, allocation concealment was not possible and is not considered an issue

(Higgins and Green, 2011).

In all the trials, it was impossible to blind pharmacists delivering the

intervention and the participants receiving it due to the nature of intervention.

However, it would have been possible to blind outcome assessors of the

allocation of participants to minimize detection bias. Outcome assessors were

blinded in two trials only (Marra et al., 2012, Hay et al., 2006). Hoffmann et al.

(2008) collected data through a computer aided, standardised telephone

interview but it was not made clear whether people who handled and analysed

the data were blinded or not.

73

All trials (Hay et al., 2006, Marra et al., 2012, Hoffmann et al., 2008,

Bruhn et al., 2011a) except one (Gammaitoni et al., 2000) used the intention to

treat principle for analysing their data thus minimizing attrition bias. There was

low risk of selective reporting of an outcome across four trials (Hay et al., 2006;

Marra et al., 2012; Hoffmann et al., 2008; Gammaitoni et al., 2000) and unclear

risk in one of the trials (Bruhn et al., 2011a). Although, the study protocol was

available for only one study (Marra et al., 2012), the decision was made to

assign low risk to other trials based on the fact that the authors reported

outcomes with non-significant P-values as well.

Figure 3.4. Risk of bias in included trials across each domain

There were no baseline differences between intervention and control

groups in any of the trials except one (Marra et al., 2012). In the Marra et al.

(2012) trial, there were significant differences at baseline in pain scores

measured by the Health Utilities Index-3, a generic instrument to measure

quality of life, between intervention and usual care groups but there were no

significant differences in pain scores when measured by the Western Ontario

Random sequence generation (selection bias)

Allocation concealment (selection bias)

Blinding of participants and personnel (performance bias)

Blinding of outcome assessment (detection bias)

Incomplete outcome data (attrition bias)

Selective reporting (reporting bias)

Baseline differences

Invalid questionnaires

Loss of clusters

Appropirate statistical analysis (Cluster RCTs)

0% 25% 50% 75% 100%

Low risk of bias Unclear risk of bias High risk of bias

74

and McMaster Universities Osteoarthritis Index (WOMAC) pain subscale.

Furthermore, participants in the intervention group were slightly more educated

(86% reported more than high school education compared to 79%), belonged to

higher socioeconomic class (71% reported an income over $50,000 compared

to 59%) and were of Asian origin (21% compared to 9%) compared with the

usual care group.

Only one patient was lost to follow up in each group in the Marra et al.

(2012) study and the authors took “clustering” into consideration in sample size

calculation and data analysis. However, in the cluster randomised controlled

trial by Hoffmann et al. (2008), the authors did not use appropriate statistical

techniques and did not allow for the clustering effect in sample size calculation

and data analysis.

75

Figure 3.5. Risk of bias across individual trials. = unknown risk,

= high risk = low risk

Rando

m s

equ

en

ce

gen

era

tion

(sele

ction

bia

s)

Bruhn 2011 ?

Gammaitoni 2000 +

Hay 2006 +

Hoffman 2008 ?

Marra 2012 +

Allocation c

oncealm

ent (s

ele

ction b

ias)

?

?

+

+

+

Blindin

g o

f part

icip

ants

and p

ers

onnel (p

erf

orm

ance b

ias)

Blindin

g o

f outc

om

e a

ssessm

ent (d

ete

ction b

ias)

?

?

+

?

+

Incom

ple

te o

utc

om

e d

ata

(a

ttrition

bia

s)

+

+

+

+

Sele

ctive r

eport

ing (

report

ing b

ias)

?

+

+

+

+

Baseline d

iffe

rences

+

+

+

+

Invalid q

uestion

na

ire

s

+

+

+

+

Loss o

f clu

ste

rs

?

+A

ppro

pirate

sta

tistical analy

sis

(C

luste

r R

CT

s)

+

?

- +

76

3.4.4 Outcomes assessment

3.4.4.1 Pain intensity

Pan intensity was reported in the all the trials but used different scales.

Gammaitoni et al. (2000) measured pain intensity on a 0 to 10 numerical rating

scale where 0 = no pain and 10 = pain as bad as you can imagine as part of the

Pharmacotherapeutic Pain Inventory (PhPI), a survey instrument derived from

the Brief Pain Inventory (Cleeland and Ryan, 1994) and the Health Background

Questionnaire-Initial Patient Visit (Gallagher, 2000). Hay et al. (2006) reported

pain intensity on a 0 to 10 numerical rating scale where 0 = no pain and 10 =

pain as bad as you can imagine and on a 0 to 20 subscale of WOMAC

(Bellamy, 1996). Bruhn et al. (2011b) assessed pain intensity using the pain

intensity subscale of the chronic pain grade questionnaire (CPG), a 7-item

questionnaire to measure pain intensity, severity and functional disability (Von

Korff et al., 1992). Marra et al. (2012) measured pain intensity on a 0 to 10 pain

subscale of WOMAC while Hoffman et al. (2008) measured it on a 1 to 10

numerical rating scale where 1 = no pain and 10 = pain as bad as you can

imagine. Although pain intensity was measured using different scales in

Gammaitoni et al. (2000), Hay et al. (2006) and Mara et al. (2012), all the scales

ranged from 0 to 10 where 0 = no pain and 10 = pain as bad as you can

imagine.

Of the five trails, four reported statistically significant reduction in pain

scores at follow-up (Hay et al., 2006, Hoffmann et al., 2008, Bruhn et al., 2011b,

Marra et al., 2012). Gammaitoni et al. (2000) reported a reduction in pain scores

which was not statistically significant (p=0.67) at 3-month follow up. Although,

Hay et al. (2006) reported a statistically significant reduction in pain scores at 3-

month follow-up (p=0.04), the pain scores were statistically non-significant at 6

77

(p = 0.3) and 12 months (p=0.5). However, Marra et al. (2012) reported a

statistical significant reduction at both 3 and 6 months follow-ups (both p<0.05).

In the study by Hoffmann et al. (2008), there was a significant reduction in

‘untreated’ pain intensity in both intervention (p<0.001) and control group

(p<0.001); however, reduction in ‘treated’ pain intensity remained non-

significant in both intervention (p=0.52) and control groups (p=0.92) at 4-month

follow-up.

Pain scores were pooled using meta-analysis. Since the study by

Hoffmann et al. (2008) involved patients with chronic headache and migraine it

was deemed clinically heterogeneous and not combined statistically. The data

reported by Bruhn et al. (2011b) were insufficient for meta-analysis. Therefore,

data from three RCTs only were pooled statistically. As described earlier, pain

intensity was measured on different scales therefore the standardised mean

difference (SMD) and corresponding standard error was calculated for each of

the three studies. For the purpose of meta-analysis, change in score from

baseline rather than final score was used as the former is more efficient and

powerful as it eliminates between-person variability (Higgins and Green, 2011).

But if the ‘adjusted’ change in score derived from regression model accounting

for baseline measurements was reported, it was preferred over the crude

change in score to calculate SMD, as statistically, adjusted scores are

considered most precise and least biased (Higgins and Green, 2011). Meta-

analysis was undertaken at 3 and 6 month follow-ups.

Compared to the control group, there was a significant reduction in pain

intensity in the intervention group with SMD of – 0.37 (95% confidence interval -

0.58, - 0.16) (Figure 3.6). This corresponds to a 0.83 point reduction on a 0 to

10 numerical rating scale where 0=no pain and 10 pain as bad as you can

78

imagine (95% confidence interval -1.28, - 0.36). There was no heterogeneity in

the result (I2=0%). Only two studies (Hay et al., 2006, Marra et al., 2012)

reported pain intensity at 6-months. At 6 months, there was also a significant

reduction in pain intensity in the intervention group compared to the control with

SMD – 0.31 (95% CI -0.53, - 0.09) corresponding to a 0.7 point reduction on a 0

to 10 numerical rating scale (95% CI -1.19, - 0.20). There was slight

heterogeneity in the result (I2=39%) [Chi

2=1.64, df=1, p=0.20] which is

statistically considered non- significant (Higgins and Green, 2011).

3.4.4.2 Physical functioning

Physical functioning was assessed as an outcome measure in all the

studies. Marra et al. (2012) and Hay et al. (2006) assessed physical functioning

using a 0 to 10 and 0 to 68 physical functioning subscale of WOMAC

respectively (Bellamy, 1996). Higher scores on the WOMAC subscale

represented worse (limited) physical functioning. Hoffmann et al. (2008) and

Bruhn et al. (2011b) used the physical health subscale of SF-36 (Ware and

Sherbourne, 1992) and SF-12 (Ware Jr et al., 1996) respectively to assess

physical functioning. Gammaitoni et al. (2000) assessed pain interference with

various daily activities (general activity, mood, waking, normal work,

relationships, sleep and enjoyment of life) as part of PhPI, a survey instrument

derived from the BPI (Cleeland and Ryan, 1994) and the Health Background

Questionnaire-Initial Patient Visit (Gallagher, 2000). But instead of reporting a

recommended summary score calculated from these seven interference items

(Cleeland and Ryan, 1994), the authors reported each item individually.

Marra et al. (2012) reported a statistically significant improvement in

physical functioning at 3-months [-0.65; 95% CI (-1.20 to -0.10)] and 6-months [-

0.84; 95% CI (-1.45 to -0.24)] in the intervention group compared to the control.

79

Hay et al. (2006) reported a non-significant improvement in functioning at 3-

months [-2.12; 95%CI(-0.5 to 4.8)], 6 months [-0.96 ; 95% CI(-4.0 to 2.1)] and

12 months [-0.39; 95% CI (-3.8 to 3.0)] in the intervention group. Compared

with the control group, Gammaitoni et al. (2000) reported non-significant

improvement in pain interference with mood (p=0.07), general activity (p=0.37),

walking (p=0.92), work (p=1.00), relationships (p=0.72), sleep (p=0.62) and

enjoyment of life (p=0.76) at 3-months follow up. Similarly, Hoffmann et al

(2008) reported a non-significant improvement in physical health (p=0.85) at the

end of the 4-month study period. Bruhn et al (2011b) also reported a non-

significant improvement in physical health (p=0.75) at 6-months follow-up.

Data were pooled using meta-analysis for three studies excluding

Hoffman et al. (2008) for clinical heterogeneity and Bruhn et al. (2011b) for

insufficient data. Meta-analysis was undertaken at 3 and 6 months follow-up. At

3-month follow-up there was a statistically significant improvement in the

intervention group with SMD of -0.38 (95% CI -0.58, -0.18) compared to the

control group (Figure 3.7). This effect is equivalent to 4.84 points (95% CI -7.38,

-2.29) on a 0 to 68 point function subscale of WOMAC. There was no

heterogeneity in the result (I2=0%). Only two trials (Marra et al., 2012, Hay et al.,

2006) reported physical functioning status at 6-months. Meta-analysis showed a

significant improvement in physical functioning at 6-month follow-up as well in

the intervention group compared to the control group with SMD -0.30 (95% CI -

0.51,- 0.09) corresponding to -3.82 points (95% CI -6.49, -1.14) on WOMAC 0

to 68 function subscale. There was non-significant heterogeneity in the result

(I2=33%).

80

3.4.4.3 Patient satisfaction

Three studies (Gammaitoni et al., 2000, Hay et al., 2006, Bruhn et al.,

2011b) reported patient satisfaction as an outcome. Gammaitoni et al. (2000)

assessed patient satisfaction with different components of the service using the

Treatment Helpfulness Questionnaire (THQ), a validated measure to assess

patient satisfaction with chronic pain management service (Chapman et al.,

1996). The questionnaire was modified to include measures regarding

satisfaction with the pharmaceutical care programme. The questionnaire

assessed satisfaction with the following components of the programme: access

to medication, pharmacy service, delivery of medication, pharmacist phone

calls, time spent obtaining medications, pharmacist medication counselling and

information provided by the pharmacist. Each item was ranked on a 11 point

scale ranging from -5 (extremely harmful) to +5 (extremely helpful). Hay et al.

(2006) assessed satisfaction as a dichotomous outcome (satisfied, not

satisfied). In the case of Bruhn et al. (2011b), patient satisfaction was reported

in another linked abstract by Bond et al. (2011). Patient satisfaction was

assessed at the end of 3 months using Likert scale ratings of statements about

their pain and pharmacist consultation, and open ended questions on good and

bad things about pharmacist consultations (Bond et al., 2011).

In the Gammaitoni et al. study (2000), patients in the intervention group

were significantly more satisfied with various components of the pharmaceutical

care programme including pharmacy service (p=0.001), delivery of medication

(p=0.001), pharmacist phone calls (p=0.003), time spent in obtaining

medications (p<0.001), pharmacist medication counselling (p=0.003), and

information provided by the pharmacist (p=0.013). However, there was no

significant difference in satisfaction with the whole programme domain (p=0.72)

81

of the patient satisfaction survey. In the control group, patients were not

significantly satisfied with any component of the service except for psychological

assessment and treatment (p<0.05). It should be noted here that Gammaitoni et

al. (2000) only compared the difference in patient satisfaction from baseline to

3-month study period in both intervention and control groups independently, but

did not compare control with the intervention group. In the Hay et al. study

(2006), compared to the control group, patients in the intervention group were

significantly more satisfied with the received treatment at 3-month [-20%; 95%

CI (-33 to -6)] and at 12-months-[-19%; 95%CI (-32 to -4)] follow-up but not at 6-

month [-14%; 95%CI (-28 to 1)]. Bond et al. reported that 85% (38/46) of the

patients in the prescribing arm were totally satisfied with the received treatment.

Patient satisfaction rates were not reported for the other intervention

(medication review alone) and control groups.

Data for patient satisfaction were pooled for two studies only (Figure

3.8). Meta-analysis showed significant patient satisfaction in the intervention

group compared to the control group with SMD -0.39 [95% CI (-0.68, -0.10)].

Using the universal rule of thumb, this effect size corresponds to ‘small to

moderate effect’ (Cohen, 1988, Higgins and Green, 2011).

3.4.4.4 Quality of life

Three studies assessed quality of life (QoL) (Marra et al., 2012, Hoffmann

et al., 2008, Bruhn et al., 2011b). Hoffmann et al. (2008) assessed quality of life

using the Medical Outcomes General Health Survey (SF-36). While Bruhn et al.

(2011b) assessed QoL using SF-12, a validated shorter version of SF-36. Marra

et al. (2012) assessed QoL using WOMAC (global) and Health Utilities Index-3

(HUI-3), a generic and preference-scored instrument for measuring health

82

status and health related quality of life. Higher scores on HUI-3 indicate better

health.

In the Hoffmann et al. (2008) trial, compared to the control group, there

was no significant difference in the intervention group in the physical health

subscale (p=0.85) of SF-36 but a statistically significant difference was found

in the mental health subscale (p=0.02) of SF-36 at the end of the 4-month study

period. Similarly, Bruhn et al. (2011a) reported a significant improvement in the

mental health component of SF-12 (p=0.04) but not on the physical health

component (p=0.75) at 6-months follow-up. Marra et al. (2012) reported a

significant improvement in WOMAC (Global) at 3-months [-1.99; 95% CI (-3.45,

-0.54)] and 6-months [-2.40; 95% CI (-4.10,-0.71)] in the intervention group

compared to the control. However, HUI-3 failed to measure significant

differences in QoL between the intervention and control group at 3-months

[0.04; 95% CI (-0.03, 0.12)] and 6-months [0.01; 95%CI (- 0.06, 0.10)].

Meta-analysis was not undertaken as clinical heterogeneity and

insufficient data ruled out Hoffmann et al. (2000) and Bruhn et al. (2011a)

studies respectively.

3.4.4.5 Adverse effects

Surprisingly, none of the studies except Phelan et al. (2008), linked to

the Hay et al. (2006) trial, reported adverse effects. The authors reported

adverse effects in 30 patients including constipation (10), drowsiness (8), gastro

intestinal upset (8) and others (4) from prescribed analgesics at the initial

consultation. During follow-up the side effects were reduced or stopped in 25

patients by altering, adding or substituting their medication. The remaining five

83

patients continued with their medication unchanged as the medications were

effective and the side effects were tolerable.

84

Figure 3.6. Meta-analysis of pain intensity at 3-month and 6-month

85

Figure 3.7. Meta-analysis of physical functioning at 3-month and 6-month

86

Figure 3.8. Meta-analysis of patient satisfaction at 3-month

87

3.5 Discussion

3.5.1 Main results

The search strategy identified five studies which met the inclusion criteria

including three individually-randomised (Gammaitoni et al., 2000, Hay et al.,

2006, Bruhn et al., 2011a) and two cluster-randomised controlled trials

(Hoffmann et al., 2008, Marra et al., 2012). The ‘grey-literature’ was not

searched and studies published only in the English language were included in

the systematic review. The potential implications of restricting the searches to

databases and websites, and English language are discussed in the limitations

section (section 3.6). Pharmacists delivered interventions in different settings

such as community pharmacies (Hoffmann et al., 2008, Marra et al., 2012),

general practices (Hay et al., 2006, Bruhn et al., 2011a) and university pain

clinic (Gammaitoni et al., 2000) indicating that the intervention can potentially be

delivered in multiple settings. Furthermore, the included trials involved patients

with various chronic pain aetiologies, demonstrating that the pharmacist-led

medication review may be effective for different types of chronic pain conditions.

Two trials originated from the UK (Hay et al., 2006, Bruhn et al., 2011a)

and one each from the USA (Gammaitoni et al., 2000), Canada (Marra et al.,

2012) and Germany (Hoffmann et al., 2008) indicating that there is growing

interest in evaluating the role of pharmacists in chronic pain management in the

developed world. This may be due to the high disease burden of chronic pain

and a growing necessity to involve other healthcare professionals such as

pharmacists and nurses actively in direct patient care to reduce the workload on

general practitioners (GPs)/primary care physicians (PCPs) in these countries.

A survey conducted among GPs in the UK reported that the GPs were

88

dissatisfied with their management of chronic pain patients and they were

worried about the long waiting time for secondary care appointments (Stannard

and Johnson, 2003). Therefore, the growing number of independent nurse and

pharmacist prescribers can potentially fill this gap and improve patient care,

especially for chronically ill patients.

The risk of bias was assessed for all of the included studies. There was

low or unclear risk of bias across all the domains except for blinding of

participants and personnel where there was high risk of bias across all trials.

Due to the nature of the intervention, it was practically impossible to blind the

pharmacists conducting medication reviews and the patients receiving them as,

in most instances, the medication review was conducted face-to-face. Although

the nature and mode of delivery of intervention prevented blinding of

participants and personnel, outcome assessors were blinded in two of the three

trials involved in the meta-analysis, and in the third trial the outcome

assessments were carried out using a standardised computer aided interview

minimising detection bias. The research evidence suggests that, on average,

lack of blinding in RCTs is associated with a 9% increment in the intervention

effect when measured as odds ratio (Pildal et al., 2007). Trials with more

subjective outcomes, such as pain trials, are likely to be affected more than

those which measure objective outcomes (Wood et al., 2008). Concealment of

allocation is necessary to limit selection bias but allocation concealment may

not be possible for cluster-randomised controlled trials. Among the included

trials, only one study by Hay et al. (2006) described adequate method for

concealment of allocation (opaque envelopes). However, treatment allocation

was disclosed to study nurse by 15 of 325 participants (4.6%). A meta-

epidemiologic study of 16 meta-analyses involving osteoarthritis patients

89

reported statistically significant differences in effect sizes in 46 trials with

adequate allocation concealment compared with 112 trials with inadequate or

unclear concealment of allocation (difference -0.15; [95% CI, -0.31 to 0.02])

(Nüesch et al., 2009). However, there was no statistically significant difference

in effect sizes in trials involving non-pharmacological interventions -0.05 [95%

CI (-0.22 to 0.12)] (Nüesch et al., 2009).

Clinical homogeneity was considered before pooling data statistically.

Data from a study by Hoffmann et al. (2008) were not considered for meta-

analysis as the study involved patients with chronic headache and migraine,

which is a neurological condition and has an episodic nature (National Institite of

Neurological Disorders and Stroke, 2012) unlike other chronic pain conditions.

Furthermore, it requires a different therapeutic approach. The full report of

Bruhn et al. (2011a) study was not available at that time and the data reported

in conference abstracts (Bond et al., 2011, Bruhn et al., 2011a, Bruhn et al.,

2011b) was not enough to be pooled statistically. The corresponding author was

contacted to obtain additional data but unfortunately the author declined the

request due to restrictions by the funding agency. Other trials were relatively

similar in terms of nature of intervention, patient follow-up and patients’ pain

scores. Meta-analysis was conducted at two time points; 3-months and 6-

months because the studies included in the systematic review reported follow-

up results ranging from 3-months to 12-months. Combining short with long term

trials is not recommended as it produces larger treatment effect than combining

longer term trials alone (Moore et al., 2010a). Furthermore, the response to

placebo tends to be larger in longer trials (Quessy and Rowbotham, 2008) and

research evidence also suggests that the efficacy of interventions, especially of

less effective interventions decrease over 2-12 weeks (Moore et al., 2010b).

90

Therefore, meta-analysis was conducted at two time points to limit any bias

arising from combining short-term trials with long-term trials.

The included trials measured the same outcomes using different scales

therefore data were pooled using SMD for each outcome. The potential problem

with SMD is that it expresses the intervention effect in standard units rather than

the original units of measurement making clinical interpretations difficult for

patients and practitioners (Higgins and Green, 2011). To interpret SMD, in line

with the Cochrane’s guidance (Higgins and Green, 2011), it was re-expressed in

the units of a specific measurement scale for two of the three outcome

measures that were statistically combined, pain intensity and physical

functioning. This was achieved by multiplying SMDs for pain intensity and

physical functioning with the standard deviation of the numerical rating scale (0

to 10) and physical functioning subscale of WOMAC (0-20) respectively. Both of

the standard deviations were obtained as pooled standard deviations of

baseline scores from the Hay et al. study (2006). Only the summary measure of

effect was back-transformed to enhance clinical interpretation. For the third

outcome measure, patient satisfaction, SMD was re-expressed using rules of

thumbs for effect sizes (Cohen, 1988, Higgins and Green, 2011) as one of the

trials (Hay et al., 2006) measuring patient satisfaction reported it as

dichotomous outcome measure and the other trail (Gammaitoni et al., 2000)

used an adapted and modified version of a validated questionnaire thus

compromising its validity and reliability .

Meta-analysis showed that there was a statistically significant reduction

in pain intensity and statistically significant improvement in physical functioning

in the intervention group compared to the control group. However, the clinical

significance of these findings is arguable and needs careful consideration. The

91

use of average results of continuous data (e.g. pain intensity) can be misleading

(McQuay et al., 1996) as it is argued that the population distributions of pain

scores and/or pain relief are usually ‘U-shaped’ (as opposed to being normally

distributed) therefore patients tend to have either very good or very poor pain

relief. Consequently, it has been suggested that pain scores/pain relief should

be reported as percentage of patients responding to the treatment instead of

average pain scores to reflect the actual number of patients who have improved

or deteriorated. All the trials included in the systematic review reported average

pain scores only rather than reporting percentages of patients responding to the

treatment. As a result, making clinical recommendations about the effect size of

the effectiveness of the pharmacist-led medication review in chronic pain

management is difficult due to the nature of reported data. The evidence from

the meta-analysis indicates potential benefit for patients; however, there is

uncertainty around the clinical significance of this benefit which limits wider

clinical implementation. Furthermore, medication review was conducted as part

of multi-component interventions in three of the five included studies and

consequently, the “active ingredient” of the intervention is not known. However,

the impact of the intervention on other drug-related outcomes such as the

reduction in side effects documented by Phelan et al. (2007) linked to Hay et al.

(2006), the reduction in the use of non-steroidal anti-inflammatory drugs

documented by Hay et al. (2006) and the high acceptance of pharmacists’

recommendations as documented by Gammaitoni et al. (2000), Hoffmann et al.

(2008) and Marra et al. (2012) suggest that pharmacist-led medication review is

an important component in overall pain management and can improve patient

reported outcomes.

92

3.5.2 Implications for pharmacy practice and policy

Medications are widely used in chronic pain management with two-thirds

of chronic pain patients receiving prescription medicines and half of them taking

non-prescription medicines (Breivik et al., 2006). Therefore, the safe and

effective use of analgesics is critical to ensure optimum analgesia, prevention of

adverse effects and drug related problems, and abuse of analgesics. In the

USA, in 2007, almost 12,000 cases of unintentional drug poisoning involved

prescription analgesics (Centers for Disease Control and Prevention, 2010) and

in 2008, 14,800 people died due to overdoses of opioid analgesics (Centers for

Disease Control and Prevention Analysis: Morbidity and Mortality Weekly

Report (MMWR), 2011). The report also suggested that, in 2009, misuse and/or

abuse of prescription analgesics resulted in more than half a million emergency

Department visits (Centers for Disease Control and Prevention Analysis:

Morbidity and Mortality Weekly Report (MMWR), 2011). Given these alarming

negative consequences of inappropriate use of analgesics and the potential for

abuse of opioid analgesics, regular review of medicines is important to optimise

pain relief whilst ensuring safe use of analgesics.

With the advancement of the concept of pharmaceutical care (Mikeal et

al., 1975), the focus of pharmacist-led services has shifted from being product-

centred to patient-centred. A number of pharmacist-led services have been

developed both in hospital and community settings to improve patient care.

Research evidence to support the effectiveness for such services is critical for

their sustainability. The present systematic review has identified and

synthesised data which demonstrates the effectiveness of pharmacist-led

medication review in chronic pain management. The findings have raised two

questions which need to be considered by service commissioners and policy

93

makers before a wider role for pharmacists in chronic pain management is put

into practice. Firstly, certain issues related to delivery of the intervention such as

‘how much’, how often’, ‘how long’, must be carefully considered as limited

exposure to the service may not be adequate to achieve desired outcomes and

prolonged use of the service may not be cost-effective and may put an

additional burden on healthcare systems. Furthermore, it is still unknown

whether the pharmacist-led medication review benefits all types of chronic pain

patients or only certain types of patients. However, it can be argued that

medication review by an expert pharmacist should be able to reduce drug-

related problems and adverse effects in all patients irrespective of the pain

aetiology. Secondly, short-courses/programs/residency training must be

developed to provide specialised education and training in pain management to

all the pharmacists in order to achieve maximum clinical benefit. In the past, the

need for specialised training programmes has also been advocated in the

literature (LaPerriere, 1994). However, to date, such training programmes are

not widely available for pharmacists especially outside the USA. Some

examples include specialised pain management residency programmes for

pharmacists in the USA (Departmant of Pharmacy, 2012) with palliative care as

a key focus area and pharmacotherapy traineeship in pain management among

geriatric patients offered by American Society of Consultant Pharmacists

(ASCP) Foundation (2012). Some universities in the UK also offer ‘generic’

postgraduate programmes (MSc/Post-Graduate Diploma) and short courses (2-

3 days) in pain management but no specialised training programmes for

pharmacists are currently available in the UK. Training programmes to produce

skilled pharmacy human resource in pain management is essential to ensure

sustainability and clinical effectiveness of pharmacist-led pain management

service.

94

With regard to the developing countries, the findings of the systematic

review may not be transferable as the pharmacy profession is undergoing

transition from ‘industry-oriented’ to ‘patient-oriented’. Over the past decade,

changes in undergraduate curriculum have been made together with the

development of clinical oriented postgraduate programs (Hadi et al., 2010) to

equip pharmacists with necessary clinical knowledge to meet growing needs of

the patients (Hadi, 2010, Hadi and Awaisu, 2010). However, there is still a long

way to go before these changes can make significant impact in transforming

pharmacy practice and relevant polices in these countries.

3.5.3 Implications for future research

High prevalence of chronic pain and its associated burden on healthcare

systems and societies across the globe calls for high quality research to

improve both diagnosis and management of chronic pain. However, the

literature suggests that research into chronic pain is not well funded (The

Mayday Fund Special Committee on Pain and the Practice of Medicine, 2009).

In 2008, in the USA, less than one percent of National Institutes of Health (NIH)

budget was given for pain research (National Institues of Health, 2008).

Underfunding of pain research is concerning and it may damage initiatives to

improve pain management due to a lack of research evidence. A survey in the

USA reported that almost six in ten adults (57%) were willing to pay one dollar

more per week in taxes to increase federal funding for the research into pain.

The purpose of a systematic review is not only to synthesise research

evidence but also to identify the limitations of current knowledge and propose

directions for future research (Higgins and Green, 2011). The role of

pharmacists in chronic pain management is still relatively new and requires

further exploration. The current evidence suggests that pharmacist-led

95

medication review is effective in reducing pain intensity, medication-related

adverse effects and improve physical functioning. Future research must

evaluate the optimum and cost-effective mode/method and duration of delivery

of the intervention to achieve maximum clinical benefit. Standardisation of the

intervention may not be possible due to the individualised needs of the patients

especially those taking opioid analgesics may need a more frequent medication

review to limit abuse and ensure safety.

There is a need to improve the quality of reporting of clinical trials

involving chronic pain patients. In addition to CONSORT guidance on the

conduct and reporting of clinical trials (Moher et al., 2010), the researchers

should also adhere to the Initiative on Methods, Measurement, and Pain

Assessment in Clinical Trials (IMMPACT) guidance (Turk et al., 2003, Dworkin

et al., 2005, Moore et al., 2010a) in designing, conducting and reporting their

findings. The IMMPACT group has developed consensus reviews and

recommendations for improving the design, conduct, reporting and

interpretation of clinical trials of treatments for pain. A list of core outcome

domains and their respective measurement scales have also been developed to

allow meaningful comparisons among different patient populations, treatments

and settings (Turk et al., 2003). As discussed earlier, the researchers instead of

reporting average pain scores only should always report percentages of patients

achieving minimally important, moderately important and substantial clinical

difference in accordance with the recommendations of IMMPACT group

(Dworkin et al., 2008).

Trials involving only non-malignant pain patients were included as the

inclusion of trials involving cancer pain would have introduced clinical

heterogeneity and complicated clinical interpretation of the findings. It would be

96

interesting to evaluate the effectiveness of pharmacist-led medication review

among patients with cancer pain as effective management of cancer pain is

very important in overall cancer management, especially in end of life care.

Finally, the cost-effectiveness of pharmacist-led medication review in chronic

pain management is yet to be evaluated. In the present global financial

environment, healthcare systems across the world are taking measures to

reduce healthcare costs and data demonstrating cost-effectiveness of an

intervention is important in the commissioning of services.

3.6 Limitations

In terms of the design of the systematic review there were two major

limitations. Firstly, studies reported only in English language were included in

the systematic review, which might have led to language bias (Moher et al.,

1996). One study (Marti et al., 2005) was excluded during screening of full-texts

of included studies as it was published in the Spanish language. However,

conflicting results have been reported in the literature examining the extent of

the effect of language bias on the findings of the systematic review (Higgins and

Green, 2011). In a study, Jüni et al. (2002) reported that trials published in non-

English languages were more likely to produce significant results and, on

average, the intervention effects were 16% (95%CI 3% to 26%) greater in these

trials compared to trials published in English. On the contrary, Moher et al.

(2003) did not report any significant effect of excluding non-English trials on the

results of meta-analysis. Furthermore, Galandi et al. (2006) reported a decline

in publishing clinical trials in German-language indicating a shift from using non-

English language to English-language in disseminating clinical trials. It was

decided during protocol development not to include non-English studies as the

review team lacked expertise in translating non-English studies in English and

97

had no funds to hire services of professional translators. Secondly, publication

bias may have been introduced as no attempt was made to locate unpublished

trials (grey literature). The findings of the research evaluating the impact of

inclusion or exclusion of ‘grey’ literature in meta-analysis of RCTs are

inconsistent. Hopewell et al. (2007) in a review reported, on average, a 9%

larger intervention effect in published trials than grey trials. The problems

associated with the inclusion of unpublished trials include (Higgins and Green,

2011): difficulty in locating such studies, data acquisition from the study

investigators, and absence of peer-review. Furthermore, the methodological

quality of unpublished trials has been reported to be lower than published trials

in terms of allocation concealment and blinding outcome assessment (Egger et

al., 2003). On the contrary, Hopewell et al. (2004) did not find such

methodological limitations. The major issue with data acquisition is that only

investigators with positive results may be willing to share their results which may

introduce bias in to the systematic review. Finally, the located studies may only

be a small part and ‘unrepresentative’ (Page 309) of all the unpublished studies

(Higgins and Green, 2011). Systematic review authors in future may consider

including studies published in non-English languages and unpublished studies

to overcome the above mentioned limitations.

3.7 Conclusion

Pharmacists can play an important role in improving chronic pain

management. Pharmacists can deliver interventions independently and as part

of multidisciplinary teams in both community and hospital settings. The present

systematic review suggests that pharmacist-led medication review is effective in

reducing pain intensity and improving physical functioning. Furthermore,

patients were generally satisfied with the service provided by the pharmacists.

98

There is also weak evidence of preventing/stopping adverse effects associated

with the use of medicines among chronic pain patients. The clinical significance

of these findings remains to be established. Future clinical trials evaluating the

effectiveness of pharmacist-led interventions in chronic pain must adhere to the

IMMPACT guidance (Turk et al., 2003, Dworkin et al., 2005) in designing,

conducting and reporting their findings in addition to the CONSORT guidance

(Moher et al., 2010). This will ensure selection of the recommended uniform

outcome domains and measures, and quality reporting of the trial results

facilitating not only clinical interpretation but also data synthesis in future. As

the focus of care shifts from secondary to primary care, pharmacists especially

community pharmacists have the potential to reduce the chronic pain burden on

healthcare system and society by ensuring the safe and effective use of

medicines.

99

CHAPTER 4

METHODOLOGY

100

CHAPTER 4

METHODOLOGY

4.1 Introduction

This chapter outlines the research methodology used to guide this research

project and answer the research questions related to the second aim of the

research presented in this thesis. The chapter begins with a brief introduction to

various research methodologies commonly used in healthcare research. Then

the strengths and weaknesses of these methodologies are discussed and in

particular, mixed-methods. Following that, the selection of a particular mixed-

methods design for the present study is also debated and justified.

Whilst conducting the literature review for the present study, the author

found that mixed-methods designs are infrequently used by pharmacy practice

researchers and recognised a need to advocate the use of mixed-methods

research in pharmacy practice. Furthermore, the quality of reporting of mixed-

methods research was also deemed to be suboptimal. Consequently, two

papers highlighting various aspects and challenges of mixed-methods research

and a framework to improve its reporting were published in a peer reviewed

journal (Hadi et al., 2013, Hadi et al., 2014).

101

4.2 Research methodology

Research methodology is an approach to systematically solve/answer

the research problem/question and it may be considered as the science of

exploring how research is conducted scientifically (LINGAYAS Institute of

Management and Technology, 2012). Broadly, there are three research

methodologies available to researchers in health sciences namely qualitative,

quantitative and mixed-methods. A number of research designs are available

within these three methodologies. There are specific philosophical assumptions,

advantages, applications and limitations associated with each research

methodology. Therefore, the choice of a particular methodology should be

based on the nature of the research question. In the following sections, each of

these three methodologies and some important research designs within these

methodologies are explained briefly.

4.2.1 Qualitative research methodology

There is little agreement between methodologists on a single definition of

qualitative research, probably because qualitative research encompasses a

diverse range of methods (Holloway, 2005). In general, qualitative research is a

collection of interpretative methods which aim to describe, understand and

explain people’s experience of a certain phenomenon with non-numerical data

(Holloway, 2005, Denzin and Lincoln, 2005). Qualitative research, in its

structured form, was first used by sociologists and anthropologists in the early

20th century (Al-Busaidi, 2008). In healthcare research, after receiving

significant criticism and resistance in the 1980’s and 1990’s, qualitative research

is now widely used to inform healthcare practice and policy.

102

Qualitative inquiry, in contrast to quantitative inquiry, explores the

meaning people attribute to their experiences and explains the process of

social construction that shape these meanings (Popay, 1992). There are four

specific characteristics of qualitative research (Avis, 2005): Firstly, it obtains and

analyses textual (interview transcripts, diaries, observation notes, photographs,

videos) rather than numeric data. Secondly, since qualitative research aims to

view the social world through participants’ eyes, it involves extensive interaction

with the study population, referred to as ‘field work’ (Creswell, 2007).

Engagement with study participants ensures that instead of merely studying the

participants, the researcher learns from them (Spardley, 1979) and develops a

common understanding. Thirdly, it has a ‘flexible plan of inquiry’ – the design

evolves as the study progresses. Finally, it is ‘context bound’- it studies

participants in their natural environment rather than experimental settings,

referred to as ‘naturalism’. The researchers cannot disengage themselves from

the research process and therefore constantly need to critically reflect on their

own role in the process of generating data.

There are at least forty different research designs under the umbrella of

qualitative research (Tesch, 1990). It is beyond the scope of this thesis to

provide a description of each of these methods. However, a brief introduction of

a few methods which are important and relevant to healthcare research is

described below.

Phenomenology aims to describe the shared lived experiences of groups

of individuals of a particular phenomenon rather than a single individual.

Phenomenology advances a collective in-depth description of the essence of

the experience of all the study participants (van Manen, 1990). The data

analysis involves finding “significant statements” or quotes, a process called

103

horizonalisation. Researchers then develop themes from these statements and

together with the statements, these themes provide a textual description of the

experience. Alongside the textual description, a structural description is

provided that refers to context and settings that have influenced the

experience.

Grounded theory study, as the name indicates, aims to generate or

discover a theory which is ‘grounded’ in the views of participants who have

experienced the phenomenon (Strauss and Corbin, 1990). The development of

theory provides an in-depth explanation of participants’ practices (Creswell,

2007). The concept of grounded theory was proposed by Glaser and Strauss in

1967 (Glaser and Strauss, 1967) but the authors later disagreed about the

procedures of conduct of grounded theory research leading to the development

of two variants of the grounded theory approach (Strauss, 1987, Glaser, 1992).

Charmaz (2006) introduced another variant by proposing the concept of

constructivist grounded theory. Creswell (2007) described data collection and

analysis in grounded theory as a ‘zigzag’ process as it occurs simultaneously –

the researcher undertakes fieldwork to collect data and then analyses it in the

office, and then returns to the field to collect more data.

Ethnography aims to describe shared beliefs, views, values and

behaviours of a culture sharing group (Harris, 1968). Data are often collected

through participant observation and interviews and therefore, the researcher

spends a significant amount of time with the group to understand their beliefs

and cultural values. The concept of ethnography was first introduced in the early

20th century in the field of cultural anthropology (Creswell, 2007). There are

many variants (types) of ethnography but the most commonly used are: realist

ethnography (Van Maanen, 1988) and critical ethnography (Thomas, 1993).

104

Case study methodology has been defined in a number of ways and

what constitutes a case study is also widely debated among researchers

(Hammersley, 1992, Wolcott, 2002, Yin 2009). Yin defined case study as “an

empirical inquiry about a contemporary phenomenon (e.g., a “case”), set within

its real-world context—especially when the boundaries between phenomenon

and context are not clearly evident” (Yin, 2009, P. 18). It involves studying a

phenomenon in its context (e.g. traditional ethnographies). Broadly, there are

two types of case studies, single case study and multiple case study. It typically

involves multiple sources of evidence and data is collected through

documentation, archival records, interviews, direct observations, participant

observation and physical artefacts (Yin, 1994). Case studies, whether single or

multiple, typically answer either a descriptive question (e.g. what is happening?)

or an exploratory question (e.g. how or why something happened?). However,

questions about the effectiveness of an intervention and prevalence are not best

answered using case study design (Yin, 2009). Since the aim of the study was

to investigate the effectiveness of the pain clinic and explore patients’

satisfaction with the service, case study was not considered suitable

Qualitative description is not often described as a distinctive method in

the literature (Sandelowski, 2000, Sandelowski, 2010) but it is widely used in

practice disciplines (Sullivan-Bolyai et al., 2005, Julion et al., 2007, Van Hulle

and Gaddy, 2009). This is probably because qualitative description draws

heavily on the principles of phenomenology, ethnography and grounded theory,

but compared to these traditional approaches it is less interpretative. However,

as the name may suggest, it is not free of interpretation. Sandelowski (2000,

P.335) described the interpretive nature of qualitative description as “All inquiry

entails description, and all description entails interpretation.” A variant of

105

qualitative description is ‘interpretive description’ (Thorne et al., 1997).

Qualitative description, being the chosen qualitative design, is explained in

detail later in the chapter.

4.2.2 Quantitative research methodology

Quantitative research uses statistical procedures to test a theory and

relationship among the variables, measured in numbers, with an aim to

establish or refute the generalizations of the theory (Creswell, 2003).

Quantitative research designs have dominated healthcare research because

their findings are often generalizable and they have the ability to address a wide

range of clinical topics (e.g. risk factors, diagnosis, prognosis and treatment

choice) through a systematic process. Quantitative approaches are often

associated with a positivist worldview – that there is a ‘single reality’ which can

be studied objectively. In contrast to qualitative research, the researcher

remains independent of the research process and does not bring his values and

beliefs into the research (Leedy and Ormrod, 2001, Creswell and Plano Clark,

2011). The generation of knowledge is based on cause-and-effect,

reductionism, comprehensive observations, measures of variables, and testing

and refining of hypotheses and theories (Slife and Williams, 1995). Broadly,

quantitative research designs are divided into observational and experimental

designs.

In observational studies, the researcher does not intervene in the care of

the patient and only observes what happens (Seers and Critelton, 2001). There

are three major types of observational studies: cross-sectional surveys, case-

control studies and cohort studies (Creswell, 2003). Cross-sectional surveys are

mostly descriptive in nature and are undertaken at a single point in time or over

a short period of time. Data are usually collected through structured

106

questionnaires. They are used to assess the burden of disease(s) and/or the

health needs of a population and are particularly useful in informing the planning

and allocation of health resources (Rothman, 2002). Case-control studies are

typically retrospective as they look back in time to find an association, if any,

between a previous exposure with an outcome of interest. Case-control studies

are relatively quick, inexpensive, and easy to carry out. They are particularly

appropriate for investigating disease outbreaks and studying rare diseases or

outcomes (Rothman, 2002). Cohort studies are typically prospective as they

follow-up individuals over time until the outcome of interest appears or the study

time ceases. Since cohort studies involve patient follow-up over a long period of

time, they are expensive and time-consuming. They are particularly useful in

studying causes, natural history and prognosis of diseases (Rothman, 2002).

In experimental studies, the researcher intervenes in the care of patients

and evaluates the effectiveness of the intervention (Seers and Critelton, 2001).

Experimental studies include quasi-experimental studies, controlled clinical trials

(CCTs), and randomised controlled clinical trials (RCTs). The overall aim of

experimental designs is to evaluate the effectiveness of an intervention.

Controlled Clinical trials and randomised controlled trials are similar in terms of

their design except that in RCTs the assignment of participants to control and

intervention groups is random. RCTs are considered the gold standard for

evaluating the effectiveness of healthcare interventions as they are considered

the least biased (Rothman, 2002). Quasi-experimental designs, also known as

“before-after intervention” and “pre-post intervention”, are also frequently used

in healthcare research when conducting RCTs or CCTs is not possible (Harris

et al., 2004). Quasi experimental studies may or may not have a control group.

107

Being the chosen design, quasi-experimental designs are discussed in more

detail later in the chapter.

4.2.3 Mixed-methods research methodology

Since mixed-methods methodology has been used to guide this research,

it is described in more detail. Mixed-methods research, as the term indicates,

entails both qualitative and quantitative components. Although a number of

definitions exist in the literature, what constitutes a mixed-methods study and,

how and when qualitative and quantitative components should be combined

remain open for debate. Tashakkori and Creswell (2007) defined mixed

methods research as “research in which the investigator collects and analyses

data, integrates the findings, and draws inferences using both qualitative and

quantitative approaches or methods in a single study or program of inquiry

(Page 4).” Johnson et al. (2007, P. 123) reviewed 19 definitions of mixed-

methods and concluded with the following definition: “Mixed-methods research

is the type of research in which a researcher or team of researchers combines

elements of qualitative and quantitative research approaches (e.g., use of

qualitative and quantitative viewpoints, data collection, analysis, inference

techniques) for the purposes of breadth and depth of understanding and

corroboration.” It is noteworthy that mixed-methods research should not only be

used as a tool to collect qualitative and quantitative data, but the two datasets

should be meaningfully integrated (Creswell and Plano Clark, 2011).

Mixed-methods research combines the strengths of the two

methodologies to overcome their respective limitations. It allows researchers to

choose and merge different methodologies to develop ‘the best possible

method’ to comprehensively answer a specific research question (Creswell and

Plano Clark, 2011). Mixed-methods research can potentially answer different

108

research questions within a single study that addresses the same research

problem, but requires different methodologies. Nonetheless, if the research

problem requires a mono-method study design to answer the question then it

should be chosen bearing its limitations in mind.

4.2.3.1 Typologies of mixed-methods research

Broadly, mixed-methods designs are either fixed or emergent (Creswell

and Plano Clark, 2011). In fixed designs, the use of qualitative and quantitative

methods is pre-planned and executed accordingly. Emergent designs arise

when data from a single method is insufficient to comprehensively answer the

research question and a second approach (qualitative or quantitative) is added

to an on-going study (Morse and Niehaus, 2009). Various classifications or

typologies of mixed-methods designs exist in the literature (Greene et al., 1989,

Greene, 2007, Tiddlie and Tashakkaori, 2009, Morse and Niehaus, 2009,

Creswell and Plano Clark, 2011). However, it should be noted that no

classification system is superior to another. Choosing an appropriate research

design is one of the most complex and challenging issues in mixed-methods

research (Teddlie and Tashakkori, 2006).

Four basic mixed-methods research designs proposed by Creswell and

Plano Clark (2011) are briefly described below.

The Convergent parallel design also known as ‘current triangulation’

(Creswell et al., 2003), ‘simultaneous triangulation’ (Morse, 1991a), and ‘parallel

study’ (Tashakkori and Teddlie, 1998), involves conducting qualitative and

quantitative components concurrently. Both components are given equal priority

and are kept independent during data collection and analysis, and mixing

occurs during interpretation. The convergent design is best suited for ‘obtaining

109

different but complementary’ data on the same topic (Creswell and Plano Clark,

2011); overcoming weaknesses of one method; triangulating findings for

confirmation and validation; and developing a complete understanding of the

research problem.

The explanatory sequential design involves two distinct interactive

phases. In the first phase, quantitative data are collected, analysed and given

priority in answering the research question. Following this, qualitative data are

collected with the purpose of explaining the findings of the quantitative phase.

The exploratory sequential design also has two distinct sequential

phases. However, unlike the explanatory design, it prioritises qualitative data

collection and analysis which occur in the first phase. The quantitative phase

builds on the results of qualitative data analysis to test or generalize its findings.

The embedded design was first described by Caracelli and Grenne in

1989 (Greene et al., 1989). In embedded design there is one principal method

(qualitative or quantitative) and it is given priority depending on the purpose of

the research and the other method provides supportive data. Qualitative and

quantitative data can be collected concurrently or sequentially. The embedded

design is particularly useful when a single dataset is not sufficient and different

questions requiring different methodologies need to be answered within a single

study.

Advanced mixed-methods designs include transformative design and

multiphase design. In the following sections, first the rationale for choosing a

mixed methods approach is presented and then the choice of embedded design

is debated and justified in depth.

110

4.3 Rationale for choosing mixed-methods design

The rationale for choosing a mixed-methods approach should always be

presented since not all research problems require mixed-methods research

methodology (Creswell and Plano Clark, 2007). The essence of mixed-methods

research is to allow the research question to dictate the choice of the method

rather than the inclination towards a specific “quantitative only” or “qualitative

only” methodology. Greene et al. (1989) identified five reasons for conducting

mixed-methods research including triangulation, complementarity, development,

initiation and expansion. In 2006, Bryman expanded the list and identified 16

reasons for conducting mixed-methods research including triangulation, offset,

completeness, process, different research questions, unexpected results,

instrument development, sampling, credibility, context, illustration, utility or

improving usefulness of findings, confirm and discover, diversity of views, and

enhancement or building upon quantitative and qualitative findings (Bryman,

2006).

For the present study, the decision to use mixed-methods methodology

was made based on the nature of the research question(s). The rationale for

choosing mixed-methods methodology is justified by reflecting on the reasons

identified by Bryman (2006) for conducting mixed-methods research. Choosing

among the 16 reasons identified by Bryman (2006), the rationale to use a

mixed-methods approach for this particular study included: different research

questions; offset; utility and illustration. Each of these are explained in detail in

the following paragraphs.

The primary reason for using mixed-methods methodology was its ability

to answer different research questions requiring different methodologies. This

111

author believes that no methodology is superior to another and no single

methodology can answer all the research questions within the context of

healthcare research. Broadly there were two components to the inquiry: one

focused on the evaluation of ‘effectiveness’ of the nurse-pharmacist managed

pain service requiring a quantitative approach; and the other looked at exploring

patients’ experiences, satisfaction and views about the service requiring a

qualitative approach. Patient satisfaction is a multidimensional phenomenon

with clinical outcomes, relationship with healthcare professionals, and

bureaucratic and environmental issues being the three key areas (Wensing et

al., 1994, Gray, 1997). Patient satisfaction is considered an indicator of quality

of healthcare (Fitzpatrick, 1990, Fitzpatrick, 1991, May, 2000). Patient

satisfaction is associated with increased compliance with medical advice

(Fitzpatrick and Hopkins, 1981), continuity of care (Orton et al., 1991) and

health status improvement (Fitzpatrick et al., 1983). Both structured

questionnaires and qualitative interviews have been used in literature to assess

patient satisfaction (Williams et al., 1998, May, 2000, Kleefstra et al., 2010, Xiao

and Barber, 2008). Questionnaires accessing patient satisfaction have been

criticized for not being reliable and valid (Sitzia, 1999). Furthermore,

questionnaires designed by clinicians might not truly reflect patients’ opinions

and preferences on quality and satisfaction (Locker and Dunt, 1978, May,

2000). This shortcoming can be overcome by using a qualitative approach. The

use of mixed-methods allowed the author to use both quantitative and

qualitative methods simultaneously within a single study in order to answer the

different research questions.

Offset refers to the “suggestion that the research methods associated

with both quantitative and qualitative research have their own strengths and

112

weaknesses so that combining them allows the research to offer their

weaknesses to draw on the strengths of both” (Bryman, 2006, P. 106). In the

past, methodologists have argued and debated about the respective usefulness

and limitations of qualitative and quantitative methodologies in answering

“clinical” and “biopsychosocial” questions and gave an impression that ‘one

method fits all research problems’ (Berkwits and Aronowitz, 1995, Pope and

Mays, 1995, Armstrong, 1996, Poses and Isen, 1998). Mixed-methods research

recognises and appreciates the strengths and weaknesses of both qualitative

and quantitative research designs. Qualitative research best fits a research

question which aims to explore participants’ subjective experiences including

behaviours, attitudes, perceptions, expectations, motivations and interactions,

often grouped under the “biopsychosocial” dimension (Pope and Mays, 1995,

Gilchrist and Engel, 1995). In the present study, as explained earlier, the author

was not only interested in evaluating the effectiveness of the clinic but also keen

to explore patients’ experience of the service. The use of structured

questionnaires (quantitative approach) in evaluating patient satisfaction would

have merely generated statistically significant or non-significant p-value without

giving the patients an opportunity to reflect on their overall experiences.

Utility or improving the usefulness of findings refers to “a suggestion,

which is more likely to be prominent among articles with an applied focus, that

combining the two approaches will be more useful to practitioners and others”

(page 106) (Bryman, 2006). This is a commonly cited reason for using a mixed-

methods approach in practice disciplines. In the present study, the use of

mixed-methods research generated both numerical and textual data and

provided a more comprehensive picture of what was happening in the clinic.

The use of a qualitative approach provided a ‘voice to the patients’ and

113

generated more in-depth data on patient satisfaction, and general experience of

living with chronic pain. It was anticipated that patients’ words would enlighten

the healthcare professionals engaged in managing chronic pain in relation to the

‘needs’ of their patients. Understanding patients’ needs and expectations will

hopefully enable practitioners to improve the care provided.

Illustration refers to “the use of qualitative data to illustrate quantitative

findings, often referred to as “putting meat on the bones” of “dry” quantitative

findings” (page 106) (Bryman, 2006). This is perhaps one of the most useful

applications of a mixed-methods approach, particularly in health services

evaluation studies, because a “quantitative only” study can only generate P

values and effect sizes which may not be enough for a holistic service

evaluation. Integrating P-values with “words” in the present study, made it

possible to answer questions like: What were the useful components of the

service? How do they see the role of the pharmacist in a chronic pain service?

How can the service be improved? Answering these questions through

qualitative research can give meaning to numerical results generated through

quantitative research.

4.4 Rationale for choosing embedded design

A brief introduction of the embedded design has been provided earlier in

this chapter. In the following paragraphs, the earlier introduction is expanded

with an aim to justify the choice of the embedded design for this particular study.

As mentioned earlier, a number of mixed-methods designs are available

to healthcare researchers and choosing a particular design is perhaps the most

complex and challenging step in designing a mixed-methods study (Teddlie and

Tashakkori, 2006). Since each research design within mixed-methods

114

methodology has particular strengths and weaknesses and a different purpose

and procedure of integrating qualitative and quantitative datasets, the choice

should always be primarily based on the research question (Creswell and Plano

Clark, 2011).

The primary objective of this study was to evaluate the effectiveness of

the nurse-pharmacist managed pain clinic. A secondary objective was to

explore patients’ experience of the service provided by the clinic. Keeping in

mind these research objectives, an embedded design was used because it was

best suited to answer the different research questions which required a different

method within the single study (Creswell and Plano Clark, 2011). The

embedded design enabled the author to choose a quantitative method to

answer the “effectiveness question” and a qualitative method to “explore

patients’ experience and satisfaction with the service”. It should be noted here

that the qualitative method in the embedded design answers a different

research question, in contrast to the convergent parallel design, where the

researcher uses both quantitative and qualitative methods to answer a single

overarching question. As mentioned earlier, in an embedded design study, one

method is dominant and the other plays a supportive role and answers a

different research question. In the present study, the main question

(effectiveness) required a quantitative approach and therefore it was the

principal method. The qualitative method was used to explore patients’ views

and experience with the service and had a supportive role.

One of the challenges of using mixed-methods designs is that the

researcher or the research team requires the necessary knowledge and skills to

collect, analyse and interpret both qualitative and quantitative data (Creswell

and Plano Clark, 2011). To enhance qualitative research skills, as part of PhD

115

training, the author attended specialised workshops at the University of Oxford,

UK on qualitative interviewing and data analysis. Various training courses in

statistical analyses were also attended to improve quantitative data analysis

skills.

The embedded design in the present study consisted of a quasi-

experimental (quantitative) and qualitative description (qualitative). The rationale

for choosing these particular designs is justified below.

4.4.1 Rationale for choosing quasi-experimental design

As mentioned earlier, the aim of the quantitative research question was to

evaluate the effectiveness of a nurse-pharmacist managed pain clinic. Ideally, a

well-designed and conducted RCT would be the best study design to evaluate

the effectiveness of an intervention. But practically it is not always possible to

conduct a RCT for logistic or ethical reasons and in such cases quasi-

experimental studies best serve the purpose (Harris et al., 2004, Harris et al.,

2005). Compared to RCTs, the major weakness of quasi-experimental studies is

the lack of randomization and, in some quasi-experimental designs, lack of a

control group. A number of quasi-experimental designs exist and a hierarchy of

these designs with respect to their ability to establish causal relationships has

been proposed (Cook and Campbell, 1979, Shadish et al., 2002). Broadly, in

the social science literature, quasi-experimental designs are classified into four

types (Cook and Campbell, 1979, Shadish et al., 2002): quasi-experimental

designs without control groups; quasi-experimental that use control groups but

no pre-tests; quasi-experimental designs that use control groups and pre-tests;

and interrupted-time-series designs. In general, among quasi-experimental

designs, interrupted time series studies are at the top of the hierarchy followed

by studies with pre-tests and control groups (Harris et al., 2004). Studies without

116

control groups are at the bottom end of the hierarchy but this hierarchy is not

absolute as it is not always possible to find a suitable control group (Harris et

al., 2004). Since there was no suitable control group available for this study, a

prospective single group pretest-posttest design was used. Two post-tests

(upon discharge and 3-month follow-up) were performed instead of one

originally proposed by Harris et al. (2004). The modification was made to

document small to medium term effects of the pain management interventions

at NPMPC.

In the present study, a RCT design was not chosen for two major

reasons: lack of information on the clinical characteristics of patients referred to

the clinic and lack of a suitable control group. The reasons are interlinked as it is

important to know the clinical characteristics of the patients receiving the

intervention in order to identify a suitable control group. The unavailability of

suitable “controls” was a major problem in designing the RCT. A typical RCT

evaluating a non-pharmacological intervention in chronic pain management may

have either one of two controls: waiting lists controls or usual care controls.

Active-treatment controls are less frequently used in service evaluation studies.

Recently, the suitability of waiting lists controls in chronic pain has been

questioned as a waiting time of six months or more has been associated with

deterioration of HRQoL and an increase in depression scores (Lynch et al.,

2008). Furthermore, waiting lists controls would have been unsuitable for the

present study because of the nature of the service. Once referred by the GP, it

takes only 6-8 weeks for patients to have their initial appointment at the clinic

and usually patients remain in the service for 12-weeks to one year. Therefore,

the wait-time for treatment was not enough to constitute a control group.

117

At the time of the commencement of this project (and to date) there was

no mechanism to identify and recruit patients receiving “usual care” through

general practitioners. McDermott et al. (2006) in Aberdeenshire, Scotland, UK

used a Microsoft Access based Audit tool (NIMROD) to search the General

Practice Administrative System for Scotland (GPASS) to identify chronic pain

patients receiving usual care from their GPs in a single practice. However, the

author was not aware of any such tool applicable to general practices in the

local Primary Care Trust and therefore the idea of using a usual-care control

group was dropped.

The pilot study (Briggs et al., 2008) provided only limited information

about the nature and clinical characteristics of the patients that were referred to

the pain clinic. Therefore one of the objectives of the present study was to

examine the clinical characteristics of the patients. The design and evaluation of

complex interventions (interventions that contain several interacting

components) such as this is a stepwise process as per the framework proposed

by the UK Medical Research Council (MRC) (2008). These steps include

(Campbell et al., 2000, Medical Research Council, 2008): a preclinical or

theoretical phase to explore relevant theory underpinning the possible

usefulness of the intervention; modelling (Phase I), identifying the components

of intervention which may influence outcomes; an exploratory trial (Phase II) to

test the acceptability and feasibility of the intervention; a definitive randomised

controlled trial (Phase III) to establish the effectiveness of the intervention; and

long term implementation (Phase IV) to determine whether the intervention and

results are replicable. The preclinical or theoretical phase is related to the

development of the intervention rather than the evaluation of its effectiveness.

The rest of the four phases are associated with the evaluation of the

118

intervention. More information was required about the population, nature of

intervention, and how the intervention impacts the target population before

designing a RCT. For these reasons designing a RCT was neither practical nor

logical and therefore a quasi-experimental design was chosen. Findings of this

study could be used to inform the design of a RCT in the future.

4.4.2 Rationale for choosing qualitative description

So far, in this chapter, the rationale for choosing a mixed-methods

approach, an embedded design and a quasi-experimental design have been

explained. In this section, the rationale for choosing a particular qualitative

design, qualitative description, is presented.

The selection of a particular qualitative design was challenging. Nurse

researchers have been criticised for misunderstanding, misinterpreting and

wrongly labelling their studies as “phenomenology” in the past (Crotty, 1996,

Paley, 1997). Finding the right label for a qualitative research design within the

context of healthcare/practice research is challenging probably because:

qualitative research is a relatively new method of inquiry in healthcare research;

different schools of thought exist within qualitative research; lack of clear

understanding of theoretical and philosophical principles underpinning different

qualitative designs among practice researchers; and the objective(s) of doing

qualitative research in health services/practice research is often different to the

disciplines of sociology and anthropology- where qualitative research originated.

Sally Thorne and colleagues (1997) recognised the need for a discipline

specific qualitative design and proposed the idea of “Interpretive Description”- a

non-categorical qualitative alternative for developing nursing knowledge. They

proposed the concept of interpretive description as a “generic” nursing

119

adaptation of grounded theory, phenomenology and ethnography (Thorne et al.,

1997) and that is why it is labelled as a non-categorical (non-distinctive; non-

independent) method. In 2000, Sandelowski, inspired partly by interpretive

description, proposed “qualitative description” as a distinctive method

(Sandelowski, 2000). Compared to traditional qualitative research designs such

as ethnography, grounded theory, or phenomenology, qualitative description is

considered the least theoretical, but not a-theoretical, and probably on the

lowest rank of the qualitative research hierarchy (Sandelowski, 2000,

Sandelowski, 2010). In general, principles of naturalistic inquiry guide qualitative

descriptive studies. Naturalistic inquiry implies: studying something in its natural

state or as close as possible; no a-priori commitment to any theoretical view of a

target phenomenon, and no pre-selection of variables to study (Lincoln and

Guba, 1985). Sandelowski’s qualitative description (Sandelowski, 2000) differed

from interpretative description (Thorne et al., 1997) in three basic aspects: She

considered qualitative description as a distinctive categorical method as

opposed to a “non-categorical” alternative. Secondly, she believed that

qualitative description is neither a new method, although unacknowledged, nor

a nursing adaptation of grounded theory, phenomenology or ethnography as

proposed by Throne et al. (1997). However, a researcher whist conducting a

qualitative description may employ one or two techniques associated with

phenomenology, ethnography or grounded theory as necessary (Sandelowski,

2000). Finally, Sandelowski considered qualitative description as less

interpretive than “interpretive description”. However, this author believes that the

degree of interpretation should be left to the discretion of the researcher as the

demarcation between less and more interpretation is very subjective.

Furthermore, the nature of the research project rather than the label of

qualitative approach should dictate the degree of interpretation.

120

The research question, to explore patients’ experience and views with

the service provided at the pain clinic, guided the author to choose the

appropriate design. The process began with matching the research question to

the goal(s) of the five most commonly used qualitative research designs

identified by Creswell (2007) namely case study, ethnography, grounded theory,

phenomenology and narrative research. After extensive reading of the literature,

consultations with colleagues, supervisors and other qualitative researchers, it

was concluded that none of these approaches were a good fit to answer the

research question. This author realised that it is difficult to apply traditional

qualitative designs to practice-based research questions. Learning from the

criticism of nurse phenomenologists, the author was reluctant, although

tempted, to label his approach as phenomenology as it would have cast doubts

in the minds of the readers and questioned the credibility of the study.

Interpretative description and qualitative description were the best labels for the

qualitative approach being used in the present study. Although the approaches

are similar in a number of ways, as described in the above paragraphs, the

study design was labelled as qualitative description: because, the author does

not see the method as “non-categorical” and believes that interpretation by the

researcher is the essence of all research methods. Furthermore, findings

produced by qualitative descriptive studies are data-near – which is what this

author wanted. Sandelowski pointed out that qualitative description should not

be seen as a “quick-fix, data to go, smash-and-grab” type of research. The

rationale behind all the decisions made during sampling, data collection and

data analysis should be presented (Sandelowski, 2010). To ensure rigour, in the

following chapter (Chapter 4), all the choices made during data collection and

analysis have been debated and justified.

121

CHAPTER 5

METHODS

122

CHAPTER 5

METHODS

5.1 Introduction

In the previous chapter, research methodologies available to healthcare

researchers were described and the choice of mixed-methods methodology in

guiding this research study was justified. Following that, the rationale for

choosing an embedded design in relation to answering the research question(s)

was discussed. Finally, the selection of quasi-experimental and qualitative

descriptive designs were debated and justified.

In this chapter, the methods used within the quasi-experimental and the

qualitative description are explained. The chapter begins with an explanation of

the process of obtaining ethical and governance approval for the present study,

and steps taken to ensure the ethical conduct of the research. The chapter

consists of two interlinked sections: In the first section, procedures for sample

size calculation, sampling and subject recruitment, data collection, and data

analysis for the quasi-experimental design are explained. In the second section,

the same issues for the descriptive qualitative study are discussed. In both

sections, alternative approaches considered at each stage are also discussed

and the choices made are justified.

123

5.2 Research ethics and governance approval

In modern day medical research, it has become the norm for any research

activity involving human participants, human tissues or their clinical data, given

its sensitive nature, to obtain ethical approval by an independent ethics

committee. This is to limit abuse of research participants and to safeguard their

rights. All leading medical and healthcare journals will only publish studies for

which ethical approval has been granted, where applicable.

In this study, the ethics application was submitted to the Leeds West

Research Ethics Committee using the Integrated Research Application System

(IRAS). The University of Leeds acted as the sponsor for the study. After

completing the online application, the supporting documents including research

protocol, invitation letters (Appendices III and IV), GP information sheet

(Appendix V), patient information sheets (Appendices VI and VII), patient

consent forms (Appendices VIII and IX), data collection forms (baseline and

discharge) (Appendices X, XI and XII), and curriculum vitae of the research

team were sent to the committee in the post. The meeting was attended by the

author and one of his supervisors (MB). The committee members, during the

meeting, sought clarification on the process of patient recruitment, use of

multiple questionnaires, and the author’s experience of conducting interviews.

The committee gave provisional favorable opinion subject to minor corrections

in the consent forms, patient information sheet and protocol. All suggested

corrections were made and revised documents were submitted for approval.

Subsequently, favorable ethical opinion was granted (Appendix XIII) by the

committee.

124

Following the successful ethics application, research governance

approval was sought from the NHS for the research to be conducted at Leeds

Community Healthcare NHS Trust. Subsequently, permission was granted

(Appendix XIII) and a letter of access for research (Appendix XV) was issued by

the relevant authorities. Participant recruitment began only after obtaining

research governance approval.

During the course of the study, a few changes were deemed necessary

in the protocol and consequently a notice of substantial amendment, generated

through IRAS, was submitted to the Leeds West Research Ethics committee for

review. The committee gave favorable ethical opinion to the amendments

(Appendix XVI). The amendments included: a reduction in the sample size from

105 to 79; only two questionnaires (BPI and HADS) were used for 3-months

follow-up instead of four (BPI, HADS, SF-36, CPG); 3-months follow-up

questionnaires posted to only the first 30 patients discharged from the service.

The reasons for all these changes are provided later in this chapter.

In the following paragraphs, the key steps taken to ensure ethical

conduct of research in line with the University of Leeds, Research Ethics Policy

and Data Protection Act 1998 are explained.

5.2.1 Informed consent

The process of obtaining informed consent has two components: 1)

providing participants with the necessary information; 2) signing of consent

forms. Since there were two phases of the study, two patient information sheets,

one general (Appendix VI) and one specifically for the qualitative phase

(Appendix VII), were developed to provide patients with the necessary

information to make an informed decision whether or not to participate in the

125

research. The general information sheet and a letter of invitation were sent

together with the clinic appointment letter to patients at least two weeks ahead

of their clinic appointment. This was to ensure that patients had sufficient time to

read, understand and discuss the study with their family and friends. Contact

details were also provided at the end of the patient information sheet, so that

patients could contact the author to obtain further information, if required.

5.2.2 Right of withdrawal

The patients were informed of their right to withdraw at any stage without

giving any reason in the patient information sheet. This information was

reiterated verbally before signing the consent forms before both phases. The

participants were assured that withdrawing from, or not taking part in, the

research would have no negative consequences on the care provided by the

health professionals. During the qualitative interviews, patients were allowed to

stop the interview at any time without providing any reason. Only one patient

withdrew from the study, a few days after enrolling in the study.

5.2.3 Confidentiality and data protection

All necessary measures were taken to ensure the confidentiality of

research participants and data protection. To mask the identity of patients, a

pseudonym and a serial number were assigned to all the patients enrolled in the

study. The master list was kept electronically on a password-protected online

University server. Only members of the research team had access to the master

list. Personal identifiable data were not collected in any of the questionnaires.

All paper-based data were kept under lock and key in a secure room at the pain

clinic. After the completion of baseline data collection, all the paper-based data

were then transferred to the author’s office at the University and placed in a

filing cabinet protected by lock and key. Audio data, gathered through qualitative

126

interviews, were downloaded on a password protected online University server

after every interview. Once downloaded, the audio data were deleted from the

recorder prior to the next interview.

5.3 Quasi-experimental study

As mentioned earlier, a number of quasi experimental designs exist in the

literature and a single group pretest-posttest design was used. In the following

sections, procedures related to patient recruitment, data collection and analysis

are described in detail.

5.3.1 Patient recruitment

All the patients referred to the pain clinic between 31st January 2012 and

31st September 2012 were sent a letter of invitation (Appendix III) and a patient

information sheet (Appendix VI) together with the clinic appointment letter by the

secretarial staff at the pain clinic. The patients were screened for eligibility,

based on the information provided in the referral notes by the GP, against the

inclusion and exclusion criteria (described below). Patients meeting the

inclusion criteria were asked verbally by the author or the clinical nurse

specialist (KM) about their willingness to participate in the research study.

Patients were given additional information pertaining to their participation in the

research, if requested. Once all the information was provided, written consent

was obtained by the author or the clinical nurse specialist (KM). The author

attended the clinic on Wednesdays for the purpose of patient recruitment, since

almost all of the new patients were invited for their first appointment on that day

as routine practice. The patients’ GP(s) were also informed about their

participation in the research through a letter (Appendix V), if agreed by the

patient.

127

5.3.1.1 Inclusion criteria

Patients meeting the following inclusion criteria were recruited:

Age ≥ 18 years.

History of chronic pain for > 3 months.

Adequate ability to read and understand English.

5.3.1.2 Exclusion criteria

The following patients were excluded:

Patients with malignant pain.

Patients with organic brain disease or psychiatric disorders.

Pregnant women.

Patients who required acute medical/surgical intervention for their pain

relief.

5.3.2 Sampling

In medical research a representative sample is usually chosen from the

desired population as studying the whole population is often not practical.

Findings from an unbiased and sufficiently large sample can then be

generalized to the whole population (Zodpey, 2004).

Broadly, there are two types of sampling techniques: probability sampling

and non-probability sampling. Probability sampling is an umbrella term for a

number of sampling techniques in which all the members of the population have

an equal chance of being recruited in the sample (Zodpey, 2004). The key

advantages of probability sampling include: the sample is representative of the

population; statistical inferences are generalizable to the population; and it

minimizes the selection bias. Because of these advantages, probability

128

sampling techniques are considered ideal for quantitative research (Zodpey,

2004). Probability sampling techniques include: simple random sampling;

stratified random sampling; cluster sampling and systematic sampling (Zodpey,

2004).

In non-probability sampling, individuals in a population do not have an

equal chance of being recruited. Since not all the individuals in the population

have an equal chance of being recruited, the sample may not be representative

of the population and statistical inferences made are not often generalizable to

the population. Consequently, non-probability sampling is considered to be

inferior to probability sampling in quantitative research (Castillo, 2003). Non-

probability sampling techniques are often employed when probability sampling

is not possible for practical reasons. Non-probability sampling is quicker,

cheaper and easier compared to probability sampling (Castillo, 2003). Non-

probability sampling encompasses a number of sampling techniques and the

commonly used techniques include: quota sampling; consecutive sampling;

convenience sampling; purposive sampling; and theoretical sampling (Castillo,

2003).

In this study, a consecutive sampling technique was used to recruit

patients. Consecutive sampling, a non-probability sampling technique, aims to

include all the accessible subjects. Ideally a probability sampling technique,

either simple random or systematic sampling would have been used to limit

selection bias. However, consecutive sampling is considered the best non-

probability sampling technique (Castillo, 2003) as it gives an opportunity to all

the participants to be recruited thus minimizing the selection bias. Consecutive

sampling, as opposed to simple random or systematic sampling, was chosen

due to a limited pool of potential participants as well as slow discharge rate.

129

Being a pretest-posttest study, baseline assessment was necessary; therefore,

only new patients could have been recruited. On average, 150 to 200 new

patients used to attend the clinic and were usually discharged after 6 to 8

months. Furthermore, a three month follow up was also planned to document

short to medium term outcomes of the intervention. Given the nature of the

study design and discharge rate of the clinic, employing a probability sampling

technique would have required more time to recruit research participants. Since

the research was undertaken as part of a PhD dissertation, the author had a

maximum of one year to complete the data collection in order to ensure timely

completion of the degree. Furthermore, the issue of selection bias was not

substantially important as there was no control group and all patients referred to

the clinic were invited to participate in the study, rather than based on the

author’s personal preference.

5.3.3 Sample size

One of the most important issues in a quantitative study design is a careful

estimation of sample size (Emanuel et al., 2000). Irrespective of how robust the

study design is, if the sample size is smaller than required, it is highly likely that

the study may fail to detect a difference in the presence of a real difference

(Type II error) (Zodpey, 2004). Furthermore, underpowered trials are considered

“scientifically useless” (Altman, 1980) and therefore unethical (Halpern et al.,

2002). However, meta-analysis of clinically homogenous studies can overcome

the said problem. In practice, it may not be always possible to recruit the

required number of participants in the research study. On the other hand,

recruiting more participants than required is also unethical and would result in

wastage of time and resources (Zodpey, 2004).

130

In this study, pain intensity was the primary outcome and the sample size

calculations were based on the pain scores measured by the numerical rating

scale (NRS). Initially a sample size of 105 was calculated using an online

webulator (Montelpare, 2011) after accounting for a 15% dropout rate. The

calculation was based on an assumed rather than actual standard deviation

(SD). After recruiting the first 30 patients, the SD was calculated and the sample

size was recalculated based on the new SD value using the formula (explained

below). After accounting for the 15% drop out, the new sample size was

calculated to be 79.

The sample size was calculated using the following formula (Eng, 2003):

Where N= total sample size; σ = Standard deviation (σ value = 1.60 obtained

from the first 30 patients); Zcrit = Standard normal deviate corresponding to the

selected significance criteria and confidence interval (Zcrit value = 1.96

corresponding to 95% confidence interval and significance criteria of 0.05) ; Zpwr

= Standard normal deviate corresponding to selected statistical power (Zpwr

value = 0.842 corresponding to 80% power); D = minimum expected difference.

In this study, pain intensity is the primary outcome measure measured on an

11-point, 0-10 numerical rating scale (NRS). For NRS a 10% to 20 % (1.1 to 2.2

point) decrease is considered to be the minimum clinically important difference

(Dworkin et al., 2008). In order to ensure that the study is powered to detect the

minimum clinically important difference, a D value of 1.1 was chosen for the

calculation of sample size.

The recalculation of sample size prevented over recruitment and

unnecessary burden on patients. As mentioned earlier, the sample size was

131

recalculated because the earlier calculation was based on an assumed SD

rather than the actual SD. As per the requirement of ethics approval, any

change in the protocol should be brought to the attention of the committee.

Therefore, a notice of substantial amendment was submitted to the REC to

highlight the change in the sample size, together with the other above

mentioned changes, for review. The reason for the change in the sample size

was also explained in the application. Subsequently, favorable ethical approval

was obtained (Appendix XVI).

5.3.4 Data collection

Once the written informed consent was obtained from the patients, they were

requested to fill in the questionnaires (the Brief Pain Inventory, the SF-36, the

Hospital Anxiety and Depression Scale, and the Chronic Pain Grade

questionnaire) prior to their first consultation with the nurse and/or the

pharmacist as part of the baseline assessment (pretest; T0). It should be noted

here that, as a routine clinical practice, all the patients referred to the pain clinic

were asked to complete the BPI and the HADS. For the purpose of this study,

participants completed two additional questionnaires (SF-36 and CPG). The

rationale for choosing these specific outcome measures and their respective

instruments is explained in the next section of this chapter. Sociodemographic

and clinical data were also collected on a structured questionnaire (explained

below) by the author from patients’ clinical notes and patient interview.

Two post-tests were undertaken: upon discharge from the pain clinic,

and at 3-month post-discharge. The decision to discharge patients from the

service was made by the clinical nurse specialist (KM) in consultation with the

patient after assessing their clinical needs. Upon discharge, after the last

consultation, patients were asked to complete the same set of questionnaires

132

(BPI, HADS, SF-36, CPG) by the clinical nurse specialist (KM). The patients

completed the questionnaires at the pain clinic. For the 3-month follow-up,

questionnaires (BPI and HADS) were posted to the patients’ home addresses

together with a letter of invitation (Appendix IV) to complete the 3-month follow-

up and a self-addressed pre-paid envelope. Patients were requested to

complete the questionnaires and return them within one week of receiving them.

For each patient enrolled in the study, the date of discharge and a due date for

3-month follow-up were recorded and kept under lock and key by the author at

the pain the clinic. The process of data collection is shown in Figure 5.1.

As mentioned previously (section 5.2), two changes were made in the

initial protocol in relation to the 3-month follow-up: Firstly, instead of requesting

the patients to fill in all four questionnaires (BPI, CPG, SF-36, HADS), the

patients were asked to complete only two questionnaires (BPI and HADS).

There were two interlinked reasons to make this change: to reduce patient

burden; and to improve response rate. During the baseline assessment, a

number of patients expressed concerns about the length of the questionnaire

especially the SF-36. Furthermore, a low response rate with postal

questionnaires is well documented in the literature and it was a concern that the

patients might not fill in and return the questionnaires because of their length.

Secondly, only the first 30 patients discharged from the service were invited to

take part in the 3-month follow-up assessment as opposed to all the 79 patients,

initially proposed. There were two main reasons for reducing the sample size for

the 3-month follow-up:. Firstly, slow recruitment of patients in the study as the

research team was only able to recruit less than half of the patients meeting the

inclusion criteria,. Secondly, a slow discharge rate from the service was also

observed. While designing the study, it was assumed that patients would be

133

discharged after 4 to 6 months but in practice it was realized that most of the

patients were taking more than six months to be discharged from the service.

Given the limited time to complete data collection, being a PhD research

project, all of the above mentioned factors necessitated a reduction in the

sample size for 3-month follow-up. . The ethics committee was notified about

these changes through a notice of substantial amendment, generated through

IRAS. The committee gave favorable ethics opinion after the review of the

application (Appendix XVI).

The follow-up data collection was stopped when the service was

decommissioned by the local PCT in December 2012, effective March 2013.

However, no new patients were seen at the clinic since December 2013. The

existing patients were either referred to a local Musculoskeletal service or

discharged back to their GPs. The implications of decommissioning of the

service in relation to the findings of this study are discussed in section 8.5.

5.3.4 Outcome measures

The following outcome measures and respective scales were selected

based on demonstrated validity and reliability in chronic pain clinical trials. The

selection of outcome domains is supported by the recommendations of the

Initiative on Methods, Measurement, and Pain Assessment in Clinical Trials

(IMMPACT) group, an initiative to improve the design, conduct and reporting of

clinical trials on pain. All the scales described below can be self or interviewer

administered.

134

Ethics & R&D approval

3-month follow up (T2)

Patient Discharge (T1)

Data Analysis

Patient recruitment Sample size = 79 (T0)

Administration of

questionnaires

HADS, BPI, SF-36, CPG

Patient interview

s at Clinic

Patient consent

Royal Mail BPI, HADS

Figure 5.1. The research process

135

5.3.4.1 Sociodemographic and clinical data

Sociodemographic data (age, gender, ethnicity, and employment status

etc.) and history of chronic pain (pain sites, duration of pain, and referral to pain

specialist in the past) were collected through a structured questionnaire

(Appendix X) by the author. Additionally, at baseline, data on co-morbidities,

route of referral and medication history were collected on another structured

data collection form (Appendix XI). The discharge data collection form

(Appendix XII) was used to gather data on the change in medication based on

recommendations made by the clinical nurse specialist and/or the pharmacist,

the number of visits to the pain clinic and the nature of consultation. The author

designed these data collection forms. Three senior academics (MB, SJC, DA)

reviewed the data collection forms for accuracy, adequacy, face and content

validity. The clinical nurse specialist (KM) was also consulted for the

appropriateness and practicability of the forms. Subsequently, changes were

made to the forms in light of the feedback. Finally, the data collection forms

were pilot-tested on 3 patients.

5.3.4.2 Pain intensity

Pain intensity is a quantitative estimate of severity or magnitude of pain.

Both generic and disease specific questionnaires exist in the literature to

measure pain intensity (Dworkin et al., 2005). Since various types of chronic

pain patients are referred to the pain clinic, the use of a disease specific

questionnaire was deemed inappropriate. The numerical rating scale (NRS),

visual analogue scale (VAS) and visual rating scale (VRS) are the most

frequently used generic instruments to measure pain intensity (Dworkin et al.,

2005). NRS is an 11-point scale ranging from 0 = no pain to 10 = ‘pain as bad

as you can imagine’ (Cleeland and Ryan, 1994). Typically, a VRS categorises

136

pain intensity into one of the four categories: none, mild, moderate, and severe.

VAS consists of a 10 cm line with no pain at one end and worst imaginable pain

at the other (McCormack et al., 1988). All three instruments have demonstrated

validity and reliability. However, no single scale has persistently established

greater responsiveness in detecting improvements in pain treatment (Jensen

and Karoly, 2001). In terms of patient preference, VAS is least preferred

compared to NRS and VRS (Jensen and Karoly, 2001). VAS is associated with

greater missing and incomplete data compared to NRS as NRS is relatively

easy to administer. Furthermore, patients with old age or who take opioid

analgesics have difficulty in filling in VAS (Jensen and Karoly, 2001). Similarly,

patients with cognitive impairment find NRS difficult to respond to (Jensen and

Karoly, 2001).

After careful consideration of the advantages and disadvantages of each

of these scales and reviewing the recommendations of The IMMPACT group

(Dworkin et al., 2005), an 11 point (0-10) numerical rating scale (NRS) ranging

from 0 = no pain to 10 = ‘pain as bad as you can imagine’ was selected. NRS

was administered as part of the Brief Pain Inventory (BPI) (Cleeland and Ryan,

1994). NRS is simple and, easy to administer and score (Jensen and Karoly,

2001, Dworkin et al., 2005).

5.3.4.3 Physical functioning

Chronic pain restricts daily life activities and physical functioning.

Theoretically, pain relief should be complemented with an improvement in

physical functioning but studies have shown that pain intensity and physical

functioning are not significantly associated (Turk, 2002). For this reason, using

measures of physical functioning in trials assessing the effectiveness of

interventions in chronic pain management is recommended (Dworkin et al.,

137

2005). Both generic, such as the BPI (Cleeland and Ryan, 1994) and the

Multidimensional Pain Inventory (MPI) (Kerns et al., 1985), and disease specific

measures, such as WOMAC (Bellamy, 1996) and the Roland and Morris Back

Pain Disability scale (Roland and Morris, 1983), for assessing physical

functioning exist in the literature. The IMMPACT group recommends the use of

a disease specific tool for assessing physical functioning in studies where a

well-established and validated tool is available for that particular disease

(Dworkin et al., 2005). However, disease-specific measures of physical

functioning do not exist for all types of chronic pain. Therefore, generic

measures should be used when the study population consists of patients with

different types of chronic pain conditions (Dworkin et al., 2005).

Since patients with a variety of chronic pain conditions were referred to the

pain clinic, only generic measures were considered for selection. The IMMPACT

group recommends either pain interference items of BPI (Cleeland and Ryan,

1994) or MPI (Kerns et al., 1985). MPI is a 9-item questionnaire which assesses

a number of dimensions of chronic pain experience, including pain intensity,

emotional distress, cognitive and functional adaptation, and social support. On

the other hand, BPI is a 7-item instrument and measures pain interference with

seven daily life activities including general activity, walking, work, mood,

enjoyment of life, relations with others and sleep (Cleeland and Ryan, 1994,

Cleeland et al., 1996). The validity and reliability of both instruments have been

documented in different settings and languages (Dworkin et al., 2005). Unlike

BPI, MPI does not assess pain interference with sleep, an important outcome;

therefore, a valid and reliable measure is required to assess the impact of pain

on sleep if MPI is used (Dworkin et al., 2005).

138

BPI was chosen for the present study because it is shorter and unlike MPI

it precludes the necessity of using another questionnaire to assess the impact of

pain on sleep, preventing an undue burden on the patients. In the BPI, each of

the seven interference items is scored on an 11-point (0-10) scale ranging from

0 = does not interfere to 10 = completely interferes (Appendix XVII). BPI pain

interference is calculated as the mean of the seven interference items. This

mean can be used if more than 50%, or four of seven, of the total items have

been completed on a given administration (Cleeland and Ryan, 1994).

5.3.4.4 Emotional functioning

Mood disturbances, anxiety, anger and depression are well reported

consequences of chronic pain (Fernandez, 2002). Depression combined with

physical illness has greater adverse outcomes than physical illness alone (Stein

et al., 2006). However, assessment of emotional functioning in chronic pain

patients is a challenge because some of the symptoms of depression such as

fatigue, reduced libido and weight gain are also associated with chronic pain

itself and medication used for its treatment (Gallagher and Verma, 2004).

A number of instruments to measure emotional functioning exist in the

literature such as the Hospital Anxiety and Depression Scale (HADS) (Zigmond

and Snaith, 1983), Beck Depression Inventory (BDI) (Beck et al., 1961), the

Patient Health Questionnaire (PHQ-9) (Spitzer et al., 1999), the General Health

Questionnaire (GHQ-28) (Goldberg and Williams, 1988), the Centre of

Epidemiology Studies-Depression (CES-D) (Radloff, 1977), the Geriatric

Depression Scale (GDS) (Yesavage et al., 1983), and the Profile of Mood

States (McNaire et al., 1971). Each of these instruments has their own

advantages and disadvantages and explaining all these tools individually is

beyond the scope of this thesis. The IMMPACT group recommends the use of

139

the BDI or the POMS (Dworkin et al., 2005), as both instruments are reliable,

validated and widely used. BDI is a 21-item questionnaire that can be divided

into two subscales: the cognitive-affective (items 1 to 13) and the somatic-

performance (items 14 to 21) (Beck and Steer, 1993). POMS assesses six

mood states: tension-anxiety, depression-dejection, anger-hostility, vigor-

activity, fatigue-inertia, and confusion-bewilderment (McNaire et al., 1971).

Limitations of the BDI include (Richter et al., 1998): high item difficulty, lack of

representative norms leading to uncertainty in the objectivity of interpretation,

debatable factorial validity and poor discriminant validity against anxiety.

Nevertheless, BDI has high internal consistency, high content validity, high

discriminant validity in differentiating between depressed and non-depressed

individuals, and sensitivity to change (Richter et al., 1998).

Since HADS (Zigmond and Snaith, 1983) was routinely used in the pain

clinic to assess emotional functioning, it was decided to continue its use in the

present study. Asking patients to fill in another questionnaire to assess the

same outcome would have put patients under unnecessary burden. Substituting

HADS with BDI or POMS would have affected the routine clinical practice which

was undesirable. Furthermore, HADS is shorter as than BDI and has well

documented validity and reliability (Bjelland et al., 2002). It was developed to

identify possible cases of anxiety and depression among patients in non-

psychiatric clinics. It consists of two subscales; Anxiety subscale (HADS-A) and

a Depression subscale (HADS-D). Each subscale consists of 7-items and each

item has four numerical response options from 0 to 3 with a minimum score of 0

and a maximum of 21 for each subscale. The mean cut-off score for HADS-A

and HADS-D is 8 (Bjelland et al., 2002). A review by Bjelland and colleagues

140

(2002) concluded that HADS is a valid and reliable tool to detect anxiety and

depression and assess their symptom severity in primary care.

GL assessment holds exclusive copyright of HADS. An agreement with GL

assessment was signed and license fees were paid to ensure lawful use of the

questionnaire (Appendix XVIII).

5.3.4.5 Quality of life

Chronic pain adversely affects the quality of life of patients. The IMMPACT

group has not identified Health-related quality of life (HRQoL) as an

‘independent outcome domain’, but it recommends the use of a generic HRQoL

measure (e.g. SF-36) in trials evaluating the effectiveness of an intervention in

chronic pain (Dworkin et al., 2005). The use of a generic HRQoL measure has

been recommended because: it allows a meaningful comparison with other

disease conditions; and the data could be used in cost-effectiveness analyses.

HRQoL instruments can be divided into three categories with each type

having its own specific clinical and research use: generic measures, condition-

specific measures, and preference-based measures (Vetter, 2007). The ten

most cited generic and preference based QoL measures include (Vetter, 2007):

the SF-36 (Ware and Sherbourne, 1992), the EuroQol Scale (EQ-5D) (Rabin

and de Charro, 2001), the Nottingham Health Profile (NHP) (McEwen and

McKenna, 1993), the SF-12 (Ware Jr et al., 1996), the Sickness Impact Profile

(SIP) (Bergner et al., 1981), the Health Utilities Index (HUI) (Furlong et al.,

2001), the World Health Organization Quality of Life Scales (WHOQOL) (The

WHQOL Group, 1995), the Dartmouth COOP and Dartmouth COOP/WONCA

Charts (Nelson et al., 1996), the Quality of Well-Being Scale (QWB) (Kaplan et

al., 1993) and the SF-6D (Brazier et al., 2002).

141

In the present study, HRQoL of life was used as an independent

outcome measure because, arguably the improvement in physical functioning

and pain relief should also be reflected in the improvement in overall quality of

life. The Medical Outcomes Study-Short Form version 2 (SF-36v2)® was used

for measuring the HRQoL (Ware and Sherbourne, 1992). Initially, while

designing the research project, the length of the questionnaire was a source of

concern and shorter alternatives such as SF-12 and SF-8 were considered. But

unlike the SF-36, both the SF-12 and the SF-8 do not have pain items in the

questionnaire therefore SF-36 was chosen. Furthermore, the IMMPACT group

also recommends the use of SF-36 as a generic HRQoL tool. SF-36 consists of

eight subscales: Physical Functioning (PF), Role-Physical (RP), Bodily Pain

(BP), General Health (GH), Vitality (VT), Social Functioning (SF), Emotional

Role (ER) and Mental Health (MH) (Appendix XIX). Scores for each variable are

summed then transformed into a Likert scale ranging from 0 (worst) to 100

(best) (Ware et al., 2005). Various studies have documented the validity and

reliability of the SF-36 in different settings and languages (Sersic and Vuletic,

2006, Leung et al., 2010, Chia et al., 2006, Almborg and Berg, 2009, Kosinski et

al., 1999). It is suitable for adults ≥ 18 years of age and can be self, telephone

or interviewer administered.

Quality Metric Incorporated (QM), Lincoln RI, USA has the exclusive

copyright for SF-36. A non-commercial license agreement was signed between

the Office of Grants and Scholarly research (OGSR), Quality Metric

Incorporated and the author to enable the use of SF-36 in this research project.

Under the agreement 360 copies of SF-36v2 together with the e-manual and

scoring software v4 were provided by QM free of cost.

142

5.3.4.6 Chronic Pain Grade questionnaire (CPG)

The Chronic Pain Grade (CPG) questionnaire was used, in addition to as

an outcome measure, to assess pain severity among patients referred to the

pain clinic. The World Health Organization’s International Classification of

Functioning Disability and Health (ICF), provides a standard framework for the

comparison and understanding of health outcomes, and has identified three

main outcomes for chronic pain namely, impairment (I), activity limitation (A)

and participation restrictions (P) (World Health Organization, 2001). The CPG

measures all three of these ICF outcomes (Dixon et al., 2007) (Appendix XX).

The CPG is a seven-item questionnaire and measures pain severity in

three dimensions: persistence, intensity and disability (Von Korff et al., 1990).

Three questions (questions 1 to 3) measure pain intensity, each item using an

11-point numerical rating scale (NRS) ranging from 0 = no pain to 10 ‘worst pain

you can imagine’. Another three (questions 5 to 7) measure pain related

disability, each item using an11-point numerical rating scale (NRS) ranging from

0 = no pain to 10 ‘worst pain you can imagine’. One question (question 4) gives

disability points based on the number of days in the past six months the

respondent was unable to do his/her regular work because of pain ( 0-6 days 0

points; 7-14 days 1 point; 15-30 days 2 points; >= 31 days 3 points). Based on

the pain intensity score, disability score and disability points, CPG classifies

chronic pain patients into one of the five hierarchical categories according to

pain severity: Grade 0, Pain free; Grade I, low disability-low intensity; Grade II,

low disability-high intensity; Grade III, high disability-moderately limiting; and

Grade IV high disability-severely limiting. The questionnaire was originally

proposed by Von Korff et. Al. (1992) and has been validated in the UK general

population (Smitha et al., 1997). The method proposed by Von Kroff et al.

143

(1992) was used for the scoring and classification of patients in the above

mentioned chronic pain grades.

5.4 Data analysis

The Statistical Package for Social Sciences (SPSS) for Windows version

20 (Chicago, IL, USA) was used for data analyses. All quantitative data were

coded numerically (e.g. for gender; male was coded as 1 and female was coded

as 2) and entered into SPSS. Subsequently a codebook was prepared. As

mentioned earlier (section 4.3.4.5), quality of life (SF-36) data (both baseline

and discharge) were entered into the scoring software provided by the Quality

Metric Incorporated (QM), Lincoln RI, USA. Once scoring was completed the

results were exported to SPSS for further analyses. For the Chronic Pain Grade

(CPG), data were entered into Microsoft Excel and the scoring of the

questionnaire was conducted based on the algorithm proposed by Von Korff et

al. (1992). Data were then exported to SPSS for further analyses. Patients were

then classified into IV groups, described above, based on the severity of chronic

pain (Von Korff et al., 1992).

Descriptive statistics such as measures of central tendency and spread

were used to summarise and present data. Since parametric tests have more

statistical power and produce more accurate and precise estimates, they were

preferred over non-parametric tests if data were continuous and normally

distributed (Siegel and Castellan, 1988). However, if the assumptions of

parametric tests were not met, for example, if the data were skewed, non-

parametric tests were used. Data were considered normally distributed if the

skewness value was between +1 and -1, calculated using SPSS. (Altman,

1991). Data are reported as mean and standard deviation, if normally distributed

and as median and intra-quartile range (IQR), if not normally distributed.

144

Since data were paired (repeated measures; pretest-posttest study

design), either the paired t-test (comparing means) or its non-parametric

equivalent the Wilcoxon Signed-Rank test (comparing medians) was used

based on the distribution of the data. The Wilcoxon Signed-rank test was used

for comparing baseline and discharge scores of pain intensity, physical

functioning, anxiety and depression, and pain intensity and disability (measured

by CPG). The paired t-tests were used for comparing quality of life data. The

Wilcoxon signed rank test was preferred over the Sign test, an alternative test

for two related samples, because the Wilcoxon Signed-rank test is statistically

more powerful. This is because in addition to assigning positive or negative

ranks to the observations according to where they lie above or below some

hypothesized value, it also takes magnitude of the observation into account

unlike the sign test (Siegel and Castellan, 1988). In the results chapter (Chapter

6), to enhance clarity, the name of the statistical test used to calculate the P-

value is also given at the bottom of each table, where applicable. A two-tailed P-

value of less than 0.05 was considered statistically significant.

5.5 Descriptive qualitative study

The primary objective of the qualitative phase was to explore patients'

views around their experiences and satisfaction with the service provided by the

nurse-pharmacist managed pain clinic. The rationale for choosing a descriptive

qualitative design has been explained in chapter 3. In the following sections,

procedures for subject recruitment, sampling, data collection and data analysis

are explained. Alternative approaches, where available, are also presented and

the rationale for choosing a particular approach is justified.

145

5.5.1 Selection of patients

As mentioned earlier, an embedded design was used for this study and

therefore, the process of patient recruitment for the qualitative phase was

nested within the process of recruitment for the quantitative phase (see section

5.3.2). Within the consent form for the quasi-experimental study (quantitative

phase), patients were also asked about their willingness to participate in the

qualitative interview upon discharge from the service. Patients who indicated

their willingness constituted the sampling frame for the descriptive qualitative

study. However, patients were allowed to withdraw their consent and refuse to

participate in the interview at any stage before, or upon, discharge from the

service. Whilst discharging patients, the clinical nurse specialist (KM) sought

their willingness to take part in the interview. If willing, the contact details (name

and telephone number) of the patient were communicated to the author. The

author then arranged the time and date of the interview based on the patients’

preference. In addition to the inclusion and exclusion criteria for the quasi-

experimental phase, the following inclusion and exclusion criteria were applied

for the qualitative descriptive study.

5.5.1.1 Inclusion criteria

Discharged from the service within the study period.

5.5.1.2 Exclusion criteria

Referred to secondary care after the first consultation.

Discharged from the service due to nonattendance at two consecutive

consultations without informing the clinic staff.

146

Patients deemed unsuitable for an interview due to communication or

medical issues (e.g. speaking/listening disability, patients with psychiatric

disorders) identified by the clinical nurse specialist.

5.5.2 Sampling

Like quantitative research, sample selection can profoundly affect the

quality of qualitative research (Coyne, 1997). In the past, qualitative researchers

had been criticized for not describing the sampling strategy adequately resulting

in difficulties in interpretation and study replication (Kitson et al., 1982). Unlike

quantitative research, the aim of sampling in qualitative research is not to recruit

a statistically representative sample of respondents in order to generalize

findings to the population (Pope et al., 2000). But instead, as Morse (1991b)

pointed out, sampling in qualitative research is based on the principle of

appropriateness that requires purposeful sampling and a ‘‘good’’ informant (i.e.

one who is articulate, reflective, and willing to share with the interviewer)’ (p.

127) (Morse, 1991b). The sample size for qualitative study is usually small as

the focus of qualitative research is to provide an in-depth understanding of the

phenomenon under study rather than statistical generalization (Crouch and

Mckenzie, 2006). The principles of quantitative sampling are not applicable to

qualitative studies for both practical and theoretical reasons (Marshall, 1996).

Firstly, random sampling only produces a representative sample only if the

study variables are normally distributed within the population. But qualitative

studies explore attitudes, beliefs and values which are not normally distributed

within the population (Marshall, 1996). Secondly, it is well known among the

qualitative researchers that some participants are “richer” than others and such

participants are more likely to provide an in-depth insight on the research

question therefore choosing someone at random may be inappropriate

147

(Marshall, 1996). On the other hand, purposeful sampling may enable a

researcher to find a rich-informant. It can also be argued that the qualitative

researchers should not waste their time and resources in doing random

sampling as the aim of qualitative sampling techniques is not to select a

statistically representative sample, a desired characteristic of random sampling

techniques.

A number of sampling strategies are available in qualitative research and

the selection is based on the type of qualitative design and research question

(Miles and Huberman, 1994). According to Patton (1990), all sampling

techniques in qualitative research can be encompassed under the umbrella of

purposeful sampling. Purposive sampling refers to selecting individuals who are

likely to generate ‘appropriate and meaningful data’ (Green and Thorogood,

2009). The aim of purposive sampling is to recruit ‘information rich cases for in

depth study’ (Patton, 1990) (Page 169). Patton (1990) identified 15 different

sampling techniques within purposeful sampling including extreme or deviant

case sampling, intensity sampling, maximum variation sampling, homogenous,

typical case sampling, stratified purposeful sampling, critical case sampling,

snow ball sampling, criterion sampling, theory based or operational based

sampling, confirmation and disconfirmation cases, opportunistic sampling,

sampling politically important cases and convenience sampling. Patton

described theoretical sampling, described by Strauss and Corbin (1990) as a

three stage process consisting of open sampling, relational and variation

sampling and discriminate sampling associated with grounded theory studies,

as a variant of purposeful sampling. Morse (1991b) and Sandelowski (1995)

endorsed Patton’s view (1990) and also recognized theoretical sampling as a

variant of purposeful sampling. Whether theoretical sampling is an independent

148

method or encompassed under purposeful sampling is a debated topic among

qualitative researchers (Patton, 1990, Strauss and Corbin, 1990, Morse, 1991b,

Sandelowski, 1995, Coyne, 1997). However, this author believes that, whether

a qualitative study aims to generate a theory or not, all qualitative researchers

aim to recruit ‘information rich’ participants therefore all the sampling techniques

can be broadly encompassed under purposeful sampling.

In this study, a combination of two purposeful sampling techniques,

namely convenience sampling and maximum variation sampling were used. In

convenience sampling participants are selected because of their convenient

accessibility and proximity to the researcher. Maximum variation sampling aims

at “capturing and describing the central themes or principal outcomes that cut

across a great deal of participant or program variation” (Page 172) (Patton,

1990). Initially for the first five interviews, convenience sampling was used and

patients meeting the inclusion/exclusion criteria and consenting for an interview

were recruited. In order to ensure representation of different types of patients

referred to the clinic, the remaining 14 interviewees were recruited using

maximum variation sampling. Maximum variation sampling is the most

frequently used technique (Sandelowski, 1995).

A framework for maximum variation sampling was developed based on

pain scores on discharge, duration of chronic pain and gender (Figure 4.2). In

the first step, patients were classified into two groups based on pain scores on

discharge: pain score < 7 (mild to moderate pain) and pain score ≥ 7 (severe

pain). Following that, based on duration of chronic pain, the patients were

stratified into two groups: pain duration ≤ 3 years; and pain duration > 3 years.

Finally, each of these four groups was further stratified based on gender.

149

However, any patient meeting the inclusion criteria, who expressed interest in

participating in the interview was recruited.

Ma

xim

um

va

ria

rtio

n s

am

plin

g Pain intesnity ≤ 7

Pain for > 3 years

Female

Male

Pain for ≤ 3 years

Female

Male

Pain intesnity > 7

Pain for >3 years

Female

Male

Pain for ≤ 3 years

Female

Male

Figure 5.2. Framework of maximum variation sampling

150

5.5.3 Sample size

Unlike quantitative research, in qualitative research there are neither rules

nor a priori methods to calculate sample size. Sample size in most of the

published qualitative research is often determined by data saturation

(informational redundancy) (Lincoln and Guba, 1985) or theoretical saturation

(Strauss and Corbin, 1990). However, reported sample sizes are often too small

to support either informational redundancy or theoretical saturation

(Sandelowski, 1995). The concepts of informational redundancy and theoretical

saturation are, although related, different from each other. Informational

redundancy is said to occur when no new information is obtainable from newly

sampled units, and the information obtained therefore becomes redundant

(Patton, 2002). Similarly, Sandelowski (1995) described informational

redundancy as the point when a researcher feels that he has seen and heard

the same thing repeatedly and collecting more data will add no further

interpretive value to existing data. On the other hand, theoretical saturation,

associated with grounded theory inquiry, is said to occur when gathering more

data adds no value to the properties of a theoretical category (Strauss and

Corbin, 1990). It should be noted here that in contrast to informational

redundancy, theoretical saturation is associated with the data interpretations

rather than data collection and it is the endpoint of theoretical sampling and is

achieved via constant comparison analytic technique.

In general, sample sizes in qualitative research should neither be too

small to achieve data saturation nor too large to limit in-depth case-oriented

data analysis (Sandelowski, 1995). The principle of data saturation offers mainly

conceptual guidance rather than practical guidance for sample size estimation

before data collection (Guest et al., 2006) and judgment and experience of the

151

qualitative researcher eventually determines the number of participants in the

majority of qualitative research. Several factors which influence saturation have

been highlighted in the literature including the study aim, nature of topic,

heterogeneity of the population, methods of data collection, groups of special

interest requiring intensive study, study design and quality of data (Morse,

2000, Ritchie et al., 2003, Charmaz, 2006). Based on the type of qualitative

research design, different guidelines on the sample size have been proposed by

researchers ranging from 5 to 50 (Creswell, 2007, Morse, 2000, Ritchie et al.,

2003). Morse (1994) suggested that at least six participants are required when

the goal of the study is to understand the essence of experience. Green and

Thorogood (2009) suggested that for an interview based study saturation

usually occurs after 20 interviews.

In this study, data saturation or informational redundancy was used to

guide sample size. In total, 19 patients were interviewed. The author continued

to interview patients until no new information was coming out during the

interview. The author started to sense data saturation after 17 interviews but

conducted two additional interviews to ensure data saturation. As mentioned

earlier, unlike theoretical saturation, it is not necessary to analyse data

concurrently with data collection to ascertain data saturation. The author

listened to each interview afterwards and made notes of key points. In addition

to listening to the same information repeatedly, this guided the researcher in

establishing data saturation - when the author felt that there was repetition of

the information and key points.

5.5.4 Interviews

Data for qualitative research is gathered through interviews (one to one and

group interviews), observations and reviewing documentary sources (public

152

records, personal documents, mass-media outputs and research outputs). A

researcher may choose one or a combination of two or more techniques (e.g.

interviews + participant observation) for generating qualitative data. Each data

collection technique has its unique advantages and disadvantages and the

choice of a particular method is governed by the study aim and objectives.

Interviews are the most widely used data collection method in qualitative

research. The purpose of a qualitative interview is to gather descriptions of the

life-world of the interviewee (Kvale, 1983). Interviews can be of different types:

structured, semi-structured, in-depth, narrative and informal interviews (Green

and Thorogood, 2009). Keeping in mind the aim of the qualitative phase, semi-

structured interviews were chosen because in semi-structured interviews, the

interview agenda is determined by the researcher but the interviewee’s

responses determine the nature and depth of information unlike the structured

interviews where participants’ responses are fixed (Green and Thorogood,

2009).

Interviews can be conducted face to face, via telephone, internet (email,

Skype and MSN Messenger) individually or in groups and each has its

advantages and disadvantages (Opdenakker, 2006). There are different types

of group interviews namely consensus panel, community interviews and

participatory methods, focus groups and natural groups (Green and Thorogood,

2009). For the present study, all interviews were conducted face-to-face.

Individual face-to-face interviews were selected as they allow more

confidentiality and freedom to express individual experience and feelings and

are not influenced by group interaction and dynamics (Gibbs, 1997). Group

interviews are often difficult to arrange, manage and the researcher has less

control over the data produced (Morgan, 1988). Furthermore, focus groups were

153

not practical for this study due to the nature of the research design and working

of the clinic. The author aimed to interview patients within two weeks of their

discharge from the pain clinic and patients were discharged from the service

from weeks to months apart, making arrangement of focus groups impossible.

Conducting focus group interviews would have inconvenienced patients into

travelling to the interview location from different parts of the city, which

considering the physical disability associated with chronic pain, was not

appropriate. It was also anticipated that recently discharged patients in the

group would have a fresh memory of their experience compared to those

patients discharged months ago; the former might tend to dominate and

influence the group which was not desirable. The major limitation of using

interviews as a data collection tool is that they only provide access to what

people say but not to what they do in their lives (Green and Thorogood, 2009).

However, the study aim was not to document participants’ behavior rather to

explore their views about services at NPMPC for which interviews were best

suited.

As mentioned earlier, interviews were conducted either at the patients’

home or at the clinic based on the patients’ preferences as interview setting

influences the nature and quality of data generated (Green and Hart, 1999).

One interview was conducted at the patient’s work place during a lunch break,

at her request. Patients were explained the purpose of the interview and

measures (such as assigning pseudonyms, not using personal identifiable data

in any publication, and keeping data on a password protected server) taken to

ensure confidentiality. Following this, patients were explained the format of the

interview and informed about the expected length of the interview. Once

explained, patients were asked to sign the consent form. Permission was also

154

obtained to audio record the interview. Interviewees lasted between 15-45

minutes and interviews were audio taped using two digital audio recorders

A topic guide (Appendix XXI) was prepared to ensure uniformity, based

on the literature review and study objectives. Topic guide, frequently used in

semi-structured interviews, contains topics and questions that the interviewer

can ask in different ways for different participants (Lindlof and Taylor, 2002). As

mentioned earlier (Chapter 4, section 4.3), patient satisfaction is a

multidimensional phenomenon therefore the topic guide was designed to cover

the following areas: expectations from the service; efficacy of the service (did it

help? How?); interaction with nurse and pharmacist (time given for consultation,

engaging patient in discussion and designing of therapeutic plan, listening to

and understanding the problem); understanding of chronic pain and self-

management; and overall satisfaction (experience compared to other services in

past, aspects of the service which need improvement etc.) with the service. In

addition, in the beginning of each interview, patients were asked about their

history of chronic pain and its impact on daily life including physical functioning,

emotional functioning and quality of life. Interviewees were given a chance to

express any additional views at the end of the interview. Once prepared, the

author discussed the topic guide with his supervisors, who have substantial

experience of conducting qualitative research, and amended it in light of their

recommendations. A trial interview was also conducted with another PhD

student.

5.5.5 Data management

After each interview, data from both audio recorders were transferred to a

password protected university server. All consent forms were kept under lock

and key in the author’s office at the university. Once transferred, the audio

155

recordings were deleted from both recorders. All interviews were transcribed

verbatim by a professional transcribing company registered with the University

of Leeds. For the purpose of transcribing, the audio files were uploaded on a

secure online server, which were only accessed by the assigned transcriber. All

the interviews were transcribed by a single transcriber. Once transcriptions were

received, the author listened to the audio recordings to check the transcriptions

for accuracy.

5.5.6 Data analysis

A variety of qualitative data analysis methods are available and the

selection of an appropriate method is guided by the study objectives. These

methods can be broadly divided into three categories (Smith and Firth, 2011):

Sociolinguistic methods (discourse and conversation analysis), grounded

theory, and thematic analysis.

Thematic analysis “is a method for identifying, analysing and reporting

patterns (themes) within data” (page 78) (Braun and Clarke, 2006). Thematic

analysis is often seen as a ‘tool’ or a process used within other qualitative data

analysis techniques rather than a specific method on its own. This is because

identifying themes is an integral component of most, if not all, qualitative data

analysis techniques such as grounded theory and interpretative

phenomenological analysis (IPA). However, Braun and Clarke (2006) have

argued that thematic analysis is a definite method in its own right. This author

believes that thematic analysis can be used for either of the above mentioned

purposes, it can be used as a core component of other qualitative data analysis

methods (e.g. grounded theory) and it can be an independent method,

depending on the overall research objective. For this study, keeping in mind the

research objectives, thematic analysis was used as an independent method.

156

Unlike IPA and grounded theory analysis, methods which are tied to a specific

theoretical stance, thematic analysis offers flexibility as it is not tied to any

particular theory and can be applied across different theoretical stances

(Sandelowski, 2000). This is what made it the method of choice for the present

study, keeping in view the pragmatic approach of the author.

5.5.6.1 Process of data analysis

Although thematic analysis is widely used, there is no consensus on how to

undertake a thematic analysis rigorously (Braun and Clarke, 2006). One of the

contributing reasons for the said problem is the fact that the process of data

analysis is often not described in detail in the published qualitative reports.

Braun and Clarke (2006) proposed a six step procedure in an attempt to give

structure to thematic analysis and ensuring transparency. The same six steps,

detailed below, were followed by the author to undertake thematic analysis.

However, it should be noted here, as also highlighted by Braun and Clarke

(2006), that these steps are not sequentially fixed and the researcher is

allowed to move back and forth as needed.

Familiarising with data (Phase 1) - Familiarisation with the data is the

first and the most important step of conducting thematic analysis. The

author familiarised himself with the data through a number of ways:

Firstly, the interviews were conducted by the author which gave slight

flavour of the data; Secondly, each transcript was checked against the

main interview recoding to check the accuracy of the transcription,

providing more in-depth information about the data; and finally the

author read and re-read interview transcripts before formally beginning

the coding of data.

157

Coding of data (Phase II) – A code is “the most basic segment, or

element of the raw data or information that can be assessed in a

meaningful way regarding the phenomenon” (page 63) (Boyatzis, 1998).

Data were coded manually. Interview transcripts were printed using

wide margins, allowing the author to write notes. “Post-it” notes were

also used as required. All interview transcripts were coded line by line

and segments of the transcripts against each code were highlighted

using different color highlighters. The process of coding continued until

all the transcripts were coded. A few examples of coding from an

interview are shown in Table 6.4. The initial coding framework was

checked by two senior qualitative researchers (MB, SJC) for accuracy

and completeness by reviewing two coded interview transcripts.

158

Table 5.2. Example of coding

Data extract Code

Medication, that was it really, which seemed inadequate

most of the time…I didn’t feel that it was doing a lot of

good at the time but in retrospect and also now I

wouldn’t like to be without it……..”

Helpfulness of

medication

“I had undergone various physiotherapies to try and get

rid of it none of which worked, it was still there, and has

been.”

Usefulness of

physiotherapy

Well our marriage has more or less broken and I think

that’s a lot of it is to do with me becoming less and less

able to cope with life in general”

Inability to cope

“I can’t ….I ‘m in enough pain not to be able to tolerate

people who are telling me its not real, you know,

because it is real”

Frustration on

disbelieving

“Up to now, although the pain is still there, they have

taken steps to help the emotional side, which that’s, you

know sort of getting out and meeting people. And [the

nurse] picked on that very quickly, very, very quickly…”

Emotional support

at the pain clinic

“I have more ideas about what I can do to try and

control it. So I do feel a little bit more positive because I

don’t have to just sit and be in pain……”

Self-management

159

Searching for themes; Reviewing themes; Defining and naming themes

(Phase III, IV, V)

Although Braun and Clarke (2006), have described these as individual

phases, in practice, these phases are interlinked and not independent,

especially the later two. Since these phases ran concurrently, for clarity

and easy comprehension, the phases have been merged into a single

phase in the following explanation.

The process began with the searching for themes. Once all the

interviews were coded, a list of all the codes was generated. The author

read through the list of initial codes and removed any duplication. It

should be noted that only duplicated codes were removed but not the

data extracts. Following that, different codes were sorted into potential

themes. The relevant data extracts were collated within these potential

themes. As the new themes emerged, old ones were reviewed and

sometimes renamed in the light of emergence of new themes. Mind

maps were used for collating codes into themes.

Once the initial set of potential themes was developed, then the

process of reviewing and, if required, amending the themes began.

Where deemed appropriate, two themes were collapsed to form a single

theme and where there was not enough data to support a potential

theme, that theme was abandoned. The concepts of internal

homogeneity and external heterogeneity proposed by Patton (1990), for

judging criteria for categories, guided this process. Internal homogeneity

means that the data within each theme should be coherent with each

other, while external heterogeneity means that each theme should be

clearly different from each other.

160

This to-and-fro process continued until the set of themes was finalized

and named. The research objectives guided the data analysis process. An

example of the above mentioned process is shown in Figure 5.3.

Figure 5.3. Mind map of “impact on life” theme

161

Producing a report (Phase VI) - As with other forms of data analysis, the

final step was writing qualitative results. The findings are presented in

chapter 6 in detail. Data extracts have also been provided to

demonstrate the prevalence of themes and sub-themes.

5.5.6.2 Rigour in qualitative data analysis

In the past, qualitative research in general and qualitative data analysis

in particular have been criticized for lacking rigor and transparency (Poses and

Isen, 1998, Laubschagne, 2003). Like quantitative studies, although in a

different context, rigour and validity are of key importance in qualitative studies.

The appropriateness of using positivist terminologies such as validity and

reliability in qualitative research has been debated among qualitative

researchers (LeCompte and Goetz, 1982, Lincoln and Guba, 1985, Lather,

1993, Sandelowski, 1993), some suggesting to abandon their use and use

alternatives (Ely et al., 1991). Lincoln and Guba (1985) introduced the concept

of trustworthiness in qualitative research and proposed the terms credibility,

transferability, dependability and conformability as qualitative equivalents for

internal validity, external validity, reliability and objectivity respectively.

Whittemore et al. (2001) proposed 29 strategies to ensure ‘trustworthiness’ in a

qualitative study, covering various aspects from study design to final report

writing. Creswell and Miller (2000) outlined eight strategies frequently used by

qualitative researchers including prolonged engagement, triangulation, peer

review or debriefing, negative case analysis, researcher reflexivity, member

checking, rich thick description, and external audits. Creswell (2007) suggested

that at least two strategies should be used in a qualitative project.

162

For this qualitative study, peer review/debriefing and providing rich thick

description (Lincoln and Guba, 1985) were used to ensure credibility and

transferability of the findings. Peer review/debriefing was carried out by the

author’s supervisors (SJC and MB). From study design to report writing, the

author held regular meetings with his supervisors (SJC, MB, DPA) and

discussed various aspects of data collection and analysis. A supervision

meeting report was produced by the author, after each supervision meeting,

detailing the matters arsing and decisions made during the meeting. All the

reports were electronically signed by the main supervisor and where necessary

comments were added.

“Rich thick description” means that a detailed account of the study

settings, participants, sampling technique, and data analysis method should be

provided to ensure transferability of the findings. A detailed account of all

aspects of data collection (sample size, inclusion/exclusion criteria, interview

guide, and data analysis) has been made in the earlier sections of this chapter

to ensure transparency and enabling reading to establish the transferability of

findings to other settings. In addition to these steps, as mentioned earlier, two

senior qualitative researchers (MB and SJC) independently reviewed the codes

and themes against the transcripts.

163

CHAPTER 6

RESULTS OF QUANTITATIVE PHASE

164

CHAPTER 6

RESULTS OF QUANTITATIVE PHASE

6.1 Introduction

The results of the quasi-experimental phase (quantitative) are presented in this

chapter. As mentioned in the previous chapter, both descriptive and inferential

statistics have been used to analyse the data. Figures and tables have been

used and embedded in the text to facilitate reading and comprehension.

The chapter begins with the description of sociodemographic and clinical

characteristics of participants included in the study. Following that, comparison

of all outcome measures at baseline, discharge and 3-month follow-up are

presented. Then, the recommendations, both medicine-related and non-

pharmacological, made to the patients and GPs are described. The chapter

concludes with the summary of key findings. Where findings are statistically

significant P-values are presented in bold text. In addition to reporting measures

of central tendency and spread of data for the outcome variables, where

appropriate, clinically important differences have also been reported, in line with

the recommendations of the IMMPACT group (Dworkin et al., 2008).

165

6.2 Sociodemographic characteristics of the patients

As per the calculated sample size, seventy nine patients were enrolled in the

study. After completing baseline assessment, one patient withdrew from the

study for personal reasons before discharge. The mean age of the patients was

46.5 years SD ± 14.5 (range 22-86). Almost half of the patients were between

36 to 50 years of age (Figure 6.1). Approximately two thirds of the patients were

female (67.1%) and more than half of the participants were married or living with

partner. About a quarter of the patients were working in the private sector

(24.1%) and slightly more than a quarter (25.3%) was unemployed due to pain.

Sixty-seven (84.6%) patients were white (British) while six (7.6%) were

Asian/Asian British. Twenty-nine (36.7%) patients were educated up to

secondary school level. Almost half of the patients, 48.1% and 44.3%, did not

disclose their alcohol and smoking status respectively. Details of

sociodemographic characteristics of patients are presented in Table 6.1

Figure 6.1. Stratification of patients in various age groups

18

37

17

7

0

5

10

15

20

25

30

35

40

18-35 36-50 51-65 >65

Fre

qu

en

cy (N

)

Age in years

166

Table 6.1. Sociodemographics of patients

Characteristic N (%)

Age

(Mean: 46.49 ; SD:14.5) Range (22-86)

18-35 18 (22.8)

36-50 37 (46.8)

51-65 17 (21.5)

>65 7 (8.9)

Gender

Male 26 (32.9)

Female 53 (67.1)

Marital Status

Single 24 (30.4)

Married/living with partner 45 (57.0)

Divorced/separated 6 (7.6)

Widowed 3 (3.8)

Undisclosed 1 (1.3)

Living arrangement

Alone 21 (26.6)

With partner/children 58 (73.4)

Employment status

Public 3 (3.8)

Private 19 (24.1)

Self-employed 3 (3.8)

Retired 14 (17.7)

Unemployed (pain) 20 (25.3)

Unemployed (other reason) 14 (17.7)

Student 2 (2.5)

Undisclosed 4 (5.1)

Ethnicity

White 67 (84.8)

White others 3 (3.8)

Asian/Asian British 6 (7.6)

Arab 2 (2.5)

Undisclosed 1 (1.3)

167

Education level

Undisclosed 10 (12.7)

GCSE/O-Level 29 (36.7)

A-level/NVQ 19 (24.1)

Diploma 5 (6.3)

Degree 10 (12.7)

Postgraduate 6 (7.6)

Alcohol status

Yes 16 (20.3)

No 25 (31.6)

Unknown 38 (48.1)

Smoking Status

Yes 17 (21.5)

No 27 (34.2)

Unknown 35 (44.3)

6.2 History of chronic pain and other medical problems

More than a quarter of the patients (26.6%) reported suffering from chronic pain

for one to three years while nine (11.4%) patients had chronic pain for more

than 10 years (Figure 6.2). Low back (68.4%) followed by lower limb (58.2%)

were the most commonly reported pain sites by the patients (Figure 6.3). It

should be noted that patients were allowed to choose more than one pain site.

The number of pre-existing co-morbidities ranged from zero to four among

patients. Almost half, 34 (43.0%) of the patients, had no other pre-existing co-

morbidity while 19 (24.1%) had at least one comorbidity. Among the patients

with pre-existing comorbidities, sixteen (20.3%) patients had asthma while nine

(11.4%) had Diabetes Mellitus (DM). The majority of patients 56 (70.9%)

reported to have never been referred to a pain clinic/ pain consultant in the past.

In terms of source of referral to the pain clinic, as per the referral guidelines, all

patients were referred by their GPs. However, for 12 patients (15.2%) a hospital

168

physician/consultant requested referral and nine (11.4%) of the patients were

referred on the request of physiotherapists (Figure 6.4). Thirty-five (44.3%)

patients had their first consultation with both the nurse and the pharmacist while

44 (55.7%) patients had their first consultation with the nurse only.

Figure 6.2. Stratification of patients based on pain duration in years

13

21

19

17

9

0

5

10

15

20

25

Less than 1 1 to 3 3 to 5 5 to 10 More than 10

Fre

qu

ncy

(N)

Years

169

Figure 6.3. Chronic pain sites in patients referred to the pain clinic

Figure 6.4. Source of referral to the pain clinic

28

11

28

7 5

54

46

7

2

0

10

20

30

40

50

60

Head,Face,Neck

Cervical Uppershoulderand limbs

Thoracicregion

Abdominalregion

Low back Lower limb Pelvicregion

Anal,Perineal

Fre

qu

en

cy

(N)

72%

15%

12%

1%

Initated by GP

Requested by ahospital doctor

Requested by aphysiotherapist

Self-requested

170

Table 6.2. Pain and other medical history of patients

Item N (%)

Pain Duration (Years)

< 1 year 13 (16.5)

1 to 3 21(26.6)

3-5 19 (24.1)

5-10 17 (21.5)

>10 9 (11.4)

Comorbidity

Diabetes Mellitus 9 (11.4)

Hypertension 8 (10.4)

Asthma 16 (20.3)

Hypothyroidism 6 (7.6)

Ischemic Heart Disease 6 (7.6)

Others 30 (38.0)

Number of comorbidities

None 34 (43.0)

1 19 (24.1)

2 15 (19.0)

3 10 (12.7)

4 1(1.3)

Past visit of pain clinic/consultant

No 56 (70.9)

Yes 23 (29.1)

Route of referral

GP 57 (72.2)

Hospital Doctor 12 (15.2)

Physiotherapist 9 (11.4)

Self 1 (1.3)

Healthcare professional seen

Nurse only 44 (55.7)

Nurse and pharmacist 35 (44.3)

171

6.3 Outcome measures

6.3.1 Pain intensity

As mentioned in the methods chapter, pain intensity was measured using

an 11-point NRS, administered as part of the BPI. Patients were asked to rank

the worst pain, least pain and average pain that they had experienced in the

past 24 hours. Patients were also asked to rank “pain right now” as well using

the same 11-point NRS.

For baseline, pain intensity scores were available for all 79 patients.

However, at discharge pain scores were available for 35 patients only. Since

pain intensity data were not normally distributed therefore the data are

expressed as medians with respective interquartile ranges (IQR). At baseline,

the median values (IQR) of worst pain, least pain, average pain, and pain right

now were 8 (7; 9), 5 (3;7), 7 (5; 8), and 7(5; 8) respectively. Upon discharge,

there was a statistically significant reduction for worst pain (P = 0.02) and

average pain (P = 0.02). However, for least pain and pain right now the

reduction in pain intensity score was not statistically significant (P = 0.12) and

P=0.06 respectively (Table 6.3).

To improve clinical interpretation of the results, patients were classified

into groups based on the recommendations of the IMMPACT group on

benchmarks for interpreting clinically important changes (Dworkin et al., 2008).

As per the recommendations of the IMMPACT group, a 10-20% decrease in

pain intensity was considered minimally important, ≥ 30% decrease was

considered moderately important and a reduction of ≥50% was considered

substantially important (Dworkin et al., 2008). Additionally, patients achieving a

reduction in “average pain” intensity score of less than 10% were grouped under

172

“no meaningful change” and patients for whom “average pain” intensity scores

were more than the baseline scores were grouped under “deterioration in pain

score”. Thirteen (37.1%) patients achieved a minimum clinically important

difference while two (5.7%) each achieved moderately and substantially

important differences (Figure 6.5). For 3-month follow-up, pain intensity scores

were available for 9 patients only. The median (IQR) values for worst pain, least

pain, average pain, and pain right now were 7 (5.50;8), 4 (3;6), 5 (4;6.5), 5 (2;7)

The results of 3-month follow-up were not statistically compared with the

baseline as the number of patients for 3-month follow-up was too small to make

any meaningful comparison.

Table 6.3. Comparison of pain intensity scores at the baseline and discharge

N N* Median (IQR) Z **P value

Worst Pain

Baseline 79 35 8.00 (7.00;9.00) - 2.41 0.02

Discharge 35 7.50 (5.00; 8.00)

Least Pain

Baseline 79 35 5.00 (3.00; 7.00) -1.56 0.12

Discharge 35 4.00 (2.00; 6.00)

Average pain

Baseline 79 35 7.00 (5.00; 8.00) -.2.32 0.02

Discharge 35 6.00 (4.00;7.00)

Pain right now

Baseline 79 35 7.00 (5.00; 8.00) -1.82 0.06

Discharge 35 6.00 (2.00; 7.00)

* Number of patients for whom pain scores were available both at the baseline

and discharge. **Calculated from Wilcoxon-Signed rank test.

173

Figure 6.5. Stratification of patients based on clinically important changes in average pain intensity

6.3.2 Physical functioning

Physical functioning was assessed using the seven interference items of

the Brief Pain Inventory (BPI). These included: general activity, mood, walking

ability, normal work, relationship with other people, sleep and over all enjoyment

of life. In addition, an overall interference score was also calculated based on

the method described earlier in chapter 5 (section 5.3.4.3). Baseline scores

across each domain were calculated for all 79 patients. Discharge results were

available for 35 patients except for sleep, enjoyment of life and over all

interference, which were available for 36 patients.

There were significant reductions in two pain interference domains, sleep

(P = 0.04) and enjoyment of life (P = 0.01) upon discharge. Overall interference

of pain with physical activity was also significantly reduced (P = 0.02). There

7

11

13

2 2

0

2

4

6

8

10

12

14

16

Deteriorationin pain score

Nomeaningful

change

Minimumclinicallyimportant

Moderatelyimportant

Substantiallyimportant

Fre

qu

en

cy (N

)

174

was also a trend of reduced interference in the remaining five domains but this

did not reach statistical significance (Table 6.4).

BPI scores were available for only nine patients for the 3-month follow-

up. Statistical analyses were not performed as the numbers were too small to

make any meaningful comparison between the baseline and 3-month follow-up

results.

Like pain intensity, patients were classified into groups as per the

recommendations of IMMPACT group on benchmarks for interpreting clinically

important changes for physical functioning (Dworkin et al., 2008). A reduction of

one point in the overall interference of pain is considered minimum clinically

important. But unlike pain intensity, criteria for defining a moderate and

substantial change have not been described by the IMMPACT group (Dworkin

et al., 2008). Patients not meeting criteria for the minimum clinically important

difference were either classified into “no clinically important reduction” if there

was a reduction in the overall interference score upon discharge, or into

“deterioration of physical activity” if the overall interference score was higher at

the discharge compared to the baseline (Figure 6.6). Fourteen (40%) patients

achieved minimum clinically important difference.

175

Table 6.4. Comparison of pain interference with physical functioning at baseline and discharge

Item N N* Median (IQR) Z **P

General Activity

Baseline 79 35 7.00 (6.00;9.00) -1.58 0.11

Discharge 35 7.00 (3.00; 9.00)

Mood

Baseline 79 35 7.00 (5.00;9.00) -1.25 0.21

Discharge 35 5.00 (2.00; 8.00)

Walking ability

Baseline 79 35 8.00 (4.00;10.00) -1.43 0.15

Discharge 35 7.00 (3.00;10.00)

Normal work

Baseline 79 35 8.00 (5.00;10.00) -1.93 0.05

Discharge 35 7.00 (4.00;9.00)

Relationship with other people

Baseline 79 35 6.00 (2.00;8.00) -0.21 0.84

Discharge 35 5.00 (1.00;8.00)

Sleep

Baseline 79 35 8.00 (6.00;10.00) -1.98 0.04

Discharge 36 7.00 (4.00;10.00)

Enjoyment of Life

Baseline 79 35 7.00 (5.00;9.00) -2.60 0.01

Discharge 36 6.00 (2.00;9.00)

Over all Interference

Baseline 79 35 7.14 (5.71;8.28) -2.31 0.02

Discharge 36 6.14 (4.00; 8.71)

*Number of patients for whom both baseline and discharge scores were

available.** Calculated from Wilcoxon-Signed rank test.

176

Figure 6.6. Stratification of patients based on clinically important changes in overall pain interference with daily activities

6.3.3 Anxiety and Depression

Anxiety and depression were assessed by using the respective subscales of the

Hospital Anxiety and Depression Scale (HADS). Both HADS-A and HADS-D

were divided into four ranges: normal (0-7); mild (8-10); moderate (11-15); and

severe (16-21). The median HADS-A score at baseline was 10 (7; 14),

calculated for 76 patients (missing data for 3 patients). Almost two-thirds of the

patients (67.1%) had HADS-A scores more than 7, i.e. were likely to have an

anxiety disorder. Twenty-four (31.6%) patients had moderate anxiety (Table

6.5). The median HADS-A score upon discharge was 8.5 (5.75; 12.25),

calculated for 34 patients. However, the reduction in the median HADS-A score

was not statistically significant (P = 0.21). However, for 13 (38.2%) patients

there was a reduction in the severity of anxiety by at least one category (e.g.

moderate to mild or severe to moderate etc.).

4

17

14

0

2

4

6

8

10

12

14

16

18

Deterioration of physicalactivity

No Clinically importantdifference

Minimum clinicallyimportant difference

Fre

qu

en

cy (

N)

177

Table 6.5. Categorisation of patients based on HADS-A scores at the baseline and discharge

HADS-A Baseline

N (%)

N = 76

Discharge

N (%)

N = 34

Change in

category

N (%)

N = 34

Normal 25 (32.9) 14 (41.2) ≤ -1 13 (38.2)

Mild 14 (18.4) 10 (29.4) 0 13 (38.2)

Moderate 24 (31.6) 7 (20.6) ≥ 1 8 (23.5)

Severe 13 (17.1) 3 (8.8)

The depression scores (HADS-D) at baseline were calculated for 76 patients

with a median score of 10.00 (5.00; 13.00). The majority of the patients (46

[60.5%]) had HADS-D scores more than 7, likely to suffer from depression.

Twenty-seven (35.5%) patients had moderate depression and eight (10.5%)

had severe depression (Table 6.6). The HADS-D scores upon discharge were

available for 34 patients with a median score of 8.00 (3.75; 12.25). Like anxiety,

the reduction in the HADS-D score was not statistically significant (P = 0.22).

However, a reduction in severity of depression by at least one category was

noticed in 7 (20.6%) patients (Table 6.6).

For the 3-month follow-up HADS-A and HADS-D scores were available

for nine patients. Of these nine patients, the majority of them (n=6) had their

HADS-A scores less than 7, likely not to suffer from any anxiety disorder. The

remaining three patients had mild (n=1), moderate (n=1) and severe (n=1)

anxiety. Compared to the baseline, at the 3-month follow-up, there was

reduction in the severity of anxiety by at least one category for three patients

(33.3%). While, no change (improvement or worsening) was found for five

178

patients (55.6%) and increase in the severity of anxiety by at least one category

was found in one patient (11.11%).

Similar to the HADS-A score, six patients had their HADS-D scores less

than 7, likely not to suffer from any depression disorder. One each had mild,

moderate and severe depression. Compared to the baseline, there was

reduction in the severity of depression by at least one category for two patients

(22.2%); no change in severity class for five patients (55.6%); and increase in

severity by at least one category for 2 patients (22.2%) at the 3-month follow-up.

Table 6.6. Categorisation of patients based on HADS-D scores at the baseline and discharge

HADS-D Baseline

N = 76

N (%)

Discharge

N = 34

N (%)

Change in

category

N (%)

N = 34

Normal 30 (39.5) 16 (47.1) ≤ -1 7 (20.6)

Mild 11(14.4) 5 (14.7) 0 21 (61.8)

Moderate 27 (35.5) 10 (29.4) ≥ 1 6 (17.6)

Severe 8 (10.5) 3 (8.8)

179

6.3.4 Chronic pain grade

As mentioned in the previous chapter, the CPG questionnaire was scored using

the method suggested by Von Korff et. al. (1992). Patients were classified into

one of the four hierarchical categories according to pain severity:

Grade I, low disability-low intensity.

Grade II, low disability-high intensity.

Grade III, high disability-moderately limiting.

Grade IV high disability-severely limiting.

At baseline, CPG scores were calculated for 76 patients. The median for

pain intensity score was 76.66 (66.67; 83.33) and the median for disability score

was 70 (60.00; 90.00) at baseline. Compared to the baseline, there was a

statistically significant reduction in pain intensity (Median 73.33; IQR 55.00;

83.33) at discharge (P = 0.02). However, no statistically significant improvement

in disability score was found (P = 0.89) at the discharge (Median 73.33; IQR

51.66; 91.67).

At the baseline, a majority of the patients (50 [65.8%]) were categorised

in grade IV. CPG scores at discharge were available for 34 patients. In terms of

change in chronic pain grade, 7 (20.6%) patients reported improvement in

chronic pain grade by at least one grade. However, the majority of the patients,

21 (61.7%) did not report any improvement (Table 6.7).

180

Table 6.7 Comparison of chronic pain grade at the baseline and discharge

Chronic Pain

Grade

Baseline

N (%)

N=76

Discharge

N (%)

N=34

Change in

Grade

(Outcome)

N (%)

N=34

I 2 (2.6) 4 (11.8) ≤ - 1 7 (20.6)

II 13 (17.1) 2 (5.9) 0 21 (61.7)

III 11 (14.5) 7 (20.6) ≥ 1 6 (17.6)

IV 50 (65.8) 21 (61.8)

6.3.5 Quality of life

As discussed in the methods chapter (section 5.3.4.5), quality of life was

assessed using SF-36. It should be noted here that higher scores represent a

better quality of life. Both the individual domain scores and summary scores

(Physical and Mental) have been presented in Table 6.8. The comparison of

QoL scores between baseline and discharge is shown in Figure 6.7. For

individual domain scores, compared to the baseline score statistically significant

improvements were found in physical role (RP) (P= 0.01), bodily pain (BP)

(P=0.01) and social functioning (SF) (P=0.03) at discharge. However, there

were no statistically significant differences in physical component summary

(PCS) scores (P=0.15) and mental component summary (MCS) scores

(P=0.08).

181

Figure 6.8. Comparison of QoL at the baseline and discharge.

PF=Physical Functioning; RP= Physical Role; BP=Bodily Pain; GH=General health; VT=Vitality; SF=Social Functioning; RE=Emotional Role; MH=Mental Health; PCS= Physical Component Summary; MCS=Mental Component Summary

182

Table 6.8. Comparison of quality of life at baseline and discharge

Domain N N*

Mean (SD) T **P

PF

Baseline 78 36 28.84 (11.03) 1.11 0.27

Discharge 36 30.82 (12.92)

RP

Baseline 78 35 24.64 (28.63) 2.89 0.01

Discharge 36 36.66 (33.12)

BP

Baseline 78 36 14.22 (17.56) 3.28 0.01

Discharge 36 28.63 (23.84)

GH

Baseline 77 35 38.97 (23.83) 1.26 0.21

Discharge 35 42.68 (26.41)

VT

Baseline 79 36 26.04 (21.93) 1.73 0.09

Discharge 36 31.30 (25.57)

SF

Baseline 78 36 33.33 (30.17) 2.16 0.03

Discharge 36 42.01 (34.47)

RE

Baseline 77 34 Median 50.00

IQR (20.83;83.33)

Z= -

1.654

***0.098

Discharge 36 Median 54.16

IQR (25.00; 100.00)

183

MH

Baseline 79 36 49.13 (24.63) 0.98 0.33

Discharge 36 52.91 (23.34)

PCS

Baseline 74 33 28.84 (11.03) 1.49 0.15

Discharge 35 30.82 (12.92)

MCS

Baseline 74 33 36.34 (15.17) 1.83 0.08

Discharge 35 41.20 (14.63)

*Based on the number of patients for whom both scores were available.

**Calculated from paired t-test.***Calculated from Wilcoxon signed rank test.

PF=Physical Functioning; RP=Role-Physical; BP=Bodily Pain; GH=General

health; VT=Vitality; SF=Social Functioning; RE=Emotional Role; MH=Mental

Health; PCS= Physical Component Summary; MCS=Mental Component

Summary

184

6.4 Nature of intervention

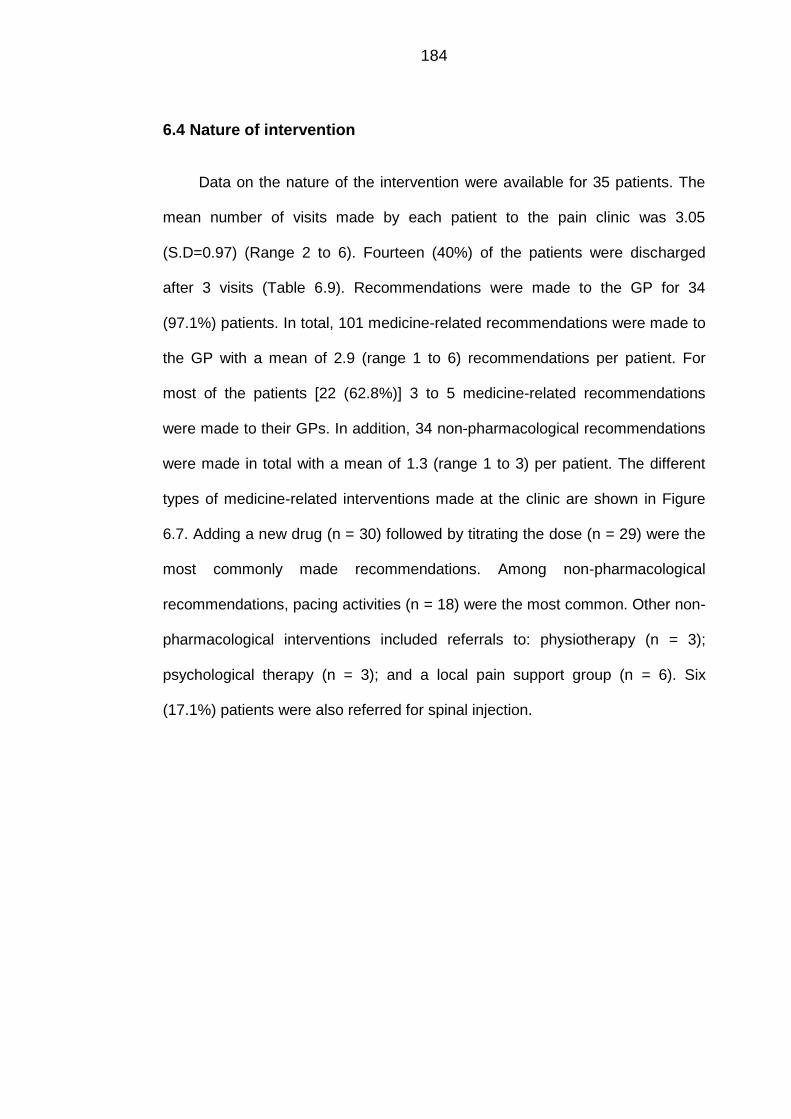
Data on the nature of the intervention were available for 35 patients. The

mean number of visits made by each patient to the pain clinic was 3.05

(S.D=0.97) (Range 2 to 6). Fourteen (40%) of the patients were discharged

after 3 visits (Table 6.9). Recommendations were made to the GP for 34

(97.1%) patients. In total, 101 medicine-related recommendations were made to

the GP with a mean of 2.9 (range 1 to 6) recommendations per patient. For

most of the patients [22 (62.8%)] 3 to 5 medicine-related recommendations

were made to their GPs. In addition, 34 non-pharmacological recommendations

were made in total with a mean of 1.3 (range 1 to 3) per patient. The different

types of medicine-related interventions made at the clinic are shown in Figure

6.7. Adding a new drug (n = 30) followed by titrating the dose (n = 29) were the

most commonly made recommendations. Among non-pharmacological

recommendations, pacing activities (n = 18) were the most common. Other non-

pharmacological interventions included referrals to: physiotherapy (n = 3);

psychological therapy (n = 3); and a local pain support group (n = 6). Six

(17.1%) patients were also referred for spinal injection.

185

Table 6.9. Care process at the pain clinic

Item N (%)

Number of visits

2 11 (31.4)

3 14 (40.0)

4 8 (22.9)

5 1 (2.9)

6 1 (2.9)

Recommendation made to the GP

Yes 34 (97.1)

No 1 (2.9)

Number of pharmacotherapeutic recommendations

No recommendation 1 (2.9)

Less than 3 9 (25.7)

3-5 22 (62.8)

More than 5 3 (8.5)

Referrals

Physiotherapy 3 (8.5)

Spinal injection 6 (17.1)

Psychological therapy 3 (8.5)

Support group 6 (17.1)

186

Figure 6.9. Number of pharmacological recommendations made at the pain clinic

0

5

10

15

20

25

30

35

Adding a new drug Substituting a drug Titrating a dose Stopping a drug No change

Fre

qu

en

cy (

N)

187

6.5 Summary of key findings

Seventy-nine patients were enrolled in the study. Data collection upon

discharge was stopped as the service was decommissioned by the

Leeds Primary Care Trust and was available for 36 patients. 30 patients

were sent the 3-month follow-up questionnaires, only nine patients

returned the questionnaires (BPI and HADS).

Almost half of the patients were between 36 to 50 years of age (range

22-86). Approximately two thirds of the patients were female.

Slightly more than a quarter (25.3%) of patients was unemployed due to

pain.

More than half (56.6%) of the patients had chronic pain for more than 3

years and 56 (70.9%) patients had never been referred to a pain

clinic/consultant in the past.

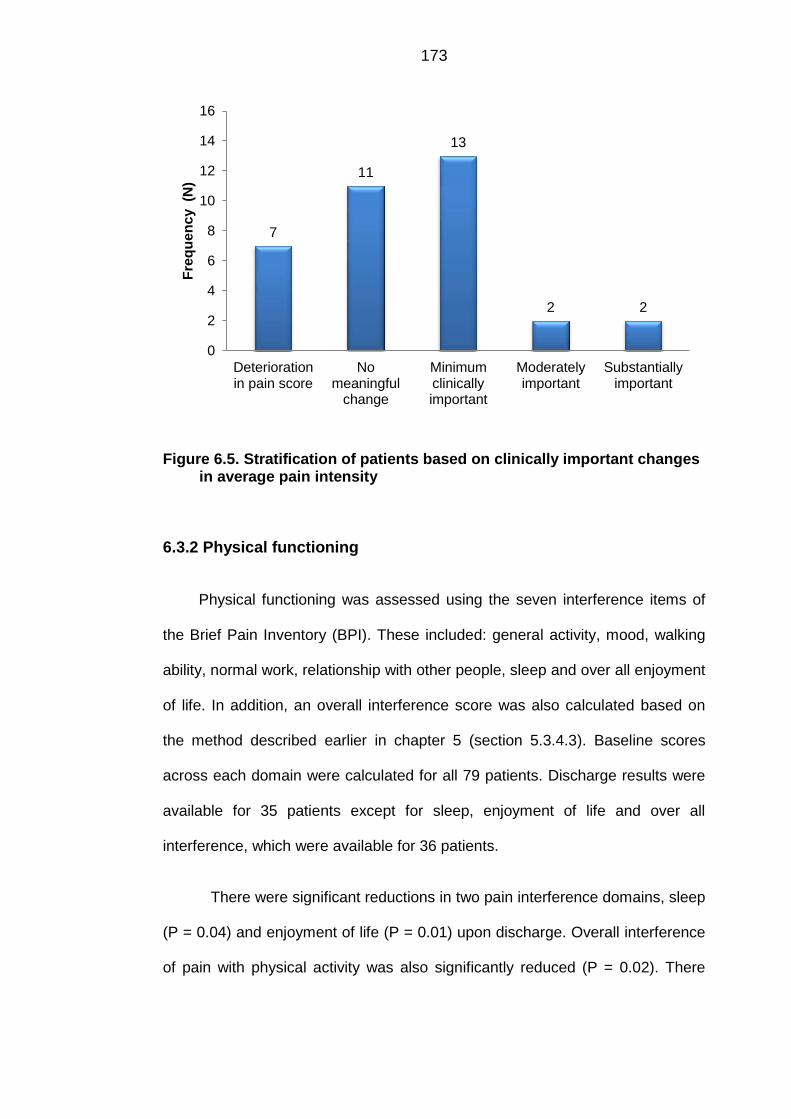
For pain intensity, statistically significant reduction was noted for worst

pain (P = 0.02) and average pain (P = 0.02) but not for (P = 0.12) least

pain and pain right now (P=0.06). Thirteen (37.1%) patients achieved a

minimum clinically important difference while two (5.7%) each achieved

moderately and substantially important differences.

188

For physical functioning, overall interference of pain with physical activity

was significantly reduced (P=0.02) at the discharge. Fourteen (40%)

patients achieved minimum clinically important difference.

For anxiety and depression, no significant differences were found

between baseline and discharge scores for HADS-A and HADS-D.

However, a reduction in severity of anxiety and depression by at least

one category was noticed in 13 (38.2%) and 7 (20.6%) patients

respectively.

For chronic pain grade, 7 (20.6%) patients reported improvement in

chronic pain grade by at least one grade. However, the majority of the

patients, 21 (61.7%) did not report any improvement.

For quality of life (SF-36), among individual domains, there were

significant improvements in physical role (RP) (P=0.01), bodily pain (BP)

(P=0.01) and social functioning (SF) (P=0.03). However, for summary

scores, there were no significant improvements in either physical

component summary (PCS) (P=0.15) or mental component summary

(MCS) (P=0.08).

For 35 patients, 101 medicine-related (2.9 per patient) and 34 non-

pharmacological (1.3 per patient) recommendations were made. Adding

a new drug and titration of the dose were the most frequently made

medicine-related recommendations.

189

CHAPTER 7

FINDINGS OF THE QUALITATIVE PHASE

190

CHAPTER 7

FINDINGS OF THE QUALITATIVE PHASE

7.1 Introduction

This is the second of the two results chapters of this thesis. In the previous

chapter the results of the quasi-experimental study, quantitative phase, have

been presented. In this chapter findings of the descriptive qualitative study are

presented. As mentioned earlier, the main objective of the qualitative study was

to explore patients’ views about their satisfaction with the care received from the

pain clinic. In addition, patients’ experiences of living with chronic pain and

using other chronic pain services were also explored. The rationale and

methods for the descriptive qualitative study have been presented earlier in

chapters 4 and 5.

The chapter begins with a description of the sociodemographic

characteristics of the participants. Following that the key themes and subthemes

which emerged from the data analysis are outlined. Anonymized quotes from

the participants’ interviews have also been provided within each theme and

subtheme, a measure to ensure the trustworthiness of the findings. A theme

summary is also presented at the end of the each theme.

191

7.2 Sociodemographic characteristics of participants

In total, 19 participants including eight males and eleven females were

interviewed. The age of the participants ranged from 27 to 74 years. Ten

interviews were conducted at patients’ homes, eight at the pain clinic and one at

the patient’s office (during lunch break). Interviews lasted between 25 and 45

minutes. The sociodemographic characteristics of the participants are given in

Table 7.1.

Table 7.1. Sociodemographic characteristics of participants

ID Age

in

Years

Gender Employment

status

Marital

status

Chronic

pain

duratio

n

in Years

Pain

intensity

(baseline)

Pt.1 36 Female Full-time Married 5-10 5

Pt. 2 49 Male Full-time Married 5-10 5

Pt. 3 63 Male Retired Married 5-10 5

Pt. 4 30 Male Full-time Married 5-10 6

Pt. 5 74 Female Retired Undisclosed < 1 0

Pt. 6 58 Female Unemployed Divorced > 10 7

Pt. 7 39 Male Unemployed Single 1- 3 7

Pt. 8 40 Female Part-time Married < 1 7

Pt. 9 51 Male Part-time Married 3-5 10

Pt. 10 54 Female Undisclosed Divorced 3-5 7

Pt. 11 44 Female Part-time Single 1-3 5

Pt. 12 39 Female Full-time Married > 1 8

192

Pt. 13 54 Male Unemployed Widowed 5-10 10

Pt. 14 64 Female Retired Married > 10 5

Pt. 15 55 Male Full time Married 3-5 9

Pt. 16 54 Female Part time Married 1-3 6

Pt. 17 48 Female Unemployed Married >10 4

Pt. 18 27 Female Unemployed Married 1-3 5

Pt. 19 47 Male Full time Single >10 7

7.3 Key themes

Three major themes emerged from the data: impact on life; barriers to effective

pain care; and satisfaction with the service provided at the pain clinic. The

detailed description of each theme and its sub-themes is presented below.

7.3.1 Impact on life

The patients reflected on the multidimensional negative impact of chronic pain

on their lives. From not being able to enjoy a television programme through to

the inability to work full-time, chronic pain turned the lives of the patients upside

down. The patients were unable to enjoy their lives, as chronic pain interfered

with their sleep, mood, and physical functioning. Chronic pain even affected

their relationships with their partners and/or children.

“It’s hard to explain to people how you actually feel. It’s like, walk

in my shoes for a week and you will see exactly what my life is, you

know.” [Pt. 6, 58 years old female]

193

“I can’t kneel down, I can’t squat, I can’t put my own socks on, he

has to put my socks on for me. So that shows how much the pain affects

your life.” [Pt. 14, 64 years old female]

Major sub-themes in the “impact on life” theme are outlined in Figure 7.1. The

detailed description of each sub-theme is given below.

Figure 7.1. Sub-themes within the impact on life theme

7.3.1.1 Interference with physical functioning

The interference of chronic pain with their physical functioning was seen as the

root cause of all the other problems in the lives of chronic pain patients. It

restricted patients’ physical activity to an extent that they struggled to perform

simple daily routine tasks like cooking, washing and hoovering.

194

“I can’t do things that I want to do physically, it just restricts me

and it’s getting worse and worse and worse.” [Pt 4, 30 years old male]

“Even things like bending down to the washing machine, maybe I

can get down but then I can’t get back up again, [laughs] so I’ve got to

physically drag myself up from the thing.” [Pt. 8, 40 years old female].

In addition to the increase in pain severity, another factor which contributed to

patients’ restricted physical activity was their lack of energy. A few patients

described chronic pain as an “energy drain”- depriving them of their energy,

meaning that they had to adjust their lives accordingly.

“I think it’s like a niggling injury or a niggling pain, it’s just there all

the time and it’s just draining, a drain on your life.” [Pt. 1, 36 years old

female]

“Well basically it was like somebody had taken… zapped me of all

my energy for one, and my life had to change because I couldn’t do

things like I did before.” [Pt. 6, 58 years old female]

7.3.1.2 Interference with employment

The majority of the participants also described negative impacts on their

professional life. The impact on employment was directly associated with the

patients’ inability to be physically active. Since chronic pain restricted their

physical activity, some patients had to stop working, switch jobs or work only on

a part-time basis. Subsequently, the patients had to face financial problems as

they were not able to work full-time.

“It’s ruined it. It’s totally ruined it, you know. I can’t work in my

job I‘ve done for 22 years, suddenly that’s it, it’s gone.” [Pt. 9, 51 years

old male]

195

“When I started with this back pain and I went off sick that was it.

They waited the statutory two years and got rid of me. So that was very

difficult.” [Pt 15, 55 years old male]

“I was earning 1,000 pound and now that’s cut our income down

by half.” [Pt. 10, 54 years old female]

However, the impact of chronic pain was not significant for all patients and a

couple of patients continued to work as before despite suffering from chronic

pain.

“I’m the kind of person that regardless of what I’m… if I’m ill or I’m

in pain I still work. I’ve been like that all through my life and I think the

past 6-7 years I’ve had two days off ill.” [Pt. 4, 30 years old male]

“Well it’s not massively affected me. I mean… I can… I still do

anything that I used to do it’s just that I put up with the pain.” [Pt 2, 49

years old male]

7.3.1.3 Interference with family life

A number of the patients described the negative impact on their relationships

primarily due to their inability to fulfill their partner’s expectations. The patients

felt that they had become a burden on their partners/spouses as they were not

able to perform their own daily routine tasks due to the pain.

“Well it puts pressure on it because I can’t stand and iron, I can’t

hoover or anything for too long because then the pain starts coming on.

If the pain’s bad we won’t go out anywhere because I just can’t drive. So

yes it does affect that, it puts a strain on it.” [Pt. 4, 30 years old male]

“Well, our marriage has more or less broken down and I think that

a lot of it is to do with me becoming less and less able to cope with life in

196

general, which seems a bit harsh but there you go. But yes, it’s heart

breaking knowing what I used to be able to do.” [Pt 10, 54 years old

female]

However, patients also recognised the importance of support from family and

friends in helping them overcome chronic pain. Family and friends provided

patients with both physical and emotional support, enabling them to cope well

with their difficulties. Family and friends were seen as giving patients a purpose

to continue living and fighting their chronic pain.

“Easily, I would have taken my life a long time ago if it weren’t for

my children and my husband, I wouldn’t be here now, no way.” [Pt. 12,

39 years old female]

“If I get pain that bad I end up taking my frustrations out on my

son and my daughter, which is wrong, which I shouldn’t do, but they’re

the only people there that I can bounce off. Yes, yes, if it wasn’t for my

son and my daughter I’d either be locked up or dead, one of the two.” [Pt.

13, 54 years old male]

“I’ve got my husband and he helps, well we work together you

know.” [Pt. 14, 64 years old female]

Chronic pain did not only negatively affect patients’ relationships with their

partners but also relationships with their children/grandchildren. Quite a number

reflected on their inability to actively engage in activities with their children. The

patients were annoyed and displeased because they were not able to play with

their children like other parents due to persistent pain.

“I couldn’t take my daughter places where I’d do things, you

know, like running round the park as other parents do, I couldn’t do any

of that.” [Pt. 15, 55 years old male]

197

“He’s quite an active little boy so I can find it difficult to kind of

keep up with him.” [Pt. 18, 27 years old female]

“There’s nothing wrong with me, you know, it’s not chopped off,

it’s not broken it just annoys me because you can’t do stuff with the kids,

you know what I mean.” [Pt 7, 39 years old male]

This did not only affected the patients but also their children as they were no

longer able to play or go out with their parents.

“They’re suffering as in we don’t go out on weekends anymore.

We used to go walking everywhere and now they’re got getting out.”[Pt.

8, 40 years old female]

7.3.1.4 Interference with social life

As with other aspects of life, the social life of the patients suffered as well. The

patients had to give up their social lives and became socially isolated either

because of the restricted physical activity associated with chronic pain or due to

depression resulting from the pain. They became confined to their homes and

were not able to go out and enjoy their lives like their peers.

“It’s completely screwed my life up. I can’t go back to work, I

can’t work, I can’t go out. I can’t remember the last time I was in a pub,

and I’m stuck in four walls, I’m stuck in my house.” [Pt. 13, 54 years old

male]

“I just cut back on doing things socially and that changes you as a

person really when you’re not sort of like getting the most out of things.”

[Pt. 19, 47 years old male]

Patients avoided engagement in social activities when in pain as a coping

strategy. This reflects that, perhaps depression associated with chronic pain

198

may be a key contributing factor towards chronic pain’s interference with social

activity.

“I am a sociable person but when you’re in pain I go quiet and I

don’t want to be talking because I'm concentrating on getting rid of this

pain.” [Pt. 6, 58 years old female]

Since the patients were not able to socially engage in activities outside their

homes, they lost interest in getting dressed and looking good, another indication

of depression being a contributing factor.

“No I don’t bother getting dressed, I just think, well I’m not going

out so what’s the point. It’s affected my appearance, I can’t be bothered,

I can’t drink anymore so we haven’t been out to the pub for over a year.”

[Pt. 8, 40 years old female]

Similarly, patients were unable to continue to play sports due to fitness

problems, lack of energy and motivation, common consequences of chronic

pain.

“I used to play football and I can’t play football or golf. I can’t play

a full round of golf anymore.” [Pt 4. 30 years old male]

“I was always very active, I couldn’t do the sport that I used to do,

I was still only in my early 30s then, I was still playing football then. I had

to stop all that.” [Pt. 15, 55 years old male]

199

7.3.1.5 Interference with sleep

Sleep deprivation was also reported by a number of patients. In addition to the

problem with falling asleep, repeatedly waking up during the night because of

pain was also seen as a major issue which prevented them enjoying a good

night’s sleep. As a result, the patients were not able to perform their daily

activities/work efficiently and felt tired all the time.

“I think the biggest problem for me is sleep deprivation when I

wake up in the night I find it very difficult to get back to sleep and I think

when you’re tired everything is worse, the whole world is worse”. [Pt. 1

36 years old female]

“I’m always tired because yes you move about 10-15 times in a

night but when you’re in pain you wake up and it’s hard to get back to

sleep.” [Pt. 7, 39 years old male]

Patients believed that their poor sleep affected their ability to cope well with

chronic pain.

“It keeps you awake; you’ve no energy to face the day. If you get

a good night’s sleep it’s not so bad, you can cope during the day but

during the night when you’re kept awake that is bad.” [Pt. 14, 64 years

old female]

7.3.1.6 Interference with mood

Chronic pain not only affected patients physically but also mentally. A majority

of the patients described negative impact of chronic pain on mental functioning.

The impact of pain on mood was often very apparent.

200

“It affected my mood, of course it did, yes it does affect your

mood, pain does. You try and ignore it but you can’t sometimes.”[Pt. 16,

54 years old female]

Two important associations came up during the analysis. Firstly, the patients

linked their anger and frustration with their inability to perform daily activities. As

described above, the patients were unable to perform routine daily activities as

their physical activity was limited by their pain.

“You can’t do things that you want to do or if you do them it’s

painful, it’s very frustrating and that can make you very sort of, not

anxious but very kind of het up about things and very frustrated.” [Pt. 1,

36 years old female]

“I couldn’t do things like I did before, like taking the curtains down

and putting them up, like moving objects too heavy, so it was very

frustrating and I was so annoyed, really angry that I couldn’t do these

things.” [Pt. 6, 58 years old female]

Secondly, patients described a two-way association between pain and

depression. Patients felt depressed due to pain and experienced more intense

pain when depressed.

“You know, if you’re a bit depressed it [pain] seems to be worse

than it is.” [Pt. 3, 63 years old male]

“It’s a bad combination, it’s a really, really bad combination. It

just… because when you get down you think about your pain more.” [Pt.

12, 39 years old female]

201

Patients experienced low mood because of their pain but recognised the

importance of keeping a positive attitude to avoid escalating the negative impact

of chronic pain on their mood.

“But I also feel it’s a vicious circle because the more depressed I

get or the more down I feel then I believe that my body responds to the

emotional thing as well. And I believe that stuff gets worse if you can’t

keep a positive attitude.” [Pt. 10, 54 years old female]

Foreseeing little to no chance of improvement in their pain and fearing

continuous suffering associated with pain for the rest of their lives also

contributed to patients’ low mood.

“…mentally I just thought, I don’t want to live like this, you know.

And that’s when you think that it’s never going to go away.” [Pt. 5, 74

years old female]

“When the pain was really bad I’d often kind of feel quite low and

feel like it was never going to improve.” [Pt. 18, 27 years old female]

7.3.1.7 Theme summary

Within this theme, the impact of chronic pain on various aspects of patients’

lives was explored. Chronic pain changed patients’ lives to a great extent, with

limited physical activity being the root cause of the majority of the other

problems. It restricted their physical activity, compromising their ability to work,

play with their children, enjoy a good relationship with their spouses, perform

routine tasks and enjoy a good night’s sleep. This led to anger, frustration and

depression. When depressed, the patients felt more pain and lacked motivation

to engage in any physical activity. This became a vicious circle which it was

often difficult to break and come out from.

202

7.3.2 Barriers to effective pain care

In general, the patients had predominantly negative experiences with healthcare

professionals, and described dissatisfaction and displeasure with the service

that they received in the past from various healthcare professionals especially

from the GPs. During the interviews the patients highlighted a number of

barriers which affected the quality of care that they received. These barriers

have been classified into two categories: healthcare professional-related and

healthcare system-related (Figure 7.2).

Figure 7.2. Sub-themes within barriers to effective pain care theme

203

7.3.2.1 Healthcare professional-related barriers

Healthcare professional-related barriers included: lack of interest and empathy;

lack of GP’s specialised knowledge; short consultation time with GPs; and lack

of communication between healthcare professionals. Since chronic pain is

predominantly managed in primary care, a number of the barriers in this

category were related to the GPs’ ability to assess and manage chronic pain.

However, some of the issues identified by the patients were not only limited to

GPs but also applied other healthcare professionals. These barriers have not

been listed in any order of priority.

a. Lack of interest and empathy

A number of patients expressed concerns over the lack of interest shown by

healthcare professionals in listening to their problems and managing their pain.

The patients felt that, perhaps chronic pain was not a life-threatening disease

(like, for example, cancer), healthcare professionals were not interested in

identifying the cause of the pain.

“I went to my GP and was just told it’s wear and tear, age, nothing

we can do about it, left it at that.” [Pt. 9, 51 years old male]

The patients were disappointed and felt that they were wasting their time in

explaining their problem as no one was interested in listening to their problems.

“I’m not getting anywhere and I thought, oh don’t bother saying

anything, it’s a waste of time, nobody’s listening – that’s what I’m trying

to say.” [Pt. 6, 58 years old female]

The patients felt that the GPs did not understand pain well enough to appreciate

its negative impact on their daily lives, and this lack of understanding was very

frustrating for them (patients).

204

“They [GPs] don’t understand what the pain is. They just look at

you and think, well how you can have pain, you know, they don’t realise

what pain is and what it does to you. I mean at times it drives me mad.”

[Pt. 13, 54 years old male]

A few of the patients considered that rheumatologists on the other hand were

only interested in listening to their initial problems, but not to their other ongoing

problems, which sometimes might have been of more importance to the

patients.

“And then from rheumatology they don’t listen to you, they don’t…

they listen to the initial problem and then they just do what they want to

do and they don’t listen to the ongoing problems from thereon.” [Pt. 4, 30

years old male]

The patients found that physiotherapists were not different from the GPs and

rheumatologists in terms of listening and understanding their medical problems.

A few were told that there was nothing wrong with them and they were not

suffering from chronic pain.

“My last visit to physiotherapy at the hospital rheumatology, she

just didn’t want to listen, she didn’t think that there was much wrong with

me and pushed me straight out the door effectively.” [Pt. 4, 30 years old

male]

A number of the patients felt that they were disbelieved and judged by the

healthcare professionals. They were annoyed by these attitudes and this led

them to stop seeking any further treatment from that particular healthcare

professional.

“The second physiotherapist I saw basically told me that the pain

was in my imagination. So I had one appointment with him and he said

205

that I was imagining it, it wasn’t real and I didn’t go back because it is

real to me. I’m in enough pain not to be able to tolerate people who are

telling me it’s not real, you know, because it is real. [Pt. 10, 54 years old

female]

However, the patients also praised some GPs who listened to them and showed

a duty of care towards them.

“… I don’t feel as they’ve just been giving me anything just to get

rid of me, no they’ve been good.”[Pt.16, 54 years old female]

“My GP is superb. He will say, what’s wrong with you, like blah-blah-

blah, right what do you want me to do.” [Pt. 7, 39 years old male]

b. Lack of GPs’ specialised knowledge

The main reason, highlighted by the patients, for GPs’ inability to effectively

manage chronic pain was the lack of specialised knowledge in chronic pain

management. Patients expressed concerns over the competency of GPs to

effectively deal with and mange chronic pain, and frequently did not find they

received much help from them.

“My GP she was absolutely useless and I kept telling her it’s not

helping, it’s not doing me any good, it’s not…” [Pt. 12, 39 years old

female]

“I’m not saying my GP isn’t qualified but he is a general

practitioner, he’s not a consultant and he’s not specified in that area.” [Pt.

6, 58 years old female]

206

Since the GPs had no specialised chronic pain management knowledge, they

had to rely on other services (e.g. pain clinics) to get the right information to

develop an appropriate management plan.

“I think the issue had been that because there’s been a diagnosis

of fibromyalgia the doctor really didn’t know enough about fibromyalgia

so she’s relied on this service… To help give her the knowledge..” [Pt.8,

40 years old female]

A few of the patients also felt that this lack of specialised knowledge was used

as an excuse by the GPs to refer to the physiotherapist without establishing

whether the patients actually needed physiotherapy or not.

“I think the your GP finds it an easy… she doesn’t know…he or

she doesn’t know what the problem is they just not specialised in

anything, it’s the easy answer to shove you to the physio and let them

have a look at you and then see what bounces back out of that. That

seems to be the way and a lot of people end up with that, oh I’ll send you

to physio..” [Pt.4, 30 years old male ]

Patients saw GPs as having limited therapeutic options, with their approach

towards pain management being confined to prescribing a range of painkillers,

irrespective of whether the patients were gaining any benefit or not.

“The GP’s have been useless basically. According to them all

they could do was give me paracetamol, and the best was co-codamol.”

[Pt.9, 51 years old male]

“He’ll just keep giving me tablets. He doesn’t feel there’s anywhere else

to go as regards trying to find out what it is.” [Pt.3, 63 years old male]

207

c. Short consultation time with GPs

Another problem frequently pointed out by the patients was the short

consultation time with the GP. This meant that the GPs could not listen to the

patient’s full story and therefore could not design an individualised therapeutic

plan to meet their needs.

“It’s the running of the GPs basically, we’re not getting heard,

patients aren’t getting heard and listened to. There’s not enough time

[Pt.6, 58 years old female]

The short consultation time was seen as insufficient, by the patients, to obtain

full medical and medication history, perform any physical examination and to

develop an appropriate therapeutic plan accordingly. The patients felt that the

combination of the lack of sufficient consultation time and GPs’ lack of

specialised knowledge often hindered the development of individualised

therapeutic plans.

“No sadly I don’t think the GPs have enough time to look at each

individual and to go through their medical history to see if they can tweak

it here and there to help that patient. Sadly they haven’t” [Pt.6, 58 years

old female]

“The GP…again it goes back down to the amount of time that he

has to work with an individual patient. I mean he’s working on an

average of about 13 minutes with a patient. There’s not much he can do,

you know, on a really, really personal level. [Pt.10, 54 years old female]

In some cases, the patients felt that due to the limited consultation time, GPs

just prescribed medicines as requested by them without obtaining a full history,

putting them at high risk of experiencing an adverse or even life threatening

208

event. The patients felt that a careful review of medical and medication history

was essential as it would enable GPs to recognise an ongoing and/or a potential

drug-related problem (DRP), and to take appropriate measures to prevent any

negative consequences.

“I went to the doctors and asked if I could have a stronger

painkiller…. she just prescribed it, she didn’t ask me any questions apart

from how long had I had the pain, and she just prescribed me co-

codamol.” [Pt. 17, 48 years old female]

“The GP was worried about the high blood pressure but didn’t take

time to look at the medication she’d actually put me on, whereas the

pharmacist pointed it out to her. Potentially according to the pharmacist,

for three months, I was at high risk of having a stroke because of the

GP.” [Pt. 9, 51 years old male]

d. Lack of communication between healthcare professionals

Since the patients were referred to various specialists, the patients were

concerned about the lack of communication between the different healthcare

professionals, which led to inconsistency in terms of the approach towards pain

management.

“I think you tend to see everybody in isolation so the physio will

refer and they will write a little letter and they will refer to a podiatrist. But

then the podiatrist kind of sees the problem from such a different light

that they’re not really communicating with each other, so the podiatrist

when I go tends to focus on my ankle because I still limp, rather than my

back……”.[Pt. 1, 36 years old female]

209

The patients felt that a number of unnecessary referrals were made due to the

lack of effective communication between healthcare professionals, and

considered that better communication would have ensured referral to the correct

healthcare professional, saving both time and money.

“I went to the doctors, it’s nothing. Tennis elbow, then it was

arthritis, then it wasn’t arthritis, then it was because of a previous injury.

He sent me for an x-ray then referred me to physiotherapists here. I

came here, the physiotherapist looked at the x-ray and couldn’t

understand why I’d been referred here, he said it’s arthritis, there’s

nothing you can do with it and referred me back to the GP.” [Pt. 9, 51

years old male]

In some instances the lack of communication led to clash of opinions between

the healthcare professionals and left the patient confused about their diagnosis.

“I was caught up in a bit of a battle between them two because

the rheumatologist was saying no it’s not a rheumatology problem and

the orthopaedic guy was saying, well we believe it is.” [Pt. 15, 55 years

old male]

7.3.2.2 Healthcare system related barriers

In addition to a number of healthcare professional related barriers, described

above, a number of healthcare system related barriers were also identified.

These barriers included long waiting time for appointments in secondary care

and the lack of a holistic approach. In general, the patients were not satisfied

with the quality of the care provided by the NHS and were willing to seek

treatment from the private sector.

210

a. Long waiting time for appointments in secondary care

The patients were concerned over the long waiting times not only for

appointments with the consultants but also for scans, x-rays and other tests.

The long waiting time delayed the whole care process. The patients considered

that there were many unnecessary steps in the referral chain, and consequently

expressed dissatisfaction with the service that they received from the NHS.

“You’re going round the houses to get back to where you want to

be. It takes a long time, it does take a long time. And like even

from being referred to having a scan can take time.” [Pt. 3, 63

years old male]

“I felt like I’d just had to jump through hoops really, and they’re

just unnecessary steps in the chain.” [Pt. 19, 47 years old male]

“I was brought up to think that the Health Service would provide

everything, but it doesn’t, not quickly enough.”[Pt. 5, 74 years old female]

In some instances, patients spent a long time under the care of the GP, without

making any significant progress before being referred to the specialist, which

also contributed to the overall waiting time.

“I had to wait… I mean my doctor she took ages. I think I had 7

months because she referred me; 7 months I had to wait and she could

see that nothing she was giving me was working at all.” [Pt.12, 39 years

old female]

As described above, the patients felt that healthcare professionals, especially

GPs, were not interested in listening to and understanding their problems, which

in some instances led to referral to the wrong healthcare professionals, causing

211

delay in receiving correct treatment. Timely referral to the right healthcare

professional was viewed as very important for effective pain management.

“My GP sent me to [hospital] and they put it down as sciatica

which I said to my GP, it doesn’t start in my spine, I said it starts at the

bottom of my hips and it works its way round. They said it’s sciatica. So

they sent me back to the [hospital] under the doctor, I can’t remember his

name, he was a back specialist. They scanned me and I went back to

see him just before Christmas and he said, there’s nothing wrong with

your spine. I said well I’ve said that to my GP, I said, what about my

hips. He said that’s not my department, it’s a different department. So I

went back to my GP and told her what I thought. I said I told you it

wasn’t sciatica, I haven’t got sciatica, I said it’s my hips [13]

Another patient had a similar experience.

“I went for an x-ray and, it turned out it was osteoarthritis. He was

a rheumatoid arthritis specialist so he shouldn’t have been seeing me,

although he’d been seeing me for 18 months. He then referred me on to

see another consultant.”[Pt. 9, 51 years old male]

Since the patients were not happy with the long waiting time for the

appointments in secondary care, they expressed their desire to go for private

treatment, provided that they had the funds to meet the cost.

“……if I could afford it I’d go private, put it that way.” [Pt. 4, 30

years old male]

Patients who were able to afford it went on to seek care from the private sector

and felt that the service provided there was much better than the NHS.

212

“I find the private sector, you know, service is much better. I do,

I’ve found the NHS physio not very… [Pauses], if you are paying for

treatment it is better, let’s face it.” [Pt.11, 44 years old female]

Since the patients, being tax payers, had already paid into the NHS, they

expected a good service from it. They were annoyed by the fact that the

treatment was in fact better in the private sector and they had to pay again to

obtain this good service.

“You wait so long in the Health Service. But I had no alternative really

except pay to see somebody, and that really rankles me, I don’t want to do that.

Because I’ve paid into it haven’t I, my husband all these years.” [Pt. 5, 74 years

old female]

b. Lack of holistic approach

Since chronic pain has a multidimensional impact on patients’ lives, a uni-

dimensional approach towards its management based on the bio-medical model

may not achieve optimum pain relief. The set-up and the working of chronic pain

management services in the NHS was seen as a hindrance in delivering

integrated holistic care to patients.

“Within the NHS, every individual is great and they work really

hard and they’re really supportive, but they seem to be very caught in

their little boxes and can’t or aren’t allowed to step outside them to

maybe provide a more effective solution sometimes.” [Pt. 1, 36 years old

female]

In addition to the lack of a holistic approach in terms of the working and

integration of chronic pain services, there was also a lack of holistic approach in

terms of management of chronic pain patients. The specialists tended to focus

213

on the initial problem only, but not on the ongoing problems. The patients felt

that they were not managed as a whole, but that healthcare professionals

instead focused on only one of the affected area or joint.

“He was not interested in any other joints, just the left elbow and I

wanted them to look at all.” [Pt. 9, 51 years old male]

Patients felt that they were treated impersonally, being thrown from one

healthcare professional to another.

“Well certainly NHS, I believe that it does need a big shape up

because there’s… the way that they treat you is absolutely disgusting

from point to point, there’s no… you’re treated as a number, you’re not

treated as a person.” [Pt. 4, 30 years old male]

Since chronic pain interfered with both physical and mental functioning, patients

believed that a holistic, interdisciplinary approach was required to effectively

manage their pain.

“Well the pain management, my doctor looks after really, and the

physio did the exercise part of it and I think both of it together was

needed, you know.”[Pt. 5, 74 years old female]

“Especially for people who are dealing with kind of long term and

chronic pain because it can kind of cause people, you know, as well as

the physical pain it can cause emotional problems and I think it’s

important to have a service where kind of all of that can be addressed

together.” [Pt. 18, 27 years old female]

The patients stressed the need for a collaborative holistic approach and were

frustrated with the current situation feeling that perhaps the NHS was not willing

to make necessary reforms in order to improve chronic pain management.

214

“I don’t know whether that’s a cost thing, whether arthritis is not a sexy

disease like cancer or other things that the NHS want to throw money at.” [Pt. 9,

51 years old male]

The patients believed that structural reforms were needed within the NHS so

that it could better serve the needs of chronic pain patient population.

“I find that very frustrating because I think, you know, maybe if the

NHS was set up in a slightly different way so that people worked together

better, that maybe we could resolve the problem” [Pt.1, 36 years old

female]

7.3.2.3 Theme summary

In this theme, various healthcare professional and health system-related

barriers, hindering an effective delivery of quality pain management services,

were explored. In general, patients expressed their dissatisfaction with the

quality of care provided by the NHS. A common perception existed among

patients that GPs lacked interest and did not have specialised knowledge in

managing chronic pain. The patients also felt that the lack of communication

between the healthcare professions led to unnecessary referrals, adding to

patients’ frustration. This also partly contributed to the long waiting time for

appointments in secondary care. Another key issue highlighted by the patients

was the lack of interdisciplinary chronic pain services within the NHS. A need to

reform chronic pain services within the NHS was also emphasised in order to

facilitate the effective delivery of quality services.

215

7.3.3 Experiences at the nurse-pharmacist managed pain clinic

In general, the patients had good experiences of the services received at the

nurse pharmacist managed pain clinic. Expectations of a particular service are

major drivers of patient satisfaction and overall experience. Early recognition of

these expectations can help healthcare professionals to tailor their approach

accordingly. As reported in the previous chapter, patients of different

sociodemographic and clinical characteristics were referred to the pain clinic.

Therefore, their expectations from the nurse-pharmacist managed pain service

varied and were influenced by the duration of their pain, past experiences of

other pain services and information from their peers. Their expectations ranged

from a probably unrealistic hope of cure from chronic pain to simply knowing

what was wrong with them.

“Miracles [laughs]; I was expecting miracles. No, in reality I was

hoping to reduce the medications because I’m on such a lot.” [Pt.10, 54

years old female]

“My expectations… well my hopes were to end up painless

[laughs].” [Pt. 2, 49 years old male]

“I wanted to find out what was wrong with me.” [Pt.7, 39 years old

male]

Some patients had no clue about the service and had no clear expectations

from it

“I wasn’t entirely sure what it was about, no one explained that,

you know, this was what was going to happen. It was, this is chronic

pain services, they’ll talk to you about your pain and that’s it, so I wasn’t

sure if it was going to be, I don’t know, some kind of psychiatrist kind of

216

thing or if it was physiotherapy again or anything to be honest.” [Pt. 4, 30

years old male]

Some of the patients expected a negative attitude from the service, but were

surprised to receive a listening and caring attitude from both the nurse and the

pharmacist.

“I thought I’d come here and they’d palm me off with something,

you know, go for physiotherapy, like the GPs.” [Pt. 9, 51 years old male]

The sub-themes identified are outlined below in Figure 7.3.

Figure 7.3. Sub-themes within experiences at the pain clinic theme

217

7.3.3.1 Satisfaction with the service

Overall, the patients were satisfied with the quality of care that they received at

the pain clinic. Four factors were identified during the data analysis which

contributed towards positive patient experience with the service: ample

consultation time, in-depth specialised knowledge, listening and understanding

individual patients’ needs, and a holistic approach. The patients recognised and

appreciated the role of both the clinical nurse specialist and the pharmacist at

the pain clinic.

“I think it’s a good little service that they’ve got going on there; I

really, really do.” [Pt. 12, 39 years old female]

In the following sections, these factors are described in detail.

a. Ample consultation time

The patients felt that they were given full freedom and time to express their

views. In contrast to the ten minute consultation slot with the GP, the patients

had one hour for the initial consultation and 30 to 45 minutes for the follow-up

appointments which allowed them to discuss their problems more openly and

freely.

“You’re very conscious of the amount of time you have with your

GP and it was knowing that I was going to see somebody who actually is

a pain specialist, you just feel more confident and that because you feel

they will take time with you and listen to you and understand…” [Pt. 16,

54 years old female]

“When you come here you don’t feel that pressure, so you can be

a bit more open and a bit more frank and you can be a bit more

descriptive.” [Pt. 8, 40 years old female]

218

“I mean [the clinical nurse specialist] sits and listens and then she

writes them[ GP] letters and it helps me when I go down to see them [GP].”

[Pt. 13, 54 years old male]

b. In-depth specialised knowledge

The in-depth specialised knowledge of both the nurse and pharmacist in terms

of chronic pain management was quickly recognised by the patients. Patients

had the impact of pain on their lives, pacing activities, the impact of being active

on pain, and the usefulness of light exercise explained by the clinical nurse

specialist.

“I think there’s also that knowledge base here. They’re obviously

treating or speaking with people that have got similar symptoms and

therefore know what kind of route to take when it comes to pain

management and so on.” [Pt. 8, 40 years old female]

“I learnt quite a lot from them about pacing myself and timing

[activities].” [Pt.10, 54 years old female]

“[The clinical nurse specialist] explained what’s going off, how it

affects me, and then [Pharmacist] we’ve been sat down and we’ve been

balancing all my medications out, how much there is to take and how

much… and what to take and what not to take, you know. So it’s been a

real…to me it has, it’s been a really good thing to have been coming up

here to the pain clinic.” [Pt. 13, 54 years old male]

The pharmacist focused on optimising the use of analgesics and other

medicines involved in pain management. The patients were informed about the

side effects and negative impact of over/under dosing. She also encouraged

the patients to adhere to the therapeutic regimen.

219

“We [pharmacist and I] talk and they sort my medication out more

than what… my GP hasn’t got a clue, you know, they haven’t got a clue

what I’m doing. I mean I could go and ask them for anything and I think

they’d just give me it, you know. I was taking too much and they said,

well you won’t get any benefits from taking extra MST [Morphine], so I

cut it down, I stopped taking as much.” [Pt.13, 54 years old male]

As a routine practice, the pharmacist reviewed patients’ medication history. In

cases where the dosage was not right, the pharmacist recommended the right

dose and medication was stopped if the medication was not required by the

patient.

“She [GP] was overdosing me as well on there and the

pharmacist was absolutely mortified when she found out how much I was

taking. And I didn’t know, I’m no doctor, you know, I’ve just gone by my

GP.” [Pt.12, 39 years old female]

“I felt she was very professional and she knew what she was doing,

which is comforting. I’ve seen the pharmacist on Tuesday and the way she sort

of looked at my medication and she knows what everything’s doing, she knows

what it should be doing, and she probably knows what I can do without, hence

the tramadol [was taken off].” [Pt. 10, 54 years old female]

c. Listening and understanding individual patients needs

The patients found that both the nurse and the pharmacist expressed their

interest in listening to patients’ views, in contrast to the GPs who the patients

perceived as not being interested in obtaining a full medical and medication

history. Based on thorough face-to-face interviews and careful consideration of

individual patient’s needs, the nurse and pharmacist developed a therapeutic

220

plan in consultation with the patients. The patients felt that finally there was

someone who was listening to their needs.

“She [the clinical nurse specialist] was very good at listening. She

was, very good. It was lovely having somebody to talk to who understood

what pain does to people and you could talk to her, she were a person

that you could talk to, some you can’t can you, you know? Some people,

they just give off that aura, they don’t really care, you know. But she

were very good, she was yes.” [Pt. 14, 64 years old female]

“I think it’s because there’s a sympathetic ear and people will

listen. And there seems as if this understanding and they’re offering

advice that we’ll take on board, whereas we’ve not really had that…

we’ve not felt that comfortable with the GP because she openly admitted

that she didn’t really know anything about fibromyalgia and therefore she

didn’t really know how to treat it.” [Pt. 8, 40 years old female]

After each consultation, as per the routine clinical practice, a letter was sent to

both the patient and his/her GP explaining the nature of and history of the

present complaint with recommendations for a future therapeutic plan.

“I can tell maybe because they sent me a copy of the letters that they

send to the GP and everything I’ve said to them they’ve taken notice of and

they’ve pointed out to the GP, you know.” [Pt. 9, 51 years old male]

d. Holistic approach

The clinic offered a more holistic approach towards pain management

compared to the GP. The patients were given adequate time to explain their

problem and both the clinical nurse specialist and the pharmacist listened to

their problems, allowing carefully individualised therapeutic plans to be

221

designed. Both pharmacological and non-pharmacological therapeutic options

were explored for each patient.

“Well really I suppose here they go through absolutely everything

you know so it’s a lot more in-depth and looking at the whole picture

rather than simply trying to give you medication for a problem like the GP

does and then refer you to physio etc. It’s……..[Pauses]. Here it’s a

much more holistic approach really and they try and cover absolutely

everything for you and see what other services they may be able to refer

you to or ask your GP to refer you to. So I think really it’s a complete

programme so it’s good in that way.” [Pt.11, 44 years old female]

“Go to pilates, I did and that’s helped, yes, yes [Pt. 5, 74 years old

female]

The emotional needs of the patients were also assessed and appropriate

referrals were made in order to help them in this respect..

“They have taken steps to help the emotional side, which that’s,

you know, sort of getting out and meeting people. And [the CNS] picked

up on that very quickly, very, very quickly.”[Pt. 10, 54 years old female]

After assessing individual patient’s needs, the patients were also referred to

other services such as the expert patient groups, musculoskeletal services, and

psychological services if required. The patients also found these referrals

beneficial, contributing to an overall satisfaction with the service.

“They [pain clinic] referred me to a physiotherapist who

specialised in chronic pain. And so through seeing that physiotherapist

I’ve learnt different ways of managing the pain which I found to be more

effective than the medication I was on.” [Pt. 18, 27 years old female]

222

“Because I’ve ended up if I hadn’t have come here I wouldn’t have

had the injection, because that injection I don’t think would have been

offered to me by my doctor.” [Pt. 2, 49 years old male]

7.3.3.2 Issues with the pain clinic

The patients also highlighted some negative issues with this service. They were

not pleased by the fact that the pain clinic did not prescribe medicines to them

and they had to go to their GPs to get the medicines. Patients felt that this

caused unnecessary delay and had expected to get their medicines at the pain

clinic.

“When I found that I was going to have to go back to him for the

prescription I was a bit in shock really. I’m thinking what? He’s referred

me to you for you to... saying that you’ll be able to look at these things

and I’ve come here hopefully to get these things and then you’re saying

I’ve got to wait another two weeks while you send a letter to my doctor

and then he’ll just write a prescription....[Pt. 19, 47 years old male]

“I think the one thing we weren’t expecting is that there was going

to be referrals from the pain management to the doctor. We were

thinking they were kind of independent bodies.” [Pt. 8, 40 years old

female]

Some of the patients also felt that they were not appropriate for this service and

should not have been referred here. They considered that they had pain for

quite a long time and knew about the various self-management strategies

discussed at the pain clinic including being active, exercise and pacing

activities.

223

“I think was more aimed at getting people re-motivated past their

pain, so we did talk a little bit about painkillers and modified those a bit,

but the main part of pain clinic to me seemed to be about getting people

to get up and go and take additional steps that maybe they weren’t

already doing, which really wasn’t kind of suitable for me I don’t think. I

don’t ever sit down; I don’t have time, so I think maybe I wasn’t really

their target audience.” [Pt. 1, 36 years old female]

“Well I just went through everything that I’d been through, you

know discussing everything, going through every remedy and possible

thing that may help but I’d heard it all and done it all, you know, it wasn’t

anything new really.” [Pt. 11, 44 years old female]

Although the patients appreciated the quality of care delivered at the nurse-

pharmacist managed pain clinic, not all the patients were able to achieve the

desired pain relief.

“I was expecting they might be able to do something different, but

I’m quite happy with how it was conducted. But I don’t feel as though

I’ve made any progress.” [Pt. 3, 63 years old male]

“I’m still in pain and what they’ve suggested so far it’s not helped

the pain.” [Pt. 4, 30 years old male]

7.3.3.3 Theme summary

In this theme, the factors contributing towards patients’ good experiences and

satisfaction have been explored. In addition, patients’ concerns about the

service have been presented. The patients were generally satisfied with the

service. The long consultation time and specialised pain management

knowledge at the pain clinic enabled patients’ pharmacological and non-

224

pharmacological needs to be explored and addressed. Individualised pain

management plans were devised for patients after a careful review of their

medical and medication history. In addition, the patients benefited from referrals

to other services, where required. However, some of the patients were

disappointed by the fact that they had to visit their GPs to get the prescribed

medications.

225

CHAPTER 8

DISCUSSION

226

CHAPTER 8

DISCUSSION

8.1 Introduction

In this final chapter of the thesis, the results/findings of both the quantitative and

qualitative phases are discussed in the context of the wider literature. In addition

to studying the sociodemographic and clinical characteristics of the patients

referred to the pain clinic, the aim of the quantitative phase was to evaluate the

impact of nurse-pharmacist managed pain clinic on pain intensity, physical

functioning, emotional functioning, quality of life and chronic pain grade. The

aim of the qualitative phase was to explore patients’ views about their

experiences at the pain clinic. The findings are discussed in the light of these

objectives. Where possible, the findings of both the quantitative and qualitative

phases are integrated to facilitate a better understanding of the results. Since

the findings of the systematic review have already been discussed in detail in

chapter 3, they are not discussed in detail here. However, reference to the

findings of the systematic review is made where appropriate.

The chapter begins with a general discussion on the use of the mixed-

methods methodology for this study and then the sociodemographic and clinical

characteristics of the patients referred to the pain clinic are discussed. This is

followed by the discussion on the effectiveness of the pain clinic. The limitations

of the current study are then highlighted and recommendations for future

research and policy are suggested. Finally, the dissemination plan for the

research findings is outlined.

227

8.2 Discussion

8.2.1. Learning experience during PhD: A reflective account

In my understanding, the overall aim of a PhD training is to facilitate

transformation of the student into an independent researcher by equipping him

with the necessary knowledge and skills required to undertake research. With

the growing use of qualitative and mixed-methods research methodologies

within practice disciplines, it has become increasingly important for practice

researchers to understand the strengths and weaknesses of these methods as

well.

My PhD project which consisted of a systematic review and meta-analysis,

and a mixed-methods study provided me with an excellent opportunity to learn

and apply different research skills. As I highlighted earlier (section 1.1), I had

only a limited research training in the past, which was predominantly

quantitative. During my PhD, I gained valuable knowledge and skills of

designing and conducting systematic reviews, qualitative, quantitative and

mixed-methods research. In addition, I learnt a lot about the art and science of

publishing in a peer-reviewed journal, an important skill for an academic

researcher. However, I do not consider myself as an expert qualitative and/or

quantitative researcher but the PhD training has enabled me to become

independent – I can find my way. I believe, because the research methods and

issues keeps evolving, it is a life long journey which has just formally begun.

8.2.2 A word on methodology

This study used a mixed-methods methodology to evaluate the effectiveness of

a community based nurse-pharmacist managed pain clinic. Over the past few

years, there has been growing interest in the use of mixed-methods approaches

228

in health services evaluation (O'Cathain et al., 2008) as they allow the use of

multiple methods to comprehensively answer different research questions in a

single study (Creswell and Plano Clark, 2011). The rationale for using a mixed-

methods approach has been described in detail in the methodology chapter.

Briefly, the use of mixed-methods methodology generated both effectiveness

and satisfaction data within a single study, thus providing a holistic evaluation.

Furthermore, the findings of the qualitative study not only identified the factors

contributing to patients’ satisfaction but also enabled the author to overcome

some of the threats to the internal validity of the quasi-experimental study

(described in detail later in the limitations section).

In the following sections the key findings of both quantitative and

qualitative studies are discussed.

8.2.3 Sociodemographic and clinical characteristics of the patients

In general, the sociodemographic profile of the patients referred to the

nurse-pharmacist managed pain clinic was similar to the profile of patients

visiting outpatient pain clinics in Hong Kong and Toronto. In the present study,

the mean age was 46.5 (SD 14.5) with almost half (46.8%) of the patients being

middle aged (36-50 years). Similarly, the mean age of patients attending an

outpatient pain clinic in Hong Kong (Chen et al., 2004) and a university hospital

affiliated pain clinic in Toronto (Canada) (Mailis-Gagnon et al., 2007) were 48.7

years (SD 15) and 48.5 years (SD 14.2) respectively, with the majority of the

patients being middle aged (35-49 years age range) in both studies. The

majority of the patients were female (67.1%). Chronic pain is more prevalent

among women and they have been reported to use more healthcare resources

compared to the men. The National Health Survey (Bridges, 2012) also reported

a higher prevalence of chronic pain among females (37% females compared to

229

31% males). The high prevalence of chronic pain and higher utilisation of

healthcare resources may explain the high number of female patients in the

sample. More than a half (56.5%) of the patients had chronic pain for more than

3 years and, more importantly, for 70% of the patients this was the first visit to a

specialised pain service/clinic.

The interplay of a number of factors including patients’ medical help

seeking behavior, GPs’ lack of willingness to refer patients to a specialised pain

service and, lack of awareness among the GPs and patients about the

existence of such clinics may partly explain the delay in referral to a specialised

pain service. In the present study, most of the patients were referred by the GP

(72.2%), which suggests that the GPs were willing to refer the patients.

However, how long the GPs kept the patients under their care before referring

on to the clinic could not be established. Furthermore, during the qualitative

interviews a few patients highlighted that they had to repeatedly ask their GPs

for referral before they were referred. It will be interesting for future researchers

to further explore this issue and its implications for the treatment outcomes.

In the present study, 67.1 % of patients had HADS-A score of 8 (likely to

suffer from anxiety) or above and 60.5% HADS-D score of 8 (likely to suffer

from depression) or above. Anxiety and depression are common among chronic

pain patients. The prevalence of depression, depending on the method of

assessment, has been reported to vary from 1.5% to 87% (Worz, 2003).

Chronic pain can cause and/or worsen symptoms of depression; on the other

hand, depression is associated with increased pain intensity, reduced physical,

social and occupational activity and a higher use of health services (Geisser et

al., 1997, Worz, 2003). Patients in the qualitative interviews also highlighted

significant impact of chronic pain on their mental functioning and described a 2-

230

way relationship between pain and depression. The patients felt depressed

during the times when pain intensity was high and also felt that depression was

contributing towards increased pain intensity. The National Health Survey

(Bridges, 2012) also reported that participants in chronic pain grade IV (high

disability-severely limiting) were more likely to be anxious and depressed than

the participants with grade I (low disability-low intensity) and II (low disability-

high intensity) (Bridges, 2012). In the present study, more than 60% of the

patients fell under Grade IV (high disability-severely limiting), explaining a high

incidence of anxiety and depression among patients referred to the clinic. The

high prevalence of anxiety and depression calls for integrating psychological

services with chronic pain services to improve overall patient experience.

In the present study, almost half of the patients (43%) were unemployed,

of whom more than a quarter (25.3%) were unemployed due to pain. The

negative impact of chronic pain on employment status was discussed frequently

by the patients indicating its significance in their lives. The patients had to either

stop working or switch jobs from full time to part time because of the pain. The

negative impact of chronic pain on employment status, sickness absences, and

loss of productivity is well documented in the literature (Steenstra et al., 2005).

Studies have also documented an association between employment status and

chronic pain intensity after adjusting for confounders. A systematic review by

Patel et al. (2012), found that interference of chronic pain with employment

affected 26% (Breivik et al., 2006) to 88% (Friessem et al., 2009) of patients

with the loss of employment due to chronic pain reported to range from 18% to

23% (Patel et al., 2012).

The information on sociodemographic and clinical characteristics of the

patients is valuable in a number of ways. Firstly, the clinical characteristics of

231

the sample represent a typical chronic pain population; therefore the findings of

this study are potentially generalizable to the chronic pain population, keeping in

view the limitation of inadequate sample size (issue further discussed in section

8.5). Secondly, this information is important for identifying a suitable control

group for future RCTs evaluating community-based pain clinics. Thirdly, for

service commissioners, the high prevalence of psychiatric comorbidity among

chronic pain patients calls for the integration of psychological services with

chronic pain services as anxiety and depression can interfere with chronic pain

management.

8.2.4 Outcomes assessment

The rationale for selecting the outcome measures and respective scales has

been discussed in detail in chapter 5 (section 5.3.4). The recommendations

made by the IMMPACT group guided the selection of outcome measures

(Dworkin et al., 2005). In terms of pain relief, statistically significant reductions

in the “worst pain” and “average pain” were observed upon discharge. However,

no significant differences were found for the “least pain” and “pain right now”.

Due to the small sample size statistical analysis were not performed for 3-month

follow-up. For physical functioning, there was a significant reduction in the

overall interference of chronic pain with physical functioning (P=0.02). As

highlighted earlier (Chapter 3, section 3.5.1), it has been suggested that the

population distribution of pain scores are usually not normally distributed and

are ‘U-shaped’; therefore, reporting merely changes in the means/medians for

continuous data (e.g. pain intensity) can be misleading (McQuay et al., 1996) as

patients tend to have either very good or very poor pain relief. To avoid this

limitation and to improve clinical interpretation of the results, percentages of

patients responding to treatment have been reported as well, in addition to

reporting medians/means, for two of the outcome measures: pain intensity and

232

physical functioning (IMMPACT group recommendations were available for

these two outcomes measures only). For pain intensity, 17 out of 35 patients

(48.6%) discharged from the clinic had achieved at least a minimum clinically

important difference (10% of the baseline score) at the time of discharge.

However, since the data were not available for all the patients, this figure

(48.6%) may not be an accurate representation of the effectiveness of the clinic.

For physical functioning, fourteen out of 35 (40%) patients had achieved

minimum clinically important difference at the time of discharge from clinic.

Again, the 40% could be an under or over representation of the effectiveness of

the clinic. The findings of the systematic review reported in chapter 3 also found

a significant reduction in pain intensity and a significant improvement in physical

functioning among patients who had the intervention (i.e. pharmacist-led

medication review) compared to the control.

No statistically significant reductions were noted for anxiety (P=0.21) and

depression scores (P=0.22). However, for anxiety, 13 out of 34 patients (38.2%)

had improved at least by one category (e.g. from mild to normal or from

moderate to mild etc). On the other hand, for depression, only 7 out of 34

patients (20.6%) showed an improvement by at least one category. For quality

of life, of the eight domains assessed, statistically significant improvements

were noted for bodily pain (BP) and physical role (RP) only. There were no

significant improvements in the physical component summary (PCS) score and

the mental component summary (MCS) score. The lack of intervention effect in

terms of anxiety, depression, and quality of life might be attributed to the small

sample size. It is also possible that the intervention was not effective or the

outcome measures were not sensitive enough to detect a difference.

233

For the chronic pain grade questionnaire, compared to the baseline, a

significant reduction only in pain intensity subscale was found at discharge. No

significant improvement was noted for disability sub-scale. Only seven (20.6%)

patients showed improvement in terms of chronic pain grade while the majority

of the patients showed neither improvement nor deterioration in their chronic

pain grade. An alternative explanation for lack of intervention effect could be the

nature of questions within the chronic pain grade questionnaire. All the

questions except one (question 1) ask the patients to rank their pain intensity,

and associated physical disability, over the past 6 months on a 0 to 10 NRS

scale. Therefore, it may not necessarily detect a positive outcome in patients

who are discharged less than 6 months of their baseline assessment, thus

making it a less useful outcome measure for short to medium term evaluations.

However, further research is required to explore this hypothesis.

Patient satisfaction was another outcome, evaluated using face-to-face

semi-structured interviews. The issues around patient satisfaction are discussed

in the context of barriers to effective pain management, in the following section.

8.2.5 Barriers to effective pain management

In the previous chapter, while reporting the findings of qualitative phase, barriers

to effective pain management were also highlighted. Although, the aim of the

qualitative interviews was not to explore barriers to effective pain management,

however, while exploring patients’ satisfaction with the service the patients

volunteered a number of issues related to pain management. It is important to

understand these issues in order to thoroughly appreciate the reasons for

patient satisfaction.

Both healthcare professionals and system-related barriers to effective

pain management were identified during the qualitative interviews. The

234

healthcare professional-related barriers included: lack of interest and empathy,

lack of GP’s specialised knowledge, short consultation time with the GPs, and

lack of communication between healthcare professionals. The lack of interest

among healthcare professionals in managing pain has been well documented

in the literature (Walker et al., 1999, Harding et al., 2005, Osborn and Smith,

2008, de Vries et al., 2011). The lack of seriousness among the healthcare

professionals in managing chronic pain may be partly attributed to their lack of

belief in chronic pain patients. In addition to this study, patients in a number of

qualitative studies have described a sense of “not being believed” and “being

judged” by the healthcare professionals (Walker et al., 1999, Harding et al.,

2005, Osborn and Smith, 2008, de Vries et al., 2011). However, a large

telephonic survey of primary care physicians (PCP) and chronic pain patients

across eight European countries including the UK reported that about 90%

(n=1,334) of physicians were interested in improving patients’ quality of life and

offered all patients some sort of treatment. However, only 12–33% of patients

were given written information about their condition (Woolf et al., 2004).

Since chronic pain is predominantly managed within primary care and in

the UK, referral to secondary care/pain service is made by the GPs based on

their assessment, issues such as lack of specialised chronic pain management

knowledge among GPs and short consultation time are of significant importance

in the context of chronic pain management. A study from the US reported that,

pain was discussed on average for only 2.3 minutes during consultations with

primary care physicians (PCPs) (Tai-Sealea et al., 2012). The odds of having

pain discussion were significantly associated with the level of pain, physician’s

supportiveness, and gender concordance (physician and patient are of same

gender) (Tai-Sealea et al., 2012). GPs themselves have identified lack of

235

sufficient knowledge and skills in chronic pain management (Stannard and

Johnson, 2003). In a survey more than two thirds (81%) of the GPs expressed

an interest in receiving additional education and training in chronic pain

management and more than a quarter of GPs surveyed desired more guidelines

and local protocols to manage chronic pain (Stannard and Johnson, 2003). The

survey further reported that the majority of the GPs (81%) believed that a

substantial number of patients received suboptimal treatment for chronic pain.

Similarly, 88% of the physicians in the US felt that their training in pain

management was poor in medical school (Von Roenn et al., 1993). This

suggests that lack of specialised knowledge is not only the patients’ perceptions

but also GPs/primary care physicians recognize this as a limitation as well. The

patients felt that it was due to GPs’ lack of interest and specialised knowledge

that they were referred from one healthcare professional to another. The

interplay of all these factors contributed to patients’ dissatisfaction with the

quality of care offered to them by various healthcare professionals especially

the GPs. There is a need to improve GPs’ knowledge and skills in chronic pain

management and to develop referral guidelines for chronic pain patients in order

to improve chronic pain management in the community. In addition,

development of community-based pain clinics or setting up of pain clinics within

GP practices managed by clinical specialist nurse and/or pharmacist can also

improve chronic pain management in the community

Long waiting times for appointments in secondary care and lack of a

holistic approach were among the healthcare-system related barriers identified

during the qualitative phase. Waiting time is an important issue in the context of

effective pain management as a waiting times of 6-months or more is

associated with an increase in pain intensity, depression and poorer quality of

236

life (Lynch et al., 2008). Unfortunately, no medically acceptable benchmarks for

waiting time for chronic pain exist globally (Lynch et al., 2007), suggesting a

need to develop evidence based waiting time standards for chronic pain

patients. In the UK, no standard waiting-time specifically for chronic pain exist

and, therefore the National Pain Audit used a generic 18-week standard waiting

time for evaluating chronic pain services in the last audit (Price et al., 2012).

However, the National Pain Audit recommended that the Royal College of

Anaesthetists and the National Institute of Clinical Excellence (NICE) should

develop guidance on waiting times for chronic pain patients (Price et al., 2012).

In a survey, the GPs in the UK expressed concern for the long waiting times for

appointments in the secondary care (Stannard and Johnson, 2003). On the

other hand, primary care physicians in Canada considered long waiting times as

a barrier to referral to secondary care (Lakha et al., 2011). Patients were not

only concerned about the waiting time for appointments with healthcare

professionals in secondary care but also about the long waiting times for

medical tests and scans (MRI, CT-scan, X-rays) as the later contributed to

overall delay in treatment. In Canada, one third of patients had to wait for more

than a year (over all mean 6 months; range 2-14 months) for appointments at

publically-funded multidisciplinary clinics (Peng et al., 2007). However, the

waiting time for private clinics was less than a month (mean 0.5 months; range

1-4 weeks) (Peng et al., 2007). In the UK, the National Pain Audit reported that

80% of clinics were meeting the 18-week generic waiting time standard (Price et

al., 2012). Because of the long waiting time for consultation in secondary care in

the NHS, patients during the qualitative interviews expressed an interest to opt

for private treatment. However, “affordability” was a barrier. The patients also

felt that the healthcare professionals’, especially the GPs’, approach towards

pain management was unidirectional-medicine oriented and lacked holism. The

237

patients felt that a multidisciplinary approach would have benefited them more

in terms of pain relief. Both the clinical effectiveness and cost effectiveness of

multidisciplinary pain clinics have been demonstrated (Gatchel and Okifuji,

2006, Scascighini et al., 2008). However, availability of and access to

multidisciplinary clinics has been problematic. Only 40% of pain services

audited during the National Pain Audit met the minimum criteria of

multidisciplinary service (Price et al., 2012). The development of more

community-based clinics jointly managed by a nurse and pharmacist can

potentially overcome the issues related to availability and access.

8.2.5.1 Patient satisfaction with service

Patient satisfaction was explored using face-to-face qualitative interviews.

Patients were generally satisfied with the quality of care provided by the nurse

and the pharmacist at the pain clinic. Ample consultation time, in-depth

specialized knowledge, listening and understanding individual patient’s needs

and, a holistic approach were identified as contributing factors toward patients’

satisfaction. It should be noted here that these factors are totally opposite to the

barriers to effective pain relief discussed earlier which suggests that a

community-based pain clinic jointly managed by a nurse and a pharmacist can

overcome the barriers to effective pain management. Furthermore, referrals to

other services were made, where necessary, after a thorough assessment of

individual patient’s needs. Non-pharmacological alternatives were suggested in

instances where the patient: perceived not to take medicines; issues related to

the side effects/tolerance; or non-pharmacological interventions were deemed

necessary. The holistic approach was evident from the nature of

recommendations made at the clinic. For 35 patients, 101 medicine-related

(mean 2.9; range 1 to 6) and 42 non-pharmacological recommendations (mean

238

1.3; range 1 to 3) were made to the GPs and patients, suggesting that both

pharmacological and non-pharmacological needs were assessed and

addressed. Patients during the qualitative interviews appreciated the non-

pharmacological interventions as well including going to a support group

8.3 Key findings from the three sections of the thesis: Patients’ views

and outcomes

The key findings from the three sections of the thesis are summarised in table

8.1. Although the aim of this research was not identify barriers to effective pain

management but to emphasise the importance of research findings in relation to

overcoming those barriers and facilitate a better understanding, the research

findings are mapped, where applicable, to the barriers identified during

qualitative interviews in Table 8.1.

Table 8.1. Key findings from the three sections of the thesis

Interview and questionnaire data Systematic review of

pharmacist-led

medication review Barriers to effective

pain relief

Nurse-Pharmacist

managed clinic

Most of the patients

were not pleased with

the quality of care

received.

Patients were generally

satisfied with the clinic.

Patients were generally

satisfied with

pharmacists’ service

(small to moderate effect

size).

Inadequate pain relief. On discharge patients

reported a significant

reduction in worst pain,

average pain and an

improvement in physical

activity.

Pharmacist-led

medication review was

effective in reducing

pain intensity and

improving physical

functioning.

239

Patients wanted their

prescription there and

then rather than having

to return to their GP.

Some weak evidence of

reducing adverse drug

effects

Inappropriate referrals

were made.

Some patients felt it was

too late to be attending

the clinic and learned

nothing new.

Lack of a holistic

approach.

Holistic approach

Lack of interest and

empathy by healthcare

professionals (HCPs)

Listening and

understanding of

individual patients’ needs

Short consultation times

with GPs

Ample consultation time

GP lack of specialised

knowledge.

In-depth specialised

knowledge.

Lack of communication

between HCPs

Written communication

with patients and GPs

Long waiting times for

appointments in

secondary care.

8.4 Conclusion

Community based pain clinics jointly managed by nurses and pharmacists have

the potential to improve chronic pain management in the community. In addition

to reducing pain intensity and improving physical functioning, such community-

based clinics can not only improve access to specialised pain service but also

reduce burden on the secondary care. The sufficient consultation time with

patients allowed the nurse and the pharmacist to obtain full medication and

240

medical history and develop an individualised management plan addressing

both pharmacological and non-pharmacological needs of the patients. In terms

of the patients’ perspective, they felt that they were treated with respect and

empathy and, were generally satisfied with the quality of service. There is a

need to develop evidence-based referral guidelines for such community based

clinics to ensure that the patients who are likely to benefit from such services

are referred there. GPs should be encouraged to refer patients to such services

early during the course of the treatment as GPs’ lack of specialised knowledge

and short consultation time are barriers to effective pain management.

Unfortunately, the service was decommissioned by the local PCT without

taking all the stakeholders on board. This was in spite of the fact that the pilot

study had documented positive outcomes and an in-depth evaluation from both

clinical and patient perspective was in progress. Even though the patients highly

appreciated and valued the role of the pharmacist in solving their medication-

related problems and optimizing the use of medicines, the services of the

pharmacist were dropped. The findings of the systematic review and meta-

analysis, reported in chapter 3, reported a significant impact of pharmacist-led

medication review on various patient outcomes including pain intensity, physical

functioning and patient satisfaction. This clinic provided a good practical

example of public-private partnership in healthcare setting. Given the limited

financial resources that the healthcare systems currently have, more avenues of

public-private partnerships should be explored and evaluated.

241

8.5 Limitations

The findings of this mixed-methods study should be carefully considered in

context of its limitations. In terms of the design and conduct, there were three

main limitations related to the quasi-experimental study. Firstly, in terms of

study design, RCTs, not quasi-experimental studies, are considered the gold

standard for evaluating the effectiveness of healthcare interventions (Bonnie

and Martin, 1998). The reasons for not conducting a RCT for the present study

have been discussed in detail in chapter 4 (section 4.4.1). Due to the lack of

randomization and control group, several threats to the internal validity of

before-and-after quasi-experimental studies have been reported in the literature

including history, maturation, Hawthorne, instrumentation, regression-to-the-

mean, drop out and testing (Harris et al., 2004). In the context of this study,

history, instrumentation and maturation were of significant concern. A “History

threat” refers to the occurrence of other influential events, independent of the

intervention, which could affect the outcome. Maturation threat to the internal

validity refers to a natural processes (e.g. ageing) leading to physical or

psychological changes in the participants, thus affecting the outcome measure.

The triangulation of the findings of the quasi-experimental (before-and-after)

and qualitative descriptive studies enabled the author to address these two

threats to internal validity to some extent. The findings of the quasi-experimental

study were supported by the findings of the qualitative descriptive study. During

the qualitative interviews, the patients reflected on the usefulness of the clinic

and attributed pain relief to various pharmacological and/or non-

pharmacological recommendations made at the pain clinic. An “instrumentation

threat” refers to the change of the scale measuring the outcome between

“before” and “after” measurements, which could affect the outcome. As

242

described in the methods chapter, (Chapter 5) all questionnaires/scales used in

this study have well demonstrated validity and reliability. The same

questionnaires were used for all outcomes during all assessments (baseline,

discharge, 3-month follow-up) minimizing instrumentation threat to the internal

validity of this study.

The second major limitation of this study was the inability to achieve the

required sample size. The required sample size, after accounting for a 15%

dropout rate, to detect a minimum clinically important difference as

recommended by the IMMPACT group (Dworkin et al., 2008) for pain intensity

was 79. However, discharge data were available for 36 patients only as the

service was decommissioned whilst data were being collected. Subsequently,

the services of the clinical nurse specialist were absorbed into a

musculoskeletal service at the same community health centre and the services

of the pharmacist were discontinued. Since there were structural changes in the

provision of service, collecting further follow-up data would not have been

appropriate. The inability to achieve the required sample size (i.e.

underpowered) could lead to Type II error, failure to find a difference in

presence of a real difference (Altman, 1991). This could explain a lack of

intervention effect on the quality of life, anxiety and depression in the present

study. On the other hand, the significant intervention effect on two of the

outcome measures, pain intensity and physical functioning, might be due to

Type I error, a false positive. Therefore, the results should be interpreted with

care. However, as discussed above, patients during the qualitative interviews

highlighted positive impact of the clinic on their lives in general.

The third limitation, although linked to the second one, was the low

response rate of the postal questionnaire. Traditionally, postal questionnaires

243

suffer a low response rate and a response rate of 50% or above is considered

good {(Babbie, 1973, Kidder, 1981) cited in (Richardson, 2005)}. Sending the

questionnaires in the post was the best possible approach for the 3-month

follow-up as it would have been unethical to ask the patients to come to the

clinic just to complete questionnaires without at least reimbursing their travel

expenses. Furthermore, travelling to the pain clinic might have been

inconvenient for patients in pain. The decision to drop SF-36 for the 3-month

follow-up was made primarily to increase the response rate as shorter

questionnaires have been reported to have a better response rate than longer

questionnaires (OR1.86; CI 1.55 to 2.24) (Edwards et al., 2002). In addition,

personalized letters were also sent together with the questionnaires in an effort

to improve response rates as personalized letters improve response rates as

well (OR 1.16; CI 1.06 to 1.28) (Edwards et al., 2002). Monetary incentives

have also been reported to improve the response rate (OR 2.02; 95% CI 1.79 to

2.27) (Edwards et al., 2002), but unfortunately, due to lack of funding giving

patients monetary reward was not possible.

For the qualitative descriptive study, there were two main limitations as

well. Firstly, the patients were interviewed upon discharge from the service;

theoretically, patients were discharged once the patients had made desired

progress, which may explain their satisfaction from the service. However, as

described earlier in chapter 5, a framework for maximum variation sampling was

developed and baseline pain-intensity scores rather than discharge scores were

considered in developing the framework. Despite that, patients in pain might not

have consented for interviews, limiting the pool of potential participants.

Secondly, the author/researcher being a pharmacist himself could have

introduced researcher bias. However, the author clearly described his position

244

in the study in the very beginning. In addition, various measures were used

such as peer debriefing and providing rich thick description, as described in

chapter 5, to ensure transparency, trustworthiness and, to minimize researcher

bias. In addition, in-depth description of all the aspects of data collection

(sampling, sample size, settings, topic guide) and analysis (data management,

method of analysis, methods to ensure rigour) has been provided to ensure

transferability of qualitative findings.

8.6 Recommendations for future research

Further research is required to establish the long-term effectiveness and

sustainability of such community-based nurse-pharmacist managed pain

clinics. The IMMPACT guidance should be followed in designing and

reporting studies evaluating the effectiveness of interventions in chronic

pain management.

The types of patients that are more likely to obtain benefits from such

community based services are still not well known. Further research is

required to determine the predictors of successful treatment outcomes.

This information is crucial and should be used for developing evidence

based referral guidelines. Such guidelines could ensure referral to the

right healthcare professional at the right time thus minimizing cost to the

healthcare system. Additionally, what factors encourage GPs to refer

patients to pain clinics/secondary care/physiotherapy should be

investigated.

As described in the literature review chapter, there is only weak evidence

to support the cost effectiveness of nurse-led interventions in chronic

pain management. However, no cost-effectiveness data are available for

such pain clinics jointly managed by the nurse and the pharmacist. Cost

245

effectiveness data are important to advocate for the wider development

of such pain services.

8.7 Recommendations for policy and practice

The views of all stakeholders, including patients, should be considered

especially before decommissioning of service as it may have negative

consequences on their health. Service commissioners should rely on

best available research evidence for commissioning and/or

decommissioning of services. Had the service commissioners waited for

this study to be completed, it may have guided them to make a well

informed decision.

Pharmacists working in community pharmacies can play an important

role in the management of chronic pain by ensuring the safe and

effective use of medicines. Therefore, service commissioners while

planning chronic pain services should think of ways of incorporating

community pharmacists’ services in pain service.

Employing specialised pain nurses in GP practices can potentially

facilitate effective pain management in the community.

Since anxiety and depression frequently co-exists with chronic pain,

there is a need to assess mental functioning of chronic pain patients

regularly in primary care. Help from psychological services should be

sought when necessary, as anxiety and depression can also interfere

with the management of chronic pain.

Since chronic pain is primarily managed in primary care, there is a need

to train GPs in chronic pain management. GPs need to be informed

about the existence of such clinics and should be encouraged to refer

patients to community-based pain clinics, if available, early during the

246

course of the disease for a thorough assessment. Further referrals to

other services and/or secondary care should only be made based on the

recommendations of the pain clinic. This will potentially reduce burden

on secondary care.

Since nurses and pharmacists have the potential to contribute to

effective chronic pain management, structured and specialised training

programmes in chronic pain management should be developed for them

to further improve their knowledge and skills in chronic pain

management. The nurses and pharmacists working in such clinics

should be encouraged to become independent prescribers as it can

improve patients’ access to medicines. This will also reduce the number

of visits to the GPs to obtain prescription analgesics as well, reducing

overall cost and time.

8.8 Dissemination plan

To disseminate the findings of research work is an ethical and professional

responsibility. To date, as indicated in the beginning of this thesis, the author

has published six peer reviewed papers in addition to two non-peer reviewed

papers highlighting various aspects of the work presented in this thesis. The

findings have also been presented in various conferences. The future

dissemination plan is outlined in Table 8.1.

247

Table 8.1. Dissemination plan

Proposed title Potential journal Submission

date

An evaluation of nurse-

pharmacist managed pain clinic:

A mixed-methods study

The Clinical Journal of

Pain/ Health Services

Research

June 2014

Patients’ experiences of living

with chronic pain: a qualitative

study

Pain/ The Clinical

Journal of Pain

July 2014

Quality of life and clinical

characteristics of the patients

referred to a nurse-pharmacist

managed pain clinic

International Journal of

Clinical Pharmacy

July 2014

“No one is listening here”-

Chronic pain patients and the

NHS: Barriers to effective pain

management

The British Medical

Journal/ The Journal of

Pain

August 2014

248

References

AL-BUSAIDI, Z. Q. 2008. Qualitative research and its uses in healthcare. Sultan Qaboos University Medical Journal, 8, 11-19.

ALMBORG, A. H. & BERG, S. 2009. Quality of life among Swedish patients after stroke: Psychometric evaluation of SF-36. Journal of Rehabilitation Medicine, 41, 48-53.

ALTMAN, D. G. 1980. Statistics and ethics in medical research III:how large a sample? British Medical Journal, 281, 1336-1338.

ALTMAN, D. G. 1991. Practical Statistics for Medical Research, London, UK, Chapman & Hall.

AMERICAN SOCIETY OF CONSULTANT PHARMACISTS FOUNDATION. 2012. Pharmacotherapy traineeship: Pain management traineeship [Online]. Alexandria. Available: http://www.ascpfoundation.org/traineeships/train_painmanagement_pol.cfm [Accessed 10 December 2012].

ARMSTRONG, D. 1996. Measuring man: some problems of method. Family Practice, 13, 6-9.

AVIS, M. 2005. Is there an epistemology for qualitative research. In: HOLLOWAY, I. (ed.) Qualitative Research in Health Care. Berkshire: Open University Press.

BABBIE, E. R. 1973. Survey research methods, Belmont, CA, Wadsworth. BARBER, N. 2001. Pharmaceutical care and medicines management, is there

a difference? . Pharmacy World and Science, 23, 205-209. BECK, A. T. & STEER, R. A. 1993. Beck depression inventory manual, San

Antonio, Psychological Corporation. BECK, A. T., WARD, C. H., MENDELSON, M., MOCK, J. & ERBAUGH, J. 1961. An

inventory for measuring depression. Archives of General Psychiatry, 4, 561-567.

BECKER, N., SJØGREN, P., BECH, P., OLSEN, A. K. & ERIKSEN, J. 2000. Treatment outcome of chronic non-malignant pain patients managed in a Danish multidisciplinary pain centre compared to general practice: a randomised controlled trial. Pain, 84, 203-211.

BELLAMY, N. 1996. WOMAC osteoarthritis index: a user's guide, Ontario, London Health Services, McMaster University.

BENNETT, M. I., BAGNALL, A. M., RAINE, G., CLOSS, S. J., BLENKINSOPP, A., DICKMAN, A. & ELLERSHAW, J. 2011. Educational Interventions by Pharmacists to Patients With Chronic Pain: Systematic Review and Meta-analysis. Clinical Journal of Pain, 27, 623-630.

BERGNER, M., BOBBITT, R. A., CARTER, W. B. & GILSON, B. S. 1981. The sickness impact profile: development and final revision of a health status measure. Medical Care, 19, 787-805.

BERKWITS, M. & ARONOWITZ, R. 1995. Different questions beg different methods. Journal of General Internal Medicine, 10, 409–410.

BERNDT, S., MAIER, C. & SCHÜTZ, H. W. 1993. Polymedication and medication compliance in patients with chronic non-malignant pain. Pain, 52, 331-339.

BJELLAND, I., DAHL, A. A., HAUG, T. T. & NECKELMANN, D. 2002. The validity of the Hospital Anxiety and Depression Scale. An updated literature review. Journal of Psychosomatic Research, 52, 69-77.

BLYTH, F. M., MARCH, L. M., BRNABIC, A. J. M. & COUSINS, M. J. 2004. Chronic pain and frequent use of health care. Pain, 111, 51-58.

249

BLYTH, F. M., MARCH, L. M., BRNABIC, A. J. M., JORM, L. R., WILLIAMSON, M. & COUSINS, M. J. 2001. Chronic pain in Australia: A prevalence study. Pain, 89, 127-134.

BOND, C. M., BRUHN, H., BLYTH, A., ELLIOTT, A. M., HANNAFORD, P. C., HOLLAND, R., LEE, A. J., MCNAMEE, P., SMITH, B. H., WATSON, M. C. & WRIGHT, D. Pharmacist-led management of chronic pain in primary care: The experiences of patients, pharmacists and GPs. Royal Pharmaceutical Society Conference October 2011 London, UK. International Journal of Pharmacy Practice 24-25.

BONNIE, S. & MARTIN, R. 1998. Understanding controlled trials: Why are randomised controlled trials important? The British Medical Journal, 316, 201.

BOYATZIS, R. E. 1998. Transforming qualitative inforamtion: Themataic analysis and code development, Thousand Oaks, CA, Sage.

BRAUN, V. & CLARKE, V. 2006. Using thematic analysis in psychology. Qualitative Research in Psychology, 3, 77-101.

BRAZIER, J., ROBERTS, J. & DEVERILL, M. 2002. The estimation of a preference based measure of health from the SF-36. Journal of Health Economics, 21, 271-292.

BREIVIK, H., COLLETT, B., VENTAFRIDDA, V., COHEN, R. & GALLACHER, D. 2006. Survey of chronic pain in Europe: prevalence, impact on daily life, and treatment. European Journal of Pain, 10, 287-333.

BRIDGES, S. 2012. Health Survery for England - 2011: Chapter 9, Chronic pain. Available: https://catalogue.ic.nhs.uk/publications/public-health/surveys/heal-surv-eng-2011/HSE2011-Ch9-Chronic-Pain.pdf [Accessed 6 May 2013].

BRIGGS, M., CLOSS, S. J., MARCZEWSKI, K. & BARRATT, J. 2008. A feasibility study of a combined nurse/pharmacist-led chronic pain clinic in primary care. Quality in Primary Care, 16, 91-94.

BRIGGS, M., MARCZEWSKI, K. & DICKSON, D. Developing chronic pain services to meet the need in primary care. 37th Pain Society Annual Scientific Meeting, 21-23 March 2004 Manchester, United Kingdom. The Brisith Pain Society.

BROEKMANS, S., DOBBELS, F., MILISEN, K., MORLION, B. & VANDERSCHUEREN, S. 2009. Medication adherence in patients with chronic non-malignant pain: is there a problem? European Journal of Pain, 13, 115-123.

BRUHN, H., BLYTH, A., ELLIOTT, A., HANNAFORD, P., HOLLAND, R., LEE, A., MACNAMEE, P., SMITH, B., WATSON, M., WRIGHT, D. & BOND, C. 2011a. Pharmacist-led management of chronic pain in primary care: The PIPPC study. Journal of Epidemiology and Community Health, 65, A1-A40.

BRUHN, H., BOND, C. M., ELLIOTT, A., HANNAFORD, P., LEE, A. J., MCNAMEE, P., SMITH, B., WATSON, M., BLYTH, A., HOLLAND, R. & WRIGHT, D. J. Pharmacist-led management of chronic pain in primary care: The PIPPC study. Health Services Research and Pharmacy Practice Conference, June 2011b Norwich, United Kingdom. International Journal of Pharmacy Practice, 22-23.

BRUHN, H., BOND, C. M., ELLIOTT, A. M., HANNAFORD, P. C., LEE, A. J., MCNAMEE, P., SMITH, B. H., WATSON, M. C., HOLLAND, R. & WRIGHT, D. 2013. Pharmacist-led management of chronic pain in primary care: results from a randomised controlled exploratory trial. BMJ Open, 3, e002361

BRUNTON, G., OLIVER, S., OLIVER, K. & LORENC, T. 2006. A Synthesis of Research Addressing Children's, Young People's and Parents' Views of Walking and Cycling for Transport. London: EPPI-Centre, Social Science Research Unit, Institute of Education, University of London.

250

BRYMAN, A. 2006. Integrating quantitative and qualitative research: How is it done? Qualitative Research, 6, 97-113.

CAMPBELL, M., FITZPATRICK, R., HAINES, A., KINMONTH, A. L., SANDERCOCK, P., SPIEGELHALTER, D. & TYER, P. 2000. Framework for design and evaluation of complex interventions to improve health. British Medical Journal, 321, 694-696.

CASTILLO-BUENO, MORENO-PINA, J. P., MARTINEZ-PUENTE, M. V., ARTILES-SUAREZ, M. M., COMPANY-SCNCHO, M. C., GARCIA-ANDRES, M. C., SANCHEZ-VILLAR, I. & HERNANDEZ-PEREZ, R. 2010. Effectiveness of nursing intervention for adult patients experiencing chronic pain:a systematic review. JBI Library of Systematic Reviews, 8, 1112-1168.

CASTILLO, J. J. 2003. Non-probability Sampling [Online]. Available: http://www.experiment-resources.com/non-probability-sampling.html [Accessed 1 Jul 2011].

CATALA´, E., REIG, E., ARTE´S, M., ALIAGA, L., LO´PEZ, J. S. & SEGU´, J. L. 2002. Prevalence of pain in the Spanish population: Telephone survey in 5000 homes. European Journal of Pain, 6, 133-140.

CENTERS FOR DISEASE CONTROL AND PREVENTION. 2010. Unintentional drug poisoning in the United States [Online]. Washington, DC: U.S. Government Printing Office. Available: http://www.cdc.gov/HomeandRecreationalSafety/pdf/poison-issue-brief.pdf [Accessed 10 December 2012].

CENTERS FOR DISEASE CONTROL AND PREVENTION ANALYSIS: MORBIDITY AND MORTALITY WEEKLY REPORT (MMWR). 2011. Vital Signs: Overdoses of Prescription Opioid Pain Relievers - United States, 1999-2008. [Accessed 10 December 2012].

CENTRE FOR REVIEWS AND DISSEMINATION. 2012. PROSPERO [Online]. Available: http://www.crd.york.ac.uk/Prospero/ [Accessed April 5 2012].

CHALMERS, I. & ALTMAN, D. (eds.) 1995. Systematic reviews, London: BMJ Publishing group.

CHAPMAN, S. L., JAMISON, R. N. & SANDERS, S. H. 1996. Treatment helpfulness questionnaire: a measure of patient satisfaction with treatment modalities provided in chronic pain management programs Pain, 68, 349-361.

CHARMAZ, K. 2006. Constructing grounded theory: A practical guide through qualitative analysis, Thousand Oaks, CA, Sage.

CHELMINSKI, P. R., IVES, T. J., FELIX, K. M., PRAKKEN, S. D., MILLER, T. M., PERHAC, J. S., MALONE, R. M., BRYANT, M. E., DEWALT, D. A. & PIGNONE, M. P. 2005. A primary care, multi-disciplinary disease management program for opioid-treated patients with chronic non-cancer pain and a high burden of psychiatric comorbidity. BMC Health Services Research, 5:3.

CHEN, P. P., CHEN, J., GIN, T., MA, M., FUNG, K. C., WOO, K. H. & WONG, P. Y. 2004. Out-patient chronic pain service in Hong Kong: prospective study. Hong Kong Medical Journal, 10, 150-155.

CHIA, E. M., ROCHTCHINA, E., JIE, J. W. & MITCHELL, P. 2006. Utility and validity of the self-administered SF-36: Findings from an older population. Annals of the Academy of Medicine Singapore, 35, 461-467.

CHIEF MEDICAL OFFICER FOR ENGLAND 2008. CMO Annual Report 2008 - Pain: Breaking through the barrier. London: Department of Health.

CLEELAND, C. S. 1993. Strategies for improving cancer pain management. Journal of Pain and Symptom Management, 8, 361-364.

CLEELAND, C. S., NAKAMURA, Y., MENDOZA, T. R., EDWARDS, K. R., DOUGLAS, J. & SERLINA, R. C. 1996. Dimensions of the impact of cancer pain in a four country sample: new information from multidimensional scaling. Pain, 67, 267-73.

251

CLEELAND, C. S. & RYAN, K. M. 1994. Pain assessment: global use of the Brief Pain Inventory. Annals Acadmey of Medicine, 23, 129-38.

CLOSS, S. J., BRIGGS, M., MARCZEWSKI, K. & BUSH, D. 2011. Integrated development of a community based, nurse-led pain clinic: a success story. Leeds: University of Leeds.

COHEN, J. 1988. Statistical Power Analysis in the Behavioral Sciences, Hillsdale, NJ, Lawrence Erlbaum Associates, Inc.

COOK, T. D. & CAMPBELL, D. T. 1979. Qusai-experimentation: design and analysis issues for field settings, Chicago, Rand McNally.

COUTO, J. E., ROMNEY, M. C., LEIDER, H. L., SHARMA, S. & GOLDFARB, N. I. 2009. High rates of inappropriate drug use in the chronic pain population. Populaton Health Management, 12, 185-190.

COYNE, I. T. 1997. Sampling in qualitative research. Purposeful and theoretical sampling; merging or clear boundries. Journal of Advanced Nursing, 56, 623-630.

CRESWELL, J. W. 2003. Research design: Qualitative, quantitative and mixed methods approachs, Thousand Oaks, CA, Sage.

CRESWELL, J. W. 2007. Qualitative inquiry and research design: Choosing among five approaches, Thousand Oaks, CA, Sage.

CRESWELL, J. W. & MILLER, D. L. 2000. Determining validity in qualitative inquiry. Theory Into Practice, 39, 124-130.

CRESWELL, J. W. & PLANO CLARK, V. L. 2007. Designing and Conducting Mixed Methods Research, Thousand Oaks, CA, Sage.

CRESWELL, J. W. & PLANO CLARK, V. L. 2011. Designing and conducting mixed methods research, Thousand Oaks, CA, Sage.

CRESWELL, J. W., PLANO CLARK, V. L., GUTMAN, M. & HANSON, W. 2003. Advanced mixed methods research designs. In: TASHAKKORI, A. & TEDDIE, C. (eds.) Handbook of Mixed Methods in Social and Behavioral Research. Thousand Oaks, CA: Sage Publications.

CROTTY, M. 1996. Phenomenology and nursing research, Melbourne,Victoria, Australia, Churchill Livingstone.

CROTTY, M. 1998. The foundations of social research: Meaning and perspective in the research process, London, Sage.

CROUCH, M. & MCKENZIE, H. 2006. The logic of small samples in interview-based qualitative research. Social Science Information, 45, 183-499.

DE VRIES, H. J., BROUWER, S., GROOTHOFF, J. W., GEERTZEN, J. H. & RENEMAN, M. F. 2011. Staying at work with chronic nonspecific musculoskeletal pain: a qualitative study of workers' experiences. BMC Musculoskeletal Disorders, 12, 126.

DENZIN, N. K. & LINCOLN, Y. S. (eds.) 2005. The SAGE Handbook of Qualitative Research, Thousand Oaks, CA: Sage.

DEPARTMANT OF PHARMACY. 2012. Pharmacy Residency Program: Pain Management and Palliative Care [Online]. Baltimore, MD. Available: http://www.hopkinsmedicine.org/pharmacy/residents/programs/pain_management.html [Accessed December 10 2012].

DEPARTMENT OF HEALTH. 2000. The NHS Plan: a plan for investment, a plan for reform. London: The Stationary Office.

DEPARTMENT OF HEALTH. 2006. Improving Patients’ Access to Medicines: A Guide to Implementing Nurse and Pharmacist Independent Prescribing within the NHS in England. London.

DIXON-WOODS, M., CAVERS, D., AGARWAL, S., ANNANDALE, E., ARTHUR, A., HARVEY, J., HSU, R., KATBAMNA, S., OLSEN, R., SMITH, L., RILEY, R. & SUTTON, A. J. 2006. Conducting a critical interpretive synthesis of the literature on access to healthcare by vulnerable groups. BMC Medical Research Methodology, 6:35.

252

DIXON, D., POLLARD, B. & JOHNSTON, M. 2007. What does chronic pain grade questionnaire measure? Pain, 130, 249-253.

DOLE, E. J., MURAWSKI, M. M., ADOLPHE, A. B., ARAGON, F. D. & HOCHSTADT, B. 2007. Provision of pain management by a pharmacist with prescribing authority. American Journal of Health-System Pharmacy, 64, 85-89.

DWORKIN, R. H., TURK, D. C., FARRAR, J. T., HAYTHORNTHWAITE, J. A., JENSEN, M. P., KATZ, N. P., KERNS, R. D., STUCKI, G., ALLEN, R. R., BELLAMY, N., CARR, D. B., CHANDLER, J., COWAN, P., DIONNE, R., GALER, B. S., HERTZ, S., JADAD, A. R., KRAMER, L. D., MANNING, D. C., MARTIN, S., MCCORMICK, C. G., MCDERMOTT, M. P., MCGRATH, P., QUESSY, S., RAPPAPORT, B. A., ROBBINS, W., ROBINSON, J. P., ROTHMAN, M., ROYAL, M. A., SIMON, L., STAUFFER, J. W., STEIN, W., TOLLETT, J., WERNICKE, J. & WITTER, J. 2005. Core outcome measures for chronic pain clinical trials: IMMPACT recommendations. Pain, 113, 9-19.

DWORKIN, R. H., TURK, D. C., WYRWICH, K. W., BEATON, D., CLEELAND, C. S., FARRAR, J. T., HAYTHORNTHWAITE, J. A., JENSEN, M. P., KERNS, R. D., ADER, D. N., BRANDENBURG, N., BURKE, L. B., CELLA, D., CHANDLER, J., COWAN, P., DIMITROVA, R., DIONNE, R., HERTZ, S., JADAD, A. R., KATZ, N. P., KEHLET, H., KRAMER, L. D., MANNING, D. C., MCCORMICK, C. G., MCDERMOTT, M. P., MCQUAY, H. J., PATEL, S., PORTER, L., QUESSY, S., RAPPAPORT, B. A., RAUSCHKOLB, C., REVICKI, D. A., ROTHMAN, M., SCHMADER, K. E., STACEY, B. R., STAUFFER, J. W., VON STEIN, T., WHITE, R. E., WITTER, J. & ZAVISIC, S. 2008. Interpreting the Clinical Importance of Treatment Outcomes in Chronic Pain Clinical Trials: IMMPACT Recommendations. Journal of Pain, 9, 105-121.

EDWARDS, P., ROBERTS, I., CLARKE, M., DIGUISEPPI, C., PRATAP, S., WENTZ, R. & KWAN, I. 2002. Increasing response rates to postal questionnaires: systematic review. The British Medical Journal, 324, 1183.

EGGER, M., JUNI, P., BARTLETT, C., HOLENSTEIN, F. & STERNE, J. 2003. How important are comprehensive literature searches and the assessment of trial quality in systematic reviews? Empirical study. Health Technology Assessment, 7, 1-76.

ELIAS, M. N., BURDEN, A. M. & CADARETTE, S. M. 2011. The impact of pharmacist interventions on osteoprosis management: a systematic review. Osteoprosis International, 22, 2587-2596.

ELLIOTT, A. M., SMITH, B. H., PENNY, K. I., SMITH, W. & CHAMBERS, W. A. 1999. The epidemiology of chronic pain in the community. Lancet, 354, 1248-1252.

ELY, M., ANZUL, M., FREIDMAN, T., GARNER, D. & STEINMETZ, A. C. 1991. Doing qualitative research: Circles within circles, New York, Falmer Press.

EMANUEL, E. J., WENDLER, D. & GRADY, C. 2000. What makes clinical research ethical? Journal of American Medical Association, 283, 1-11.

ENG, J. 2003. Sample size estimation: How many individuals should be studied? . Radiology, 227, 309-313.

ERIKSEN, J., JENSEN, M. K., SJØGREN, P., EKHOLM, O. & RASMUSSEN, N. K. 2003. Epidemiology of chronic non-malignant pain in Denmark. Pain, 106, 221-228.

ERIKSEN, J., SJØGREN, P., EKHOLM, O. & RASMUSSEN, N. K. 2004. Health care utilisation among individuals reporting long-term pain: an epidemiological study based on Danish National Health Surveys. European Journal of Pain, 8, 517-523.

FAN, T. & ELGOURT, T. 2008. Pain management pharmacy service in a community hospital. American Journal of Health-System Pharmacy, 65, 1560-1565.

253

FERNANDEZ, E. 2002. Anxiety, depression and anger in pain: research findings and clinical options, Texas, Advanced Pscychological Resourses.

FISHER, A. A., FOREIT, J. J., LAING, J., STOECKEL, J. & TOWNSEND, J. 2002. Intervention Study Designs. In: FISHER, A. A. & FOREIT, J. J. (eds.) Designing HIV/AIDS Intervention Studies: An Operations Research Handbook. Washington, DC: Popilation Council.

FITZPATRICK, R. 1990. Measurement of patient satisfaction. In: HOPKINS, A. & COSTAIN, D. (eds.) Measuring the Outcomes of Medical Care. London: Royal College of Physicians of London.

FITZPATRICK, R. 1991. Surveys of patient satisfaction.I-Impotant general considerations. British Medical Journal, 302, 887-889.

FITZPATRICK, R., HOPKINS, A. & HARVARD-WATTS, O. 1983. Social dimensions of healing : A longitudinal study of outcomes of medical management of headdaches. Social Science & Medicine, 17, 501-510.

FITZPATRICK, R. M. & HOPKINS, A. 1981. Patients' satisfaction with communication in meurological outpatients clinics. Journal of Pscychosomatic Research, 25, 329-334.

FLOR, H., FYDRICH, T. & TURK, D. C. 1992. Efficacy of multidisciplinary pain treatment centers: a meta-analytic review. Pain, 49, 221-230.

FREBURGER, J. K., HOLMES, G. M., AGANS, R. P., JACKMAN, A. M., DARTER, J. D., WALLACE, S. A., CASTEL, L. D., KALSBEEK, W. D. & CAREY, T. S. 2009. The rising prevalence of chronic low back pain. Archives of Internal Medicine, 169, 251-258.

FRIESSEM, C. H., WILLWEBER-STRUMPF, A. & ZENZ, M. W. 2009. Chronic pain in primary care: German figures from 1991 and 2006. BMC Public Health, 9, 299.

FURLONG, W. J., FEENY, D. H., TORRANCE, G. W. & BARR, R. D. 2001. The Health Utilities Index (HUI) system for assessing health-related quality of life in clinical studies. Annals of Internal Medicine, 33, 375-384.

GALANDI, D., SCHWARZER, G. & ANTES, G. 2006. The demise of the randomised controlled trial: bibliometric study of the German-language health care literature, 1948 to 2004. BMC Medical Research Methodology, 6:30.

GALLAGHER, R. M. 2000. The Uniform Outcome Measures Project. Pain Medicine, 15, 1-4.

GALLAGHER, R. M. & VERMA, S. 2004. Mood and anxiety disorders in chronic pain. In: DWORKIN, R. H. & BREIBART, W. S. (eds.) Psychological Aspects of Pain: A Handbook for Healthcare Proiders. Seattle: IASP Press.

GAMMAITONI, A. R., GALLAGHER, R. M., WELZ, M., GRACELY, E. J., KNOWLTON, C. H. & VOLTIS-THOMAS, O. 2000. Palliative pharmaceutical care: A randomized, prospective study of telephone-based prescription and medication and counseling services for treating chronic pain. Pain Medicine, 1, 317-331.

GASKIN, D. J. & RICHARD, P. 2012. The economic costs of pain in the United States. Journal of Pain, 13, 715-724.

GATCHEL, R. J. 2005. Clinical Essentials of Pain Management, Washington, DC, American Psychological Association.

GATCHEL, R. J. & OKIFUJI, A. 2006. Evidence-based scientific data documenting the treatment and cost-effectiveness of comprehensive pain programs for chronic nonmalignant pain. The Jounal of Pain, 7, 779-793.

GEISSER, M. E., ROTH, R. S. & ROBINSON, M. E. 1997. Assessing depression among persons with chronic pain using the Center for Epidemiological Studies-Depression Scale and the Beck Depression Inventory: a comparative analysis. The Clinical Journal of Pain, 13, 163-170.

GIBBS, A. 1997. Focus groups. Social Research Update.

254

GILCHRIST, V. J. & ENGEL, J. D. 1995. Qualitative research and clinical care. Journal of Family Practice, 41, 229-230.

GLAJCHEN, M. 2001. Chronic pain: Treatment barriers and strategies for clinical practice. Journal of American Board of Family Practice, 14, 211-218.

GLASER, B. G. 1992. Basics of grounded theory analysis, Mill Valley, CA, Sociology Press.

GLASER, B. G. & STRAUSS, A. 1967. The discovery of grounded theory, Chicago, Aldine.

GOLDBERG, D. & WILLIAMS, P. 1988. A users guide to the General Health Questionnaire, Slough, NFER-Nelson.

GOUGH, D., THOMAS, J. & OLIVER, S. 2012. Clarifying differences between review designs and methods. Systematic Reviews, 1.

GRAY, M. J. A. M. 1997. Evidence-based Healthcare, Edinburgh, Churchill Livingstone.

GREEN, J. & HART, L. 1999. The impact of context on data. In: BARBOUR, R. & KITZINGER, J. (eds.) Developing focus group research: politics, theory and practice. London: Sage.

GREEN, J. & THOROGOOD, N. 2009. Qualitative Methods for Health Research, London, Sage.

GREENE, J. C. 2007. Mixed Methods in Social Inquiry, San Francisco, Jossey-Bass.

GREENE, J. C., CARACELLI, V. J. & GRAHAM, W. F. 1989. Toward a conceptual framework for mixed method evaluation designs. Educational Evaluation and Policy Analysis, 11, 255-274.

GREENHALGH, T., ROBERT, G., MACFARLANE, F., BATE, P., KYRIAKIDOU, O. & PEACOCK, R. 2005. Storylines of research in diffusion of innovation: a meta-narrative approach to systematic review. Social Science and Medicine, 61, 417-430.

GUBA, E. G. 1990. The alternative paradigm dialog. In: GUBA, E. G. (ed.) The paradigm dialog. Newbury Park, CA: Sage.

GUEST, G., BUNCE, A. & JOHNSON, L. 2006. How many interviews are enough? An experiment with data saturation and variability. Field Methods, 18, 59-82.

GUZMÁN, J., ESMAIL, R., KARJALAINEN, K., MALMIVAARA, AIRVIN, E. & BOMBARDIER, C. 2001. Multidisciplinary rehabilitation for chronic low back pain: systematic review. The British Medical Journal, 322, 1511-1515.

HADI, M. A. 2010. PharmD and Needs based education: An alternate view. American Journal of Pharmaceutical Education, 74, 125.

HADI, M. A., ALLDRED, D. P., CLOSS, S. J. & BRIGGS, M. 2012. Effectiveness of pharmacist-led medication reviews in improving patient outcomes in chronic pain: A systematic review protocol. Canadian Pharmacists Journal, 145, 264-266.e1.

HADI, M. A., ALLDRED, D. P., CLOSS, S. J. & BRIGGS, M. 2013. Mixed-methods research in pharmacy practice: basics and beyond (part 1). International Journal of Pharmacy Practice, 21, 341-345.

HADI, M. A., ALLDRED, D. P., CLOSS, S. J. & BRIGGS, M. 2014. Mixed-methods research in pharmacy practice: recommendations for quality reporting (part 2). International Journal of Pharmacy Practice, 22, 96-100.

HADI, M. A. & AWAISU, A. 2010. Postgraduate programs in clinical pharmacy and pharmacy practice: Are we heading in the right direction? American Journal of Pharmaceutical Education, 74, 72.

HADI, M. A., LONG, C. M., LEE, W. L., SHAHARUDDIN, S. & ADAM, A. 2010. Developing a practice based Master in clinical pharmacy programme at Universiti Teknologi MARA, Malaysia. American Journal of Pharmaceutical Education, 74, 32.

255

HALPERN, S. D., KARLAWISH, J. H. T. & BERLIN, J. A. 2002. The continuing unethical conduct of underpowered clinical trials. Journal of American Medical Association, 288, 358-362.

HANLON, J. T., FILLENBAUM, G. G., STUDENSKI, S. A., ZIQUBU-PAGE, T. & WALL, W. E. 1996. Factors associated with subotimal analgesic use in community-dwelling elderly. Annals of Pharmacotherrapy, 30, 739–744.

HARDING, G., PARSONS, S., RAHMAN, A. & UNDERWOOD, M. 2005. ‘It struck me that they didn’t understand pain’: the specialist pain clinic experience of patients with chronic musculoskeletal pain. Arthritis & Rheumatism, 53, 691-696.

HARKNESS, E. F., MACFARLANE, G. J., SILMAN, A. J. & MCBETH, J. 2005. Is musculoskeletal pain more common now than 40 years ago? Two population-based cross-sectional studies. Rheumatology, 44, 890-895.

HARRIS, A. D., BRADHAM, D. D., BAUMGARTEN, M., ZUCKERMAN, I. H., FINK, J. C. & PERENCEVICH, E. N. 2004. The use and interpertation of Quasi-experimental studies in infectious diseases. Clinical Infectious Diseases, 38, 1586-91.

HARRIS, A. D., LAUTENBACH, E. & PERENCEVICH, E. N. 2005. A systematic review of quasi-experimental study design in the fields of infection control and antibiotic resistance. Clinical Infectious Diseases, 41, 77-82.

HARRIS, M. 1968. The rise of anthropological theory: A history of theories of culture, New York, T. Y. Crowell.

HAY, E. M., FOSTER, N. E., THOMAS, E., PEAT, G., PHELAN, M., YATES, H. E., BLENKINSOPP, A. & SIM, J. 2006. Effectiveness of community physiotherapy and enhanced pharmacy review for knee pain in people aged over 55 presenting to primary care: Pragmatic randomised trial. British Medical Journal, 333, 995-998.

HEPLER, C. D. & STRAND, L. M. 1990. Opportunities and responsibilities in pharmaceutical care. American Journal of Hospital Pharmacy, 47, 533-543.

HIGGINS, J. P. T. & GREEN, S. (eds.) 2011. Cochrane Handbook for Systematic Reviews of Interventions Version 5.1.0 [updated March 2011]: The Cochrane Collaboration.

HOFFMANN, W., HERZOG, B., MUEHLIG, S., KAYSER, H., JANHSEN, K. & ET AL. 2008. Pharmaceutical care for migraine and headache patients: A community-based, randomized intervention. Annals of Pharmacotherapy, 42, 1804-1813.

HOLLOWAY, I. (ed.) 2005. Qualitative Research in Health Care, Berkshire: Open University Press.

HOPEWELL, S. 2004. Impact of grey literature on systematic review of randomized trials. PhD, University of Oxford.

HOPEWELL, S., MCDONALD, S., CLARKE, M. & EGGER, M. 2007. Grey literature in meta-analyses of randomized trials of health care interventions. Cochrane Database of Systmatic Reviews, MR000010.

HUQUE, M. F. 1988. Experiences with meta-analysis in NDA submissions. Proceedings of the Biopharmaceutical Section of the American Statistical Association, 2, 28-33.

IASP SUBCOMMITTEE ON TAXONOMY. 1979. Pain terms: A list with definitions and notes on usage. Pain, 6, 249-252.

IASP SUBCOMMITTEE ON TAXONOMY. 1986. Classification of chronic pain. Description of chronic pain sundromes and definitions of pain terms. Pain, Suppl 3, S1-S226.

INTERNATIONAL ASSOCIATION FOR THE STUDY OF PAIN. 1986. Classification of chronic pain. Pain, Supplement 3, S1-S225.

JENSEN, M. P. & KAROLY, P. 2001. Self-report scales and procedures for assessing pain in adults, New York, Guilford Press.

256

JHONSON, R. B., ONWUEGBUZIE, A. J. & TURNER, L. A. 2007. Toward a definition of mixed methods research. Journal of Mixed Methods Research, 1, 112-133.

JOHANNES, C. B., LE, T. M., ZHOU, X., JOHNSTON, J. A. & DWORKIN, R. H. 2010. The Prevalence of Chronic Pain in United States Adults: Results of an Internet-Based Survey. The Journal of Pain, 11, 1230-1239.

JONES, A. C., COULSON, L., MUIR, K., TOLLEY, K., LOPHATANANON, A., EVERITT, L., PRINGLE, M. & DOHERTY, M. 2002. A nurse-delivered advice intervention can reduce chronic non-steroidal anti-inflammatory drug use in general practice: A randomized controlled trial. Rheumatology, 41 (1), 14-21.

JULION, W., GROSS, D., BARCLAY-MCLAUGHLIN, G. & FOGG, L. 2007. "It's not just about MOMMAS": African-American non-resident fathers' views of paternal involvement. Research in Nursing & Health, 30, 595-610.

JÜNI, P., ALTMAN, D. G. & EGGER, M. 1999. The hazards of scoring the quality of clinical trials for meta-analysis. JAMA, 282, 1054-1060.

JÜNIA, P., HOLENSTEINB, F., STERNEA, J., BARTLETTA, C. & EGGERA, M. 2002. Direction and impact of language bias in meta-analyses of controlled trials: empirical study. International Journal of Epidemiology, 31, 115-123.

KAPLAN, R. M., ANDERSON, J. P. & GANIATS, T. G. 1993. The quality of wellbeing scale: rationale for a single quality of life index. In: WALKER, S. R. & ROSSER, R. M. (eds.) Quality of life assessment: key issues in the 1990s. Boston: Kluwer.

KARJALAINEN, K. A., MALMIVAARA, A., VAN TULDER, M. W., ROINE, R., JAUHIAINEN, M., HURRI, H. & KOES, B. W. 2003. Multidisciplinary biopsychosocial rehabilitation for neck and shoulder pain among working age adults. Cochrane Database of Systematic Reviews, Issue 2. Art. No.: CD002193.

KAUR, S., STECHUCHAK, K. M., COFFMAN, C. J., ALLEN, K. D. & BASTIAN, L. A. 2007. Gender differences in health care utilization among veterans with chronic pain. Journal of General Internal Medicine, 22, 228-232.

KEMMIS, S. & WILKINSON, M. 1998. Participatory action research and the study of practice. In: ATWEH, S. & WEEKS, P. (eds.) Action research in practice: Partnerships for social justice in education. New York: Routledge.

KERNS, R. D., TURK, D. C. & RUDY, T. E. 1985. The West Haven-Yale Multidimensional Pain Inventory (WHY MPI). Pain, 23, 345-356.

KIDDER, L. H. 1981. Research methods in social relations., New York, Rinehart & Winston.

KIM, T. S. 2001. Relation of magnetic field therapy to pain and power over time in persons with chronic primary headache: a pilot study. Visions: The Journal of Rogerian Nursing Science, 9, 27-42.

KITSON, G. C., SUSSMAN, B., WILLIAMS, J. K., ZEEHANDELAAR, R. B., SHICKMANTER, B. K. & STEINBERGER, J. L. 1982. Sampling issues in family research. Journal of Marriage and Family, 44, 965-981.

KLEEFSTRA, S. M., KOOL, R. B., VELDKAMP, C. M. A., WINTERS-VAN DER MEER, A. C. M., MENS, M. A. P., BLIJHAM, G. H. & DE HAES, J. C. J. M. 2010. A core questionnaire for the assessment of patient satisfaction in academic hospitals in The Netherlands: development and first results in a nationwide study. Quality & Safety in Health Care, 19.

KOSINSKI, M., KELLER, S. D., WARE JR, J. E., HATOUM, H. T. & KONG, S. X. 1999. The SF-36 Health Survey as a generic outcome measure in clinical trials of patients with osteoarthritis and rheumatoid arthritis: relative validity of scales in relation to clinical measures of arthritis severity. Medical Care, 37.

257

KVALE, S. 1983. The qualitative research interview: A phenomenological and a hermeneutical mode of understanding. Journal of Phenomenological Psychology, 14, 171-196.

LAAS, K., ROINE, R., RASANEN, P., SINTONEN, H., LEIRISALO-REPO, M. & HUSQOL STUDY GROUP 2009. Health-related quality of life in patients with common rheumatic diseases referred to a university clinic. Rheumaology International, 29, 267–73.

LAKHA, S. F., YEGNESWARAN, B., FURLAN, J. C., LEGNINI, V., NICHOLSON, K. & MAILIS-GAGNON, A. 2011. Referring patients with chronic noncancer pain to pain clinics. Canadian Family Physician, 57, e107-e112.

LAPERRIERE, J. A. 1994. The need for specialty training for pharmacists in pain management. Journal of Pain and Palliative Care Pharmacotherapy, 2, 23-39.

LATHER, P. 1993. Fertile obsession: Validity after poststructuralism. Sociological Quaterly, 34, 673-693.

LAUBSCHAGNE, A. 2003. Qualitative research - Airy fairy or fundamental? The Qualitative Report [Online], 8. Available: http://www.nova.edu/ssss/QR/QR8-1/labuschagne.html [Accessed 7 Novmber 2013].

LECOMPTE, M. D. & GOETZ, J. P. 1982. Problems of reliability and validity in ethnographic research. Review of Educational Research, 51, 31-60.

LEEDY, P. D. & ORMROD, J. E. 2001. Practical research: Planning and design, Upper Saddle River, NJ, Prentice Hall.

LEFORT, S. M., GRAY-DONALD, K., ROWAT, K. M. & JEANS, M. E. 1998. Randomized controlled trial of a community-based psychoeducation program for the self-management of chronic pain. Pain, 74, 297-306.

LEONHARDT, C., KELLER, S., CHENOT, J. F., LUCKMANN, J., BASLER, H. D., WEGSCHEIDER, K., BAUM, E., DONNER-BANZHOFF, N., PFINGSTEN, M., HILDEBRANDT, J., KOCHEN, M. M. & BECKER, A. 2008. TTM-based motivational counselling does not increase physical activity of low back pain patients in a primary care setting-A cluster-randomized controlled trial. Patient Education and Counseling, 70, 50-60.

LEUNG, Y. Y., HO, K. W., ZHU, T. Y., TAM, L. S., KUN, E. W. L. & LI, E. K. M. 2010. Testing scaling assumptions, reliability and validity of medical outcomes study short-form 36 health survey in psoriatic arthritis. Rheumatology, 79, 1495-1501.

LINCOLN, Y. S. & GUBA, E. G. 1985. Naturalistic Inquiry, Newbury Park, CA, Sage LINDLOF, T. R. & TAYLOR, B. C. 2002. Qualitative Communication Research

Methods, Thousand Oaks, CA, Sage. LINGAYAS INSTITUTE OF MANAGEMENT AND TECHNOLOGY. 2012. Research

Methodology: An Introduction [Online]. Vijayawada. [Accessed February 7 2013].

LIPTON, R. B., STEWART, W. F., STONE, A. M., LÁINEZ, M. J., SAWYER, J. P. & DISABILITY IN STRATEGIES OF CARE STUDY GROUP 2000. Stratified care vs. step care stratigies for migraine: the Disability in Stratigies of Care (DISC) study: a randomized trial. Journal of American Medical Association, 284, 2599-2605.

LOCKER, D. & DUNT, D. 1978. Theoretical and methodological issues in sociological studies of consumer satisfaction with medical care. . Social Science & Medicine, 12, 283-292.

LUCAS, P. J., ARAI, L., BAIRD, J., LAW, C. & ROBERTS, H. M. 2007. Worked examples of alternative methods for the synthesis of qualitative and quantitative research in systematic reviews. BMC Medical Research Methodology, 7:4.

LYNCH, M. E., CAMPBELL, F., CLARK, A. J., DUNBAR, M. J., GOLDSTEIN, D., PENG, P., STINSON, J. & TUPPER, H. 2008. A systematic review of the effect of waiting for treatment for chronic pain. Pain, 136, 97-116.

258

LYNCH, M. E., CAMPBELL, F. A., CLARK, A. J., DUNBAR, M. J., GOLDSTEIN, D., PENG, P., STINSON, J. & TUPPER, H. 2007. Waiting for treatment for chronic pain – a survey of existing benchmarks: Toward establishing evidence based benchmarks for medically acceptable waiting times. Pain Research & Management, 12, 245-248.

MAILIS-GAGNON, A., YEGNESWARAN, B., LAKHA, S. F., NICHOLSON, K., STEIMAN, A. J., NG, D., PAPAGAPIOU, M., UMANA, M., COHODAREVIC, T. & ZUROWSKI, M. 2007. Pain characteristics and demographics of patients attending a university-affiliated pain clinic in Toronto, Ontario. Pain Research & Management, 12, 93-99.

MAINIADAKIS, N. & GRAY, A. 2000. The economic burden of the chronic pain in the UK. Pain, 84, 95-103.

MANIADAKIS, N. & GRAY, A. 2000. The economic burden of back pain in the UK. Pain, 84, 95-103.

MANNIX, L. K., CHANDURKAR, R. S., RYBICKI, L. A., TUSEK, D. L. & SOLOMON, G. D. 1999. Effect of guided imagery on quality of life for patients with chronic tension-type headache. Headache, 39, 326-334.

MARRA, C. A., CIBERE, J., GRUBISICE, M., GRINDROD, K. A., GASTONGUAY, L., THOMAS, J. M., EMBLEY, P., COLLEY, L., TSUYUKI, R. T., KHAN, K. M. & ESDAILE, J. M. 2012. Pharmacist initiated intervention trial in osteoarthritis (PhIT-OA): a multidisciplinary intervention for knee osteoarthritis. Arthritis Care & Research, 64, 1837-45.

MARRA, C. A., TSUYUKI, R. T., SOON, J. A., GASTONGUAY, L., OTENG, B., CIBERE, J., MCAULEY, C., ESDAILE, J. M., MCGREGOR, M. & KHAN, K. 2008. Design of a randomized trial of a multidisciplinary intervention for knee osteoarthritis: Pharmacist Initiated Intervention Tiral in Osteoarthritis (PhIT-OA). Canadian Pharmacists Journal, 141, 33-38.

MARSHALL, M. N. 1996. Sampling in qualitative research. Family Practice, 13, 522-525.

MARTI, A. M., OLMEDO, G. C., VERA, J. C., ALARACON, M. D. & IBANEZ, J. D. 2005. Effectiveness of a pharmaceutical care unit for the control of severe chronic pain. Farmacia Hospitalaria, 29, 37-45.

MAY, S., J 2000. Patient satisfaction with the managment of back pain. Part 1: what is satisfaction?Review of satisfaction with medical management. Part 2: An exploratory, qualitative study into patients' satisfaction with physiotherapy. Physiotherapy, 87, 4-20.

MAZZUCA, S. A., BRANDT, K. D., KATZ, B. P., RAGOZZINO, L. R. & GʼSELL, P. M. 2004. Can a nurse-directed intervention reduce the exposure of patients with knee osteoarthritis to nonsteroidal antiinflammatory drugs? Journal of Clinical Rheumatology, 10, 315-322.

MCCAFFREY, R. & FREEMAN, E. 2003. Effect of music on chronic osteoarthritis pain in older people. Journal of Advanced Nursing, 44, 517-524.

MCCORMACK, H. M., HORNE, D. J. & SHEATHER, S. 1988. Clinical applications of visual analogue scales: a critical review Psychological Medicine, 18, 1007-1019.

MCDERMOTT, M., SMITH, B. H., ELLIOTT, A. M., BOND, C. M., HANNAFORD, P. C. & CHAMBERS, W. 2006. The use of medication for chronic pain in primary care, and the potential for intervention by a practice-based pharmacist. Family Practice, 23, 46-52.

MCEWEN, J. & MCKENNA, S. P. 1993. Nottingham Health Profile. In: SPILKER, B. (ed.) Quality of life and pharmacoeconomics in clinical trials. 2nd ed. Philadelphia, PA: Lippincott-Raven.

MCNAIRE, D. M., LORR, M. & DROPPLEMAN, L. F. 1971. Profile of Mood States, San Diego, CA, Educational and Industrial Testing Service.

259

MCQUAY, H., CARROLL, D. & MOORE, A. 1996. Variation in the placebo effect in randomised controlled trials of analgesics: all is as blind as it seems. Pain, 64, 331-335.

MEDICAL RESEARCH COUNCIL. 2008. Developing and evaluating complex interventions: new guidance [Online]. London: Medical Research Council,. Available: www.mrc.ac.uk/complexinterventionsguidance [Accessed 3 March 2013].

MERLIN, T., WESTON, A. & TOOHER, R. 2009. Extending an evidence hierarchy to include topics other than treatment: revising the Australian 'levels of evidence'. BMC Medical Research Methodology, 9.

MERSKEY, H. & BOGDUK, N. 1994. Classification of Chronic Pain: Description of Chronic Pain Syndromes and Definitions of Pain Terms, Seattle, IASP Press.

MIDDLETON, C. 2004. The assessment and treatment of patients with chronic pain. Nursing Times [Online], 100. Available: http://www.nursingtimes.net/nursing-practice/clinical-zones/pain-management/the-assessment-and-treatment-of-patients-with-chronic-pain/204386.article [Accessed 20 December 2013].

MIKEAL, R. L., BROWN, T. R., LAZARUS, H. L. & VINSON, M. C. 1975. Quality of pharmaceutical care in hospitals. American Journal of Hospital Pharmacy, 32, 567-574.

MILES, M. B. & HUBERMAN, A. M. 1994. Qualitative data analysis: A sourcebook of new methods, Thousand Oaks, CA, Sage

MILLER, W. R. & ROLLNICK, S. 1991. Motivational interviewing: preparing people to change addictive behaviour., New York, Guilford Press.

MOHER, D., FORTIN, P., JADAD, A. R., JÜNI, P., KLASSEN, T., LE LORIER, J., LIBERATI, A., LINDE, K. & PENNA, A. 1996. Completeness of reporting of trials published in languages other than English: implications for conduct and reporting of systematic reviews. Lancet, 347, 363-366.

MOHER, D., HOPEWELL, S., SCHULZ, K. F., MONTORI, V., GØTZSCHE, P. C., DEVEREAUX, P. J., ELBOURNE, D., EGGER, M. & ALTMAN, D. G. 2010. CONSORT 2010 Explanation and Elaboration: updated guidelines for reporting parallel group randomised trials. British Medical Journal, 340.

MOHER, D., LIBERATI, A., TETZLAFF, J., ALTMAN, D. G. & THE PRISMA GROUP 2009. Preferred Reporting Items for Systematic Reviews and Meta-Analyses: The PRISMA Statement. PLoS Med, 6, e1000097.

MOHER, D., PHAM, B., LAWSON, M. L. & KLASSEN, T. P. 2003. The inclusion of reports of randomised trials published in languages other than English in systematic reviews. Health Technology Assessment, 7, 1-90.

MONTELPARE, W. J. 2011. Sample size calculator for comparison studies. [Online]. Available: http://concussion.leeds.ac.uk/webulators/ssComp.php [Accessed 6 March 2011].

MOORE, M. E., BERK, S. N. & NYPAVER, A. 1984. Chronic pain: Inpatient treatment with small group effects. Archives of Physical Medicine and Rehabilitation, 65, 356-361.

MOORE, R. A., ECCLESTON, C., DERRY, S., WIFFEN, P., BELL, R. F., STRAUBE, S. & MCQUAY, H. 2010a. "Evidence" in chronic pain-establishing best practice in the reporting of systematic reviews. Pain, 150, 386-389.

MOORE, R. A., MOORE, O. A., DERRY, S., PELOSO, P. M., GAMMAITONI, A. R. & WANG, H. 2010b. Responder analysis for pain relief and numbers needed to treat in a meta-analysis of etoricoxib osteoarthritis trials: bridging a gap between clinical trials and clinical practice. Annals of Rheumatic Diseases, 69, 374-379.

MORGAN, D. L. 1988. Focus groups as qualitative research, London, Sage.

260

MORSE, J. M. 1991a. Approaches to qualitativequantitative methodological triangulation. Nursing Research, 40, 120-123.

MORSE, J. M. 1991b. Strategies for sampling. In: MORSE, J. M. (ed.) Qualitative Nursing Research: A Contemporary Dialouge. Newbury Park, California: Sage.

MORSE, J. M. 2000. Determining Sample Size. Qualitative Health Research, 10, 3-5.

MORSE, J. M. & NIEHAUS, L. 2009. Mixed-Methods design: Principles and procedures., Walnut Creek, CA, Left Coast Press.

MOULIN, D. E., CLARK, A. J., SPEECHLEY, M. & MORLEY-FORSTER, P. K. 2002. Chronic pain in Canada-prevalence, treatment, impact and the role of opioid analgesia. Pain Research and Management, 7, 179-184.

NATIONAL INSTITITE OF NEUROLOGICAL DISORDERS AND STROKE. 2012. NINDS Migraine information page [Online]. Bethesda: National Institutes of Health. Available: http://www.ninds.nih.gov/disorders/migraine/migraine.htm [Accessed 10 December 2012].

NATIONAL INSTITUES OF HEALTH. 2008. National Institutes of Health’s Research Portfolio Online Reporting Tool (RePORT) [Online]. Bethesda, MD: NIH. Available: http://www.report.nih.gov/nihdatabook/ [Accessed 10 December 2012 2012].

NDOSI, M., VINALL, K., HALE, C., BIRD, H. & HILL, J. 2011. The effectiveness of nurse-led care in people with rheumatoid arthritis: A systematic review. International Journal of Nursing, 48, 642-654.

NELSON, E. C., WASSON, J. H., JOHNSON, D. J. & HAYS, R. 1996. Dartmouth COOP functional health assessment charts: brief measures for clinical practice. In: SPILKER, B. (ed.) Quality of life and pharmacoeconomics in clinical trials. 2nd ed. Philadelphia, PA: Lippincott Raven.

NEVILLE, A., PELEG, R., SINGER, Y., SHERF, M. & SHVARTZMAN, P. 2008. Chronic pain: A population-based study. The Israel Medical Association Journal 10, 676-680.

NOBLIT, G. W. & HARE, R. D. 1988. Meta-Ethnography: Synthesizing Qualitative Studies, London, Sage.

NOYES, J. & POPAY, J. 2007. Directly observed therapy and tuberculosis: how can a systematic review of qualitative researchcontibute to improving services?A qualitative meta-synthesis. Journal of Advanced Nursing, 57, 227-243.

NÜESCH, E., REICHENBACH, S., TRELLE, S., RUTJES, A. W., LIEWALD, K., STERCHI, R., ALTMAN, D. G. & JÜNI, P. 2009. The importance of allocation concealment and patient blinding in osteoarthritis trials: a meta-epidemiologic study. Arthritis Care & Research, 16, 1633-1641.

O'CATHAIN, A., MURPHY, E. & NICHOLL, J. 2008. The quality of mixed methods studies in health services research. Journal of Health Services Research and Policy, 13, 92-98.

OPDENAKKER, R. 2006. Advantages and Disadvantages of Four Interview Techniques in Qualitative Research. Forum Qualitative Sozialforschung / Forum: Qualitative Social Research, 7, Art. 11.

ORTON, M., FITZPATRICK, R., FULLER, A., MANT, D., MLYNECK, C. & THOROGOOD, M. 1991. Factors affecting women's response to an invitation to attned for a second breast cancer screening examination. British Journal of General Practice, 41, 320-323.

OSBORN, M. & SMITH, A. 2008. The fearfulness of chronic pain and the centrality of the therapeutic relationship in containing it: an interpretative phenomenological analysis. Qualitative Research in Psychology, 5, 276-288.

PALEY, J. 1997. Husserl, phenomenology and nursing. Journal of Advanced Nursing, 26, 187-193.

261

PATEL, A. S., FARQUHARSON, R., DAWN CARROLL, D., MOORE, A., PHILLIPS, C. J., TAYLOR, R. S. & BARDEN, J. 2012. The Impact and Burden of Chronic Pain in the Workplace: A Qualitative Systematic Review. Pain Practice, 12, 578-589.

PATERSON, B. L., THORNE, S. E., CANAM, C. & JILLINGS, C. 2001. Meta-Study of Qualitative Health Research: A Practical Guide to Meta-Analysis and Meta-Synthesis, Thousand Oaks, CA, Sage Publications.

PATTON, M. Q. 1990. Qualitative evaluation and research methods, Newbury Park, CA, Sage.

PATTON, M. Q. 2002. Qualitative Evaluation and Research Methods, Thousand Oaks, CA, Sage.

PENDLETON, D., SCHOFIELD, T., TATE, P. & HAVELOCK, P. 1984. The Consultation: An Approach to Learning and Teaching, Oxford, Oxford University Press.

PENG, P., CHOINIERE, M., DION, D., INTRATER, H., LEFORT, S., LYNCH, M., ONG, M., RASHIQ, S., TKACHUK, G., VEILLETTE, Y. & STOPPAIN INVESTIGATORS GROUP 2007. Challenges in accessing multidisciplinary pain treatment facilities in Canada. Canadian Journal of Anesthesia, 54, 977-984.

PETKOVA, V. B. 2009. Education for arthritis patients: a community pharmacy based pilot project. Pharmacy Practice, 7, 88-93.

PHELAN, M., BLENKINSOPP, A., FOSTER, N. E., THOMAS, E. & HAY, E. M. 2008. Pharmacist-led medication review for knee pain in older adults: Content, process and outcomes. International Journal of Pharmacy Practice, 16 (6), 347-355.

PHILLIPS, C. J. 2009. The cost and burden of chronic pain. Reviews in Pain, 3, 1-5. PHILLIPS, D. C. & BURBULES, N. C. 2000. Postpositivism and educational

research, Lanham, MD, Rowman & Littlefield. PILDAL, J., HRÓBJARTSSON, A., JØRGENSEN, K. J., HILDEN, J., ALTMAN, D.

G. & GØTZSCHE, P. C. 2007. Impact of allocation concealment on conclusions drawn from meta-analyses of randomized trials. International Journal of Epidemiology, 36, 847-857.

POPAY, J. 1992. 'My health is alright, but I'm tired all the time': Women's experience of ill health. In: ROBERTS, H. (ed.) Women's Health Matters. London: Routledge.

POPE, C. & MAYS, N. 1995. Reaching the parts other methods can not reach: An introduction to qualitative methods in health and health serices research. British Medical Journal, 311, 42-45.

POPE, C., ZIEBLAND, S. & MAYS, N. 2000. Qualitative research in healthcare: Analysing qualitative data. British Medical Journal, 320, 114-116.

PORTEOUS, T., BOND, C. M., HANNAFORD, P. & SINCLAIR, H. 2005. How and why are non-prescription analgesics used in Scotland? Family Practice, 22, 78-85.

POSES, R. M. & ISEN, A. M. 1998. Quantitative research in medicine and healthcare: questions and controversy. Journal of General Internal Medicine, 13, 32-38.

PRICE, C., HOGGART, B., OLUKOGA, O., DE C WILLIAMS, A. & BOTTLE, A. 2012. National Pain Audit Final Report 2010-2012. London, UK: The Brisith Pain Society.

PROCHASKA, J. O. & DICLEMENTE, C. C. 1983. Stages and processes of self-change of smoking: toward an integrative model of change. Journal of Consulting and Clinical Psychology, 51, 390-395.

QUESSY, S. N. & ROWBOTHAM, M. C. 2008. Placebo resonse in neuropathic pain trials. Pain, 138, 479-483.

RABIN, R. & DE CHARRO, F. 2001. EQ-5D: a measure of health status from the EuroQol group. . Annals of Internal Medicine, 33, 337-343.

262

RADLOFF, L. S. 1977. The CES-D Scale: A Self-Report Depression Scale for Research in the General Population. Applied Psychological Measurement, 1, 385-401.

RAPOPORT, A. & AKBIK, H. 2004. Pharmacist-managed pain clinic at a Veterans Affairs medical center. American Journal of Health-System Pharmacy, 61 (13), 1341-1343.

RICCI, J. A., STEWART, W. F., CHEE, E., LEOTTA, C., FOLEY, K. & HOCHBERG, M. C. 2005. Pain exacerbation as a major source of lost productive time in US workers with arthritis. Arthritis and Rheumatology, 53, 673-681.

RICHARDSON, J. T. E. 2005. Instruments for obtaining student feedback: a review of the literature. . Assessment & Evaluation in Higher Education 30, 387-415.

RICHTER, P., WERNER, J., HEERLEIN, A., KRAUS, A. & SAUER, H. 1998. On the validity of the Beck Depression Inventory. A review. Psychopathology, 31, 160-168.

RITCHIE, J., LEWIS, J. & ELAM, G. 2003. Designing and selecting samples. In: RITCHIE, J. & LEWIS, J. (eds.) Qualitative Research Practice: A guide for Social Science Students and Researchers. London: Sage.

ROLAND, M. & MORRIS, R. 1983. A study of the natural history of back pain, part I: development of a reliable and sensitive measure of disability in low back pain. Spine, 8, 141-144.

ROTHMAN, K. J. 2002. Epidemiology: An Introduction, New York, Oxford University Press.

RYAN, S., HASSELL, A. B., LEWIS, M. & FARRELL, A. 2006. Impact of a rheumatology expert nurse on the wellbeing of patients attending a drug monitoring clinic. Journal of Advanced Nursing, 53, 277-286.

SACKETT, D. L., ROSENBERG, W. M. C., GRAY, J. A. M., HAYNES, R. B. & RICHARDSON, W. S. 1996. Evidence based medicine: what it is and what it isn't. British Medical Journal, 312, 71.

SAGHEER, M. A., KHAN, M. F. & SHARIF, S. 2013. Association between chronic low back pain, anxiety and depression in patients at a tertiary care centre. Journal of Pakistan Medical Association, 63, 688-690.

SANDELOWSKI, M. 1993. Rigor or rigor mortis: the problem of rigor in qualitative research revisited. Advances in Nursing Science, 16, 1-8.

SANDELOWSKI, M. 1995. Focus on qualitative methods: sample size in qualitative research. Research in Nursing & Health, 18, 179-183.

SANDELOWSKI, M. 2000. Whatever Happened to Qualitative Description? Research in Nursing & Health, 23, 334-340.

SANDELOWSKI, M. 2010. What's in a name? Qualitative description revisited. Research in Nursing & Health, 33, 77-84.

SCASCIGHINI, L., TOMA, V., DOBER-SPIELMANN, S. & SPROTT, H. 2008. Multidisciplinary treatment for chronic pain: a systematic review of interventions and outcomes. Rheumaology 47, 670-678.

SCHOFIELD, P., DAVIES, B. & HUTCHINSON, R. 1998. Evaluating the use of Snoezelen and chronic pain: the findings of an investigation into its use (Part II). Complementary Therapies in Nursing and Midwifery, 4, 137-143.

SEERS, K. & CRITELTON, N. 2001. Quantitative research: Designs relevant to nursing and healthcare. Nursing Times Research, 6, 487-500.

SERSIC, D. M. & VULETIC, G. 2006. Psychometric evaluation and establishing norms of Croatian SF-36 Health Survey: Framework for subjective health research, Croatian Medical Journal. 47 (1) (pp 95-102), 2006. Date of Publication: Feb 2006.

SHADISH, W. R., COOK, T. D. & CAMPBELL, D. T. 2002. Experimental and qusai-experimental designs for generalized causal inference, Boston, Houghton Mifflin

263

SIEDLIECKI, S. L. & GOOD, M. 2006. Effect of music on power, pain, depression and disability. Journal of Advanced Nursing, 54, 553-562.

SIEGEL, S. & CASTELLAN, N. J. 1988. Statistics for Behavioural Sciences, New York, McGraw-Hill.

SIMMONS, S. F., FERRELL, B. A. & SCHNELLE, J. F. 2002. Effects of a controlled exercise trail on pain in nursing home residents. The Clinical Journal of Pain, 18, 380-385.

SINDHU, F. 1996. Are non-pharmacological nursing interventions for the management of pain effective? A meta-analysis. Journal of Advanced Nursing, 24, 1152-1159.

SITZIA, J. 1999. How valid and reliable are patient satisfaction data? An analysis of 195 studies. International Journal for Quality in Health Care, 11, 319-28.

SLIFE, B. D. & WILLIAMS, R. N. 1995. What's behaind the research? Discovering hidden assumptions in the behavioral sciences, Thousand Oaks, CA, Sage.

SMITH, J. & FIRTH, J. 2011. Qualitative data analysis: the framework approach. Nurse Researcher, 18, 52-62.

SMITHA, B. H., PENNYB, K. I., PURVESA, A. M., MUNROB, C., WILSONB, B., GRIMSHAWD, J., CHAMBERSC, W. A. & SMITHB, W. C. 1997. The chronic pain grade questionnaire:validation adn reliability in postal research. Pain, 71, 141-147.

SØRENSEN, J. & FRICH, L. 2008. Home visits by specially trained nurses after discharge from multi-disciplinary pain care: a cost consequence analysis based on a randomised controlled trial. European Journal of Pain, 12, 164-171.

SPARDLEY, J. 1979. The Ethnographic interview, New York, Rinehart & Winston. SPITZER, R. L., KROENKE, K. & WILLIAMS, J. B. 1999. Validation and utility of a

self-report version of PRIME-MD: the PHQ primary care study. Primary Care Evaluation of Mental Disorders. Patient Health Questionnaire. Journal of American Medical Association, 282, 1737-1744.

STANNARD, C. & JOHNSON, M. 2003. Chronic pain management--can we do better? An interview-based survey in primary care. Current Medical Research & Opinion, 19, 703-6.

STEENSTRA, I. A., VERBEEK, J. H., HEYMANS, M. W. & BONGERS, P. M. 2005. Prognostic factors for duration of sick leave in patients sick listed with acute low back pain: a systematic review of the literature. Occupational & Environmental Medicine, 62, 851-60.

STEIN, M. B., COX, B. J., AFIFI, T. O., BELIK, S. L. & SAREEN, J. 2006. Does co-morbid depressive illness magnify the impact of chronic physical illness? A population-based perspective. Psychological Medicine, 36, 587-596.

STENNER, K. & COURTENAY, M. 2008. Benefits of nurse prescribing for patients in pain: nurses' views. Journal of Advanced Nursing, 63, 27-35.

STEWART, L., MOHER, D. & SHEKELLE, P. 2012. Why prospective registeration of systematic reviews make sense? Systematic Reviews, 1.

STRAUSS, A. 1987. Qualitative analysis for social scientists, New York, Cambridge University Press.

STRAUSS, A. & CORBIN, J. 1990. Basics of qualitative research: Grounded theory procedures and techniques, Newbury Park, CA, Sage.

SUH, E. S., BARTLETT, G., INGUANTI, M. & FOLSTAD, J. 2004. Evaluation of a pharmacist pain management education program and associated medication use in a palliative care population. American Journal of Health-System Pharmacy, 61, 277-280.

SULLIVAN-BOLYAI, S., BOVA, C. & HARPER, D. 2005. Developing and refining interventions in persons with health disparities: The use of Qualitative Description. Nursing Outlool, 53, 127-133.

264

TAI-SEALEA, M., BOLINB, J., BAO, X. & STREET, R. 2012. Management of chronic pain among older patients: Inside primary care in the US. European Journal of Pain, 15, 1087.e1–1087.e8

TAIT, R. C., POLLARD, C. A., MARGOLIS, R. B., DUCKRO, P. N. & KRAUSE, S. J. 1987. The Pain Disability Index: psychometric and validity data. Archives of Physical Medicine and Rehabilitation, 68, 438-41.

TASHAKKORI, A. & CRESWELL, J. W. 2007. Editorial: the new era of mixed methods. Journal of Mixed Methods Research, 1, 3-7.

TASHAKKORI, A. & TEDDLIE, C. 1998. Mixed Methodology: Combining Qualitative and Quantitative Approaches, Thousand Oaks, CA, Sage Publications.

TASKFORCE ON MEDICINES PARTNERSHIP AND THE NATIONAL COLLABORATIVE MEDICINES MANAGEMENT SERVICES PROGRAMME 2002. Room for review - A guide to medication review: the agenda for patients, practitioners and managers.

TEDDLIE, C. & TASHAKKORI, A. 2006. A general typology of research designs featuring mixed methods. Research in the Schools, 13, 12-28.

TESCH, R. 1990. Qualitative research: analysis types and software tools, Bristol, PA, Falmer Press.

THE ACCOUNTS COMMISSION FOR SCOTLAND 1999. Supporting Prescribing in General Practice. Edinburgh: Accounts Commission.

THE BRITISH PAIN SOCIETY. 2006. Frequently asked questions [FAQs] [Online]. London. Available: http://www.britishpainsociety.org/media_faq.htm [Accessed 5 May 2011].

THE MAYDAY FUND SPECIAL COMMITTEE ON PAIN AND THE PRACTICE OF MEDICINE 2009. A call to revolutionize chronic pain care in America: An opportunity in health care reform. Washington, DC: The Mayday Fund.

THE WHQOL GROUP. 1995. The World-Health-Organization quality of life assessment (WHQOL)—position paper from the World Health-Organization. Social Science and Medicine, 41, 1403-1409.

THOMAS, J. 1993. Doing critical ethnography, Newbury Par, CA, Sage. THOMAS, J., HARDEN, A., OAKLEY, A., OLIVER, S., SUTCLIFFE, K., REES, R.,

BRUNTON, G. & KAVANAGH, J. 2004. Integrating qualitative research with trials in systematic reviews. British Medical Journal, 328, 1010-1012.

THOMSEN, A. B., SØRENSEN, J., SJØGREN, P. & ERIKSEN, J. 2001. Economic evaluation of multidisciplinary pain management in chronic pain patients: a qualitative systematic review. Journal of Pain and Symptom Management, 22, 688-698.

THORNE, S., KIRKHAM, S. R. & MACDONALD-EMES, J. 1997. Interpretive description: A noncategorical qualitative alternative for developing nursing knowledge. Research in Nursing and Health, 20, 169-177.

TIDDLIE, C. & TASHAKKAORI, A. 2009. Foundations of Mixed Methods Research, Thousand Oaks, CA, Sage.

TIJHUIS, G. J., ZWINDERMAN, A. H., HAZES, J. M., VAN DEN HOUT, W. B., BREEDVELD, F. C. & T.P., V. V. 2002. A randomized comparison of care provided by a clinical nurse specialist, an inpatient team, and a day patient team in rheumatoid arthritis. Arthritis & Rheumatism, 47, 525-531.

TOLLISON, C. D., KRIEGEL, M. L. & DOWNIE, G. R. 1985. Chronic low back pain: Results of treatment at the pain therapy center. Southern Medical Journal, 78, 1291-1295.

TURK, D. C. 2002. Clinical effectiveness and cost effectiveness of treatments for patients with chronic pain. Clinical Journal of Pain, 18, 355-365.

TURK, D. C., DWORKIN, R. H., ALLEN, R. R., BELLAMY, N., BRANDENBURG, N., CARR, D. B., CLEELAND, C., DIONNE, R., FARRAR, J. T., GALER, B. S., HEWITT, D. J., JADAD, A. R., KATZ, N. P., KRAMER, L. D., MANNING, D. C., MCCORMICK, C. G., MCDERMOTT, M. P., MCGRATH, P., QUESSY, S., RAPPAPORT, B. A., ROBINSON, J. P., ROYAL, M. A.,

265

SIMON, L., STAUFFER, J. W., STEIN, W., TOLLETT, J. & WITTER, J. 2003. Core outcome domains for chronic pain clinical trials: IMMPACT recommendations. Pain, 106, 337 - 45.

TURK, D. C. & GATCHEL, R. J. (eds.) 2002. Psychological Approaches to Pain Management: A Practitioner’s Handbook, New York: Guilford.

TURK, D. C. & MELZACK, R. 2001. The measurement of pain and the assessment of people experiencing pain. In: TURK, D. C. & MELZACK, R. (eds.) Handbook of Pain Assessment. New York: Guilford Press.

TURK, D. C. & RUDY, T. E. 1988. Toward an emperically derived taxonomy of chronic pain patients: Integration of psychological assessment data. Journal of Consulting and Clinical Psychology, 56.

VAN HULLE, V. C. & GADDY, E. J. 2009. Pediatric nurses' thinking in response to vignettes on administering analgesic. Research in Nursing & Health, 32, 530-539.

VAN LEEUWEN, M. T., BLYTH, F. M., MARCH, L. M., NICHOLAS, M. K. & COUSINS, M. J. 2006. Chronic pain and reduced work effectiveness: the hidden cost to Australian employers. European Journal of Pain, 10, 161-166.

VAN MAANEN, J. 1988. Tales of the Field: On Writing Ethnography, Chicago, University of Chicago Press.

VAN MANEN, M. 1990. Researching lived experience: Human science for an action sensitive pedagogy., Ontario, Canada, The University of Western Ontario.

VAN TULDER, M., FURLAN, A., BOMBARDIER, C. & BOUTER, L. 2003. Updated method guidelines for systematic reviews in the Cochrane collaboration back review group. Spine, 28, 1290-1299.

VAN TULDER, M. W., B.W., K. & BOUTER, L. M. 1997. Conservative treatment of acute and chronic non-specific low back pain. A systematic review of randomized controlled trials of the most common interventions. Spine, 22, 2128-56.

VERHAAK, P. F. M., KERSSENS, J. J., DEKKER, J., SORBI, M. J. & BENSING, J. M. 1998. Prevalence of chronic benign pain disorder among adults: A review of the literature. Pain, 77, 231-239.

VETTER, T. R. 2007. A Primer on Health-Related Quality of Life in Chronic Pain Medicine. Anesthesia & Analgesia, 104, 703-718.

VICTOR, C. R., TRIGGS, E., ROSS, F., LORD, J. & AXFORD, J. S. 2005. Lack of benefit of a primary care-based nurse-led education programme for people with osteoarthritis of the knee. Clinical Rheumatology, 24, 358-364.

VON GUNTEN, C. F. & VON ROENN, J. H. 1994. Barriers to pain control: ethics and knowledge. Journal of Palliative Care, 10, 52-54.

VON KORFF, M., DWORKIN, S. F. & LE RESCHE, L. 1990. Graded chronic pain status: an epidemiologic evaluation. Pain, 40, 279-291.

VON KORFF, M., ORMEL, J., KEEFE, F. J. & DWORKIN, S. F. 1992. Grading the severity of chronic pain. Pain, 50, 133-149.

VON ROENN, J. H., CLEELAND, C. S., GONIN, R., HATFIELD, A. K. & PANDYA, K. J. 1993. Physician attitudes and practice in cancer pain management. A survey from the Eastern Cooperative Oncology Group. Annals of Internal Medicine, 119, 121-126.

WALKER, B. F., MULLER, R. & GRANT, W. D. 2003. Low back pain in Australian adults: the economic burden. Asia Pacific Journal of Public Health, 15, 79-87.

WALKER, J., HOLLOWAY, I. & SOFAER, B. 1999. In the system: the lived experience of chronic back pain from the perspectives of those seeking help from pain clinics. . Pain, 80, 621-628.

WARD, S. E., GOLDBERG, N., MILLER-MCCAULEY, V., MUELLER, C., NOLAN, A., PAWLIK-PLANK, D., ROBBINS, A., STORMOEN, D. & WEISSMAN, D.

266

E. 1993. Patient-related barriers to management of cancer pain. Pain, 52, 319-324.

WARE, J. E., KOSINSKI, M. & GANDEK, B. 2005. SF-36 Health Survey: Manual and interpertation guide. In: METRIC, Q. (ed.). Lincoln.

WARE, J. E. & SHERBOURNE, C. D. 1992. The MOS 36-item short-form health survey (SF-36). Conceptual framework and item selection. Medical Care, 30, 473-83.

WARE JR, J. E., KOSINSKI, M. & KELLER, S. D. 1996. A 12 Item Short Form Health Survey: Construction of scales and preliminary tests of reliability and validity. Medical Care, 34, 220-233.

WEITZEL, K. W., PRESLEY, D. N., SHOWALTER, M. L., SEYMOUR, S. & WADDELL, R. F. 2004. Pharmacist-managed headache clinic. American Journal of Health-System Pharmacy, 61, 2548-2550.

WELLS-FEDERMAN, C., ARNSTEIN, P. & CAUDILL, M. 2002. Nurse-led pain management program: Effect on self-efficacy, pain intensity, pain-related disability, and depressive symptoms in chronic pain patients. Pain Management Nursing, 3, 131-140.

WENSING, M., GROL, R. & SMITS, A. 1994. Quality judjement by patients on general practice care: A literature analysis. Social Science & Medicine, 38, 45-53.

WHITTEMORE, R., CHASE, S. K. & MANDLE, C. L. 2001. Valididty in qualitative research. Qualitative Health Research, 11, 522-537.

WIEDEMER, N. L., HARDEN, P. S., ARNDT, I. O. & GALLAGHER, R. M. 2007. The opioid renewal clinic: A primary care, managed approach to opioid therapy in chronic pain patients at risk for substance abuse. Pain Medicine, 8, 573-584.

WILLIAMS, B., COYLE, J. & HEALY, D. 1998. THE MEANING OF PATIENT SATISFACTION: AN

EXPLANATION OF HIGH REPORTED LEVELS. Social Science & Medicine, 47, 1351-1359.

WONG, W. S., CHEN, P. P., J, Y., K.H, M., TAM, B. K. & FIELDING, R. 2011. Chronic pain and psychiatric morbidity: a comparison between patients attending specialist orthopedics clinic and multidisciplinary pain clinic. Pain Medicine, 12, 246-259.

WOOD, L., EGGER, M., GLUUD, L. L., SCHULZ, K. F., JUNI, P., ALTMAN, D. G., GLUUD, C., WOOD, A. J. G. & STERNE, J. A. C. 2008. Empirical evidence of bias in treatment effect estimates in controlled trials with different interventions and outcomes: meta-epidemiological study. British Medical Journal, 336, 601-605.

WOOLF, A. D., ZEIDLER, H., HAGLUND, U., CARR, A. J., CHAUSSADE, S., CUCINOTTA, D., VEALE, D. J. & MARTIN-MOLA, E. 2004. Musculoskeletal pain in Europe: its impact and a comparison of population and medical perceptions of treatment in eight European countries. Annals of Rheumatic Diseases, 63, 342-347.

WORLD HEALTH ORGANIZATION 2001. International classification of functioning, disability and health. Geneva: World Health Organization.

WORZ, R. 2003. Pain in depression-depression in pain. Pain Clinical Updates (IASP), 1, 1-4.

XIAO, H. & BARBER, J. P. 2008. The effect of perceived health status on patient satisfaction. Value in Health, 11, 719-725.

YESAVAGE, J. A., BRINK, T., L, ROSE, T. L., LUM, O., HUANG, V., ADEY, M. & LEIRER, V. O. 1983. Development and validation of a geriatric depression rating scale: a preliminary report. Journal of Psychiatric Research, 17, 37-49.

267

YIN, R. K. 2009. Case Study Research: Design and Methods, Thousand Oaks, California, SAGE Publications, Inc.

ZIGMOND, A. S. & SNAITH, R. P. 1983. The Hospital Anxiety and Depression Scale. Acta Psychiatria Scandinavica, 42, 361-70.

ZODPEY, S. P. 2004. Sample size and power analysis in medical research. Indian Journal of Detmatology, Venereology and Leprology, 70, 123-128.

268

Appendices

Appendix I

Search strategy for Medline

269

Appendix II

Risk of bias assessment form for the systematic review

Item Low/High/

Unclear

risk

Justification

Random Allocation

Allocation Concealment

Blinding of Participants

Blinding of Personnel

(delivering intervention)

Blinding of outcome

assessor

Incomplete outcome data

Selective reporting of

outcomes

Baseline differences

Use of Invalid

questionnaires

Notes:

270

Appendix III

Letter of invitation to participate in the study

Dear Sir/Madam,

Invitation to participate in a research study entitled “Evaluation of

Nurse-Pharmacist managed pain clinic”

I am a PhD student at the School of Healthcare, University of Leeds. I am

conducting research looking at the effectiveness of the nurse-pharmacist led

pain clinic. As part of this research we want to find out how well the pain

clinic works for the patients in terms of pain management and relief. In

particular, we would like your views on the care provided by the clinic. You

are receiving this letter because you have been referred to the pain clinic.

However, please note that I have not been given access to any personal

information about you to maintain confidentiality.

The enclosed information sheet gives further details of the research and will

hopefully answer any questions you have. However, please feel free to

contact me by phone (0113 3433202) or email ([email protected]), if you

would like to know more about the project.

Thank you for taking the time to read this letter.

Yours sincerely,

Muhammad Hadi

271

Appendix IV

Invitation to take part in a follow-up assessment

Dear Sir/Madam,

Thank you very much for taking part in our study of the Nurse-Pharmacist

managed pain clinic. You are receiving this letter because it has been three

months since you were discharged from the clinic and we would like to know

how you are coping with your pain now.

I would be grateful if you could complete the accompanying questionnaires

and return by post in the enclosed pre-paid envelope. The questionnaires

are the same as the ones you filled in on your first and last visit to the clinic.

The “yellow questionnaire” is about pain intensity and the “blue

questionnaire” is about mood. If possible, please could you return the

questionnaires within one week of receiving them.

Should you have any questions, please feel free to contact me by phone

(0113 343 3202) or email ([email protected]). On the behalf of the

research team, I would like to sincerely thank you once again for your

continued support and participation in our research project.

Yours sincerely,

Muhammad A. Hadi

272

Appendix V

GP information Sheet

Dear Dr.

THE EVALUATION OF A NURSE/PHARMACIST MANAGED PAIN CLINIC: A

MIXED METHODS STUDY

Your patient ........................................................................., has given their consent

to be entered into this study. Your patient would not be given any new medicinal

product or treatment as part of this research. The patient will receive usual care

from the pain clinic. The aim of the present study is to evaluate the effectiveness of

Nurse-Pharmacist managed pain clinic (NPMPC). It is an observational study. Upon

discharge, patients will be interviewed about their satisfaction with the service

provided by the clinic.

The research study will take place entirely at the pain clinic and should have no

ongoing consequences for you. The study is being sponsored and organized by

School of Healthcare, Faculty of Medicine and Health, University of Leeds. Should

you have any questions, please do not hesitate to contact the undersigned.

Yours sincerely,

Muhammad A. Hadi,

School of Healthcare,

University of Leeds.

Email: [email protected]

Tel: 0113-343-3202

273

Appendix VI

Patient information sheet

Evaluation of Nurse-Pharmacist Managed Pain Clinic

We would like to invite you to take part in a research study. Before you

decide, you need to understand the purpose of research and what it would

involve for you. Please take time to read the following information carefully. If

you wish, you can discuss it with your friends and family. Should you need

any further information, please feel free to contact us.

1. What is the purpose of the study?

The study will evaluate the effectiveness of nurse-pharmacist led pain clinic.

We want to find out how well the pain clinic works for the patients. In

particular, we would like your views on the care provided by the clinic. No

new treatment will be given specifically as part of this study, but we will

collect information from people receiving care at the clinic.

2. Who is doing the study?

The study is funded and organized by School of Healthcare, University of

Leeds. The lead researcher is Muhammad Hadi, a PhD student at the

School of Healthcare, under the supervision of Dr. Michelle Briggs, Prof.

José Closs and Dr. David Alldred.

3. Why have I been invited?

You have been approached because your General practitioner (GP) has

referred you to the pain clinic. We aim to include 105 adult patients who

have chronic pain and have been referred to the clinic.

4. Do I have to take part?

It is totally up to you to decide. We will provide you with all the necessary

information and answer all your questions related to this study. We will then

ask you to sign a consent form to show that you have agreed to take part.

274

You can withdraw from the study at any time without giving a reason. This

would not affect the care you receive.

5. What will happen to me if I take part?

You will receive the usual care from the clinic. There are two phases of the

study. Participation in both phases is not compulsory and you can choose to

participate only in one phase of the study if you wish.

Phase 1: In the first phase, in addition to the routine questionnaires used at

the clinic, you will be asked to fill in two questionnaires. One questionnaire is

about your quality of life and the other is about severity of chronic pain.

These questionnaires will take about 15-20 minutes to complete. You will be

asked to fill in these questionnaires three times; 1) during your first visit; 2)

upon your discharge from the clinic; 3) three months after discharge. For the

first two times you will be asked to fill in the questionnaires at the clinic while

waiting for your appointment. For the third time, we will send you the

questionnaires by mail together with a pre-paid self addressed envelope. We

would like you to return the questionnaires within two weeks. We will also

gather information on your age, gender, employment, history of pain, other

illnesses, your mood and the intensity and impact of pain on your life, from

your clinical record.

Phase 2: The second phase consists of a face to face interview. This will be

conducted either at the clinic or your home, whichever you prefer. We would

like to interview you within two weeks of your discharge from the clinic. The

interview will be about your experience and satisfaction with the care

provided by the clinic. We will send you the questions to be asked in the

interview in advance, so that you can think about them. There are no right or

wrong answers; we just want to hear about your experience of the pain

clinic. The interview is expected to last for 20-30 minutes and if you agree, it

will be audio taped. You will be asked to sign a separate consent form for

the interview. You can choose to stop the interview at any time without

giving any reason. We will still include the information you have already

given us, unless you ask us not to. Your decision to participate in the

interview will not affect the care you receive.

275

6. Will I be paid to participate in the study?

You will not be paid for taking part in the research.

7. What will I have to do?

You just fill in the additional questionnaires, as explained above.

8. What is the drug, device or procedure that is being tested?

No drug or device is being in particular tested in this research. You will

receive usual care from the clinic.

9. What are the possible disadvantages and risks of taking part?

There are no risks specifically associated with participation in the study. You

don’t have to visit the clinic or have any tests. The only possible

disadvantage is the time taken to complete the questionnaires and interview

(optional).

10. What are the potential benefits of taking part?

We cannot promise the study will help you but the information we get from

this study should help improve the care provided by the clinic for other

people with chronic pain. It will help us understand the working of the clinic

and patient satisfaction with the care provided by the clinic.

11. What happens when the research stops?

You will continue to receive usual care from your GP. You can be referred

back to the clinic if desired by your GP.

12. Will my personal data collected during the study be kept

confidential?

Yes. We will follow ethical and legal practice and all information about you

will be handled in confidence. All data obtained will be anonymised and kept

in a password protected personal computer. Only the research staff will have

access to your data. However, if you tell us something that gives us cause of

concern about your health or care, with your permission, we will share this

information with relevant healthcare professionals. Your identity will not be

revealed in any report and publication. Your GP will be informed about your

participation in the research.

276

13. What will happen to the results of the study?

This project is a key part of the researcher’s PhD thesis. We will be happy to

share the information about the findings when it is completed in 2013.

Findings from the study will be presented at conferences and submitted to

relevant journals. Your identity will not be revealed in any publication.

14. What if there is a problem?

If you have any complaints or concerns about the study you can speak to

your nurse/researcher who will do their best to answer your questions.

Should you have a complaint about the way it is being conducted, please

contact his supervisor Dr. Michelle Briggs (Tel: 0113 343 6885; email:

[email protected]) or the Faculty Head of Research Support Ms. Clare

Skinner (Tel: 0113 343 4897; email: [email protected]). You can

withdraw from the study at any time without giving a reason.

15. Contact for further information

If you require further information, please feel free to ask any questions you

wish.

Investigator: Clinical Nurse Specialist:

Muhammad A. Hadi Kathryn Marczewski

PhD student Clinical Nurse Specialist

School of Healthcare, Leeds Community Healthcare

Baines Wing, University of Leeds NHS Trust

LS2 9UT Leeds, UK Tel: 0113 392 9819

Tel: 0113 343 3202 Email: [email protected]

Email: [email protected]

Thank you for your time for reading this information

Please keep this copy.

277

Appendix VII

Patient information sheet - phase 2

Evaluation of Nurse-Pharmacist Managed Pain Clinic

Thank you very much for your participation in Phase 1 of the study. We

would like to invite you to take part in the Phase 2 of the study. Before you

decide, you need to understand the purpose of research and what it would

involve for you. Please take time to read the following information carefully. If

you wish, you can discuss it with your friends and family. Should you need

any further information, please feel free to contact us. Thank you for taking

the time to read this.

1. What is the purpose of the study?

The purpose of phase 2 is to evaluate patient satisfaction with the service

provided by the pain clinic.

2. Who is doing the study?

The research team is the same as of Phase 1. The lead researcher is

Muhammad Hadi, a PhD student at the School of Healthcare, under the

supervision of Dr. Michelle Briggs, Prof. José Closs and Dr. David Alldred.

3. Why have I been invited?

You have been approached because you indicated earlier in your consent

form that you were interested in participating in an interview as well. We aim

to include 15-25 adult chronic pain patients referred to the clinic.

4. Do I have to take part?

It is totally up to you to decide. We will provide you with all the necessary

information and answer any questions you may have about this study. We

will then ask you to sign a consent form to show that you have agreed to

take part.

278

5. What will happen to me if I take part?

You will be asked to participate in a face-to-face interview. This will take

about 30-40 minutes. The interview can take place at the pain clinic or at

your home, whichever you prefer. We would like to interview you within two

weeks of your discharge from the clinic and you will be contacted by

telephone to arrange a time and venue. You will be interviewed by Mr.

Muhammad Hadi (lead researcher, PhD student) who will audio-record the

conversation. You will be asked to sign a separate consent form for the

interview. Your decision to participate in the interview will neither affect the

standard of care nor the participation in the research

6. Will I be paid to participate in the study?

You will not be paid any money for participation in the research.

7. What will I have to do?

You will be asked to participate in the interview as explained above. You will

be asked about your expectations of the pain clinic; 2) things that you liked

and disliked in the clinic; 3) satisfaction with the service provided; 4) impact

(positive or negative) of the clinic on your pain. At the end of the interview,

there will be additional time to discuss any other aspects of the clinic, if they

have not been covered during the interview.

8. What is the drug, device or procedure that is being tested?

No drug or device is being tested in this research. You will receive usual

care from the clinic.

9. What are the possible disadvantages and risks of taking part?

There are no risks specifically associated with participation in the study. The

only disadvantage is that it will take 30-40 minutes of your time and you may

have to travel to the clinic, should you decide to be interviewed there.

279

10. What are the potential benefits of taking part?

We cannot promise the study will help you, but we hope that the information

we get from this study will help improve the service provided by the pain

clinic for future patients. It will help us understand the working of the clinic

from the patient’s point of view.

11. What happens when the research stops?

You will continue to receive usual care from your GP. You can be referred

back to the clinic if desired by your GP.

12. Will my personal data collected during the study be kept

confidential?

Yes. We will follow ethical and legal practice and all information about you

will be handled in confidence. The interview will be audio recorded and then

transcribed onto a computer. All data obtained will be anonymised and kept

in a password protected computer. Your response will be treated with full

confidentiality and anyone who takes part in the research will be identified

only by code numbers. Only the research staff will have access to your data.

However, if you tell us something that gives us cause of concern about your

health or care, with your permission, we will share this information with

relevant healthcare professionals. Your identity will not be revealed in any

report or publication. Your GP will be informed about your participation in the

research. If the interview upsets you and you feel you would like some

additional help after the interview I will be able to advise you who to contact,

for example GP, or Community Nurse, You can choose to stop the interview

at any time without giving any reason. We will still include the part of the

interview you have already completed, unless you ask us not to.

13. What will happen to the results of the study?

This project is a key part of the researcher’s PhD thesis, which will be

published by the end of 2013. We will be happy to share the information

about the findings when it is completed. Findings from the study will be

presented at conferences and submitted to relevant journals. Your identity

will not be revealed in any materials made public from the study.

280

14. Who has reviewed this study?

The study has been reviewed and approved by Leeds Research Ethics

Committee.

15. What if there is a problem?

If you have any complaints or concerns about the study you can speak to

your clinical nurse specialist or the lead researcher who will do their best to

answer your questions. Should you have a complaint about the way it is

being conducted, please contact his supervisor Dr. Michelle Briggs (Tel:

0113 343 6885; email: [email protected]) or the Faculty Head of

Research Support Ms. Clare Skinner (Tel: 0113 343 4897; email:

[email protected]). You can withdraw from the study at any time

without giving a reason.

Contact for further information

If you require further information, please feel free to contact the following

people.

Lead researcher Clinical nurse specialist

Muhammad A. Hadi Kathryn Marczewski

PhD student Clinical Nurse Specialist

School of Healthcare, Leeds community Healthcare

Baines wing, University of Leeds NHS Trust

LS2 9UT Leeds, UK Tel: 0113 3929819

Tel: 0113 3433202 Email:[email protected]

Email: [email protected]

Thank you for your time for reading this information

Please keep this copy.

281

Appendix VIII

Patient Consent Form - Phase 1

Project title: Evaluation of Nurse-Pharmacist managed pain clinic

Research Team: Muhammad Hadi, Dr. Michelle Briggs, Prof. Jose Closs,

Dr. David Alldred, Kathryn Marczewski

Note: Please read each statement carefully and initial each statement in the

box provided

1. I confirm that I have read and understood the information sheet.

2. I understand that my participation is voluntary and that I

am free to withdraw at any time, without giving any

reason. In this case my medical care or legal rights will

not be affected in any way.

3. I give permission for my GP to be informed of my

participation in the study.

4. I agree to take part in the above study.

5. I give permission to regulatory authorities to access the

research data for auditing purposes.

6. I would like to be considered for interview as well.

_________________ ___________

Name of patient Date Signature

_________________ ___________

Researcher Date Signature

282

Appendix IX

Patient Consent Form - Phase 2

Project title: Evaluation of Nurse-Pharmacist managed pain clinic

Research Team: Muhammad Hadi, Dr. Michelle Briggs, Prof. Jose Closs,

Dr. David Alldred, Kathryn Marczewski

Note: Please read each statement carefully and initial each statement in the

box provided

1. I confirm that I have read and understood the information sheet.

2. I understand that my participation is voluntary and that I

am free to withdraw at any time, without giving any

reason. In this case my medical care or legal rights will

not be affected in any way.

3. I agree to take part in the interview.

4. I give permission to use anonymised quotes from my

interviews in relevant publications, and I understand

that my identity will not be revealed and such

information will not be traced back to me.

5. I give permission to regulatory authorities to access the

research data for auditing purposes.

6. I give permission to audiotape my interview.

_________________ ___________ _______________

Name of patient Date Signature

_________________ ___________ _______________

Researcher Date Signature

283

Appendix X

Patient sociodemographic and clinical questionnaire

284

Appendix XI

Clinical data collection form (Baseline)

285

Appendix XII

Clinical data collection form (Discharge)

286

Appendix XIII

Ethical approval

287

288

289

APPENDIX XIV

NHS research governance approval

290

291

Appendix XV

Letter of access for research

292

293

Appendix XVI

NHS ethics approval - substantial amendment

294

295

Appendix XVII

Brief Pain Inventory (BPI)

296

297

Appendix XVIII

Hospital Anxiety and Depression Scale (HADS)

298

Appendix XIX

SF-36

299

300

301

302

303

304

Appendix XX

Chronic Pain Grade Questionnaire (CPG)

305

Appendix XXI

Topic guide for qualitative interviews

Expectations

What were your expectations from the pain clinic?

Have these changed now?

Has the care provided by NPMPC met your expectations? Disappointed?

Expectations of prognosis

Is this different from before?

Efficacy

Did it help?

What was the most helpful part?

How did it help?

Did they help you to manage problems with your pain medication?

Understanding and Self-management

Did it help you to understand your problem?

Was the information provided adequate?

Do you feel you have control over problem?

Do you think you can now manage your problem better on your own?

Interaction with Nurse and Pharmacist

Did they communicate well? Listened to your problem?

Did they encourage you to be active and self manage?

Did they give you enough time?

Have you had any problems in following their instructions?

Could they have done any better?

Anything particularly good or bad about the service?

Do you agree with their pain management approach?

306

Overall Satisfaction

Any other issues?

How do you think care could have been improved?

How do you compare it with other treatments?

Note: In the beginning of each interview, patients were also asked about

their history of chronic pain, its impact on their lives and their experiences of

dealing with various healthcare professionals in relation with its

management.


Recommended