1 Mixed-mode cohesive-zone models for fracture of an adhesively- bonded polymer-matrix composite S. Li 1 , M. D. Thouless 1,2 , A. M. Waas 3 , J. A. Schroeder 4 , and P. D. Zavattieri 4 1 Department of Mechanical Engineering 2 Department of Materials Science & Engineering 3 Department of Aerospace Engineering University of Michigan, Ann Arbor, MI 48109 4 General Motors Research and Development Warren, MI 48090 Abstract As a direct extension of previous mode-I work on the adhesion of composite joints, this paper uses a cohesive-zone approach to model the mixed- mode fracture of adhesive joints made from a polymer-matrix composite. Mode- II cohesive-zone parameters were obtained using sandwich end-notch flexure specimens. These parameters were used directly with the previously- determined mode-I parameters to predict the fracture and deformation of mixed- mode geometries. It was shown that numerical simulations provided quantitative predictions for these geometries, including predictions for both the strengths of the joints and for the failure mechanisms. In conjunction with the earlier work, these results demonstrate the use of cohesive-zone approaches for the design of adhesively-bonded composite joints, and indicate approaches for determining the relevant material properties to describe mixed-mode fracture. (June 2005) Keywords: cohesive zone, mixed-mode fracture, composite, adhesive, failure mechanism
Transcript
1
Mixed-mode cohesive-zone models for fracture of an adhesively-
bonded polymer-matrix composite
S. Li1, M. D. Thouless1,2, A. M. Waas3, J. A. Schroeder4, and P. D. Zavattieri4
1Department of Mechanical Engineering2Department of Materials Science & Engineering
3Department of Aerospace EngineeringUniversity of Michigan, Ann Arbor, MI 48109
4General Motors Research and DevelopmentWarren, MI 48090
Abstract
As a direct extension of previous mode-I work on the adhesion of
composite joints, this paper uses a cohesive-zone approach to model the mixed-
mode fracture of adhesive joints made from a polymer-matrix composite. Mode-
II cohesive-zone parameters were obtained using sandwich end-notch flexure
specimens. These parameters were used directly with the previously-
determined mode-I parameters to predict the fracture and deformation of mixed-
mode geometries. It was shown that numerical simulations provided
quantitative predictions for these geometries, including predictions for both the
strengths of the joints and for the failure mechanisms. In conjunction with the
earlier work, these results demonstrate the use of cohesive-zone approaches for
the design of adhesively-bonded composite joints, and indicate approaches for
determining the relevant material properties to describe mixed-mode fracture.
Adhesive bonding technology is used in a variety of industries including
the automotive, aerospace and semiconductor industries. However, design
approaches for predicting the fracture of adhesively-bonded materials are still
somewhat empirical, and improving these approaches is a critical issue for
furthering the engineering applications of this technology. The most common
approach for analyzing the fracture of adhesive joints is the use of interfacial
fracture mechanics, which uses an energy parameter (toughness) as the failure
criterion. In principle, it is possible to characterize the toughness of an interface
as a function of the relative amounts of normal and shear deformation acting at
the crack tip. Provided the interface in an adhesive joint contains a well-defined
crack, and the deformation of the system is dominated by linear elastic
deformation of the adherends, it is possible to use mixed-mode fracture
mechanics to calculate the strength of the joint under different loading conditions
[Hutchinson and Suo, 1992]. However, this energy-based approach relies on the
existence of a crack in the interface, and on assumptions of small-scale bridging
and linear-elasticity. If any of these conditions are violated, an alternative
approach such as cohesive-zone modeling is required [Needleman, 1987;
Ungsuwarungsri and Knauss, 1987; Tvergaard and Hutchinson, 1992].
Previous papers [Sørensen, 2002; Sørensen and Jacobsen, 2003; Li et al.,
2005b] have shown that cohesive-zone models can provide quantitatively
predictive analyses for the mode-I fracture of adhesively-bonded composite
joints. An important concept of the cohesive-zone approach is that both strength
and energy parameters are used to characterize the debonding process along the
3
fracture plane, allowing the approach to be of much more general utility than
conventional interfacial fracture mechanics. The present paper extends the
earlier work of Li et al. [2005b] on mode-I fracture by focusing on determining
the mode-II cohesive parameters for an adhesively-bonded composite system.
These parameters are then used in conjunction with the mode-I parameters to
verify the predictive capabilities of the cohesive-zone approach for mixed-mode
geometries.
2. Specimen preparation and characterization of the materials
The composite used for the adherends in this study was the
polypropylene matrix with randomly-oriented glass fibers that has been
described in an earlier paper [Li et al., 2005a].1 The volume fraction of the fibers
was about 19%. The as-received material was remolded using a hydraulic press
at 70 ºC and 13 MPa for about 1.5 minutes. Details of the constitutive properties
of the composite, and how they were obtained, have been described elsewhere
[Li et al., 2005a]. While there was considerable variability in the mechanical
properties, the composite could be approximated as being transversely isotropic
and elastic / perfectly-plastic in plane, with an in-plane tensile modulus of
E = 6.0 ± 1.5 GPa, an in-plane Poisson’s ratio of 0.30 ± 0.03, and an in-plane shear
yield strength of 65 ± 15 MPa. Additionally, the out-of-plane tensile modulus
was 4 ± 1GPa, while the out-of-plane shear modulus was 0.5 ± 0.1 GPa
[Sun, 2004].
1 Azdel R401 provided by Azdel, Inc.
4
The adhesive used to bond the coupons was the same experimental, two-
part material used in the prior mode-I studies [Li et al., 2005b].2 This adhesive
cured at room temperature, and was specially formulated to bond low-surface-
energy materials such as polypropylene. Before bonding, the composite surfaces
were wiped clean to remove any dirt or debris (no mold-release agent had been
used when forming the composite coupons). During bonding, the adhesive layer
was kept at a uniform thickness of 0.6 ~ 0.8 mm by using glass beads as spacers.
Where required, a strip of Teflon tape was inserted into one of the
adhesive/composite interfaces before applying the adhesive, so as to define the
limits of the adhesive.
Preliminary mode-II fracture tests with the bonded composites showed
that it was extremely difficult to obtain stable interfacial crack propagation, as
the composite arms tended to fail after only limited amounts of crack growth
(Fig. 1). Therefore, metal arms were bonded to the composite forming sandwich
specimens which were used to determine the mode-II cohesive parameters. This
had two beneficial effects arising from the relatively high stiffness and strength
of the metal compared to the composite. First, extensive interfacial crack
propagation could be obtained before the composite failed. Second, the effects of
the variability in the modulus of the composite were suppressed because the
stiffness of the bonded structures was dominated by the metal. The particular
metals chosen in this study were a cold-rolled steel and an aluminum 5754 alloy.
Since it was crucial to know the constitutive properties of the metal arms
accurately when analyzing the sandwich specimen, stress-strain curves for the
2 Provided by Dow Chemical Company.
5
steel and aluminum were obtained from standard uniaxial tensile tests. These
curves are shown in Fig 2a and Fig. 2b, respectively, and the constitutive
properties of both the steel and the aluminum were incorporated into the
subsequent numerical calculations directly as point-to-point representations of
these data. Both metals were modeled as being isotropic, with a von Mises yield
criterion for the onset of yield.
3. Mixed-mode cohesive-zone models
To characterize the fracture behavior of the mixed-mode geometries, a
mode-dependent cohesive-zone model was developed. The cohesive-zone
model was implemented in ABAQUS through user-defined elements and
associated sub-routines. Following the mixed-mode model of Yang and
Thouless (2001), the entire adhesive layer was replaced by user-defined,
cohesive-zone elements, and it was assumed that opening and shear traction-
separation laws were totally unrelated, except being coupled through a simple
failure criterion of the form
€
G1 /ΓI +G II /ΓII =1. (1)
Here ΓI and ΓII (the mode-I and mode-II toughness) represent the total areas
under the traction-separation curve for each mode, and the mode-I and mode-II
energy-release rates are given by
€
G I = σ δn( )d0
δ nc
∫ δn ;
€
G II = τ δt( )d0
δ tc
∫ δt (2)
where δn and δt are the normal and shear displacements, σ and τ are the normal
and shear tractions, and δnc and δ tc are the critical normal and shear
displacements. The numerical calculations proceeded by computing Eqns. (2) for
6
both modes until the failure condition of Eqn. (1) was met and the crack
advanced; at this point the element was considered to be no longer capable of
bearing a load, and the tractions acting on the element were set to zero. Mesh
sensitivity analyses were conducted to ensure that any numerical effects on the
results were less significant than effects from other sources of uncertainty, such
as the variability of experimental results. The lengths of the cohesive-elements
were at least 25 times smaller than the adherend thickness, h, and at least five
times smaller than δnc and δtc. Additional details of the numerical techniques are
provided in the accompanying Ph.D. thesis [Li, 2004].
Descriptions of the mode-I fracture properties of the adhesive interface,
and how they were obtained, have been previously described in Li et al. [2005b].
In that reference it was shown that the phenomenon of fiber pull-out during
mode-I fracture resulted in a clear distinction between what was termed the
characteristic strength and the cohesive strength of the interface. The cohesive
strength of the interface was identified as the maximum stress that the interface
could support, while the characteristic strength was identified as the value of the
strength that, in conjunction with the toughness, controlled crack propagation.
(Alternatively, the characteristic strength can be thought of as the parameter that
in conjunction with the value of the critical opening displacement of the cohesive
zone establishes the toughness, or an average strength.) The need to distinguish
between the two strength values was equivalent to a recognition that there are
some circumstances under which the shape of the cohesive law has an influence
on the fracture of an interface. The three-parameter mode-I traction-separation
law that was obtained in Li et al. [2005b] to describe the fracture of the adhesive
7
interface used in the present study is shown in Fig. 3a. This traction-separation
law represents interfacial cracking followed by fiber pull-out, and the three
important parameters that describe the law are the cohesive strength of the
interface,
€
ˆ σ io =24 ± 3 MPa, the characteristic strength of the interface,
€
ˆ σ i = 5.0 ± 1.5 MPa, and the toughness, ΓIi = 7.3 ± 1.8 kJm-2. This mode-I law was
used without any further modification in the present work.
In contrast to the mode-I behavior, preliminary mode-II tests indicated
that few fibers were pulled out during mode-II fracture. Therefore, a simple
trapezoidal traction-separation law of the form shown in Fig. 3b, in which the
characteristic strength and cohesive strength are essentially identical, was chosen
to simulate elastic/plastic behavior of the adhesive for the mode-II debonding
process (Kafkalidis et al., 2000). The initial slope of the traction-separation law
was chosen to mimic the shear stiffness of the adhesive layer, and the unloading
slope was selected for computational ease, since experience has shown that the
precise details of this slope are generally not very significant. Since, under some
loading configurations, the cohesive elements can experience negative
displacements, linear-elastic behavior was assumed in the compressive regime
for the normal loading mode, and a trapezoidal law mirroring the response for
positive displacements was assumed for negative displacements in the shear
loading mode (Fig. 3).
8
4. Determination of the mode-II interfacial cohesive parameters
4.1 Interfacial shear tests
To investigate the shear strength of the interface, specimens of the form
shown in Fig. 4 were fabricated. Two coupons of the composite were bonded
together using the experimental adhesive. Since the shear properties of the
adhesive layer were expected to be sensitive to the bond-line thickness [Chai,
1993], glass spheres were used as spacers to ensure that the bond-line thickness
was always maintained at a constant value of 0.7 ± 0.1 mm in all specimens. The
interface between the adherends was then machined to leave a short ligament of
about 5.5 mm between the two coupons. A shear load was applied, as shown in
Fig. 4, by means of a screw-driven testing machine at a displacement rate of
0.4 mm/minute. The average strength, defined as the maximum applied load
divided by the bonded area, was determined to be 13 ± 3 MPa. A numerical
stress analysis using ABAQUS 6.3 with continuum elements representing the
constitutive properties of the adhesive [Li et al., 2005b] confirmed that the
distribution of the shear stress across the adhesive layer was approximately
uniform, so that the average shear strength measured in this fashion is expected
to be reasonably representative of the cohesive shear strength.
4.2 Sandwich end-notched flexure tests
An example of a mode-II geometry is the three-point-bending end-
notched-flexure (ENF) specimen. In this geometry, the deformation at the crack-
tip is dominated by shear, with a limited amount of compressive normal stresses.
Thus, the geometry provides an excellent configuration to study pure mode-II
fracture behavior [Barret and Foschi, 1977; Chiang and Chai, 1994, Yang et al.,
9
2001). Sandwich end-notched flexure (SENF) specimens with the geometry
shown in Fig. 5 were fabricated by cutting coupons of the composite and steel,
and then bonding them with the adhesive, maintaining the bond-line thickness at
0.7 ± 0.1 mm. To facilitate experimental observations, straight lines were cut
vertically across the bond-lines using a sharp razor. During the test, the
specimen rested on two steel cylinders. A similar cylinder was used to load the
specimen at its mid-point. To reduce possible frictional effects along the cracked
surfaces, a steel wire with a diameter of about 0.8 mm was inserted as a spacer
between the arms of the adherends at the crack mouth. The specimens were
tested under displacement control with a cross-head velocity of 0.6 mm/minute
under ambient conditions. A high-resolution CCD camera was used to correlate
the mid-point displacement to the cross-head displacement, as well as to monitor
crack propagation.
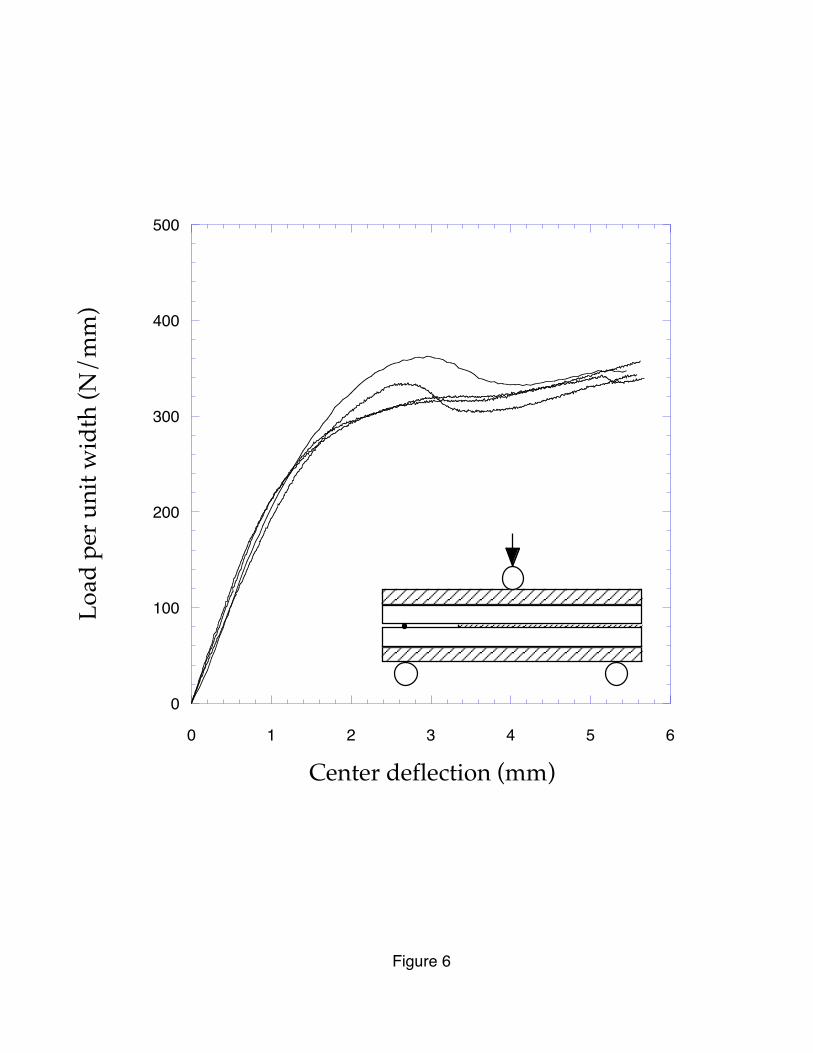
Figure 6 shows examples of the relationship between the applied load and
the deflection of the mid-point of the beam. Although there appears to be two
different types of behaviors (monotonically increasing curves and curves with a
primary maximum), no correlation with details of the geometry of the specimens
was noted. Optical micrographs of the side of the specimens are shown in Fig. 7.
Although the precise location of crack tip is difficult to identify from these views,
the extent of shear along the interface can be seen. Examination of the crack
surfaces after fracture indicated that crack growth was purely interfacial, and
that relatively few fibers were pulled out during fracture; this was consistent
with the preliminary tests mentioned earlier.
10
4.4 Numerical simulations
To extract the mode-II cohesive properties of the interface, the finite-
element code ABAQUS (version 6.3) was used to perform a cohesive-zone
analyses of the sandwich geometry. The calculations were conducted allowing
non-linear displacements of the adherends. The adherends were modeled by a
continuum finite-element model of the SENF geometry, using the appropriate
constitutive properties for the steel and the composite, as described earlier. To
prevent interpenetration at the crack mouth, surfaced-based contact elements
were used to simulate the interaction between the steel spacer and the two arms.
The adhesive layer between the metal arms and the composite was modeled
using continuum elements with the adhesive constitutive properties [Li et al.,
2005b]. The adhesive layer bonding the composite layers together was replaced
by four-noded mixed-mode cohesive-zone elements [Li, 2004] with an initial
thickness of 0.7 mm. As discussed earlier, the mode-II interfacial fracture was
characterized by a simple trapezoidal traction-separation law of the form shown
in Fig. 3b, with an initially unknown shear strength and mode-II toughness. The
mode-I parameters previously obtained for the adhesive (Fig. 3a) were used
without any further modification. 3 The mode-I and mode-II traction-separation
laws were coupled through the failure condition of Eqn. 1.
The two unknown mode-II parameters were obtained by a parametric
study that compared the results from numerical calculations for the load-
displacement curves with the experimental results of Fig. 6. It was observed
from the numerical calculations that the final rising part of the curves is
11
dominated by the mode-II toughness. Therefore, the mode-II toughness could be
obtained by matching the numerical predictions and the experimental results in
this region. This comparison indicated that ΓΙΙi = 11.5 ± 1.5 kJm-2. Once the
toughness had been determined, the corresponding shear strength was found by
adjusting the maximum stress in the traction-separation law, while keeping the
toughness fixed, until the full load-displacement curve could be fitted to the
experimental data. This analysis resulted in a value of
€
ˆ τ i = 12 ± 1.5 MPa, which
is in excellent agreement with the average shear strength obtained from the
interfacial shear tests discussed earlier, and supports the notion that, unlike the
mode-I law, no distinction needs to be drawn between the cohesive strength and
the characteristic strength. The numerical fit for how the applied load varies with
the mid-point deflection using the mode-II cohesive parameters is compared
with the experimental results in Fig. 8. As can be seen from the plot, the
numerical results provide excellent quantitative reproduction of the
experimental results, in the sense that they closely bracket them. The fits provide
a reasonable uncertainty of less than about 15% in the values of the cohesive
parameters, which mirrors the experimental uncertainty.
The cohesive law used for in these studies resulted in load-displacement
curves with a primary maximum. While this shape was obtained for some of the
experimental results, monotonic load-displacement curves were also obtained
experimentally. The fact that the numerical curves fitted the general form and
scale of the load-displacement curves, without completely capturing the details,
3 The numerical calculations confirmed that the SENF geometry did deform under pure mode-IIconditions, with the normal stresses at the crack tip being slightly compressive.
12
probably illustrates that, while a characteristic strength and toughness are
generally sufficient to model the behavior at a level suitable for design purposes,
capturing nuances of the load-deflection curves may require knowledge of the
precise shape of the traction-separation law. However, such additional
sophistication will come at the expense of additional parameters that need to be
determined with additional experiments. Exploring this concept in detail was
beyond the scope of what was being attempted in the present paper, which had
the goal of establishing a methodology to determine cohesive parameters at a
level suitable for design purposes, rather than capturing nuances in load-
displacement curves. However, an additional series of numerical calculations
indicated that it was indeed possible to reproduce both types of curve by
changing the shape of the traction-separation law. Decreasing the cohesive
strength or reducing the relative displacement at which unloading of the
traction-separation law begins seemed to favor a more monotonic form of curve
over the curves with a primary maximum. For example, a traction-separation
law where unloading began at 0.1δtc, rather than 0.6δtc,, with ΓΙΙ = 10 kJm-2 and
€
ˆ τ i = 13 MPa, allowed an almost perfect fit to the experimental monotonic load-
displacement curves.
5. Verification of mixed-mode fracture
5.1 Numerical predictions of sandwich single-lap-shear tests
Earlier work showed that pure mode-I behavior could be modeled by a
cohesive-zone model [Li et al., 2005b]; the previous section has presented results
for what was essentially pure mode-II fracture (even though a full mixed-mode
analysis was used). In this section, the use of the mode-I and mode-II interface
13
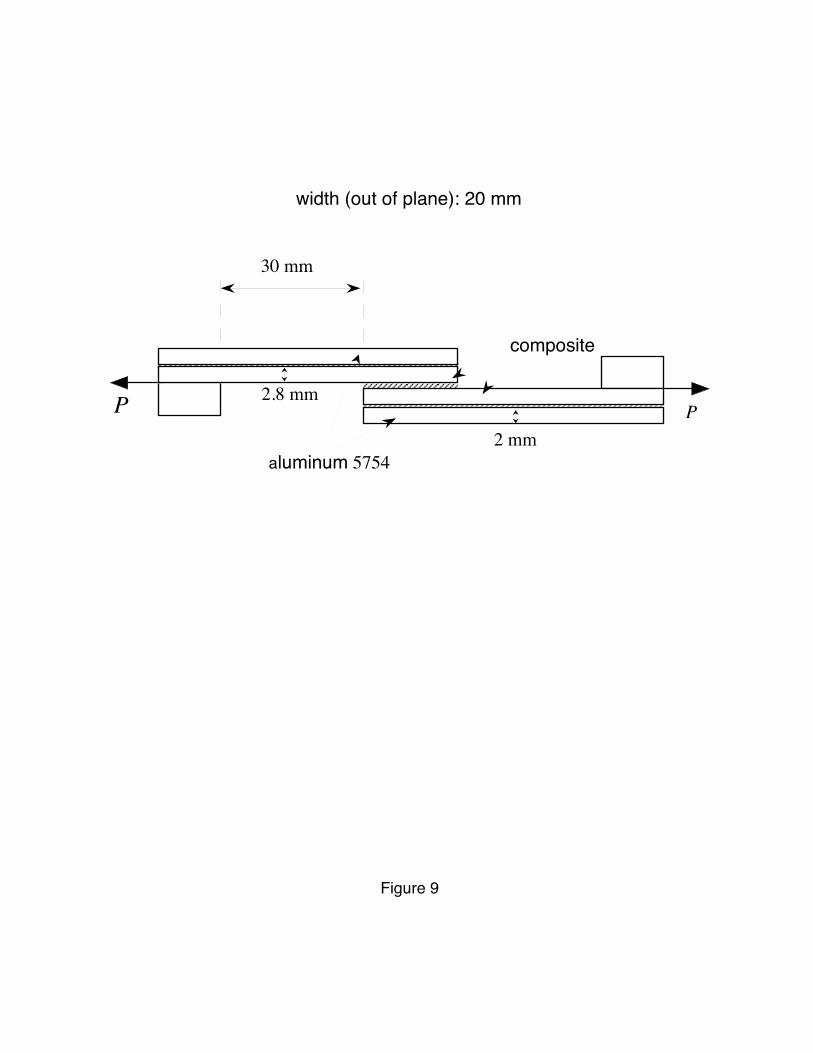
parameters to investigate a mixed-mode configuration is demonstrated. The
configuration investigated was a lap-shear geometry consisting of the composite
bonded to an aluminum alloy (Fig. 9). The aluminum arms were 2.0 mm thick,
and the composite coupons in these specimens were 2.8 mm thick. Two different
bonded over-lap lengths, 40 mm and 50 mm, were used; the width of the
specimens was 20mm and the free portion of the arms was 30 mm.
The numerical simulations were done using the constitutive properties of
the composite and aluminum described earlier. The adhesive layer was modeled
using cohesive elements with the appropriate mode-I and mode-II parameters
(Table 1), along with the failure criterion of Eqn. (1). This combination of
geometry and cohesive parameters was shown to be mixed-mode with a ratio of
GII/GI at fracture of about 2. The numerical simulations showed stable crack
propagation for about 8 mm before unstable failure occurred, with crack
propagation being accompanied by macroscopic plastic deformation of the
aluminum. The predicted peak load (per unit width) was in the range of
400 Nmm-1 to 570 Nmm-1 for the 40 mm overlap length, and between 510 Nmm-1
and 710 Nmm-1 for the 50 mm overlap length. The upper and lower bounds for
the predicted loads corresponded to the upper and lower bounds of the cohesive
parameters (Table 1).
5.2 Experimental verification
Sandwich single-lap shear specimens with dimensions identical to the
geometries analyzed numerically were tested to verify these numerical
predictions. The lap-shear specimens were tested in a screw-driven machine at a
14
displacement rate of 1.0 mm/minute, with displacements being measured
optically between two points separated by a gauge length of 80 mm using a
C.C.D camera. It was observed that, in all cases, the fracture of the sandwich
specimens was purely interfacial, as assumed for the numerical simulations. The
specimens showed stable crack growth for about 13 mm before catastrophic
failure occurred. Figures 10(a) and 10(b) compare the numerical predictions with
the experimental load-displacement curves for the two different geometries. The
experimental data are shown as points corresponding to optical measurements of
the displacement; the solid lines are the numerical predictions. The deformation
of the aluminum sandwich specimen (with an overlap length of 40 mm)
immediately before catastrophic failure is compared to the deformation
predicted by the numerical calculations in Fig. 11. It should be emphasized at
this point that the numerical results in Fig. 10 are predictions done in isolation
from the experiments. They were not attempts to reproduce the experimental
results, and should be contrasted with the calculations of Fig. 8 which were
performed to obtain material parameters by fitting experimental results. The
range of the numerical predictions in Fig. 10 represents what is expected to be
the full range of the effects of uncertainties in both the mode-I and mode-II
cohesive parameters. The results of individual experiments are expected to fall
within the predicted range. In particular, statistical effects are probably
responsible for the reason why the few experimental results do not show the full
range of predicted variability.
15
6. Fracture of composite joints
As described at the beginning of the paper, the preliminary tests showed
that end-notched flexure specimens which were not bonded to a metal failed by
fracture of the composite arms (see Fig. 1). Now, it is of interest to see whether
this behavior can be reproduced numerically using the cohesive properties of the
interface and the mode-I cohesive properties of the composite (Fig. 12 and
Table 1) obtained in an earlier work [Li et al., 2005a]. Although, it is clear from
Fig. 1 that an accurate prediction of the complete crack path in the composite
would require the mode-II properties of the composite to be included in any
model, the experimental observations indicate that failure in the composite starts
off along a mode-I trajectory. Therefore, it can be assumed that only the mode-I
properties of the composite are needed to investigate when cracking begins in
the composite.
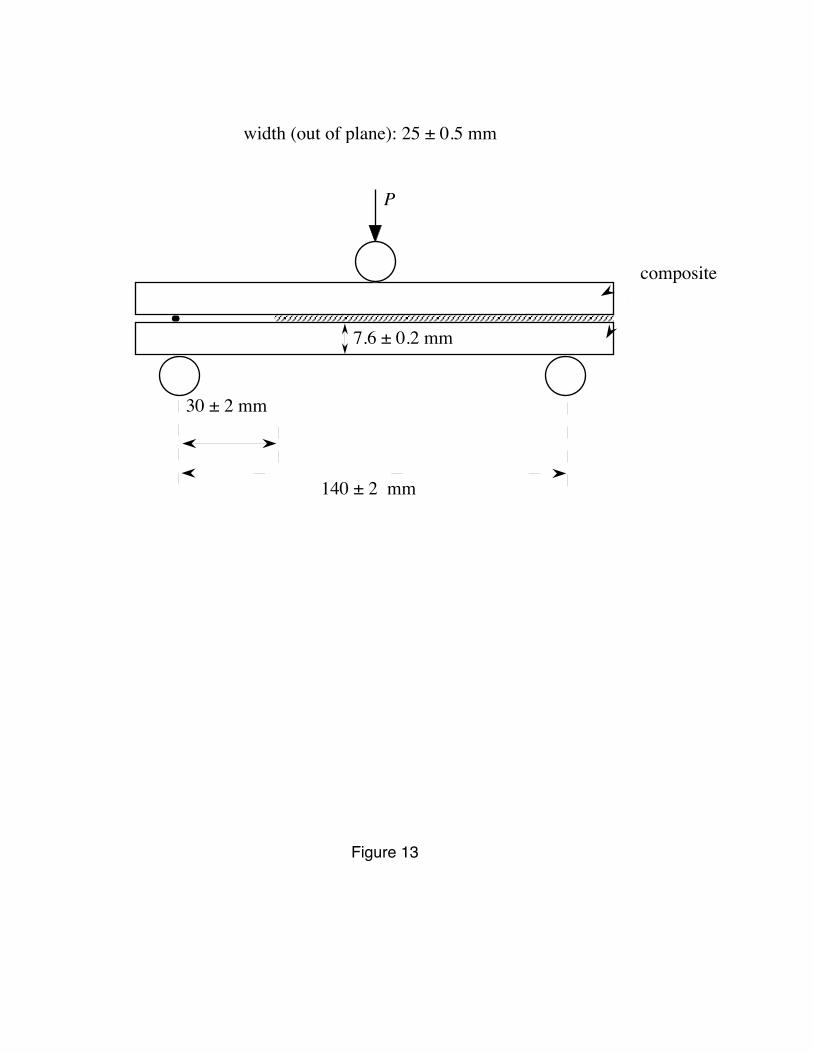
The dimensions for the ENF geometry are shown in Fig. 13: the span, 2L,
was 140 mm, and the initial crack length, a, was 30 mm, the composite thickness,
h, was 7.6 mm, and the adhesive layer thickness was 0.7 mm. A calculation in
which both the composite and interface are fully modeled by cohesive elements
would be computationally intensive. Following a similar approach used for
investigating the mode-I fracture of this same adhesively-bonded system, the
numerical calculations were performed in two stages [Li et al., 2005b]. In the first
stage, the composite was modeled by its continuum properties, and the adhesive
layer was replaced by the appropriate mixed-mode cohesive-zone model of the
interface. These initial calculations were used to identify the direction and
location of the maximum normal stresses in the arms at the conditions under
16
which the interface crack grows. In the present case, the maximum normal
stresses were approximately perpendicular to the interface. In the second stage
of the calculations, cohesive-zone elements with the mode-I fracture properties of
the composite (Fig. 12) were embedded in the composite near the crack tip
(where the normal stresses were largest) perpendicular to the interface. The
calculations were then allowed to proceed with competition between crack
growth in the interface and in the composite. To keep the numerical model to a
reasonable size, the region in which cohesive-zone elements were embedded was
limited to 10 mm in length. If the calculation indicated that the interface crack
grew out of this region without failure of the composite, the geometry was re-
meshed and a new calculation was started.
The results of the numerical simulations depended on the relative
magnitudes of the cohesive parameters for the strengths of the composite and
interface. For a relatively weak interface and strong composite the crack could
grow along the interface for about 20 mm before being arrested. A further
increase in applied displacement then caused failure of the composite, without
further interfacial crack growth. Conversely, composite failure before any
interfacial crack growth occurred if the composite was relatively weak, or if the
interface was relatively strong. A comparison of the predicted load-
displacement curves with the experimental curves is given in Fig. 14. It should
be noted that the numerical curves terminate at the onset of unstable crack
growth in the composite. Owing to the assumptions made of pure mode-I
growth in the composite, these points should more properly be considered to
represent the initiation of fracture within the composite. The numerical
17
predictions of composite failure after limited interfacial crack growth were
consistent with what was observed experimentally, as are the magnitudes of the
predicted strengths (which bracket the observed strengths).
7. Conclusions
The mode-II cohesive parameters for a composite / adhesive joint were
determined using sandwich end-notched flexure specimens in which the
composite was bonded to a metal. Such a geometry was found to be useful
because the stiffness of the metal compared to the composite ensured that most
of the load was born by the metal. This eliminated the tendency for the
composite to fail, and also suppressed the effects of the variability of the
modulus of the composite. It was observed that, for the particular system
studied in this paper, the characteristic strength for the mode-II traction-
separation law was essentially identical to the cohesive-strength of the interface.
The average shear strength of the interface measured by direct shear was
identical to the characteristic shear strength measured from fracture tests. This
was in distinct contrast to the mode-I behavior of the same interface for which it
was observed that the characteristic strength for crack growth was considerably
lower than the cohesive strength of the interface measured by direct tensile tests.
These results were consistent with observations that mode-I fracture was
accompanied by extensive fiber pull-out, but that mode-II fracture was not. With
both the mode-I and mode-II cohesive parameters determined for the adhesive
interface, the behavior of other geometries were modeled and compared to
experimental results. It was shown that the numerical results did a reasonably
good job of predicting both the strengths of the joints and the failure mechanism.
18
Acknowledgements
S. L., M. D. T. and A. M. W. gratefully acknowledge the financial support
of General Motors, the supply of the composite from Azdel, Inc., and the supply
of the adhesive from Dow Chemical. The use of unpublished data by C. Sun and
Z. Wu is also gratefully acknowledged.
19
References
Barret, J.D. and Foschi, R.O., “Mode II stress-intensity factors for cracked woodbeams,” Engineering Fracture Mechanics, 9, 371–378 (1977).
Chai, H., “Deformation and failure of adhesive bonds under shear loading,”Journal of Materials Science, 28, 494–506 (1993).
Chiang, M.Y.M. and Chai, H., “Plastic deformation analysis of cracked adhesivebonds loaded in shear,” International Journal of Solids and Structures, 31,2477–2490 (1994).
Hutchinson, J. W. and Z. Suo, “Mixed-mode cracking in layered materials,”Advances in Applied Mechanics, 29, 64-187 (1992).
Kafkalidis, M. S., M. D. Thouless, Q. D. Yang and S. M. Ward, “Deformation andfracture of an adhesive layer constrained by plastically-deformingadherends,” J. Adhes. Sci. Technol., 14, 1593-1607 (2000).
Li, S., "Fracture analysis of an adhesively-bonded polymer-matrix composite,"Ph.D. dissertation, University of Michigan, Ann Arbor, MI (2004).
Li, S., M. D. Thouless, A. M. Waas, J. A. Schroeder, and P. D. Zavattieri, “Use of acohesive-zone model to analyze the fracture of a fiber-reinforced polymer-matrix composite," Journal of Composites Science & Technology, 65, 537-549(2005).
Li, S., M. D. Thouless, A. M. Waas, J. A. Schroeder, and P. D. Zavattieri, “Use ofmode-I cohesive-zone models to describe the fracture of an adhesively-bonded polymer-matrix composite,” Journal of Composites Science &Technology, 65, 537-549 (2005).
Needleman, A. “A continuum model for void nucleation by inclusiondebonding,” Journal of Applied Mechanics, 54, 525-531 (1987).
Sørensen, B. F., “Cohesive law and notch sensitivity of adhesive joints,” ActaMaterialia, 50, 1053-1061 (2002).
Sørensen, B. F and T. K. Jacobsen, "Determination of cohesive laws by the J-integral approach," Engineering Fracture Mechanics, 70, 1841-1858 (2003).
20
Sun, C., unpublished work (2004).
Tvergaard, V. and J. W. Hutchinson, “The relation between crack growthresistance and fracture parameters in elastic-plastic solids,” Journal of theMechanics and Physics of Solids, 40, 1377-1397 (1992).
Ungsuwarungsri, T. and W. G. Knauss, “Role of damage-softened materialbehavior in the fracture of composites and adhesives,” International Journal ofFracture, 35, 221-241 (1987).
Wu, Z., unpublished work (2004).
Yang, Q. D., M. D. Thouless and S. M. Ward, “Elastic-Plastic Mode-II Fracture ofAdhesive Joints,” International Journal of Solids and Structures, 38, 3251-3262(2001).
Yang, Q. D. and M. D. Thouless, “Mixed-mode fracture analyses of plastically-deforming adhesive joints,” International Journal of Fracture, 110, 175-187(2001).
21
Figure captions
Figure 1 Micrograph of an end-notched flexure specimen, showingcomposite failure (a) before crack propagation (b) after about 20mm crack propagation.
Figure 2 The relationship between true stress and true strain for (a) the cold-rolled steel and (b) the aluminum 5754 alloy used in this study(from Wu, [2004]).
Figure 3 (a) Traction-separation law used to describe the mode-I fracture ofthe particular adhesive interface studied in this paper (from [Li etal., 2005b]). (b) Schematic traction-separation law used to describethe mode-II fracture of this adhesive interface.
Figure 4 Configuration of the specimens used to measure the averageinterfacial shear strength.
Figure 5 Geometry and dimensions for the sandwich end-notched flexurespecimens used to investigate the mode-II fracture properties of theadhesive-composite interface.
Figure 6 Plots of applied load versus center deflection for the sandwich end-notched flexure specimens with the geometry given in Fig. 5.
Figure 7 Micrographs of the side of the sandwich end-notched flexurespecimens, during the course of the experiment.
Figure 8 Comparison between the numerical fits for the load-displacementcurves and the experimentally observed curves of Fig. 6. Thedotted lines show the experimental results, while the solid lines arethe numerical fits. Numerical solutions have been shown for theaverage values of the mode-II cohesive properties, and for theupper and lower limits of both the toughness and shear strength.
22
Figure 9 Geometry and dimensions for the sandwich single-lap-shearspecimens used to investigate mixed-mode fracture of theadhesive-composite interface with aluminum arms.
Figure 10 Comparison between the numerical predictions for the load-displacement curves and the experimentally observed curves foraluminum sandwich single lap shear specimens with an overlaplength of (a) 40 ± 2 mm, and (b) 50 ± 2 mm. The dotted pointsindicate experimental data. The solid lines are numericalpredictions showing upper and lower bounds based on the rangeof cohesive parameters.
Figure 11 Comparison between the experimentally-observed deformationand the numerically-predicted deformation of an aluminumsandwich single-lap-shear specimen with 40 mm overlap length, atthe onset of catastrophic failure.
Figure 12 Traction-separation law used to describe the mode-I fracture of thecomposite (from [Li et al., 2005a]).
Figure 13 Geometry of the end-notched flexure specimens for the adhesivelybonded composite.
Figure 14 Load (per unit width) vs. mid-point deflection for the end-notchedflexure specimens with the geometry shown in Fig. 13. The dottedlines show the experimental results, with the point of crackinitiation within the composites indicated. The solid lines indicatethe numerical predictions with four limits shown for (i) thestrongest composite and strongest interface, (ii) the strongestcomposite and weakest interface, (iii) the weakest composite andthe strongest interface, and (iv) the weakest composite and weakestinterface.
23
Table 1 Summary of the interfacial and composite cohesive parameters