Mixing and characterization of nanosized powders:An assessment of different techniques
Dongguang Wei, Rajesh Dave and Robert Pfeffer∗
New Jersey Center for Engineered Particulates, New Jersey Institute of Technology, Newark, NJ 07102, USA;∗Author for correspondence (Tel.: +1-973-642-7496; Fax: +1-973-642-7088; E-mail: [email protected])
Received 2 July 2001; accepted in revised form 27 November 2001
The objective of this paper was to gain an understanding of the mixing and characterization of nanosized powders.Three different nanosized material systems were selected based on their physical and chemical properties. Mixingexperiments of the selected nanopowders were performed using a variety of environmentally friendly dry powderprocessing devices and the rapid expansion of supercritical CO2 suspensions (RESS process) and compared withsolvent-based methods coupled with ultrasonic agitation. A number of imaging techniques, including FESEM, AFM,TEM, EELS and EDS were used to characterize the degree of mixing or homogeneity of the mixtures obtained.
The results indicate that only some of the imaging techniques are capable of determining the quality of nanopar-ticle mixing, depending on the physical and chemical properties of the nanopowders. For example, field emissionscanning electron microscope (FESEM) is suitable for characterizing powder mixtures having a distinct differencein particle shape, or with a large difference in atomic number of the metallic element of the two constituents. Onlyelectron energy loss spectroscopy (EELS) was able to fully characterize nanopowder mixtures of SiO2 and TiO2 atthe nanoscale. Energy dispersive X-ray spectroscopy (EDS) provided information on mixing quality, but only ona scale of about 1 µm. The results also show that solvent-based mixing methods coupled with ultrasonic agitation,and RESS generally perform better than dry powder processing systems, with the exception of the hybridizer, ingenerating a homogeneous mixture.
Introduction
This paper addresses the subject of mixing of ultrafineparticles and the available methods for characterizingthe degree of mixing of nanoparticles to form nanocom-posites. This is a relatively new area of research, whichhas a high potential for many commercial applica-tions, both industrial and military. However, very fewpapers are found in the literature regarding the mix-ing of highly cohesive powders, let alone the mixingof nanoparticles. This is due to the fact that mosttraditional powder technology applications do not dealwith powders smaller than about 20 µm. Thus, thevast literature available in the area of mixing andcharacterization of non-cohesive powders has little
to offer, since the behavior of nanoparticles is verydifferent from the behavior of conventional powdermaterials.
Nanocomposites
It is expected that the next generation of high-performance structural materials and coatings willroutinely employ nanoparticles and nanocompositesdue to their attractive qualities such as wear resistance,corrosion resistance, mechanical strength and hard-ness. Nanoparticles and nanocomposites are also beingused as high-performance catalysts, and as advancedenergetic, electronic, photonic, magnetic and biomed-ical materials. All of these applications require an
22
understanding of the handling and mixing properties ofnanostructured materials.
The unique properties of nanoparticles arise fromtheir size reduction. When a particle is reduced downto the nanosize range (usually defined as 1–100 nm), amuch larger surface area per unit volume is achieved,and even more importantly, a dramatically increasedpercentage of molecules or atoms are found to bepresent on its surface. At the point where the inter-action length scales of physical, chemical and bio-logical phenomena become comparable to the size ofthe particle, crystal or grain structure, new propertiesand phenomena emerge (Roco, 1999; Siegel, 1999).These unique properties of nanostructured materialsare extremely important, for example, in developingnew and advanced catalysts (Trudeau & Ying, 1996;Moser et al., 1996; Ying, 1997; Zhang et al., 1998;Fokema et al., 2000).
Furthermore, when two or more phases are mixedtogether to make a nanocomposite, a combination ofproperties can be obtained, which are not available inany of the individual components, since at this scale,macroscopic material properties are strongly influ-enced by atomic or molecular interactions. Since thebuilding blocks of a nanocomposite are of nanoscale,many interfaces exist between the two intermixed solidphases and the special properties of a nanocompos-ite arise from phase interactions at these interfaces(Ajayan, 1995; Gross et al., 1996; Ajayan et al.,1997; Carter et al., 1997; Maser et al., 1997; Imanakaet al., 2000). Thus, the ability to prepare well-mixednanocomposites is extremely important.
Two different approaches, spray forming and powderprocessing (Kear & Skandan, 1997; 1999) have beenproposed for the preparation of nanocomposites. Sprayforming combines nanoparticle synthesis, heating andconsolidation into one single operation. In powder pro-cessing, nanoparticles of the desired materials are firstsynthesized by some convenient chemical or physi-cal methods, and then structurally assembled via somesteps that may include mixing, and finally consolidatedthrough sintering or some other methods.
Dry particle mixing
Mixing of solid particles has been one of the basicoperations performed by man for thousands of years.For example, the mixing of the ingredients for gun-powder can be dated as early as 700 BC. Dry particlemixing is an essential and very important unit operationin industries dealing with powders and bulk solids,
including ceramics, plastics, detergents, foods, phar-maceuticals, advanced materials, etc. and has receivedextensive study during the past decades. However,Williams (1990) says, ‘Although the mixing of partic-ulate solids is one of the oldest and most importantoperations in the process industries, it is one of the leastwell understood’.
A number of recently published reviews (Fan et al.,1990; Williams, 1990; Poux et al., 1991; Parentet al., 1993; Ottino & Khakhar, 1997) and mono-graphs (Kaye, 1997; Rhodes, 1998; Myers, 1999;Weinekotter & Gericke, 2000) on this subject appearin the literature and the various mechanisms of mixingof solid particles are discussed. Different types ofmixers, such as tumbling mixers, convective mixers,fluidized bed mixers, high-shear mixers, includingmedia mills and hammer mills, are also described indetail (see Kaye (1997) for a comprehensive reviewand discussion). However, most of the existing liter-ature deals primarily with either free-flowing particlesystems or cohesive powder systems of a relativelylarge size, for example, mean particle sizes greaterthan 10–20 µm. Only limited research is concernedwith mixing of cohesive powders (Kaye, 1997; Rhodes,1998) or particles smaller than 1 µm (Parent et al.,1993; Carter et al., 1997; Gulliver et al., 1997).
Mixing evaluation and sampling
Many different methods have been described in theliterature for evaluating the homogeneity of a mixtureof different powder particles (Fan et al., 1990; Kaye,1997; Rhodes, 1998; Weinekotter & Gericke, 2000).One method involves evaluating the mixture by itsend-use properties (Danckwerts, 1953). For example,if a well-mixed nanosized metal and nanosized metaloxide powder becomes energetic, then the degree ofmixing can be determined by how well the mixtureexplodes. Although this is not a very accurate or directmethod to characterize mixing, it is often employed inindustry.
More often, the degree of mixing is determined byanalyzing images of particle arrays within a sampleof the mixture using microscopy, photography and/orvideo tools. The images of the two-component mixtureof particles may be distinguishable by a distinct par-ticle shape, color, or some other surface characteristic(Parent et al., 1993; Gulliver et al., 1997; Kaye, 1997;Hill et al., 1999). In some cases, a tracer is used forexamining the degree of mixing (Wang & Fan, 1976;Brone et al., 1998; Brone & Muzzio, 2000).
23
For mixtures of nanoparticles, obtaining a reli-able assessment of particle positions in an array anddistinguishing between the different species is verydifficult. From a molecular viewpoint, a powder mix-ture can never achieve perfect homogeneity, and thusthe degree of mixing becomes a relative concept.Therefore, an evaluation of mixing at the scale of indi-vidual nanoparticles is nearly impossible and prob-ably unnecessary. However, the degree of mixing atdifferent length scales may need to be evaluated whichfurther complicates the issue, since the sample size,number of measurements, and the method of obtain-ing the samples, all become very important. Most cur-rent indices of the degree of mixing are based onthe measurement of sample variances. Fan et al. havereviewed and analyzed over 30 different indices ofthe degree of mixing proposed by various researchersand some additional indices have been proposed sincethen (Fan et al., 1990). All of these require exten-sive sampling, especially when evaluating mixtures ofnanoparticles.
The sampling technique used is also an impor-tant issue in the characterization of powder mixing.For example, the widely used theft-probe samplingmethod can yield non-representative samples (Thiel &Stephenson, 1982). Therefore, statistical analysis isusually applied to the measurement data (Harnby,1978; Rhodes, 1998; Weinekotter & Gericke, 2000) toobtain more reliable results, along with a larger samplesize, that is, a larger number of measurements.
Mixing and characterization of nanoparticles
In order to determine the feasibility of a mixing pro-cess for highly cohesive nanoparticles, it is necessary toestimate the forces generated during mixing and showthat these forces are larger than the cohesive or adhe-sive forces acting on the powder particles. Interparticleforces can be classified into two groups: forces suchas van der Waals, electrostatic and magnetic attraction,mechanical interlocking and chemical, that is, thosewhich do not require material bridges, and forces dueto solid bridges, capillary bonding forces and immobileliquid bridges, that is, those where a material bridgeis present. In general, at low humidity, the first groupis important, and at high humidity, the second becomesmore important. Consequently, for dry particle mix-ing, the cohesive and adhesive forces acting betweenparticles depend on molecular forces, and their impor-tance decreases with increasing particle size.
Body forces (gravity) are proportional to the cubeof the particle diameter, while van der Waals forcesare proportional to the particle diameter. Thus, forrelatively large particles (greater than 10–20 µm), theinterparticle forces are small compared to the particleweight, and their role in mixing can be neglectedand the effectiveness of a dry mixing process can beanalyzed in terms of the macroscopic forces applied.Specifically, it can be shown that these powders can bemixed provided the applied macroscopic forces, thatis, the shear and extensional/compressive stresses arelarge enough to break any loosely formed aggregates.In most cases, this can be achieved by simply agitatingthe powder, and the only concern in mixing of thesepowders is the mixing efficiency. The overall motionof particles must be appropriate for obtaining efficientmixing and can be quantified in terms of the spatialdistribution of the particle trajectories.
For dry particle mixing of powders less than 1 µmin size, on the other hand, an understanding of themacroscopic motion and forces alone is not sufficient todetermine whether the mixing will take place at a scalecomparable to the effective diameter of an individualparticle (Verkhovluyk, 1993; Kwak, 1994). Clearly, ifthe external stresses generated are not large enough tobreak up the aggregates that have been created due tovan der Waals, Coulombic and other cohesive forces,mixing will not occur at scales smaller than the sizeof the aggregates. Another complication is that whenfine powder is sheared or agitated, slip planes form,which relieve the stresses, leaving the bulk of the pow-der with no relative motion or shear. The macroscopicmixing process, therefore, must be designed to ensurethat the shear flow is generated at the length scales atwhich mixing is desired. In other words, micro-shearor high-intensity impacts are required. The process ofmixing must involve both a break up of the agglom-erated nanoparticles and a dispersion of individual orsmall clusters of nanoparticles of one phase into theother.
At present, mixing of nanoparticles can be achievedby simply suspending the two different powders (withagitation) in an organic liquid. This wet process appearsto be the only technique that is widely used, although itrequires drying of the mixture and is environmentallyunfriendly due to VOC emissions. However, it is alsoused here for baseline performance comparison withother methods.
As an alternative to the wet mixing process, we pro-pose using environmentally benign dry particle mixingand/or mixing of nanoparticles using supercritical
24
CO2. In dry particle mixing, a number of innova-tive mechanical devices are utilized. Mixing withsupercritical CO2 uses a modified rapid expansion ofsupercritical suspension (RESS) process.
Reports in the Japanese literature, and subsequentresearch at NJIT (see Pfeffer et al. (2001) for a com-prehensive review), suggested that the various equip-ment available for dry powder surface modificationand dry coating of micron-sized host particles by sub-micron-sized guest particles could also be used toachieve nanomixing. These devices employ specialpurpose, high-intensity mechanical processing to deag-glomerate the fine, highly cohesive guest powders.Four different dry coating devices are considered. Eachdevice is unique in its ‘deagglomeration’ mechanism;for example, it can provide micro-shear as well asintense local shear fluctuations, high-intensity impacts,and/or a substantial increase in the body force ofthe particles by subjecting them to high centrifugalaccelerations.
In a recent paper, Endo et al. (1997) showed that arapid pressure drop in a gas stream of powder agglom-erates can lead to deagglomeration. The success ofthis technique depends on the characteristic time forpressure release within the pores of the agglomeratesas compared to the time in which the agglomeratetravels from a zone of high pressure to low (nearlyatmospheric) pressure. If the latter is smaller, then theagglomerate will ‘explode’ due to a large pressure gra-dient and deagglomeration should occur. In the RESSprocess approach for nanomixing, this idea is exploitedalong with the advantages of mixing in a low viscosity,high diffusivity and variable density fluid such assupercritical CO2.
The characterization of nanoparticle mixturesrequires high-resolution instruments that can imagenanosized particles. A variety of electron microscopyinstruments along with elemental analysis (energydispersive X-ray spectroscopy (EDS)) can be used.Another approach involves using atomic force
Table 1. Summary of the physical properties of the materials used in the mixing study
Material Powder Nominal True density Bulk density Sourcesystem particle size (g/cm3) (g/cm3)
MS-1 W (1) 100 nm 19.3 4.15 Argonide, Inc.MoO3 20 nm 4.70 0.24 Picatinny Arsenal
MS-2 W (2) 1.0 µm 19.3 3.54 Micron Metal, Inc.TiO2 (1) 300 nm 4.26 0.88 Micron Metal, Inc.
microscopy (AFM). The AFM can provide a topo-graphical map of the sample surface with a resolu-tion down to a few nanometers. If the two differentnanoparticle materials have distinctly different mor-phology, AFM imaging can be used to tell them apart.An AFM equipped with phase imaging capability(sensitive to variations in material properties such asadhesion or viscoelasticity), can also record the phasemap along with the surface topography, which makesit a good choice for the characterization of mixing ofnanoparticles of similar size and morphology.
Experimental procedure
The study employed three different material systems.The selection of the material systems was based on theirphysical and chemical properties for the purpose ofevaluating the performance of various mixing methodsand devices and to demonstrate different characteri-zation methods. As discussed above, mixing of thenanopowders was carried out using solvent-based, drypowder and supercritical processing methods. Thephysical characterization of the resultant mixtures wasconducted using a number of different commerciallyavailable imaging and microanalysis instruments.
Material systems
The three material systems selected to perform mixingexperiments in this study were: (1) MS-1: nanosizedtungsten metal powder and nanosized molybdenumtrioxide powder, (2) MS-2: micron-sized tungstenmetal powder and sub-micron-sized titania powder,and (3) MS-3: nanosized silica and titania powders.The physical properties of these materials are listedin Table 1. The mass (grams) of each of the con-stituents in all three of the material systems werechosen so that there are approximately equal num-bers of particles of each of the two constituents.
25
Mixing tests
The mixing of powders was carried out in three differ-ent ways: (1) solvent-based methods, (2) dry powderprocessing methods, and (3) RESS.
Solvent-based methodsThe two component powders were weighed and sus-pended in a solvent in a beaker. The beaker wasthen placed in an ultrasonic bath of water. After acertain time of ultrasonic agitation, the colloidal sus-pension was dried and the mixture was collected forcharacterization. The ultrasonic bath employed in thisexperiment was an FS-30 ultrasonic cleaner (FischerScientific) with a power of 100 W at a fixed frequencyof 44–48 kHz. Specifically, for the nanosized silicaand titania system (MS-3), 3.6 g of titania (25 nm,Degussa P25) and 1.4 g of silica (16 nm, Degussa R972)were weighed and then suspended in 60 ml ethanol(CP, Fischer Scientific) or 60 ml hexane (CP, FischerScientific). The suspension was then ultrasonically agi-tated for either 5 or 30 min. After ultrasonication, thesuspension was dried overnight in an oven at 383 K.The dried mixture was then collected in a sealed vialfor characterization. For system MS-1, the mixing ofnanosized W (100 nm, Argonide) and MoO3 (20 nm,Picatinny Arsenal), 5 g of W and 1 g of MoO3 wereused. All other procedures were the same as describedabove for MS-3. The system MS-2 was not consideredfor wet mixing.
Dry powder processing methodsAs mentioned above, four different mechanical deviceswere used for dry mixing of nanopowders. Thesedevices, although differing in their manner of supply-ing the necessary mechanical forces, are all designedto promote deagglomeration of cohesive nanopowdersso as to facilitate the dispersion of particles of onecomponent into the other to achieve a high degree ofmixing.
Magnetically assisted impaction mixing. This devicewas developed at our laboratory based on a system usedfor dry particle coating (Singh et al., 1997; Hendrick-son & Abbott, 1999; Ramlakhan et al., 2000; Pfefferet al., 2001). The two component powders to be mixed,along with larger magnetic particles (which are coatedwith polyurethane) are placed in a non-metallic con-tainer. The container is then subjected to an oscillatingmagnetic field causing the magnetic particles to trans-late and spin violently and undergo collisions with the
walls and the other particles. As a result, the wholesystem appears fluidized, although no fluidizing gas ispresent. Mixing in this device appears to be due to themicro-shear created by individually spinning magneticparticles and subsequent multiple collisions that takeplace between the powder agglomerates.
In the mixing of MS-3 (nanosized silica and titania),3.6 g of titania and 1.4 g of silica were weighed andcharged into the container of volume of 200 ml. Fifteengrams of magnetic particles (with a size range from1.7 to 2.4 mm) were magnetized and then mixed withthe powders in the container and the oscillating mag-netic field turned on. After 30 min of processing, themixture was discharged and sieved to remove themagnetic particles. The powder mixture was collectedfor characterization and the magnetic particles werecleaned for the next experiment. For mixing of MS-2[W (1 µm) and TiO2 (300 nm)], 19 g W and 1 g TiO2
were used. The procedure and conditions used werethe same as for the mixing of MS-3.
Hybridization system. The hybridization system(HYB) from Nara Machinery of Japan has been usedfor making ordered mixtures, and for dry coatingand encapsulation of host particles by guest particles(Ishizaka et al., 1993). The hybridizer consists of acylindrical chamber with a high-speed rotor (spin-ning at up to 16,000 rpm) with six blades connectedto a powder recirculation system (Koishi et al., 1987;Honda et al., 1988; 1994; Ishizaka et al., 1993; Pfefferet al., 2001). Due to high centrifugal forces and rel-atively low powder loading, particles move violentlywithin the system. They undergo many collisions withthe rotating blades, and with one another, allowingfor the break up of agglomerates and mixing. Mixingin this device appears to be due to the high-intensitycollisions and very large centrifugal forces acting onthe nanopowder agglomerates.
In the mixing experiment, 10 g of MS-3 (7.2 g titaniaand 2.8 g silica) was charged into the chamber of thesystem (model NS-01) and dry air at a pressure of5 atm was introduced. The rotor speed was varied from5000 to 16,000 rpm. The mixing experiment was runfor only a few minutes (2–10 min). Material systemsMS-1 and MS-2 were not used in the hybridizer.
Mechanofusion. Mechanofusion (MF) is another drypowder coating system and was originally developedby Hosokawa Micron Corp. for ultrafine material grind-ing and powder alloying (Yokoyama et al., 1987; Tannoet al., 1994; Chen et al., 1997; Pfeffer et al., 2001).
26
This device has a cylindrical drum that rotates at highspeed (up to 3000 rpm), while a stationary internalarm, which has a cylindrical surface at the end, createsintense shear and compressive forces on the powdermixture pinned between the arm and the cylindricaldrum. There is also a stationary scraper, which pre-vents powder from caking against the wall. Mixing inthis device appears to be due to the high-intensity com-pressive and shear forces and high level of centrifugalforces that the agglomerates experience.
Since this device needs at least a volume of80–100 ml of material to achieve a good processingresult, only material systems MS-2 and MS-3 wereused to conduct the mixing experiments. Specifically,120 g W and 6 g TiO2 were used for mixing MS-2, and28.8 g titania and 11.6 g silica were used for mixingMS-3 in the MF.
Micros. The Micros (MIC) superfine mill was devel-oped by Nara Machinery of Japan for grinding powdermaterials in a liquid media. It has also been usedfor creating mechanochemical reactions for variousceramic powders (Hamada & Senna, 1995; 1996). Thelab scale (MIC-0) device consists of a vessel (300 mleffective inner volume) with a cooling jacket, a rotat-ing main shaft and six sub-shafts interlocked with themain shaft. A number of loosely stacked rings, serv-ing as milling media, are centered on each sub-shaft.The particles are held between the revolving set ofrings on the sub-shaft and the cylindrical wall sur-face and are subjected to compression forces createdby the centrifugal action of the rings and friction cre-ated by individual rotating rings. Each ring in a set ofrings can move independently of each other adjustingto the size of the particles/agglomerates between therings and the wall. This process produces pulveriza-tion, dispersion and intense mixing of particles. It hasalso been found to grind powders down to sub-micronsizes. Hence it appears to be capable of breaking downagglomerates of nanoparticles and should be effectiveas a nanopowder mixer.
In this study the device was used as a dry mixer toavoid the problem of solvent removal. Only materialMS-3 (7.2 g titania and 2.8 g silica) was processed inthis device (for 5 min at 1200 rpm).
Rapid expansion of supercritical suspensionsRapid expansion of supercritical solutions and/orsuspensions has been employed for particle forma-tion of organic substances, especially polymers and
polymer–drug composites (Tom & Debenedetti, 1991;Reverchon et al., 1993; Tom et al., 1993; Alessi et al.,1996; Turk, 1999; York, 1999). The RESS processhas been developed to exploit the advantages of super-critical fluids, such as increased solubility of solutesas compared to a gas, and higher diffusivity and verylow surface tension and viscosity as compared to aliquid, pressure-dependent density, etc. For conductingpowder mixing studies, a two-stage system was built(see Figure 1) and carbon dioxide was used as thesupercritical medium.
The MS-3 powder (3.6 g titania and 1.4 g silica) wascharged into the first-stage vessel (300 ml) and washeated and pressurized with CO2 using a heating jacketand a supercritical CO2 pump to the desired conditionsin the supercritical regime. A stirring device was alsoincorporated in the first-stage vessel. After a certaintime of stirring at 1000–2000 rpm under steady-statesupercritical conditions, the suspension was releasedthrough a nozzle into a second-stage vessel (2000 ml),the CO2 gas was vented through a filter and the powdermixture was collected from the second-stage vessel.
Characterization of nanoparticle mixtures
A number of different imaging and microanalysistechniques have been used for characterizing the mix-tures produced by the experiments. It should be notedthat since the nanopowders are highly cohesive, webelieve that none of the sample preparation techniquesdescribed below should have any effect on the qualityof mixing. Furthermore, a number of samples wereprepared by hand-mixing, that is, shaking the two pow-ders in a bottle. These samples, when inspected undera high-resolution transmission electron microscope(TEM), showed that the samples were essentiallyunmixed.
Field emission scanning electron microscopeAfter each mixing experiment, the powder mixturewas first examined using either a LEO 982 DigitalField Emission Electron Scanning Microscope or aJEOL JSM-6700F Field Emission Electron ScanningMicroscope. The field emission scanning electronmicroscope (FESEM) was operated at acceleratingvoltages from 10 to 20 kV in either secondary elec-tron detector (SE) mode or backscattered electrondetector (BSE) mode depending on the sample prop-erties. The working distance varied from 3 to 8 mmfor SE mode; 8 mm was preferred for BSE mode. The
27
Figure 1. Schematic diagram of the experimental system used for RESS. CO2 cylinder (1), supercritical CO2 pump (2), reactor (3), heatingjacket (4), speed adjustable stirring system (5), thermocouple (6), receiving tank (7), spray nozzle (8), release valve (9) and filter (10) areshown.
powder mixture was put under the SEM detector eitheras loosely scattered powder or as a pressed wafer. Thewafer, with a diameter of 15 mm and a thickness ofabout 1 mm, was prepared by compressing the mixedpowder using a lab press without any additives atconstant pressure for a constant time period. No mea-surable differences in the degree of mixing between theloosely scattered powder and the wafer (of the samesample) could be observed using EDS spot analysis(see below). Therefore, it was assumed that pressingthe powder into a wafer did not affect the degree ofmixing of the processed sample.
Transmission electron microscopeThe powder mixtures were also investigated usinga 200 kV Phillips CM20 Transmission ElectronMicroscope equipped with a Schottky field-emissionsource. The samples were investigated in loosely scat-tered form.
Electron energy loss spectroscopyA 100 kV VG Microscopes HB501 UX ScanningTransmission Electron Microscope equipped with
electron energy loss spectroscopy (EELS) (avail-able at Oak Ridge National Laboratory) and a LEO922 Omega Filter TEM equipped with EELS (avail-able at the LEO Applications Laboratory) were bothused to examine a few samples of the nanoparticle pow-der mixture, MS-3. The powder mixture samples wereinvestigated under the microscope detector in looselyscattered form. EELS imaging technique employs aunique design to achieve both angle selection andenergy selection of elastically and inelastically scat-tered electrons. By assigning an ‘energy window’ inan energy loss spectrum region, EELS is able to imagea specific element in a sample while a global imagecan be recorded simultaneously under zero energy lossconditions (as in a conventional TEM). Therefore, acomparison between the global image and the elemen-tal images can indicate the distribution of differentmaterials.
Atomic force microscopeThe morphologies of some of the mixed samples wereexamined using a Digital Instruments Nanoscope IIIaAtomic Force Microscope. The AFM was operated intapping mode and all scans were performed at ambient
28
conditions (constant temperature) on the pressed wafersamples which were first blown with a compressed inertgas to remove particles loosely attached to the samplesurface. In addition to surface morphology, the phaseimaging mode of the AFM can, in principle, be usedto detect variations in composition, adhesion, friction,viscoelasticity, and other properties of the mixture.
Energy dispersive X-ray spectroscopyIn order to analyze the chemical composition of thesurface of a mixture, EDS was employed. The spectrawere collected using a LEO Field Emission ScanningElectron Microscope equipped with an Oxford UTWX-ray detector. The spectrum was obtained under anaccelerating voltage of 15 keV and a working dis-tance of 14 mm. To assure a consistent analysis, all ofthe samples used in these tests were carefully com-pressed into a wafer of a diameter of 15 mm about 1 mmthick (as discussed above) under constant pressure(20,000 lb/in2) for the same time period.
Figure 2. SEM micrographs of MS-1 mixture mixed in hexane for 30 min under ultrasonic agitation.
Results and discussion
While all three material systems were used todetermine the performance of the different mixingmethods/devices and to examine the applicabilityof different characterization techniques, the majoremphasis was on the mixing of system MS-3 since thiswas the most challenging, as both components were ofprimary particle size of 25 nm or less.
MS-1: Nanosized W and MoO3
The two powders were mixed in hexane under ultra-sonic agitation. The dried mixture was collected asa thin cake and directly analyzed using a LEO 982FESEM (SE detector). The SEM photographs of themixture of W and MoO3 are shown in Figure 2 at differ-ent magnifications. Two types of particles having verydistinct shape characteristics, spherical and crystalline,
29
can be seen. By EDS analysis, it was identified thatthe spherical particles are W metal, and the crystallineparticles (both cubic and needle-like) are MoO3. Thetypical particle sizes for both components (W andMoO3) are close to their nominal diameters although awide size distribution for both is obvious. W particlescan be found either next to MoO3 particles or withinthe agglomerates of MoO3 particles at different lengthscales, indicating that a homogeneous mixture (to acertain extent) was obtained. It is seen that individualclusters of each component are still present especiallyat high magnifications. This might be due to the exis-tence of strong forces between the primary particles,that is, a chemical bonding formed during their produc-tion (Pierre, 1998), and also indicates that ultrasonicagitation could not break up all of the agglomeratesof MoO3.
The most important observation that can be madefrom these images is that since the two powderconstituents differ distinctly in particle shape, thehigh-resolution FESEM used in this study is capa-ble of characterizing the mixing at this scale, albeit
Figure 3. SEM micrographs of MS-2 mixture processed using MAIM: MS-2a and MS-2c are SE images, MS-2b and MS-2d are BSEimages of MS-2a and MS-2c, respectively.
in a qualitative manner. A sophisticated image anal-ysis procedure is required to derive any quantitativeinformation.
MS-2: Micron-sized W and sub-micron-sized TiO2
For powders that do not possess very different particleshape characteristics, the analysis of SEM images ismuch more difficult. The material system MS-2 wasdesigned to demonstrate characterization using theBSE detector. The MS-2 system consists of micron-sized W metal powder and sub-micron-sized TiO2
powder (see Table 1). These two powders were mixedusing two dry mixing devices, magnetically assistedimpaction mixing (MAIM) and MF. The samples inloosely scattered form were examined with a LEO 982FESEM (using both the SE and the BSE detectors).Figures 3 and 4 show some typical SEM photographsof the mixed samples at different magnification pro-cessed by MAIM and MF, respectively.
The left-hand side images in Figures 3 and 4 wereobtained using the SE detector, while the right-hand
30
Figure 4. SEM micrographs of MS-2 mixture processed using MF: MS-2e and MS-2g are SE images, MS-2f and MS-2h are BSE imagesof MS-2e and MS-2g, respectively.
side images were obtained using the BSE detector.In images MS-2b and 2d, two types of particles areseen: bright and dark. It was determined by EDS thatthe bright particles are W metal, and the dark par-ticles are TiO2. Comparing MS-2a, -2c, -2e and -2gwith MS-2b, -2d, -2f and -2h in Figures 3 and 4,shows that the SE detector only provides informationabout particle morphologies, whereas the BSE detectordistinguishes particles of different chemical composi-tion (i.e., Z-contrast or contrast due to atomic numberdifference). Thus the BSE detector can be used forcharacterizing powder mixtures when the componentparticles do not necessarily possess different shapecharacteristics (such as MS-1). However, this is notalways possible since the difference in the gray scaleof the particles seen on the BSE images depends onthe difference in atomic number (Z) and the sensitivityof the BSE detector employed. The larger the differ-ence in atomic number, the better the contrast that isobtained on BSE images (Goldstein et al., 1992).
From Figure 3 (MS-2b) and Figure 4 (MS-2f), itappears that both dry mixing devices produced a rea-sonable homogeneity of mixing. However, if Figure 3(MS-2d) is compared with Figure 4 (MS-2h), by taking
into account the difference in the magnification of thetwo images (30k for MS-2d and 50k for MS-2h), itis qualitatively observed that MF has performed betterthan MAIM in terms of particle mixing, since largeragglomerates of both TiO2 and W are seen in MS-2d.This is not entirely surprising since MF provides muchhigher forces and collision energy between particlesthan the comparatively mild fluidization of the pow-ders caused by the random motion of the magneticparticles in MAIM (Honda et al., 1994; Singh et al.,1997). However, it is apparent that agglomerates ofvarious sizes are present in both images, MS-2d andMS-2h, implying that the breakup of agglomerates offine powders is an extremely difficult process.
Once again, these series of images show that unlessa sophisticated image analysis procedure is used, SEMimaging only gives a qualitative indication of themixing quality.
MS-3: Nanosized SiO2 and TiO2
The mixing of particles of size range between a fewnanometers and one hundred nanometers is extremelydifficult since the interparticle forces are much higher
31
than those between particles of size range greater than1 µm. Nanosized SiO2 (16 nm) and TiO2 (25 nm) wereused as the model system (MS-3) to perform mix-ing and characterization of these ultrafine particles.Since mixing these particles is most challenging, allof the mixing methods/devices (solvent-based, super-critical CO2 and dry-based) available in our laboratorywere tested, so that a comparison of the mixing per-formance of these methods could be made. All of theavailable instruments were also used to characterize thenanomixtures obtained.
Characterization of MS-3 mixturesIn order to evaluate the performance of the vari-ous mixing methods, an unambiguous approach tocharacterizing the mixture must first be achieved.Therefore, a high-resolution FESEM (JEOL 6700F),AFM (DI Nanoscope IIIa), TEM (Philips CM20),EELS (VG Microscopes, HB501 UX STEM) andEELS (LEO 922 TEM with an Omega Filter), aswell as EDS microanalysis (LEO 982 Digital FESEMequipped with an Oxford X-ray detector) were used tocharacterize MS-3 mixtures processed using differentmixing systems.
Results of FESEM analysis. Figure 5 shows two SEMphotographs at different magnification of the MS-3mixtures processed using HYB at a rotation speedof 8k rpm. By using a state-of-the-art SEM (JEOL6700F), extremely high magnification can be achieved,and therefore, primary particles can be clearly distin-guished from each other. However, it was very difficultto identify individual silica or titania particles from theimages since they do not possess different shape char-acteristics. The Degussa P25 is an anatase type TiO2
while the R972 is a fumed silica (hence, amorphous(Sheka et al., 1999)). This suggests that the crystalline(cubic) particles in the images are more likely to beTiO2 and the chain-like with round head particles (seearrow in Figure 5B) are probably SiO2. The chain-like structure of silica is also observed in Figure 7as discussed later. The BSE detector was also usedto differentiate between the two kinds of particles.However, good results were not obtained probablybecause the BSE detector collects electrons that areelastically scattered from deeper surface layers (about100 nm), which is much larger than the size of eitherof the two component particles, resulting in a blendedsignal of both elements. Moreover the difference inatomic number between Ti and Si is not high enough
Figure 5. SEM micrographs of MS-3 mixture processed usingHYB for 5 min at 8k rpm: (a) 200k×, (b) 400k×.
for the BSE detector to produce a noticeable differencein gray scale on the SEM images.
Results of AFM analysis. The AFM has been widelyused in characterizing nanostructures since its inven-tion (Friedbacher et al., 1991; Dai et al., 1995; Pricaet al., 1998; Wittborn et al., 2000). The use of AFM inphase imaging (Sheehan & Lieber, 1993; Babcock &Prater, 1998), as discussed above, should make it pos-sible to distinguish between different particles in amixture. Therefore, the DI Nanoscope IIIa AFM wasused to obtain topographical images of the MS-3 mix-tures produced using RESS, the Hybridizer (HYB) andsolvent-based methods. It is not difficult to ‘see’ thenanosized particles from an AFM measurement (seeFigure 6, showing an AFM image of a solvent-basedmixed sample, Hexane/30 min). However, the phase
32
Figure 6. AFM micrograph of MS-3 mixture processed usinghexane with ultrasonication for 30 min.
imaging mode could not differentiate SiO2 from TiO2 inthe MS-3 mixtures. One possible reason is that the twomaterials may be too close in surface force properties.While these preliminary results are not very promising,more research is required to fully utilize the capabilitiesof the AFM for mixing characterization.
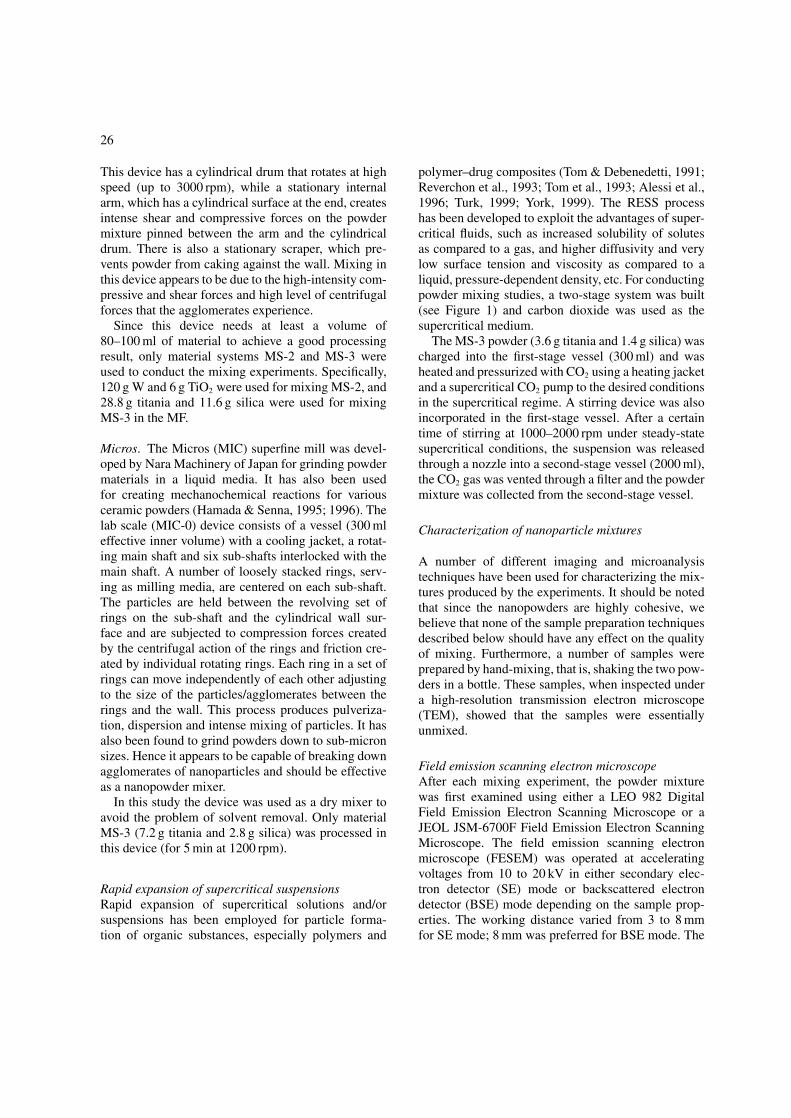
Results of high-resolution TEM analysis. TEM hasbeen extensively used to characterize nanoparticles andstructures because of its high resolution (Williams &Carter, 1996; Wang et al., 1997; Qiu et al., 2000).Figure 7 shows the TEM images of TiO2, SiO2 andthe TiO2/SiO2 mixture obtained from HYB processingusing the Philips CM20. It is seen that SiO2 appears aschain-shaped aggregates while TiO2 appears as crys-talline particles. A hasty inspection of Figure 7(c) mightindicate that the two powders have been well mixed,at least at a scale of a hundred nanometers, since wecan see both particles next to one another or overlap-ping. However, the chained SiO2 particles seen in thecenter of the image (see arrow) are clearly unmixed,although a very high rotation speed (16k rpm) was usedin the processing. Because nanoparticles often tendto form chained aggregates and behave as a polymer(Friedlander, 1999), it is not easy to break them downinto individual particles.
In principle, one can identify individual particlesin the mixture by using electron diffraction. How-ever, in general, a mixture sample under TEM wouldhave overlapping of two species, hence it is difficult
to identify individual particles in the mass of the mix-ture. This implies that direct TEM imaging is notvery useful for any quantitative characterization ofnanoparticle mixing; hence energy filtering may be abetter alternative, and is considered next.
Results of EELS analysis. A unique advantage ofEELS is energy filtering. It provides an ability to obtaina very high-resolution elemental map of the sample.Figure 8 shows an EELS image (done at Oak RidgeNational Lab) of the MS-3 mixture processed usingHYB, and the corresponding Ti and Si maps. The upperright image (c) in Figure 8 is a zero energy loss fil-tered image of an agglomerate of TiO2/SiO2 mixture.The Ti map over the agglomerate is shown in the leftimage (a) and the Si map in the lower right image (b).The bright particles/aggregates in the mapping imagesare the corresponding particles of TiO2 or SiO2. Thisis a remarkable result, indicating that a dry powdermechanical mixing device (HYB) can achieve mixingat the nanoscale.
Another MS-3 mixture sample processed in hexanefor 30 min was measured using a LEO 922 TEMequipped with the Omega filter (EELS). The results areshown in Figure 9. Figure 9(a) shows the EELS spec-tra of Ti and Si in the mixture, (b) is a traditional TEMimage of a group of mixed particles, and (c) is an energyfiltering enhanced image of the same group of mixedparticles.
It is clear from Figures 8 and 9 that EELS is ableto distinguish TiO2 and SiO2 from their mixture, henceit has the capability of characterizing the mixing ofnanoparticles at the nanoscale. However, it should benoted that unless many different samples of the mixtureare imaged, one should not draw any conclusionsregarding the total mixture quality.
Results of EDS spot analysis. An energy dispersiveX-ray detector is usually available with an SEM.By analyzing a micro-area or spot of about 1 µmover a sample surface, a ratio of the two positiveelements composing the two component particles canbe obtained. A comparison of the atomic ratio ofthese elements obtained from random spots on a sam-ple surface would be able to indicate a degree ofhomogeneity across the mixture sample. When enoughdata points are collected, a statistical analysis canalso be done, that is, a standard deviation can becalculated. Thus, by comparing the standard devia-tion of the atomic ratio data obtained from different
33
Figure 7. TEM micrographs of (a) SiO2, (b) TiO2 and (c) TiO2/SiO2 mixture (MS-3) processed using HYB at16k rpm for 5 min.
samples, it is possible to draw conclusions regard-ing the homogeneity or degree of mixing achieved inmixing of nanopowders. This approach is similar tothe statistical methods described by (Fan et al., 1990;Rhodes, 1998; Weinekotter & Gericke, 2000) used forthe characterization of free-flowing granular mixtures.
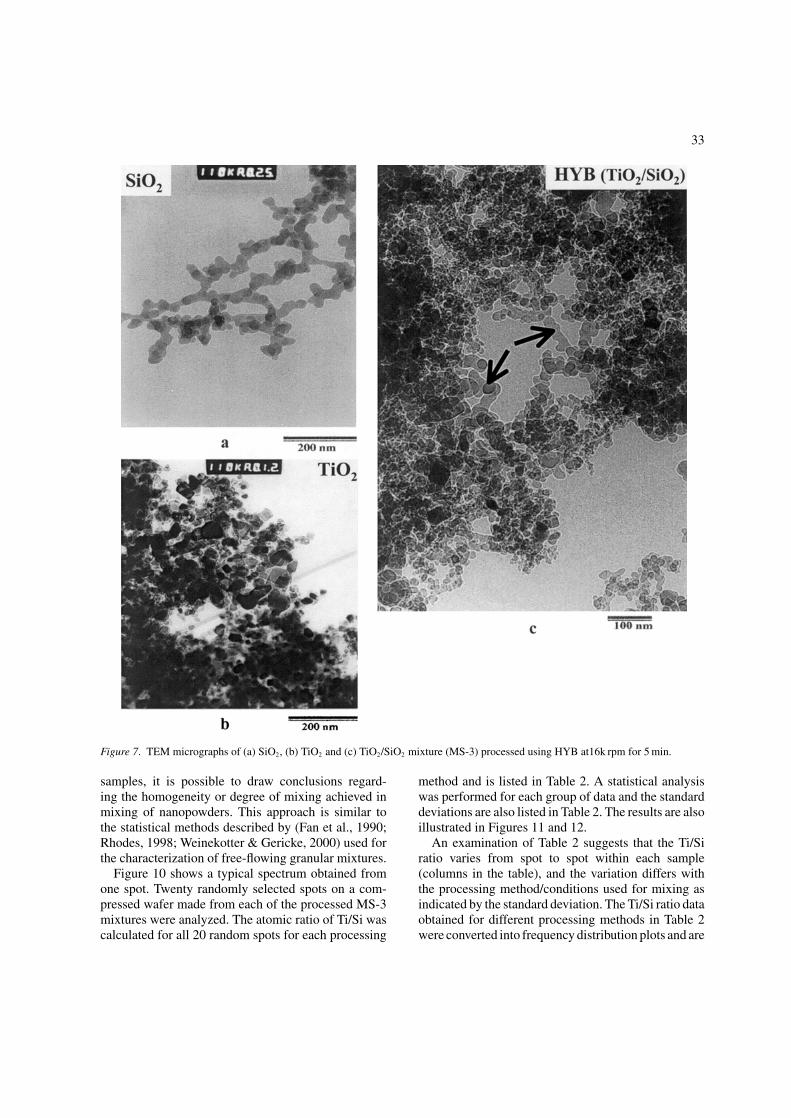
Figure 10 shows a typical spectrum obtained fromone spot. Twenty randomly selected spots on a com-pressed wafer made from each of the processed MS-3mixtures were analyzed. The atomic ratio of Ti/Si wascalculated for all 20 random spots for each processing
method and is listed in Table 2. A statistical analysiswas performed for each group of data and the standarddeviations are also listed in Table 2. The results are alsoillustrated in Figures 11 and 12.
An examination of Table 2 suggests that the Ti/Siratio varies from spot to spot within each sample(columns in the table), and the variation differs withthe processing method/conditions used for mixing asindicated by the standard deviation. The Ti/Si ratio dataobtained for different processing methods in Table 2were converted into frequency distribution plots and are
34
Figure 8. EELS micrographs of (c) an MS-3 mixture processed using HYB at 16k rpm for 5 min, and (a) Ti map, (b) Si map.
presented in Figures 11 and 12. In all of the frequencydistribution plots, the expected mean value is 1.7, andan ideal mixture would exhibit a sharp peak aroundthis mean. However, as seen in the figures, none of themixing methods produced ideal results. Wet mixingbased on EtOH, ultrasonicated for 30 min gives the bestresults, with RESS and the Hybridizer close behind.
The computed values of the standard deviation fromTable 2 are also plotted in Figure 13. The figure showsthat EtOH, ultrasonicated for 30 min, RESS and theHybridizer show the lowest values for the standarddeviation, corroborating the results shown in Figures 11and 12.
It should be noted that while elemental microanalysisusing EDS is a simple procedure, it cannot provideinformation down to the nanoscale since the interac-tion volume of the electron beam with the sample
surface is about 1 µm3 (depending on acceleratingvoltage, atomic number and the density of the materialto be examined). In addition, the EDS analysis isnot a very accurate quantitative technique; thus, theresults need to be interpreted in conjunction with othermore accurate characterization methods. Nevertheless,EDS microanalysis can provide quantitative resultsfor the characterization of mixing of nanopowders, ifa statistically meaningful numbers of data pointsare used.
Comparison of the performance ofdifferent mixing methodsIn order to compare the performance of themethods/devices employed in this study, the experi-ments were designed so that each device is operatedclose to its maximum capability in terms of providing
35
Figure 9. EELS results for an MS-3 mixture using hexane underultrasonication for 30 min: (a) EELS spectra for Ti and Si,(b) TEM image of an agglomerate of the mixture, and (c) anenergy-filtering enhanced image of the same agglomerate in (b).
kinetic energy for deagglomeration and sufficientprocessing time for mixing to occur. It should be noted,however, that for the RESS system, moderate operatingconditions (P , T and rpm) were chosen. The resultantMS-3 mixtures were characterized as to their degree ofmixing or homogeneity using the EDS microanalysismethod as described above.
From Table 2 (standard deviation) andFigures 11–13, the performance of the various pro-cessing methods can be divided into two groups:(1) solvent-based, RESS and HYB, and (2) MF, MAIMand MIC. The methods in the first group performedgenerally better than the methods in the second group.However, within the first group, the RESS processand the hybridizer performed almost as good as thesolvent-based methods.
The solvent-based methods are attractive, becausethe particles can be easily dispersed due to the lowsurface tension of EtOH and hexane. It should benoted, however, that good mixing results were notobtained by simple stirring the suspension of MS-3in either of the two solvents used. Hence it is clearthat ultrasonic agitation is necessary to enhance thedispersion (breakup of agglomerates) and mixing. Themechanism of ultrasonic agitation is based on acous-tic cavitation in a liquid phase, that is, the formation,growth and impulsive collapse of bubbles in the liquidphase. Cavitation serves as a means of concentratingthe diffusive energy of sound (Suslick, 1990; 1995).The bubble collapse produces intense local heating(temperatures of roughly 5000 K), high pressures(about 1700 atm) and very short lifetimes (a durationof 100 ns) (Suslick et al., 1986; Suslick, 1995). Inshort, the degree of agitation produced by ultrasoniccavitation in a liquid phase is extremely high. Hence,it is not difficult to explain the much better mixing per-formance obtained with solvent-based methods whencoupled with ultrasonic agitation.
However, a comparison between the results usingEtOH and hexane implies that the type of solvent alsoplays a role in the dispersion of the component powderssince ethanol performed better than hexane. A possibleexplanation can be derived from the polarity of the twotypes of solvent molecules. Hexane is non-polar andhydrophobic while ethanol is polar and hydrophilic.Both powders used in the experiments had a smallamount of water content (approximately 0.5% for SiO2
and 1.2% for TiO2). The adsorbed water might haveformed a layer/layers over the surface of the primaryparticles, which can greatly enhance the interparticleforces within an agglomerate. Therefore, hydrophilic
36
Figure 10. EDS spectrum of an MS-3 mixture processed in EtOH under ultrasonic agitation for 5 min.
Table 2. Summary of EDS elemental analysis (Ti/Si ratio) on randomly selected spots on the sample surface for differentmethods/conditions, SD is the standard deviation
ethanol should be able to penetrate through the inter-particle spaces much easier than hydrophobic hexane.One might argue that the high temperature producedby bubble collapse could have heated the agglomerateand gasified the adsorbed water. This may not occur,however, since the frequency of ultrasound used inthe experiment is 44 kHz, with an equivalent wave-length slightly larger that 20 µm. Thus, the ultrasonic
wave would not significantly affect the agglomer-ates (usually smaller than 1 µm). This could havemade the ultrasonic cavitation more like agitation thanheating.
Table 2 and Figure 13 also show that the mixingperformance of RESS is generally better than that ofthe dry methods, and comparable to the solvent-basedmethods. The idea behind the RESS process is to
37
Figure 11. Plots of frequency against Ti/Si ratio interval obtainedfrom EDS elemental analysis on MS-3 mixtures processed usingvarious methods: MF (2k rpm, 30 min), HYB (16k rpm, 5 min),MIC (1.2k rpm, 5 min), MAIM (30 min) and RESS (135 atm,46◦C, 1500 rpm).
utilize the extremely low viscosity of supercritical CO2
(i.e., very high permeability) so that the interparticlevoids within an agglomerate can be filled up with CO2.When the supercritical suspension is released througha nozzle, the rapid depressurization causes the rate ofCO2 vaporization to be much faster than the rate of dif-fusion of CO2 through the micro porous network withinthe agglomerate. As a result, an ‘explosion’ wouldoccur in the agglomerates in the receiving tank (seeFigure 1) and homogeneous mixing can be achieved.This idea is illustrated schematically in Figure 14(a).
RESS has been used for many applications (Alessiet al., 1996; Turk, 1999; York, 1999) other than mix-ing of nanopowders. Three major parameters can affectthe performance of the RESS system in terms of mix-ing: pressure, temperature and stirring speed. Pressure
Figure 12. Plots of frequency against Ti/Si ratio interval obtainedfrom EDS elemental analysis on MS-3 mixtures processed usingsolvent-based methods: (a) EtOH: ultrasonic agitation for 5and (b) 30 min, and (c) hexane: ultrasonic agitation for 5 and(d) 30 min.
essentially determines the permeability of CO2, andmore importantly the driving force for the ‘explosion’of an agglomerate. Temperature affects the permeabil-ity of CO2 and also has a possible impact on removingadsorbed water, which plays an important role in keep-ing the primary particles agglomerated. Stirring keepsthe powders suspended and may affect the homogene-ity of the final mixture as well. In this study, the fullcapability of our supercritical CO2 system (500 atm,350◦C and stirring at 2500 rpm) has not been utilized.It is therefore suggested that the RESS system be sys-tematically studied in order to determine the optimumoperating parameters to achieve homogeneous mixingof nanopowders.
The performance of the dry mixing devices variesgreatly from one to another, as shown in Table 2 and
38
Figure 13. Standard deviation of data of Ti/Si ratio obtained fromEDS elemental analysis from MS-3 mixtures processed usingdifferent methods or under different conditions.
Figure 14. Schematic representations of the possible mixingmechanisms for different mixing processes: (a) RESS and(b) high-energy mechanical dry processing systems.
Figures 11–13. The major forces in the dry mechanicaldevices for breaking up agglomerates are compressive,shear and impaction forces. These forces provide suffi-cient energy for the agglomerates to be either crushed,
or have their corners, edges and outer surfaces removedas well as undergoing repeated collisions with eachother as illustrated schematically in Figure 14(b). Thismutual exchange of particles within the agglomeratesshould result in good mixing.
Each of these dry mechanical devices, while hav-ing much in common as a group, has unique featureswith regards to providing forces of different types andintensities. From the design of a device, and the flowpatterns of the particles inside the device and its powerconsumption, it is possible to predict its performanceas a mixer. In terms of both energy consumption andthe kinetic energy provided under the operating condi-tions used in our experiments, the devices can be ratedin decreasing order as HYB, MF, MIC and MAIM.
Therefore, it is not difficult to understand that theHYB showed the best mixing performance when high-energy collisions between particles and the blades(including the circulation tube) are achieved at a rota-tion speed of 16k rpm (Honda et al., 1988; 1994;Ishizaka et al., 1993). However, it is surprising thatthe HYB is competitive with both the solvent-basedmethods and the RESS process.
Although MIC is considered a high-intensitymachine as compared to the MAIM, MAIM seemsto have performed better than MIC (see Table 2 andFigures 11–13). This is probably due to the fact thatthe MIC was used here under dry conditions, while itis designed for grinding materials in liquid suspension(Hamada & Senna, 1995; 1996). The large gap betweenthe rotating rings and the bottom of the vessel might actas dead space, where dry powder can accumulate due togravity, resulting in a poorer degree of mixing, whereasthis would probably not occur in a liquid suspension.
Summary
Methods for mixing and characterizing the degree ofmixing of nanopowders have been presented. Novelmixing techniques such as the RESS and high-intensitymechanical-based dry powder processing are proposedas an alternative to environmentally unfriendly solvent-based mixing methods. It is shown that at least oneof the dry powder processing methods, the Hybridizer,and the RESS process perform nearly as well asthe solvent-based methods in terms of producing ahomogeneous mixture of nanopowders.
For the characterization of nanopowder mixtures,a number of conclusions can be drawn. For pow-der mixtures with very distinct shape characteristics
39
(like W and MoO3), high-resolution FESEM is suitablefor characterizing the degree of mixing. The BSEdetector is found to be capable of distinguishingbetween different particles of similar shape having dif-ferent chemical composition if the difference in atomicnumber between the two positive elements is suffi-ciently large (e.g., W and Ti). For nanoparticles, whichdo not possess these characteristics such as TiO2/SiO2,characterization is much more difficult. FESEM, AFMand TEM can characterize the mixtures to a certainextent, but are generally insufficient by themselves,and further study is recommended to make them moreuseful. EELS, however, is capable of distinguishingbetween two nanoparticles such as TiO2 and SiO2 in amixture but is not readily available. Finally, EDS spotanalysis can be easily used to characterize mixtures ofTiO2 and SiO2 if enough spots (data points) are col-lected and a statistical analysis is applied. This appearsto be the most convenient technique for generatingquantitative results, albeit at the micron scale.
Acknowledgements
The authors would like to thank the US Army,Picatinny Arsenal for financial support throughcontract # DAAE30-98-C-1050, the National ScienceFoundation for financial support through grant# CTS-9985618, and the New Jersey Commission ofScience and Technology for financial support throughcontract # 01-2042-007-24. The authors are also grate-ful to Prof. M. Libera of Stevens Institute of Technologyfor his assistance in using TEM and EELS and themany valuable discussions with him to help interpretthe results obtained. Thanks are also due to Dr. JamesBentley of Oak Ridge National Laboratory and thestaff of LEO, USA for their help with the energy-filtered imaging results. Dr. Bentley’s research at theOak Ridge National Laboratory, SHaRE Collabora-tive Research Center was sponsored by the Division ofMaterials Sciences and Engineering, US Departmentof Energy, under contract DE-AC05-00OR22725 withUT-Battelle, LLC, and through the SHaRE Programunder contract DE-AC05-76OR00033 with Oak RidgeAssociated Universities.
Brone D. & F.J. Muzzio, 1998. Enhanced mixing in double-coneblenders. Powder Technol. 110(3), 179–189.
Brone D., A. Alexander & F.J. Muzzio, 1998. Quantitative char-acterization of mixing of dry powder in V-blenders. AIChE J.44, 271–278.
Carter S.A., J.C. Scott & P.J. Broack, 1997. Enhanced luminancein polymer composite light emitting device. Appl. Phys. Lett.71, 1145–1147.
Chen J., H. Herman & C.C. Huang, 1997. A preliminary modelfor mechanofusion powder processing. KONA 15, 113–120.
Dai H., E.W. Wong, Y.Z. Lu, S. Fan & C.M. Lieber, 1995. Synthe-sis and characterization of carbide nanorods. Nature 375, 769.
Danckwerts P.V., 1953. Theory of mixture and mixing. Research6, 355–361.
Endo Y., Sh. Hasebe & Y. Kousaka, 1997. Dispargation of aggre-gates of the powder by acceleration in an air stream and itsapplication to the evaluation of adhesion between particles.Powder Technol. 91, 25–30.
Fan L.T., Y.M. Chen & F.S. Lai, 1990. Recent development insolids mixing. Powder Technol. 61, 255–278.
Fokema M.D., A.J. Zarur & J.Y. Ying, 2000. Lean-Burn naturalgas engine exhaust remediation using nanostructured catalystsand coatings. In: Chow G.-M., Ovid’ko I.A. and Tsakalakos T.eds. Nanostructured Films and Coatings. Kluwer, Dordrecht,the Netherlands, pp. 355–365.
Friedbacher G., P.K. Hansma, E. Ramli & G.D. Stucky, 1991.Imaging powders with the atomic force microscope: Frombiominerals to commercial materials. Science 253, 1261–1263.
Friedlander S.K., 1999. Polymer-like behavior of inorganicnanoparticle chain aggregates. J. Nanoparticle Res. 1, 9–15.
Goldstein J.I., D.E. Newbury, P. Echlin & D.C. Joy, 1992. Scan-ning Electron Microscopy and X-Ray Microanalysis: A Textfor Biologists, Materials Scientists, and Geologists. 2nd edn.,pp. 189–230.
Gross K.J., P. Spatz, A. Zuttel & L. Schlapbach, 1996. Mechan-ically milled Mg composites for hydrogen storage: the transi-tion to a steady-state composition. J. Alloys and Compounds240, 206–213.
Gulliver E., R.E. Riman & V.A. Greenhut, 1997. Mixedness engi-neering for advanced multicomponent materials. Int. J. PowderMetallurgy 33, 29–36.
Hamada K. & M. Senna, 1995. Kagaku Kogaku Ronbunshu21, 334.
Hamada K. & M. Senna, 1996. Mechanochemical effects on theproperties of starting mixtures for PbTiO3 ceramics by using anovel grinding equipment. J. Mater. Sci. 31, 1925–1928.
Harnby N., 1978. Statistics as an aid to powder mixing. Interna-tional Symposium on Mixing, Faculte Polytechnique de Mons,Feb. 21–25, paper D3.
Hendrickson W.A. & J. Abbott, 1999. US Patent: 5962082.
40
Hill K.M., J.F. Gilchrist, J.M. Ottino, D.V. Khakhar &J.J. McCarthy, 1999. Mixing of granular materials: a test-beddynamical system for pattern formation. Int. J. Bifur. Chaos9(8), 1467–1484.
Honda H., M. Kimura, F. Honda, T. Matsuno & M. Koishi, 1994.Preparation of monolayer coated powder by dry impact blend-ing process utilizing mechanochemical treatment. ColloidsSurf. A: Physicochem. Eng. Aspects 82, 117–128.
Honda H., T. Matsuno & M. Koishi, 1988. J. Soc. Powder Technol.Jpn. 25, 597.
Imanaka N., J. Kohler & M. Toshiyuki, 2000. Inclu-sions of nanometer-sized Al2O3 particles in a crystalline(Sc,Lu)2(WO4)3 matrix. J. Am. Ceram. Soc. 83, 427–429.
Ishizaka T., H. Honda & M. Koishi, 1993. Drug dissolution fromindomethacin-starch hybrid powders prepared by dry blendingmethod. J. Pharm. Pharmacol. 45, 770–774.
Kaye B.H., 1997. Powder Mixing. Chapman & Hall, pp. 19–35,77–131.
Kear B.H. & G. Skandan, 1997. Nanostructured bulk mate-rials: synthesis, processing, properties and performance. In:Seigel R.W., Hu E. and Reco M.C. eds. Proceedings ofR&D Trends in Nanoparticles, Nanostructured Materials andNanodevices in the United States, pp. 103–117.
Kear B.H. & G. Skandan, 1999. Overview: status and cur-rent developments in nanomaterials. Int. J. Powder Metallurgy35(7), 35–37.
Koishi M., H. Honda, T. Ishizaka, T. Matsuno, T. Katano &K. Ono, 1987. Chimicaoggi 5, 43.
Kristensen H.G., 1996. Particle agglomeration in high shearmixer. Powder Technol. 88, 197–202.
Kwak S.Y., 1994. Determination of microphase structure andscale of mixing in poly-epsilon-caprolactone (PCL)/poly(vinylchloride) (PVC) blend by high-resolution solid-state13C-NMR spectroscopy with magic angle spinning and crosspolarization. J. Appl. Polym. Sci. 53(13), 1823–1832.
Lacey P.M.C., 1954. Developments in the theory of particulatemixing. J. Appl. Chem. 4, 257.
Maser W.K., I. Lukyanchuk, P. Bernier, P. Molini, S. Lefrant,Ph. Redlich & P.M. Ajayan, 1997. Superconducting RNi2B2C(R = Y, Lu) nanoparticles: size effects and weak links. Adv.Mater. 9, 503.
Moser W.R., J.E. Sunstrom IV & B. MarshikGuerts, 1996. Thesynthesis of nanostructured pure phase catalysts by hydrody-namic cavitation. In: Moser W.R. ed. Advanced Catalysts andNanostructured Materials. Academic Press, pp. 285–305.
Myers D., 1999. Surfaces, Interfaces, and Colloids: Principles andApplications. 2nd edn. Wiley-VCH, pp. 40–67.
Myers K.J., M.F. Reeder, D. Ryan & G. Daly, 1999. Get a fix onhigh-shear mixing. Chem. Eng. Prog. Nov. 1999, pp. 33–42.
Parent J.O.G., J. Iyengar & H. Henein, 1993. Fundamentals of drypowder blending for metal matrix composites. Int. J. PowderMetallurgy 29, 353–366.
Pfeffer R., R. Dave, D. Wei & M. Ramlakhan, 2001. Synthesis ofengineered particulates with tailed properties using dry particlecoating. Powder Technol. 117, 40–67.
Pierre A.C., 1998. Introduction to Sol-Gel Processing. In: LisaKlein ed. The Kluwer International Series in Sol-Gel Pro-cessing: Technology and Applications. Kluwer AcademicPublishers, Boston/Dordrecht/London, pp. 220–247.
Poux M., P. Fayolle, J. Bertrand, D. Bridoux & J. Bousquet,1991. Powder mixing: some practical rules applied to agitatedsystems. Powder Technol. 68(3), 213–234.
Prica M., K. Kendall & S.A. Markland, 1998. Atomic force micro-scope study of ceramic powder compacts during drying. J. Am.Ceram. Soc. 81(3), 541–548.
Qiu S., J. Dong & G. Chen, 2000. Synthesis of CeF3 nanoparticlesfrom water-in-oil microemulsions. Powder Technol. 113, 9–13.
Ramlakhan M., C.-Y. Wu, S. Watano, R.N. Dave & R. Pfeffer,2000. Dry particle coating using magnetically assistedimpaction coating (MAIC): modification of surface propertiesand optimization of system and operating parameters. PowderTechnol. 112, 137–148.
Reverchon E, G. Donsi & D. Gorgoglione, 1993. Salicylic acidsolubilization in supercritical CO2 and its micronization byRESS. J. Supercrit. Fluids 6(4), 241–248.
Rhodes M., 1998. Introduction to Particle Technology. JohnWilley & Sons, West Sussex, England, pp. 223–235.
Rumpf H., 1962. In: Krepper W.A. ed. Agglomeration. Wiley,New York, p. 379.
Sheehan P.E. & C.M. Lieber, 1996. Nanotribology and nanofabri-cation of MoO3 structures by atomic force microscopy. Science272, 1158–1161.
Sheka E., V. Khavryutchenko & E. Nikitina, 1999. Frommolecules to particles: quantum-chemical view applied tofumed silica. J. Nanoparticle Res. 1, 71–81.
Siegel R.W., 1999. In: Siegel R.W., Hu E. and Reco M.C. eds.Nanostructure Science and Technology: A Worldwide Study.WTEC, Loyola College in Maryland, pp. 1–14.
Singh R.K., A. Ata, J. Fitz-Gerald & W. Hendrickson, 1997.Dry coating method for surface modification of particu-lates. In: Sudarshan T.S., Khor K.A. and Jeandin M. eds.Surface Modification Technology X. The Institute of Materials,London.
Suslick K.S., 1990. Sonochemistry. Science 247, 1439–1445.Suslick K.S., 1995. Applications of ultrasound to materials
chemistry. MRS Bulletin, April, pp. 29–34.Suslick K.S., D.A. Hammerton & R.E. Cline Jr., 1986. The
sonochemistry hot spot. J. Am. Chem. Soc. 108, 5641.Tanno K., T. Onagi & M. Naito, 1994. Preparation of
steel/zirconia composite particles with a multiphase coatinglayer. Adv. Powder Technol. 5(4), 393–405.
Thiel W.J. & P.L. Stephenson, 1982. Assessing the homogeneityof an ordered mixture. Powder Technol. 31, 45–50.
Tom J.W. & P.G. Debenedetti, 1991. Formation of bioerodiablepolymeric microspheres and microparticles by rapid expansionof supercritical solutions. Biotechnol. Prog. 7, 403–411.
Trudeau M.L. & J.Y. Ying, 1996. Nanocrystalline materials incatalysis and electrocatalysis: structure tailoring and surfacereactivity. Nanostr. Mater. 7(1/2), 245–258.
41
Turk M., 1999. Formation of small organic particles by RESS:experimental and theoretical investigations. J. Supercrit. Fluids15, 79–89.
Verkhovluyk T.V., 1993. Determination of homogeneity of somecomposite materials. Ukrain. Khimi. Zh. 59, 3.
Wang R.H. & L.T. Fan, 1976. Ind. Eng. Chem. Process Dev.15, 381.
Wang Y.C., T.M. Chou & M. Libera, 1997. Transmission electronholography of silicon nanosphere with surface oxide layers.Appl. Phys. Lett. 70(10), 1296–1298.
Weinekotter R. & H. Gericke, 2000. Mixing of Solids.Kluwer Academic Publishers, Dordrecht, the Netherlands,pp. 15–34.
Williams, D.B. & C.B. Carter, 1996. Transmission ElectronMicroscopy: A Textbook for Materials Science. Vol. 3, PlenumPress, New York.
Williams J.C., 1990. Mixing and segregation in powders. In:Rhodes M. ed. Principles of Powders Technology. John Wiley& Sons, Chichester, p. 71.
Wittborn J., K, Rao & J. Nogues, 2000. Magnetic domainand domain-wall imaging of sub-micron Co dots by probingthe magnetostrictive response using atomic force microscopy.Appl. Phys. Lett. 76(20), 2931–2933.
Ying J.Y., 1997. Nanoparticle synthesis for catalytic applica-tions. In: Proceedings of the Joint National Science Foundation-National Institute of Standards and Technology Conference on‘Nanoparticles: Synthesis, Processing into Functional Nanos-tructures, and Characterization’. National Science Foundation,Arlington, Virginia, pp. 131–137.
Yokoyama T., K. Urayama, M. Naito, M. Kato & T. Yokoyama,1987. The angmill mechanofusion system and its applications.KONA 5, 59–67.
York P., 1999. Strategies for particle design using supercriti-cal fluid technologies. Pharmaceut. Sci. Technol. Today 2,430–440.
Zhang Z., C.-C. Wang, R. Zakaria & J.Y. Ying, 1998. Role of par-ticle size in nanocrystalline TiO2-based photocatalysts. J. Phys.Chem. B 102(52), 10871–10878.