Mixing Enhancement of High-Bypass Turbofan Exhausts via Contouring of Fan Nozzle
Marco Debiasi1, Shyam Sundar Dhanabalan2, and Her Mann Tsai3
Temasek Laboratories, National University of Singapore, Singapore, 117508, Singapore
and
Dimitri Papamoschou4
Department of Mechanical and Aerospace Engineering, University of California, Irvine, CA 92697-3975, USA
The purpose of this paper is to consider experimentally and computationally the use of axial flow to enhance the mixing of the jets from high-bypass turbofan nozzles. Mixing enhancement is caused by flow separation in the convergent-divergent secondary (fan) nozzle operated at overexpanded conditions. The experiments were conducted on a scaled-down version of a typical turbofan engine exhaust. Here the exit-to-throat area ratio of the secondary nozzle is conveniently adjusted via the axial position of the secondary nozzle relative to the primary nozzle exit. Mean velocity surveys of the jet plume were taken at Mach numbers in the range 0.6-1.0 representative of modern turbofan engines. The degree of jet mixing enhancement depends primarily on the nozzle area ratio. The effect of nozzle pressure ratio, which ranged from 1.3 to 1.9, is relatively minor. The high-velocity region of the jet is reduced by about 3 fan diameters and the primary potential core region practically eliminated at nozzle area ratios at or above 1.4. Selected jets were also investigated computationally. The computations capture the salient physics of flow separation and reproduce well the experimentally observed reduction of the potential core region in the vicinity of the nozzle. Further downstream, however, the computations do not capture accurately the experimental trends.
Nomenclature A = nozzle cross-sectional area D = nozzle exit diameter l = axial distance between primary and secondary nozzle exit planes M = fully-expanded Mach number r = radial location u = local horizontal component of mean jet velocity U = fully-expanded velocity x = stream-wise location δ = half-velocity thickness Subscripts p = primary nozzle s = secondary nozzle t = secondary nozzle throat
1 Research Scientist, Temasek Laboratories, National University of Singapore, Singapore, Member AIAA. 2 Associate Scientist, Temasek Laboratories, National University of Singapore, Singapore. 3 Principal Research Scientist, Temasek Laboratories, National University of Singapore, Singapore, Member AIAA. 4 Professor, Department of Mechanical and Aerospace Engineering, University of California, Irvine, California, USA, Associate Fellow AIAA.
American Institute of Aeronautics and Astronautics
1
37th AIAA Fluid Dynamics Conference and Exhibit25 - 28 June 2007, Miami, FL
I. Introduction NHANCEMENT of jet mixing can benefit the noise emission and the infra-red thermal signature of aircraft engines by promoting the entrainment, dilution, and spread of the high-speed combustion gases. A good review
of the state of the art is given by Knowles and Saddington1. They conclude that a key target to minimize the infra-red signature should be the reduction of the volume and surface area of the jet potential core. The same reduction would benefit the jet noise emission. It should also be noted that, while increased mixing alone can benefit the thermal signature, it does not necessarily reduce jet noise1.
E
Rapid mixing technologies can be broadly organized based their mechanisms: nozzle geometric modifications, high-shear stress mixing, normal stress mixing, external or self-acoustic excitation, mechanical oscillation, and induced self-oscillation1. Rectangular jets2,3 decay about twice as quickly as circular ones and elliptical jets4,5 decay faster still. Lobed nozzles6-8 are effective in promoting rapid mixing and shortening the jet potential core. The effects of these geometric modifications are an increase of the jet cross sectional perimeter and the induction of streamvise vortices which augment the jet entrainment. Excrescences in the form of tabs9,10 and chevrons11,12 protruding into the jet flow can also be very effective at increasing the mixing and disturbing the jet structure. In all the cases above, a major drawback is the thrust penalty introduced by the mixing techniques. Thrust losses escalate with increasing jet Mach numbers and can easily reach the order of 10% in supersonic jets13,14. Bulk and shear layer swirl, pulsing, and other forms of external or self-induced excitation benefit jet mixing to different degrees. Unfortunately many of the relevant studies do not include an analysis of the impact on thrust1. Beside propulsive losses, these methods can add significant weight and complexity to the engines with repercussion on aircraft performance and operating costs. Some of techniques employing external excitation also appear unsuited for propulsive jets due to the large amount of energy required to achieve useful effects in full-scale engines.
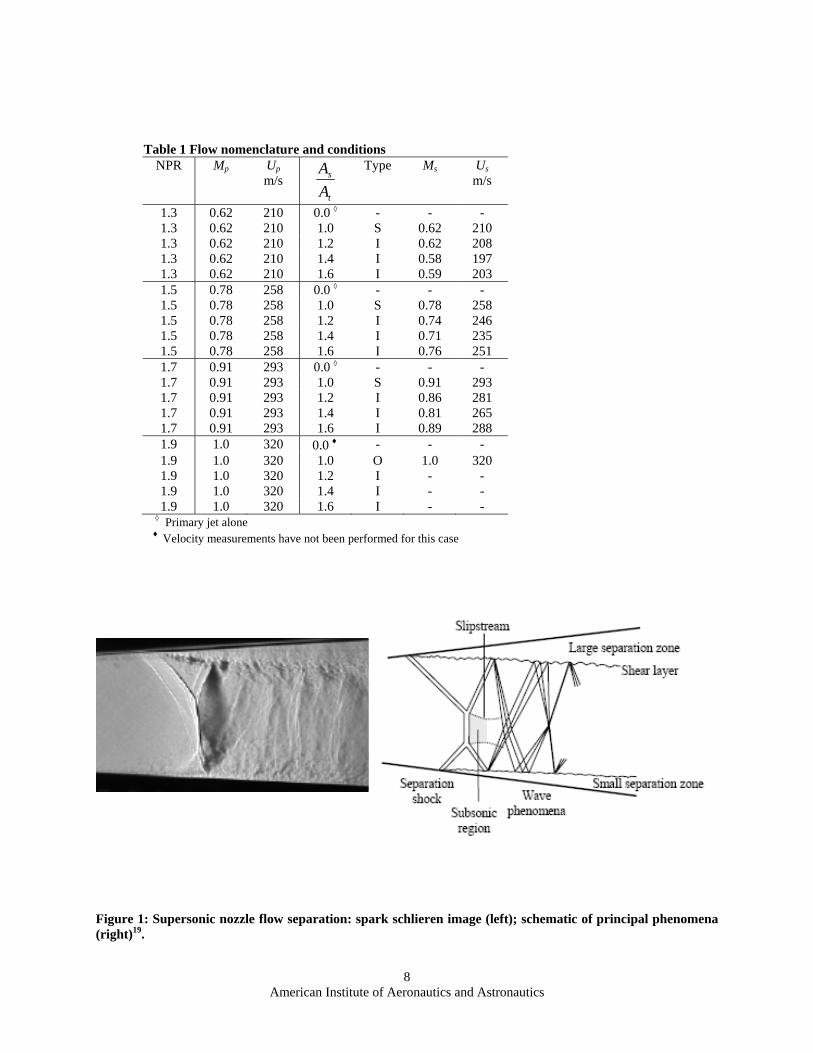
A novel approach for enhancing jet mixing has been recently developed which exploits the strong flow instability developing in a convergent-divergent nozzle operated at overexpanded conditions15-20. Initial observations on round nozzles prompted a more systematic study of this phenomenon in two-dimensional nozzles. The results indicate that in a range of nozzle pressure and area ratios, the internal shock acquires two lambda feet, one consistently larger than the other, leading to asymmetric separation of the flow, Fig. 1 17. The likely source of instability is the interaction of the unsteady waves generated past the main separation shock with the shear layer of the large separation region19. The shear layer on the large separation side exhibits intense instability that grows into huge eddies downstream of the nozzle. These eddies increase the jet entrainment and reduce the jet velocity.
The method does not use mechanical devices to directly disturb the flow and introduces minimal thrust penalty (1-2%) with potential for even smaller or negligible losses with appropriate design or control of the nozzle shape15. The technique can be used in single- or dual-stream jets. In dual-stream jets, where the outer (secondary) stream is the unstable flow, the method is called Mixing Enhancement using Secondary Parallel Injection (MESPI).
The purpose of this work is to explore the effect of MESPI in reducing the jet velocity and enhancing the mixing of high-bypass turbofan engines. It also complements a concurrent work on Mixing Enhancement using Axial Flow (MEAF) with plugged nozzles21. Experiments were conducted on a scaled-down version of a high-bypass-ratio nozzle arrangement analogous to types currently used in aircraft. The exit-to-throat area ratio of the secondary flow was controlled by adjusting the axial position of the external duct relative to the bulging primary duct. Detailed mean velocity surveys of the jet plume were taken at primary and secondary Mach numbers representative of subsonic jet engine operation.
Selected jets were also studied by solving the Reynolds-Averaged Navier-Stokes equations in conjunction with the two-equation shear-stress-transport model20. Similar to the case of single-stream jets with plug, the numerical data reproduce well the fundamental details of the nozzle separation responsible for MESPI. They also predict some of the jet velocity reductions. However they do not capture the increased mixing caused by MESPI.
The two following main sections discuss the experiments and the computations utilized in this work. Each section provides a description of the setup and of the procedure used and is followed by the presentation and discussion of the corresponding results.
II. Experiments
A. Nozzles and Flow Conditions Table 1 lists the nomenclature and the flow conditions analyzed in this study. A preliminary assessment of the nozzle exit conditions for modern, large-bypass turbofan engines was performed
based on their thermodynamic cycle with typical values for the relevant parameters. The results indicate that the
American Institute of Aeronautics and Astronautics
2
primary and the secondary nozzle Mach numbers are roughly equal and change uniformly from low to high power. Therefore in this work we analyze the effect of MESPI on jets with primary and secondary streams having the same nozzle pressure ratio (NPR, first column in Table 1). Air-helium mixtures should have been used to better reproduce the velocity of the core stream (which exhausts at supersonic speed with respect to the ambient), but this would have been prohibitively expensive for the current experiments. The speed of the fan stream is typically high subsonic.
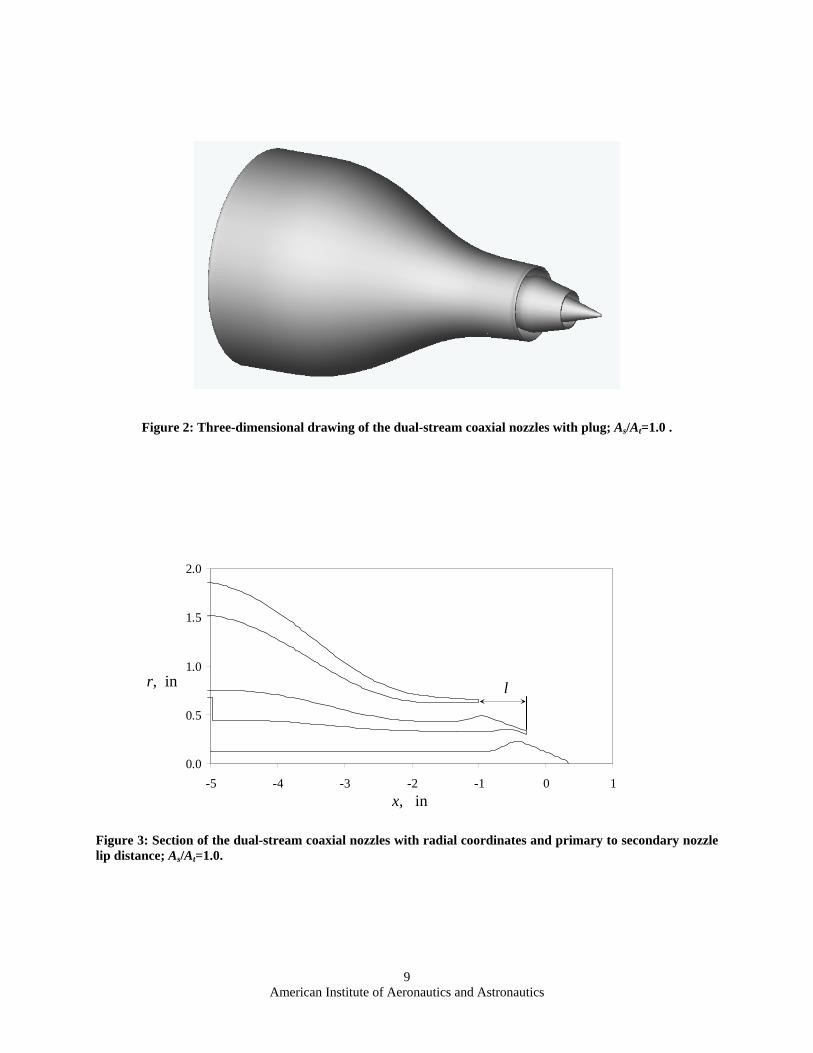
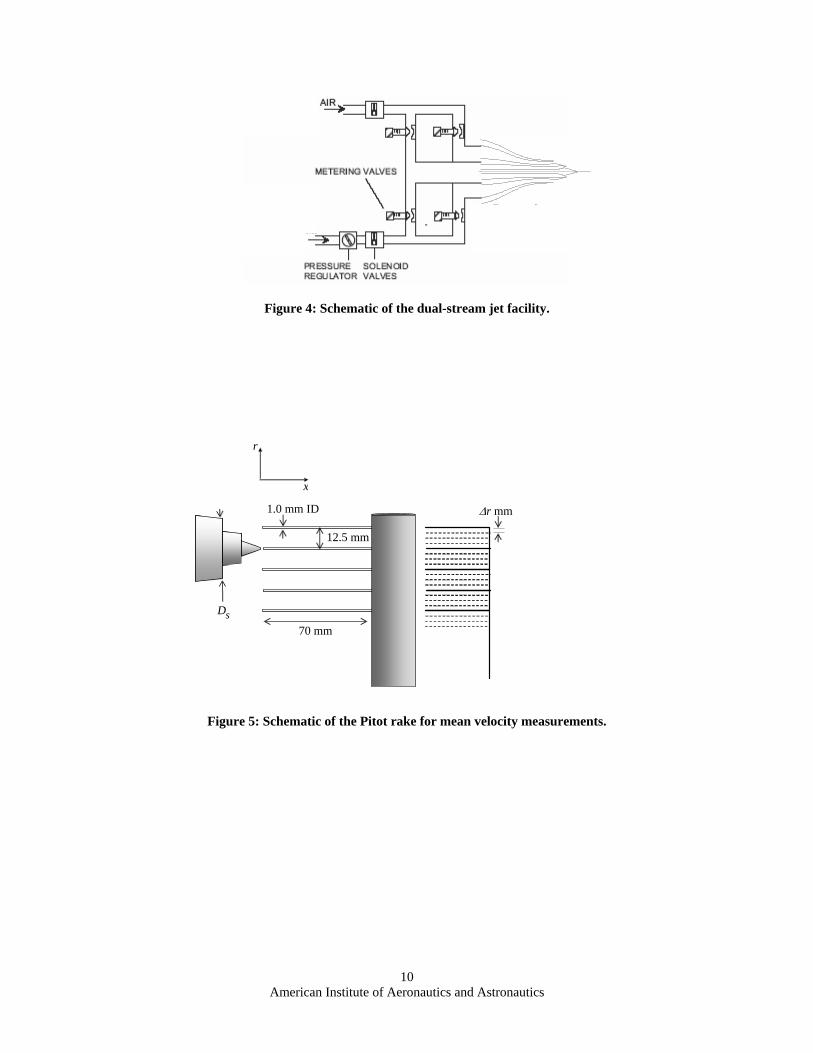
The nozzle configuration used in this study is shown in Fig. 2. It is an evolution of the 3BB type nozzle utilized in the UCI experiments22,23. This is turn is a scaled-down version of the bypass-ratio 5, separate-flow nozzle used at the NASA Glenn Research Center24,25. The nozzle components were created with rapid-prototyping from plastic (epoxy resin) material. The primary-nozzle duct is convergent with exit diameter Dp=15.2 mm (0.6 in) and has a central plug. Flow lines past the plug maximum diameter are such that the annular duct area remains constant to the exit, Fig. 3. The second and third columns give the Mach number Mp and velocity Up of the primary stream expanding isentropically to ambient pressure. The secondary-nozzle duct converges smoothly to a section of constant diameter Ds=31.6 mm (1.24 in) that extends to the exit. A sonic throat is created between this constant diameter section and the bulge on the outer surface of the primary duct, Fig. 3. The exit to throat area ratio As/At of the secondary flow decreases with the axial protrusion l of the primary nozzle lip downstream of the secondary nozzle lip. Secondary flows with increasing area ratios As/At = 1.2, 1.4, and 1.6 are compared to the baseline case (As/At = 1.0), and to the primary jet alone (As/At = 0) at each pressure ratio. For each value of As/At we identified three possible regimes based on the nozzle NPR as shown in Ref. 15. These are indicated in Table 1 as S (subsonic), I (internal shock), and O (overexpanded). In the subsonic and overexpanded cases the flow in the nozzle is entirely isentropic and the corresponding relations can be used to calculate the nozzle exit conditions. For the case of an internal shock its location was estimated with a cubic-spline interpolation/extrapolation of the shock location data from Fig. 9 of Ref. 17. Based on these shock location data and associated total pressure loss, the fully-expanded velocity and Mach number of the secondary flow were estimated and are listed in the last two columns of Table 1. These values are not given for internal shock at NPR=1.9, since the extrapolation procedure to locate the shocks in these cases was deemed not accurate. The Reynolds number of the jets, based on the secondary stream diameter, are in the range 3-5·105.
B. Mean Velocity Measurements The nozzles were attached to the dual-stream air-supply system shown in Fig. 4. Compressed air was supplied to
both the primary (core) and secondary (fan) nozzles at room temperature. Pressure transducers (Setra Model 208E) connected to the primary and secondary plenums allow control of the corresponding total pressures within ±1% of the nominal values.
A Pitot rake, shown in Fig. 5, was used to survey the total pressure in the jet plume. The rake consists of five stainless steel tubes, each 70 mm long, supported by an airfoil-shaped holder. The tubes are mounted 12.5 mm apart and their inner diameter is 1.0 mm. The rake is mounted on a carriage with motorized motion in longitudinal, spanwise, and vertical directions. The first from the top probe is the reference probe, and it is initially positioned at the tip of the plug. The five probes of the rake are individually connected to five pressure transducers (Setra Model 208E). The transducers are mounted close to the traverse assembly in order to minimize the length of the tubing between each probe and the corresponding transducer. The jet Mach number and velocity were computed from the Pitot pressure by assuming constant total temperature (equal to the ambient temperature) and uniform static pressure. The control of the three-axis carriage allows incremental-step motion in each direction. 1000 samples from each probe were acquired at each new position with a National Instrument 6014 board installed on a Dell Optilex GX270 personal computer.
Cross-sectional surveys of selected jets were performed at an axial distance of 63 mm from the plug tip in order to assess the axial symmetry of the flow. The sampling grid is centered with the jet axis and consists of 30 points separated by 2.08mm (one fifth of the probe spacing) in the spanwise and vertical directions. Thus the size of the covered square area spans almost 2Ds in each direction.
Streamwise velocity profiles were obtained in the x-r plane. For each case 26 uniformly spaced x-locations were surveyed downstream of the plug tip, with x/Ds spanning a distance from 0 to about 12. For each location 60 measurements were taken in the vertical (radial) direction separated by Δr=1.04mm, Fig. 5.
American Institute of Aeronautics and Astronautics
3
C. Experimental Results From the Pitot measurements we derived mean velocity isocontours of the flowfield. The velocity fields are
normalized by the velocity Up 16, whereas the dimensions are normalized by the primary jet diameter Dp and by the secondary jet diameter Ds for the primary and dual-stream cases respectively.
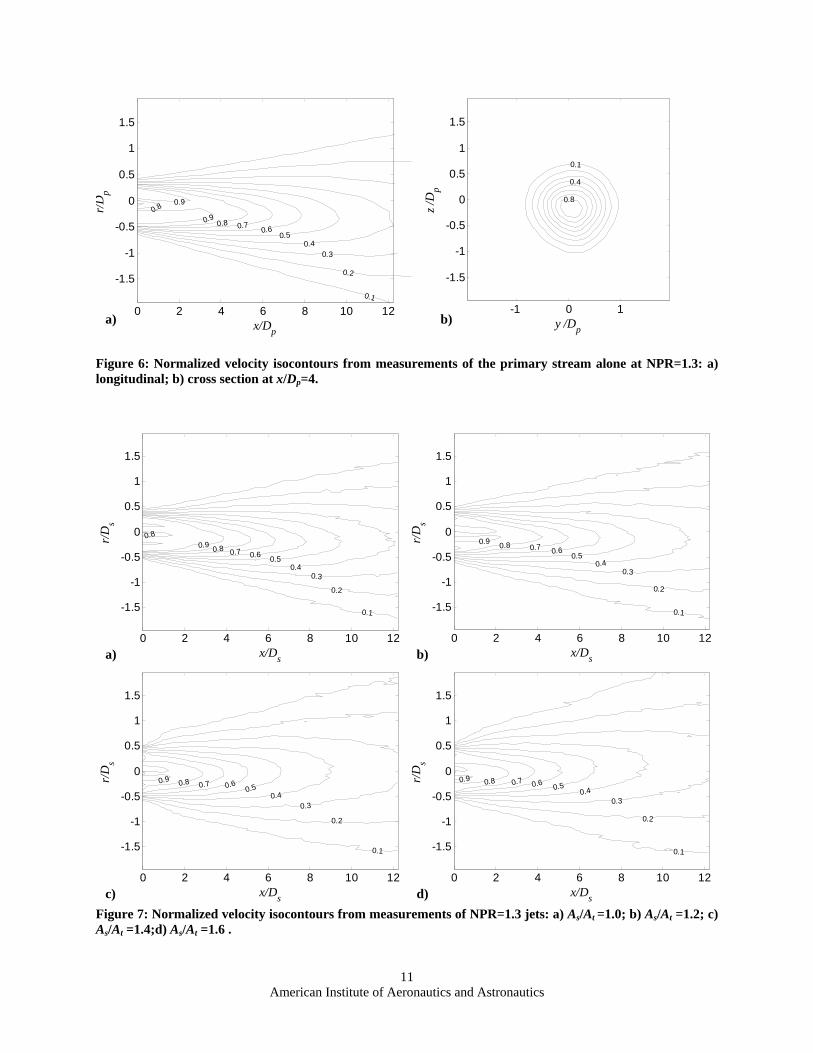
Figure 6 presents the longitudinal and cross-sectional (x/Dp = 4) contours of the primary stream alone at NPR=1.3. Figure 6a reveals that the high-speed region (U/Up > 0.7) extends more than six diameters past the plug tip. Furthermore, the jet is slightly tilted downward. We found this to result from an imperfection of the primary nozzle assembly which produces a small eccentricity of the nozzle plug. This effect is also visible in the cross-section measurement, Fig. 6b, which shows that the core of this jet has regular, round shape but is slightly offset below the axis. Similar effects were observed for several other jets.
Secondary flows at the same total pressure can produce significantly different results based on the values of As/At, Fig. 7. The baseline case (As/At =1.0) is a flow geometrically similar to the primary one, Fig. 7a. This larger, dual-stream flow has more turbulent boundaries. The secondary stream appears to have somewhat straightened the downward tilt of the primary jet. Both the velocity decay of the jet and the thickness of its plume increase with As/At Figs. 7b-d. With As/At =1.4 and 1.6, the benefit of MESPI becomes evident, Figs. 7c and d, as the jet spreads more rapidly and its high-speed region is drastically shortened.
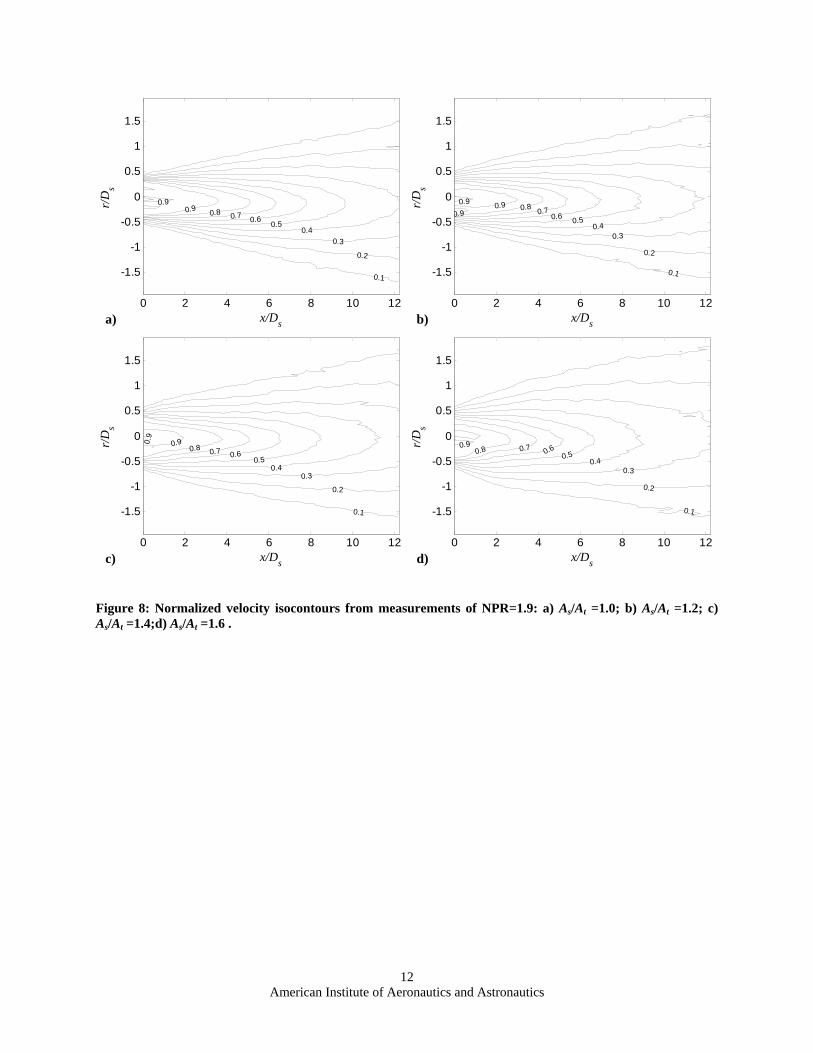
Similar trends were observed at higher NPR values, i.e. a contraction of the jet high-speed region and enhanced mixing and spread of the plume with increasing values of As/At. For instance, Fig. 8 shows the NPR=1.9 jets. The baseline, Fig. 8a, is almost identical to the lower-pressure case in Fig. 7a. MESPI with larger As/At shortens the high-speed region and spreads the plume, Figs. 8b-d, even if slightly less than in the NPR=1.3 jets. Very similar behaviors were found at the intermediate NPR values. All the results indicate that the main parameter controlling the phenomenon is the exit-to-throat ratio As/At of the secondary stream, a finding consistent with previous works on two-dimensional jets20 and with our study of single-stream jets with plug21.
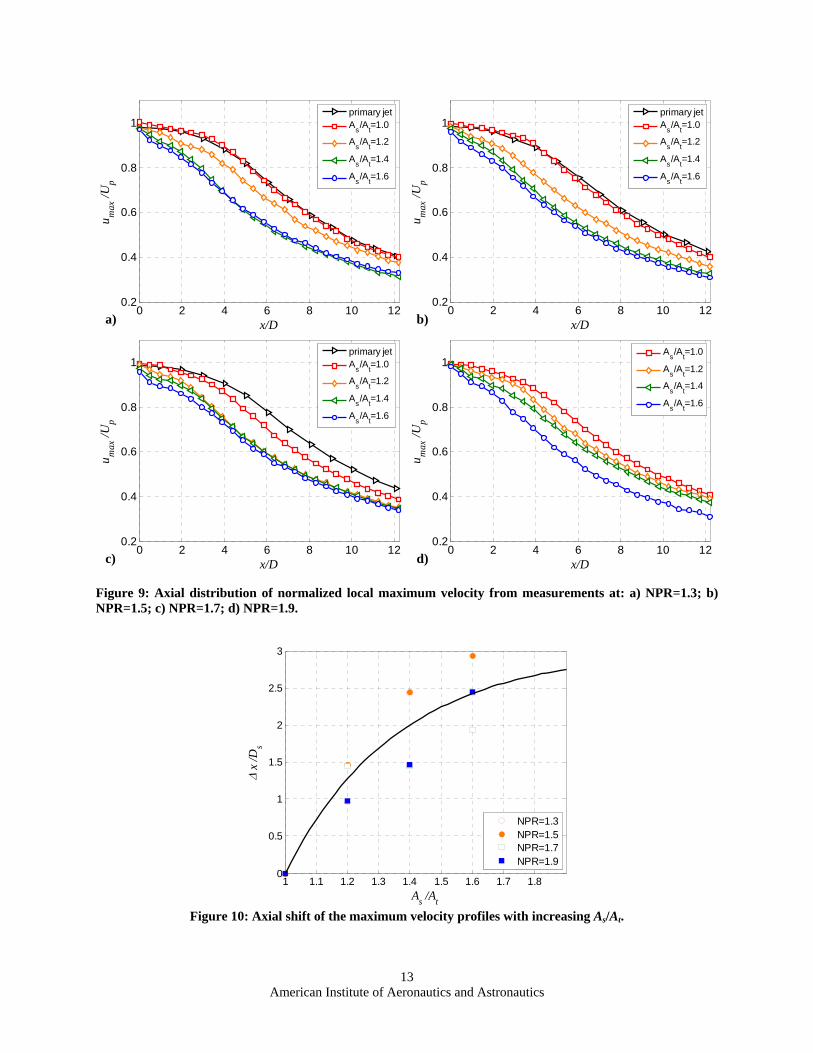
Figure 9 presents the axial distribution of the maximum velocity of all the jets. This parameter is useful to identify the potential core of the jet and its decay as the velocity in the core region is about uniform and produces a nearly flat profile. The normalizing diameter D corresponds to Dp and Ds for the primary and dual-stream cases respectively. The geometrical similarities between the primary and the baseline dual-stream jets at low NPR is corroborated by the good superposition of the corresponding maximum velocity profiles, Figs. 9a and b. We observe that at all NPR the primary and the baseline jets have a potential core which extends by about 2-3 diameters downstream the plug tip. The effect of MESPI is to promote the velocity decay. This effectively amounts to a shift Δx of the whole velocity profiles closer to the nozzles. For each case this shift becomes quite uniform starting one diameter downstream of the plug tip. At all NPRs Δx progressively increases with As/At. This shift corresponds to moving upstream the virtual origin of the jets. Best results are obtained at NPR=1.3 and 1.5 where the shift with As/At=1.4 and 1.6 amounts to as much as 2.5-3 diameters. This effectively eliminates the jet core past the plug. As indicated in Fig. 10, by least-square fitting an asymptotic growth to the available data, we found the shift Δx to increase approximately as
⎥⎦⎤
⎢⎣⎡ −−⋅≈
Δ )/1(1 ts
s
AAbeaD
x (1)
with a=3 and b=2.75.
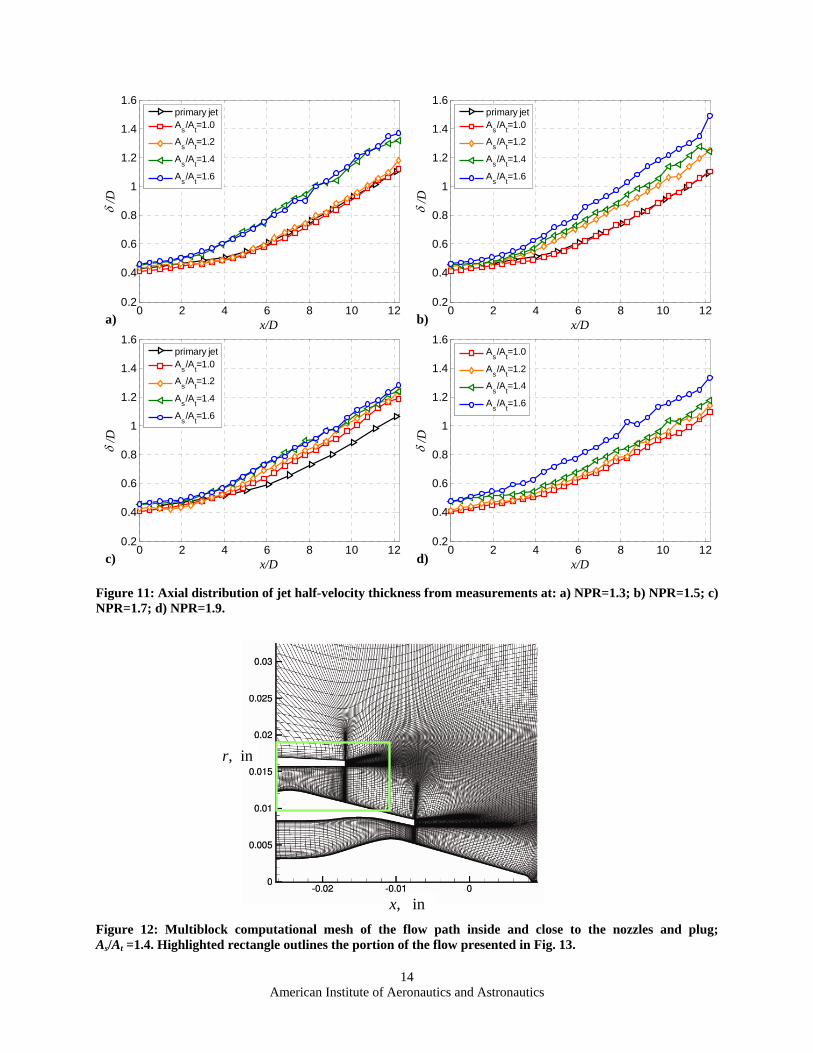
The velocity data support the presence of mixing enhancement. This can be better quantified by using the “half-velocity” thickness δ which is defined as the distance from the jet axis at which the magnitude of the velocity reaches half the value of the corresponding local maximum26. Plots of this quantity are presented in Fig 11 for all the jets. The normalizing diameter is Dp and Ds for the primary and dual-stream cases respectively. At all NPRs the jet thickness increases with As/At. Except at NPR=1.9, the plume with As/At =1.4 closely matches the large spreading of the As/At =1.6 case. At NPR=1.3 and 1.5 the shape of the primary and of the baseline jets coincide, as already noticed. At NPR=1.7 the dual-stream baseline jet spreads faster than the corresponding primary jet. We could not verify if this is a trend as we did not measure the primary jet at NPR=1.9.
The results above indicate that, with the exception of NPR=1.9, the mixing enhancement for As/At =1.4 is virtually the same as for As/At =1.6. This is a relevant finding because the losses of the As/At =1.4 nozzle would be much less than for As/At =1.6.
American Institute of Aeronautics and Astronautics
4
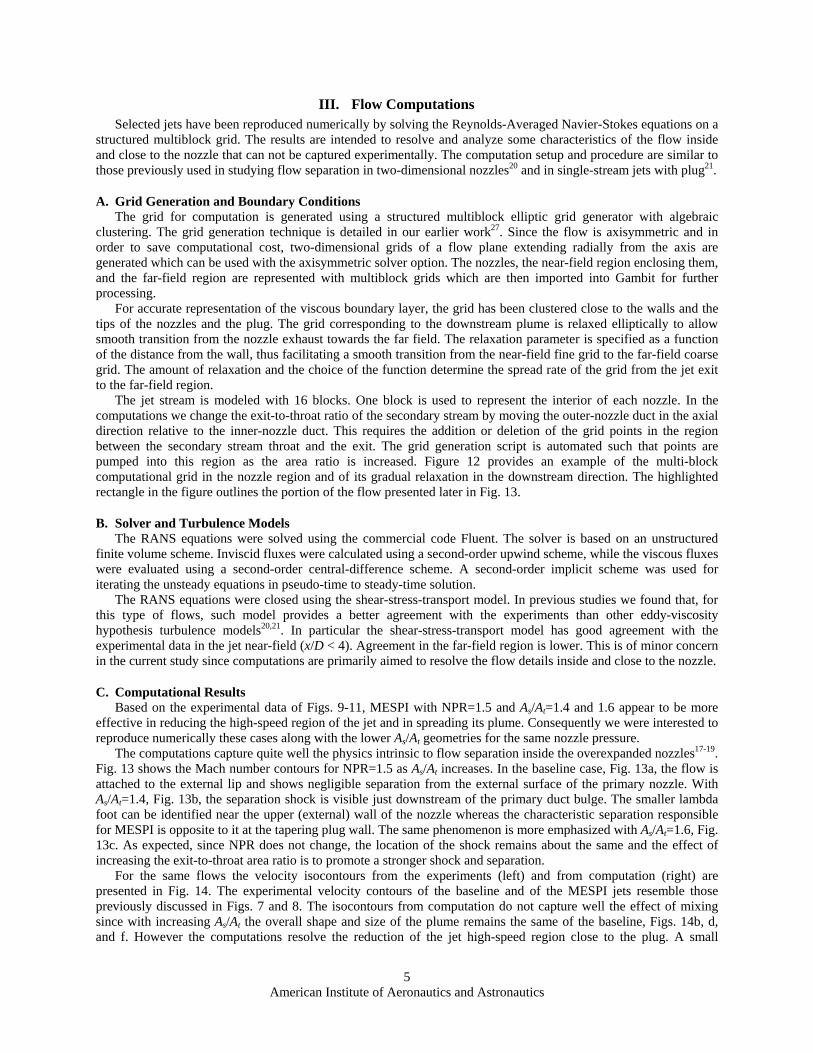
III. Flow Computations Selected jets have been reproduced numerically by solving the Reynolds-Averaged Navier-Stokes equations on a
structured multiblock grid. The results are intended to resolve and analyze some characteristics of the flow inside and close to the nozzle that can not be captured experimentally. The computation setup and procedure are similar to those previously used in studying flow separation in two-dimensional nozzles20 and in single-stream jets with plug21.
A. Grid Generation and Boundary Conditions The grid for computation is generated using a structured multiblock elliptic grid generator with algebraic
clustering. The grid generation technique is detailed in our earlier work27. Since the flow is axisymmetric and in order to save computational cost, two-dimensional grids of a flow plane extending radially from the axis are generated which can be used with the axisymmetric solver option. The nozzles, the near-field region enclosing them, and the far-field region are represented with multiblock grids which are then imported into Gambit for further processing.
For accurate representation of the viscous boundary layer, the grid has been clustered close to the walls and the tips of the nozzles and the plug. The grid corresponding to the downstream plume is relaxed elliptically to allow smooth transition from the nozzle exhaust towards the far field. The relaxation parameter is specified as a function of the distance from the wall, thus facilitating a smooth transition from the near-field fine grid to the far-field coarse grid. The amount of relaxation and the choice of the function determine the spread rate of the grid from the jet exit to the far-field region.
The jet stream is modeled with 16 blocks. One block is used to represent the interior of each nozzle. In the computations we change the exit-to-throat ratio of the secondary stream by moving the outer-nozzle duct in the axial direction relative to the inner-nozzle duct. This requires the addition or deletion of the grid points in the region between the secondary stream throat and the exit. The grid generation script is automated such that points are pumped into this region as the area ratio is increased. Figure 12 provides an example of the multi-block computational grid in the nozzle region and of its gradual relaxation in the downstream direction. The highlighted rectangle in the figure outlines the portion of the flow presented later in Fig. 13.
B. Solver and Turbulence Models The RANS equations were solved using the commercial code Fluent. The solver is based on an unstructured
finite volume scheme. Inviscid fluxes were calculated using a second-order upwind scheme, while the viscous fluxes were evaluated using a second-order central-difference scheme. A second-order implicit scheme was used for iterating the unsteady equations in pseudo-time to steady-time solution.
The RANS equations were closed using the shear-stress-transport model. In previous studies we found that, for this type of flows, such model provides a better agreement with the experiments than other eddy-viscosity hypothesis turbulence models20,21. In particular the shear-stress-transport model has good agreement with the experimental data in the jet near-field (x/D < 4). Agreement in the far-field region is lower. This is of minor concern in the current study since computations are primarily aimed to resolve the flow details inside and close to the nozzle.
C. Computational Results Based on the experimental data of Figs. 9-11, MESPI with NPR=1.5 and As/At=1.4 and 1.6 appear to be more
effective in reducing the high-speed region of the jet and in spreading its plume. Consequently we were interested to reproduce numerically these cases along with the lower As/At geometries for the same nozzle pressure.
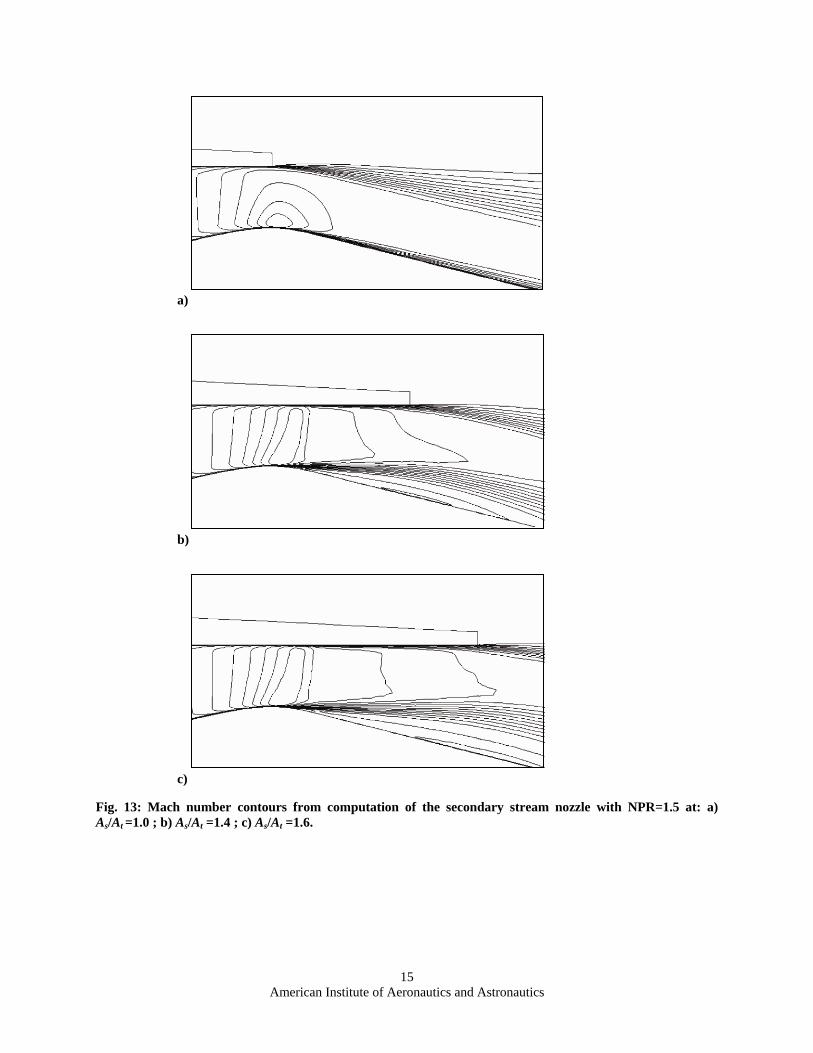
The computations capture quite well the physics intrinsic to flow separation inside the overexpanded nozzles17-19. Fig. 13 shows the Mach number contours for NPR=1.5 as As/At increases. In the baseline case, Fig. 13a, the flow is attached to the external lip and shows negligible separation from the external surface of the primary nozzle. With As/At=1.4, Fig. 13b, the separation shock is visible just downstream of the primary duct bulge. The smaller lambda foot can be identified near the upper (external) wall of the nozzle whereas the characteristic separation responsible for MESPI is opposite to it at the tapering plug wall. The same phenomenon is more emphasized with As/At=1.6, Fig. 13c. As expected, since NPR does not change, the location of the shock remains about the same and the effect of increasing the exit-to-throat area ratio is to promote a stronger shock and separation.
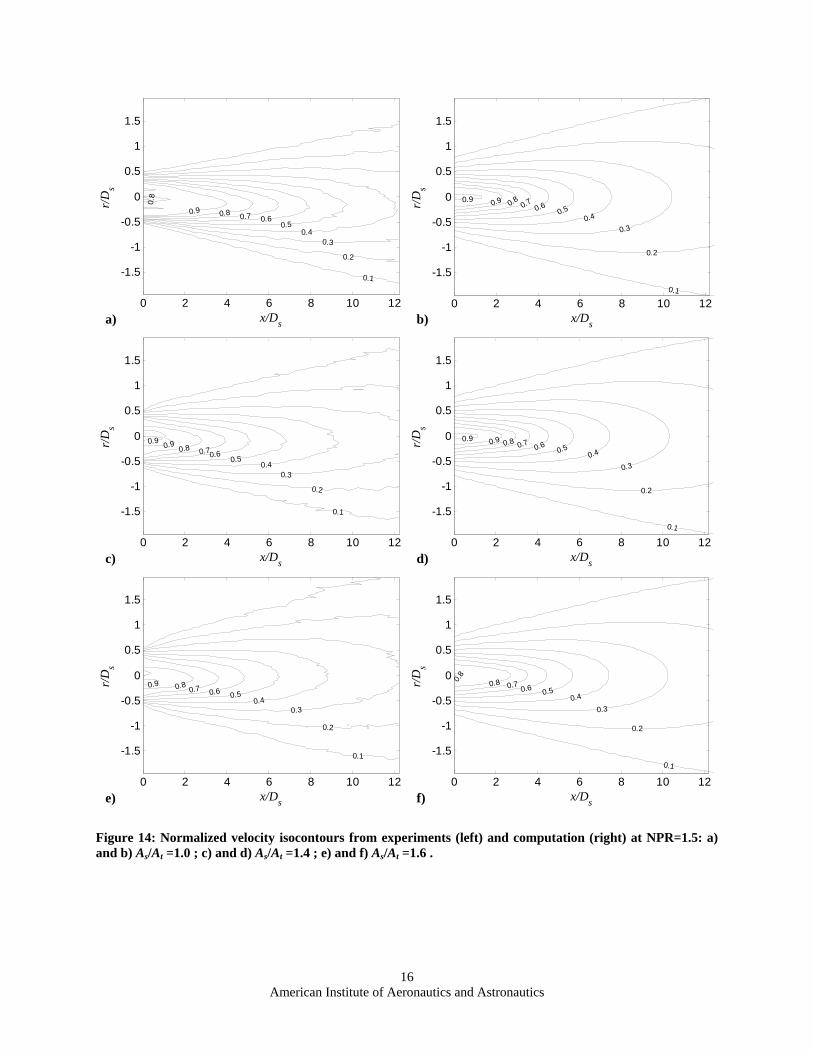
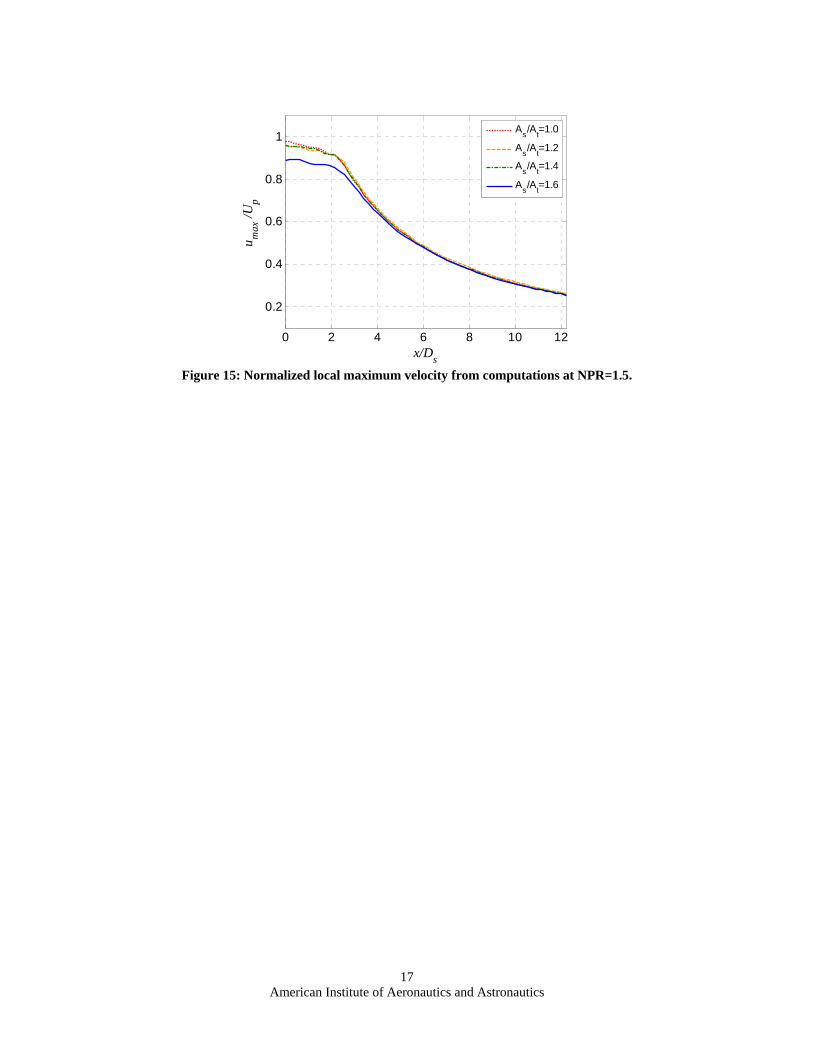
For the same flows the velocity isocontours from the experiments (left) and from computation (right) are presented in Fig. 14. The experimental velocity contours of the baseline and of the MESPI jets resemble those previously discussed in Figs. 7 and 8. The isocontours from computation do not capture well the effect of mixing since with increasing As/At the overall shape and size of the plume remains the same of the baseline, Figs. 14b, d, and f. However the computations resolve the reduction of the jet high-speed region close to the plug. A small
American Institute of Aeronautics and Astronautics
5
reduction is identifiable in Fig. 14d compared to the baseline in Fig. 14b. The effect then becomes very evident with As/At=1.6 in Fig. 14f. The profiles of the local maximum velocity in Figure 15 visualize well this result. Increasing the area ratio of the secondary nozzle decreases the jet velocity close to the plug (x/D < 2). Further downstream the velocity profiles collapse and the computations fail to resolve the variations introduced by different nozzle geometries.
IV. Conclusion Velocity measurements were done on small-scale subsonic jets from nozzles replicating high-bypass turbofans.
The results indicate that Mixing Enhancement using Secondary Parallel Injection (MESPI) shortens the high-speed region of the jet and increases the mixing in the plume. The main parameter controlling the phenomenon is the exit-to-throat area ratio of the secondary (fan) flow. Increasing this ratio promotes a stronger flow separation and attendant MESPI. The effect of nozzle pressure ratio, which ranged from 1.3 to 1.9, is relatively minor. A nozzle with exit-to-throat area ratio of 1.6 can shorten the high-speed region of the jet by as much as 3 fan diameters, thus virtually eliminating the primary potential core, while enhancing the mixing and growth of the plume. A more moderate area ratio of 1.4 provides almost identical results with the introduction of lower losses. The findings are consistent with previous studies of the separation in symmetric two-dimensional nozzles20 and with a study on applying a similar technique to round, single-stream jets with plugs21.
For selected flow cases we used Fluent to solve the Reynolds-Averaged Navier-Stokes equations in conjunction with the shear-stress-transport model for turbulence. The computations resolve the fundamental features of the flow separation inside the secondary nozzle that is responsible for MESPI. The corresponding data capture some of the jet characteristic near the nozzle like the decrease of jet velocity. Starting a few diameters downstream of the plug tip, the computations do not reproduce well the behavior of jets.
Visualization of the mixing plume and acoustic measurements of the radiated noise are planned as future work which will provide additional insight on the effectiveness of the MESPI treatment especially in regard to jet noise emission.
Acknowledgments We are grateful to Mr. Lim Kim Seng for his assistance with constructing the jets and running the experiments.
American Institute of Aeronautics and Astronautics
6
References
1. Knowles, K. and Saddington, A. J., “A review of jet mixing enhancement for aircraft propulsion applications,”
Proceedings of the Institution of Mechanical Engineers, Part G: Journal of Aerospace Engineering, Vol. 220, No. 2, 2006, pp. 103-127.
2. Tillman, T. G., Patrick, W. P., and Paterson, R. W., “Enhanced mixing of supersonic jets,” Journal of Propulsion and Power, Vol. 7, No. 6, 1991, pp.1006-1014.
3. Quinn, W. R., “Turbulent mixing in a free jet issuing from a low aspect ratio contoured rectangular nozzle,” Aeronaut. Journal, Vol. 99, 1997, pp. 337-342.
4. Ho, C-H. and Gutmark, E., “Vortex induction and mass entrainment in a small-aspect-ratio elliptic jet,” Journal of Fluid Mechanics, Vol. 179, 1987, pp. 383-405.
5. Baty, R. S., Seiner, .M., and Ponton, M. K., “Instability of a supersonic shock-free elliptic jet,” AIAA Paper 90-3959. 6. Westley, R., and Lilley, G. M., “An Investigation of the Noise Field from a Small Jet and Methods for Its Reduction,”
College of Aeronautics, Report 53, Cranfield Univ., England, UK, 1952. 7. Seiner, J. M. and Gilinski, M. M., “Nozzle Thrust Optimization While Reducing Jet Noise,” AIAA Journal, Vol. 35,
No.3, 1997, pp. 420-427. 8. Hu, H., Kobayashi, T., Saga, T., Segawa, S., and Tanuguchi, N., “Particle image velocimetry and planar laser-induced
fluorescence measurements on lobed jet mixing flows,” Experiments in Fluids, Vol. 29, 2000, pp. 141-157. 9. Ahuja, K. K. and Brown, W. H., “Shear Flow Control by Mechanical Tabs,” AIAA Paper 89-0994. 10. Zaman, K. B. M. Q., Reeder, M. F., and Samimy, M., “Control of an Axisymmetic Jet Using Vortex Generators,”
Physics of Fluids, Vol. 6, No. 2, 1994, pp. 778-796. 11. Samimy, M., Kim, J.-H., Clancy, P. S., and Martens, S., “Passive Control of Supersonic Rectangular Jets via Nozzle
Trailing-Edge Modifications,” AIAA Journal, Vol. 36, No.7, 1998, pp. 1230-1239. 12. B. Callender, E. J. Gutmark, S. Martens, “Far-Field Acoustic Investigation into Chevron Nozzle Mechanisms and
Trends,” AIAA Journal, Vol. 43, No. 1, 2004, pp.87-95. 13. Seiner, J. M. and Grosch, C. E., “Mixing Enhancement by Tabs in Round Supersonic Jets,” AIAA Paper 98-2326. 14. Zaman, K. B. M. Q., “Jet Spreading Increase by Passive Control and Associated Performance Penalty,” AIAA Paper
99-3505. 15. Papamoschou, D., “Mixing Enhancement Using Axial Flow,” AIAA Paper 2000-0093. 16. Zaman, K. B. M. Q, and Papamoschou, D., “Study of Mixing Enhancement Observed with a Co-Annular Nozzle
Configuration,” AIAA Paper 2000-0094. 17. Papamoschou, D. and Zill, A., “Fundamental Investigation of Supersonic Nozzle Flow Separation,” AIAA-2004-1111. 18. Xiao, Q., Tsai, H. M., and Papamoschou, D., “Numerical Investigation of Supersonic Nozzle Flow Separation,” AIAA
Paper 2005-4640. 19. Papamoschou, D. and Johnson, A., “Unsteady Phenomena in Supersonic Nozzle Flow Separation,” AIAA Paper 2006-
3360. 20. Xiao, Q., Tsai, H. M., and Papamoschou, D., “Numerical Study of Jet Plume Instability from an Overexpanded
Nozzle,” AIAA Paper 2007-1319. 21. Debiasi, M., Dhanabalan, S. S., Tsai, H. M., and Papamoschou, D., “Investigation of Mixing Enhancement using Axial
Flow in Single-Stream Jets with Plug,” to be submitted to the AIAA Journal. 22. Papamoschou, D. and Nishi, K. A., “Jet Noise Suppression with Fan Flow Deflectors in Realistic-Shaped Nozzle,”
AIAA Paper 2005-0993. 23. Papamoschou, D. and Shupe, R. S., “Effect of Nozzle Geometry on Jet Noise Reduction Using Fan Flow Deflectors,”
AIAA Paper 2006-2707. 24. Janardan, B. A., Hoff, G. E., Barter, J. W., Martens, S., Gliebe, P. R., Mengle, V., and Dalton, W. N., “AST Critical
Propulsion and Noise Reduction Technologies for Future Commercial Subsonic Engines Separate-Flow Exhaust System Noise Reduction Concept Evaluation,” NASA CR 2000-210039.
25. Saiyed, N. H., Mikkelsen, K. L. and Bridges, J. E., “Acoustics and thrust of separate-flow high-bypass-ratio engines”, AIAA Journal, Vol. 41, No. 3, 2003, pp. 372-378.
26. Papamoschou, D., Dixon, T. T., and Nishi, K. A., “Mean Flow of Multistream Rectangular Jets under Normal and Mixing Enhancement Conditions,” AIAA Paper 2004-0919.
27. Dhanabalan, S. S, and Tsai, H. R., “An Algebraic Elliptic Grid Generator with Grid Spacing Control,” AIAA Paper 2006-0949.
American Institute of Aeronautics and Astronautics
7
Table 1 Flow nomenclature and conditions NPR Mp Up
m/s t
s
AA
Type Ms Us
m/s
1.3 0.62 210 0.0 ◊ - - - 1.3 0.62 210 1.0 S 0.62 210 1.3 0.62 210 1.2 I 0.62 208 1.3 0.62 210 1.4 I 0.58 197 1.3 0.62 210 1.6 I 0.59 203 1.5 0.78 258 0.0 ◊ - - - 1.5 0.78 258 1.0 S 0.78 258 1.5 0.78 258 1.2 I 0.74 246 1.5 0.78 258 1.4 I 0.71 235 1.5 0.78 258 1.6 I 0.76 251 1.7 0.91 293 0.0 ◊ - - - 1.7 0.91 293 1.0 S 0.91 293 1.7 0.91 293 1.2 I 0.86 281 1.7 0.91 293 1.4 I 0.81 265 1.7 0.91 293 1.6 I 0.89 288 1.9 1.0 320 0.0 ♦ - - - 1.9 1.0 320 1.0 O 1.0 320 1.9 1.0 320 1.2 I - - 1.9 1.0 320 1.4 I - - 1.9 1.0 320 1.6 I - -
◊ Primary jet alone ♦ Velocity measurements have not been performed for this case
Figure 1: Supersonic nozzle flow separation: spark schlieren image (left); schematic of principal phenomena (right)19.
American Institute of Aeronautics and Astronautics
8
Figure 2: Three-dimensional drawing of the dual-stream coaxial nozzles with plug; As/At=1.0 .
0.0
0.5
1.0
1.5
2.0
-5 -4 -3 -2 -1 0 1x, in
r, in l
Figure 3: Section of the dual-stream coaxial nozzles with radial coordinates and primary to secondary nozzle lip distance; As/At=1.0.
American Institute of Aeronautics and Astronautics
9
Figure 4: Schematic of the dual-stream jet facility.
D s
Δr mm1.0 mm ID
12.5 mm
70 mm
x
r
Figure 5: Schematic of the Pitot rake for mean velocity measurements.
American Institute of Aeronautics and Astronautics
10
Figure 6: Normalized velocity isocontours from measurements of the primary stream alone at NPR=1.3: a) longitudinal; b) cross section at x/Dp=4. Figure 7: Normalized velocity isocontours from measurements of NPR=1.3 jets: a) As/At =1.0; b) As/At =1.2; c) As/At =1.4;d) As/At =1.6 .
a) x/Dp
r/D
b)
b) a)
c) d)
p
0.80.9
0.9 0.8 0.7 0.60.5
0.40.3
0.2
0.1
0 2 4 6 8 10 12
-1.5
-1
-0.5
0
0.5
1
y /Dp
z /D
p
0.8
0.4
0.1
-1 0 1
-1.5
-1
-0.5
0
0.5
1
1.51.5
x/Ds
r/D
s
0.80.9 0.8 0.7 0.6 0.5
0.40.3
0.2
0.1
0 2 4 6 8 10 12
-1.5
-1
-0.5
0
0.5
1
1.5
x/Ds
r/D
s
0.9 0.8 0.7 0.60.5
0.40.3
0.2
0.1
0 2 4 6 8 10 12
-1.5
-1
-0.5
0
0.5
1
1.5
x/Ds
r/D
s
0.9 0.8 0.7 0.60.5
0.40.3
0.2
0.1
0 2 4 6 8 10 12
-1.5
-1
-0.5
0
0.5
1
1.5
x/Ds
r/D
s
0.9 0.8 0.7 0.6 0.50.4
0.3
0.2
0.1
0 2 4 6 8 10 12
-1.5
-1
-0.5
0
0.5
1
1.5
American Institute of Aeronautics and Astronautics
11
x/Ds
Figure 8: Normalized velocity isocontours from measurements of NPR=1.9: a) As/At =1.0; b) As/At =1.2; c) As/At =1.4;d) As/At =1.6 .
x/Ds
r/D
s
0.90.9
0.9 0.8 0.70.6 0.5
0.40.3
0.2
0.1
0 2 4 6 8 10 12
-1.5
-1
-0.5
0
0.5
1
1.5r/
Ds
0.90.9 0.8 0.7 0.6 0.5
0.40.3
0.2
0.1
0 2 4 6 8 10 12
-1.5
-1
-0.5
0
0.5
1
1.5
a) b)
c) x/Ds d)
r/D
s
0.9
0.90.8 0.7 0.6
0.50.4
0.3
0.2
0.1
0 2 4 6 8 10 12
-1.5
-1
-0.5
0
0.5
1
x/Ds
r/D
s
0.90.8 0.7 0.6
0.50.4
0.3
0.2
0.1
0 2 4 6 8 10 12
-1.5
-1
-0.5
0
0.5
1
1.51.5
American Institute of Aeronautics and Astronautics
12
Figure 9: Axial distribution of normalized local maximum velocity from measurements at: a) NPR=1.3; b) NPR=1.5; c) NPR=1.7; d) NPR=1.9.
1 1.1 1.2 1.3 1.4 1.5 1.6 1.7 1.80
0.5
1
1.5
2
2.5
3
As /At
Δ x
/Ds
NPR=1.3NPR=1.5NPR=1.7NPR=1.9
Figure 10: Axial shift of the maximum velocity profiles with increasing As/At.
a) b)
d) c) 0 2 4 6 8 10 12
0.2
0.4
0.6
0.8
1
x/D
u max
/Up
As/At=1.0
As/At=1.2
As/At=1.4
As/At=1.6
0 2 4 6 8 10 120.2
0.4
0.6
0.8
1
x/D
u max
p
/U
primary jetAs/At=1.0
As/At=1.2
As/At=1.4
As/At=1.6
0 2 4 6 8 10 120.2
0.4
0.6
0.8
1
x/D
max
p
u
/Uprimary jetAs/At=1.0
As/At=1.2
As/At=1.4
As/At=1.6
0 2 4 6 8 10 120.2
0.4
0.6
0.8
1
x/D
u max
/Up
primary jetAs/At=1.0
As/At=1.2
As/At=1.4
As/At=1.6
American Institute of Aeronautics and Astronautics
13
1.6
Figure 11: Axial distribution of jet half-velocity thickness from measurements at: a) NPR=1.3; b) NPR=1.5; c) NPR=1.7; d) NPR=1.9.
Figure 12: Multiblock computational mesh of the flow path inside and close to the nozzles and plug; As/At =1.4. Highlighted rectangle outlines the portion of the flow presented in Fig. 13.
x, in
r, in
a)
c)
b)
d) 0 2 4 6 8 10 12
0.2
0.4
0.6
0.8
1
1.2
1.4
1.6
x/D
/D
δ
As/At=1.0
As/At=1.2
As/At=1.4
As/At=1.6
0 2 4 6 8 10 120.2
0.4
0.6
0.8
1
1.2
1.4
1.6
x/D
/D
δ
primary jetAs/At=1.0
As/At=1.2
As/At=1.4
As/At=1.6
1.6
0 2 4 6 8 10 120.2
0.4
0.6
0.8
1
1.2
1.4
x/D
/D
δ
primary jetAs/At=1.0
As/At=1.2
As/At=1.4
As/At=1.6
0 2 4 6 8 10 120.2
0.4
0.6
0.8
1
1.2
1.4
x/D
δ /D
primary jetAs/At=1.0
As/At=1.2
As/At=1.4
As/At=1.6
American Institute of Aeronautics and Astronautics
14
a)
b)
c)
Fig. 13: Mach number contours from computation of the secondary stream nozzle with NPR=1.5 at: a) As/At =1.0 ; b) As/At =1.4 ; c) As/At =1.6.
American Institute of Aeronautics and Astronautics
15
Figure 14: Normalized velocity isocontours from experiments (left) and computation (right) at NPR=1.5: a) and b) As/At =1.0 ; c) and d) As/At =1.4 ; e) and f) As/At =1.6 .
x/Ds
r/D
s
0.9 0.8 0.7 0.6 0.50.4
0.3
0.2
0.1
0 2 4 6 8 10 12
-1.5
-1
-0.5
0
0.5
1
1.5
x/Ds
s
0.9 0.9 0.8 0.70.60.5
0.40.3
0.2
0.1
r/D
0 2 4 6 8 10 12
-1.5
-1
-0.5
0
0.5
1
1.5
x/Ds
s
0.8
0.9 0.8 0.7 0.60.5
0.40.3
0.2
0.1
r/D
0 2 4 6 8 10 12
-1.5
-1
-0.5
0
0.5
1
1.5
a) b)
c)
e)
d)
f) x/Ds
r/D
s
0.8
0.8 0.7 0.6 0.50.4
0.3
0.2
0.1
0 2 4 6 8 10 12
-1.5
-1
-0.5
0
0.5
1
1.5
x/Ds
r/D
s
0.9 0.9 0.8 0.7 0.6 0.50.4
0.3
0.2
0.1
0 2 4 6 8 10 12
-1.5
-1
-0.5
0
0.5
1
1.5
x/Ds
r/D
s
0.9 0.9 0.8 0.7 0.6 0.50.4
0.3
0.2
0.1
0 2 4 6 8 10 12
-1.5
-1
-0.5
0
0.5
1
1.5
American Institute of Aeronautics and Astronautics
16
0 2 4 6 8 10 12
0.2
0.4
0.6
0.8
1
x/Ds
u max
/Up
As/At=1.0
As/At=1.2
As/At=1.4
As/At=1.6
Figure 15: Normalized local maximum velocity from computations at NPR=1.5.
American Institute of Aeronautics and Astronautics