39
September 2021 Mizuho IR Day 2021

September 2021
Mizuho IR Day 2021

2
Contents
1. Retail & Business Banking Company
2. Corporate & Institutional Company
3. Global Corporate Company
4. Global Markets Company
5. Asset Management Company
P. 3
P. 12
P. 19
P. 26
P. 32

Retail & Business Banking Company

4
(JPY B) FY19 FY20FY21
Plan Q1 YoY
Gross Profits 676.4 697.7 698.0 162.6 +16.1
G&A Expenses -673.1 -639.6 -628.0 -161.4 -0.7
Net Business
Profits12.2 61.3 75.0 6.7 +19.8
Net Income -17.1 19.5 10.0 -5.9 +15.1
ROE - 0.9% 0.5% -1.2% +2.7%
△ 100
400
900
1,4 00
1,9 00
2,4 00
5,000
5,050
5,100
5,150
5,200
5,250
5,300
5,350
5,400
5,450
5,500
5,550
5,600
5,650
5,700
5,750
5,800
5,850
5,900
5,950
6,000
6,050
6,100
6,150
6,200
6,250
6,300
6,350
6,400
6,450
6,500
6,550
6,600
6,650
6,700
6,750
6,800
6,850
6,900
6,950
7,000
7,050
7,100
7,150
7,200
7,250
7,300
7,350
7,400
Gross Profits ExpensesNet Business Profits
Results
Key strategies of Retail & Business Banking Company (RBC)
Business environment and strategy progress Key strategies for FY21
Basic
policy
View of
the
environ-
ment
Direction of initiatives
FY18
Earnings plan
1. FY20 accounting rules are applied for FY19 figures, while FY21 accounting rules are applied for FY20 and FY21 figures. 2. Credit-related costs of -JPY 39.3B recorded from a forward-looking perspective on head office account in FY19 were allocated to Retail & Business Banking and Corporate & Institutional Company on an actual basis both in FY19 and FY20.
1
2
Credit-related costs
FY19 FY20 FY21
(plan)
FY23
(plan)
First increase
in three years
Preventive initiatives
Expansion of stable
income
▲ 1,000
▲ 800
▲ 600
▲ 400
▲ 200
0
200
FY2019 FY2020FY2021
(plan))FY2021
(1Q)
Whereas lingering COVID-19 impact, digitalization of
overall society is accelerated, individuals revise life plans
and corporate performance become increasingly
polarized amid recovery phase from COVID-19
Promote face-to-face and digital business that addresses
respective corporate and individual customers’ diversifying
needs toward conversion to the post-COVID-19 new
normal
Assistance for business improvement plan
formulation
Utilization of quasi-equity loans through
collaboration with government-affiliated
financial institutions
1
Strengthen
face-to-face
consulting
Enhancement of comprehensive asset
consulting to meet individual customers’
needs for personal life design planning
and revision
Improvement of targeting strategy for
corporate customers and strengthening
capabilities to meet customers’ needs
2
Get digital
business into
full gear
Strengthening capabilities to meet
customers’ needs with enhanced digital
marketing and alliances with partners
3
Strengthen
business
foundation
Reallocation of business resources with
continuance of cost reductions
Strengthening engagement with customers

5
• Face-to-face retail business
- Improvement in income structure through
enhancing asset management balance
and productivity
• Face-to-face corporate business
- Promotion of loan income structure
reforms
• Digital business
- Strengthening capabilities to meet
customers’ needs with enhancement of
digital marketing, etc.
• Expenses
- Steady promotion of cost reduction
measures and reallocation to digital
services areas
Toward expansion of stable revenue base
Stable revenue accumulation: +JPY 23.0B
(FY18→FY20)
Progress with strategiesEnvironment changes
Gross profit impact in FY20: - JPY 40.0B
• COVID-19 impact (consumption pullback,
lower investment, etc.)
• Impact of lower interest rates and
regulatory changes
Acceleration of initiativesFrom
FY21
Improve cost return
Improve risk return and ROE
5-Year Business Plan
Further expand out stable
revenue base through structural reforms
・Net business profits +JPY 150.0B(FY18→FY23)
(FG total +JPY 300.0B)
・o/w Stable revenue +JPY 100.0B
(FY18→FY23)
(FG total +JPY 170.0B)
0
500
1,000
1,500
2,000
2,500
FY18 FY23 Plan
Upside
Stable revenue
57%
40%
RBC Net Business Profits
+100.0
+150.0
1. Recurring revenue, such as interest and settlement income(NBP basis). In-house company management accounting basis
Direction of response
to current structural issues
1
• Succeeded in unified group strategy with
focus on global equity strategy and
significantly increase equity investment
trusts
• Reversed the decline of loan spread with
funding assistance and response to
COVID-19-related needs
• Built alliances with major platformers as an
alliance precursor
• Realized cost reduction exceeding the
initial plan through steadfast cost reforms

6
Strengthen face-to-face consulting (retail business (1))
Shift household financial assets in Japan towards growth opportunities, contribute to enhanced prosperity
Enhancing proposal capabilities – “Life design” partner
FD
Improve “listening” Accelerate “visualization”
En
han
ce
me
nt
DX supplementation of consulting
capabilities• Life design navigation (BK)
• Next Best Action (SC)
Org
an
iz
ati
on ・Reorganization of BK branch network
- Specialize in retail sales and enhance TB/SC collaboration via small area operation
R&I customer-centric investment trust sales company evaluation (FY20)
Industry-first top rating for 4 group companies (FG・BK・TB・SC)
SC TB
Diverse
asset
management
needsNext-generation life plan
support
Asset
succession
needs
Comprehensive asset management
consulting aimed at realizing each
customer’s life plan
BK
・Support diverse asset management
・Provide valuable investment information
・Support succession to the next
generation and asset utilization・Understand each customer’s life plan and coordinate to provide unified solutions as a group
Asset management
needsCreating Japan’s
future
Leveraging Japanese
assets globally
Bridge Japanese
assets to the future
Asset management needs Asset succession needsAsset building needs
Advanced asset management
consultingAsset succession and
real estate consulting
Broaden the advice universe and reliably provide comprehensive financial services that cover the diversifying life portfolio of customers
Comprehensive asset management consulting through unified group management (Newly formed a Personal Asset Management
Business Strategy Department at FG)
Lower sales fees
and
compensation
rates
Sharpening the
scope of products
lineup for face-to-
face sales
Unification of trust
fee
Early rollout of
important
information sheets
for ‘individual
products edition’Internet funds, cumulative
trusts,, fund wrap
Index funds for face-to-face sales correlating of
the same indexSC 82 fundsPhased rollout from
August 6, 2021
• Transparent results
disclosure
• Horizontal expansion of
success cases
• Refinement of targeting
• Deeper understanding of
customers
• Enhancing accumulation of
information
• Personalized proposals

7
58.5
FY19 FY20 FY21(plan)
FY22(outlook)
FY23(outlook)
Strengthen face-to-face consulting (retail business (2))
Customer satisfaction improvement and further expansion of stable revenue base
0.3
4.5
0.0
1.6
Mar-17 Mar-18 Mar-19 Mar-20 Mar-21 Aug-21
Global equity fundbalance
Valuation income +realized income
Concept 【 Time, Not Timing 】
【Figure 2】 Global equity fund balance
(FG) (JPY T)
4.1
7.1
6.5%
8.7%
6.0%
6.5%
7.0%
7.5%
8.0%
8.5%
9.0%
0.0
1.0
2.0
3.0
4.0
5.0
6.0
7.0
8.0
Mar-17 Mar-18 Mar-19 Mar-20 Mar-21 Jun-21
Equity investmenttrusts balance
Industry share
【Figure 8】 Will trusts
consigned asset value (TB)(JPY T)
5.6
7.9
Mar-18 Mar-19 Mar-21 Jul-21
Finanial assets, etc.
Real estate
【Figure 3】 Equity investment
trust average holding period
(FG/SC)(Year)
【Figure 1】 Equity investment
trusts (FG) (JPY T)
【Figure 7】 Fund wrap –
Monthly sales (SC/BK)
(JPY B/month)
【Figure 6】 LPA-based asset
formation product – Monthly new
contracts (BK)(contracts/month)
1,813
5,898
FY20H1
FY20 H2
FY21Q1
Jun-21
2.9
4.5
2.5
5.1
2.83.1
Mar-17 Mar-18 Mar-19 Mar-20 Mar-21 Aug-21
FG
SC
Industry average
【Figure 5】 Stable revenue ratio
(SC)
13.4%
28.9%
FY16 FY17 FY18 FY19 FY20 FY21 H1(outlook)
0.6
30.2
FY20H1
FY20H2
FY21Q1
FY21Q2
1
3
5
6
7
1. Combined value of 16 funds selected based on our global equity strategy. 2. Calculated by dividing previous-year’s average balance by total cancellations/redemption value. 3. Prepared based on data
published by Investment Trusts Association, Japan. 4. Industry (total) value from end-Jul 2021 data. 5. SC retail and corporate division (corporate and individual total) stable income (investment trust agent fees,
insurance agent fees, fund wrap-related income) ÷ expenses. 6. Life Plan Advisor. 7. Installment investment trust, level payment insurance, iDeCo
【Figure 4】 Stable revenue (FG)(JPY B/Gross Profits basis)
Basic policy
Proposal focus Global equity strategy 4
2
2
Goals-based wealth management
Accumulate investment success experiences through
diversified investment – Long term, diversified, and
continuous
Contribute to improve prosperity by Shifting lopsided Japanese
household assets (yen-denominated, deposits) towards strong
global economic growth potential

8
Strengthen face-to-face consulting (corporate business)
Strengthen capabilities to respond to customer needsProvide solutions through enhanced relationships
Support sustainability initiatives in both offensive and defensive
ways through engagement with clients
Support responding to sustainability
Deal pipeline
21年4月末 21年7月末Apr-21 Jul-21
x2.9
(Sustainability-related/value)
Upper
middle
• Business structure
changes targeting at
decarbonization, etc.
• Responding to initiative
requests by upstream
transaction companies
• Formulating and fleshing
out SDGs initiative policy
Middle
・Sustainability-
related finance
・Consulting
・Finance to
support SDGs
promotion
Customer needs Solutions
Financing Solution provision
Business succession
Capital policy
Fund liquidity
Capital-type
funds
Respond to customer needs that reflect
COVID-19 impact
Growth
strategy funds
Business
structure
reforms
Growth
strategy
Business and
financial
improvement
Business PF
revision
DX
Sustainability
Non-relative
succession
(MBO)
Stock delisting
Business
expansion
(M&A)
Strengthen customer relationships and abilities to respond to customer needs for the “post COVID-19” phase
Strengthen
relationships
0.57
0.53
0.56
Deal pipeline/value Loan spread (%)
1. Business structure reforms include business succession
Reinforce initiatives that address business structure reformation needs
in light of COVID-19 impact with closer customer relationships via
providing financial support
Enhance targeting strategy that factors in growing polarization and
recovery in corporate activities and strengthen capabilities to address
customers’ needs for segment characteristics
Account plan management
Reinforce solution proposal
capabilities that address
increasingly clear customers’ needs
Understand longer-term customers’
needs and improve effectiveness to
address needs
Targeting strategy Reorganization of branch network
Upper
middle
Middle
Tokyo Metropolitan area
corporate division
Upper-middle corporate
division
Middle corporate division
Specia
lty
corp
ora
te d
ivis
ion
Respond to customer needs with strong
specialization that fits segment
characteristics
Mar-19 Jul-21Jun-20Jul-20 Jul-21
Business structure reform
Growth strategy, etc.
+9% +6%
+10%

9
Get digital business into full gear
Enhanced digital marketing
Alliance initiatives
Strengthen capabilities to respond change in needs
Improve convenience-Digital completion model based on
smartphones
-UI, UX improvement
Improved clients experience-Personalized marketing
Increase the number of Mizuho clients
Priority
implementation
points
Priority use
of business
resources
Reorganization to achieve the goals
Fa
ce
-to
-fa
ce
co
rpo
rate
are
a
Fa
ce
-to
-fa
ce
re
tail
are
a
Organizational reforms (Jul-21)
Mass-market product group
Alliance strategy formulation group
Segment horizontal marketing group
Digital area
Efficient acquisition of customers out of 〈Mizuho〉 reach
Expand loan business and asset formation business
More than one million member sites
Review of joint business with local government entities, companies,
etc.
Joint venture with PayPay Securities (dedicated smartphone-based
securities business)
J.Score- AI score acquisition: approx. 1.4 million
New bank with LINE, scheduled to start business during FY22
Steady increase in LINE Credit’s loan execution value (more than 30
billion yen)
Launch of digital specialty groups and
formation of an intersegment group for
data-driven marketing
Enhancement of
digital marketing
Shift from branch-centric to fully
non face-to-face model
Strengthen capabilities to respond to
customer needs
Mizuho
customers
Non-Mizuho
customers
Reinforced
alliances
Digital business strategy
Acquisition of multi-track clients
Mizuho
customers
Non-Mizuho
customersStrengthen mortgage mainly over remote channel
Improve
convenience of
Internet mortgage
Improve interest-
rate
competitiveness
via cost reforms
over many years
Reversal of new execution
value
Mizuho
customers
0
1,0 00
2,0 00
3,0 00
4,0 00
5,0 00
6,0 00
7,0 00
8,0 00
FY19 FY20 FY21 FY23
Internet Face-to-face
(Plan)
13%
Execu
tion
value
Internet ratio
(Results)
20%
(Results)
12%
(Plan)
36%
【Trend in new execution value】

10
JPY 14.0B in savings
(FY20→FY21)
Strengthen business foundation (1) (reallocation of business resources)
Reallocate expenses reduced exceeding the 5-Year Business Planto important initiatives that contribute to reinforcement of the business foundation
In addition to continuous cost reform initiatives, reallocate
resources to important measures
Overview of
measuresChannel reforms System reforms
Reduce non-
personnel costs
Personnel
optimization
View of
environment
Comprehensive improvements in response to
IT system failures
Promote improved convenience and a stronger
stable revenue base through reinforcement of digital
marketing
Reinforced
digital
investments
Until FY20Overview of
initiatives
From FY21
Cost structure reforms Reallocation of business resources
Promote improved service quality with rigorous
commitment to the customer perspective including
response to IT system failures
Enhanced
service
quality
JPY 76.0B in savings
(FY18→FY20)
• Cost reforms aimed at moving beyond
legacy practices
• Reforms in response to customer
awareness and behavior changes
1. Remote formats taking hold/rising safety and reassurance, etc.
Reallocate business
resources
Prolonged low-rate environment
With/After COVID-19
Outlook for expenses reduction also
exceeds the 5-year Business plan in FY23 Effect
Reinforced
growth
investments
Review and promote further initiatives with growth
potential, such as Asia retail
1

11
Strengthen business foundation (2) (enhance engagement with customers)
Reorganized branch network(BK)
Improving service quality for the client perspective
Aim Capitalize on specialties for companies and individuals and build operations that address accelerated changes in client needs
Expand unit scale of organization management and further promote sales knowhow sharing by teams and collaboration among BK,
TB and SC
Revisions of framework
Multi-layering of interactive communication
between frontline operations and headquarters
Introduction of reservation service
- Provide convenience to busy clients
Enhancement of tablet and MINORI
collaboration
- Shorten customer waiting times through
expansion of available tasks
Enhancement of business operations
Assignment of branch communicators
and headquarter tutors
Appropriately understand and address “trends in customer needs” and
“environment changes” at the suitable timing
Multi-faceted collection and analysis of customer
and frontline voices
For corporate and retail
businesses
Retail, small area
Provide of optimal solutions that factor in customer
characteristics, regionality, and specialty
(innovation companies, foreign-capital companies,
etc.)
Reo
rga
niz
ati
on
Comprehensive
branches
Retail
branches
Mainly for
retail business
Corporate
Engagement office
(EO)
Until FY20 From FY21Business structural
reforms and other
solution resultsCorporate pipeline
Number of personal
customers handled(CR+LPA)
Contact points with EO
transfer companies
19上 20上 21上見込FY19 H1 FY20 H1 FY21 H1
500
550
600
650
700
750
800
850
FY20 FY21
+70,000
people
2.1-
fold
+20%+18%
Establishment of a VoC data analysis team
(estimate)
500
1500
2500
3500
4500
5500
6500
7500
8500
Pre-transfer Post-transfer
Remote service provision utilizing digital capabilities
for smaller companies
Shift from site-level management to small-area
management with core and specialized sites that
focus on business with retail customers
Apr-21 May-21 Jun-21

Corporate & Institutional Company

13
Key strategies of Corporate & Institutional Company (CIC)
Current environment and strategy implementation Key strategies for FY21
Acceleration of corporate actions, such as
the reshuffling of business portfolio,
triggered by the shift in industrial structure
Establishing our
strength in wholesale
banking
Enhanced deal origination through the
introduction of the IG/RG system
Promoting sustainable business
Enhancing products
Controlling credit-related costs
Improving business profitability
Reducing cross-shareholding
Establishing the brand image as “the most reliable wholesale bank” for
improving the corporate value of our clients, supporting their
transformation and innovation.
Prolonged impact of
the pandemic
Increasing focus on
sustainability
Introduction of the Industry/Regional Group (IR/RG) system to provide
enhanced support to our clients in need of transforming their business
structure.
Increased commitment in the strategic investment (SI) field in tandem
with the reduction of cross-shareholding. Steady progress in
transforming our risk-taking strategy.
(JPY B) FY19 FY20FY21
Plan Q1 YoY
Gross Profits 459.5 472.8 466.0 102.0 -10.6
G&A Expenses - 215.7 - 206.5 - 201.0 - 51.0 +2.4
Net Business Profits 245.7 270.1 270.0 52.2 - 8.4
Net Income 194.7 219.6 283.0 79.6 +43.9
ROE - 5.8% 7.6% 8.7% +5.0%
Earnings plan
Key strategies
Basic policy
1. FY20 accounting rules are applied for FY19 figures, while FY21 accounting rules are applied for FY20 and FY21 figures.
2. Credit-related costs of -JPY 39.3B recorded from a forward-looking perspective on head office account in FY19 were allocated to Retail & Business Banking and Corporate & Institutional Company on
an actual basis both in FY19 and FY20.
1
2

14
Enhanced deal origination through the introduction of the IG/RG system
Industry/Regional Group (IG/RG) system
• Each IG will develop expertise in the respective field and, with the
combined banking and securities capabilities, support the clients’
decision making on the strategic level.
• Cross-sector approach to capture M&A and other business
opportunities through collaboration within or across IG/RG(s).
Industries Industry Groups (IG)
Electronic
Automobile
・・・
Trade
Materials
Several
departments
covering the
same industry
ITC
Technology Automobile
Combining synergy-producing sectors
Sustainability
DX
ESG
Cro
ss-g
roup a
ppro
ach
Developing specialists with deep expertise in each sector,
building a framework for seamless deal origination
ITC Retail
Mining Materials
Social Industrial
Financial
sponsorReal estate
New
Normal Re
sp
on
sib
ilit
yA
uth
ori
ty
Gross profit and net income targetsProfit
RWA, capital ratio, RORA and ROE targetsRWA
RWA
HR
Expenses
RWA allocation within each IG/RG
Developing/implementing CDP for sector specialists
Strategic cost allocation
Developing sector specialistsHR
• Facilitating clients’ corporate actions by approaching them with
proposals tailored to their current business environment.
Highlighted initiatives
Delegating responsibility to each IG/RG
Joint investment
Business/financial strategy
discussion for ESG
Joint investment with MHLS
and project finance
Business portfolio transformation
Business/financial strategy
discussion for post-COVID
FA for asset/business sale
15
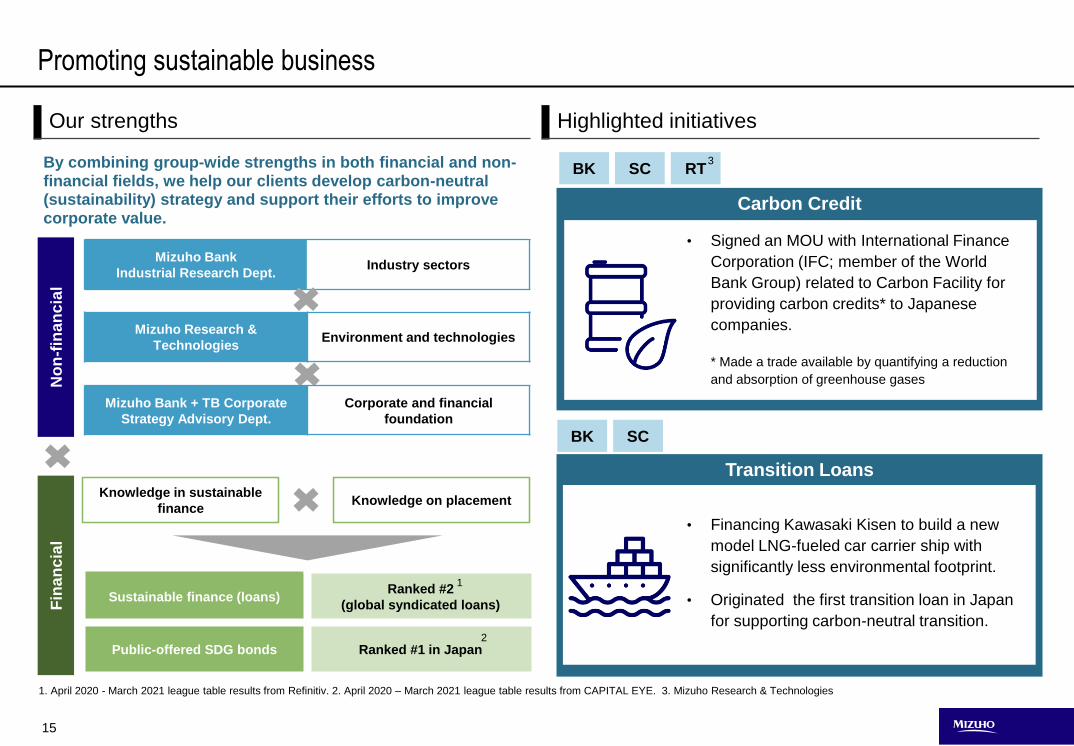
Promoting sustainable business
BK SC
BK SC RTBy combining group-wide strengths in both financial and non-financial fields, we help our clients develop carbon-neutral (sustainability) strategy and support their efforts to improve corporate value.
No
n-f
inan
cia
lF
ina
nc
ial
Mizuho Bank
Industrial Research Dept.Industry sectors
Knowledge on placementKnowledge in sustainable
finance
Mizuho Research &
TechnologiesEnvironment and technologies
Mizuho Bank + TB Corporate
Strategy Advisory Dept.
Corporate and financial
foundation
Transition Loans
• Financing Kawasaki Kisen to build a new
model LNG-fueled car carrier ship with
significantly less environmental footprint.
• Originated the first transition loan in Japan
for supporting carbon-neutral transition.
Carbon Credit
• Signed an MOU with International Finance
Corporation (IFC; member of the World
Bank Group) related to Carbon Facility for
providing carbon credits* to Japanese
companies.
* Made a trade available by quantifying a reduction
and absorption of greenhouse gases
Sustainable finance (loans)Ranked #2
(global syndicated loans)
Public-offered SDG bonds Ranked #1 in Japan
1. April 2020 - March 2021 league table results from Refinitiv. 2. April 2020 – March 2021 league table results from CAPITAL EYE. 3. Mizuho Research & Technologies
3
Highlighted initiativesOur strengths
1
2

16
FY19
実績FY20
実績FY21
計画FY23
計画FY19
実績FY20
実績FY21
計画FY23
計画
Highlighted deals
Real-estate-related fee income
Acquisition finance
Enhancing products
Real estates business value chain
Equity
MezzanineCorporate loans
Clients
• Client base
• Sector insight
• Risk-taking
capacity
• Recapitalization
• Business structure
transformation
Investment plan
(EXP/Balance) 5 Profit plan (Gross Profits)
+36%
+96%
Leveraged preferred stock to
share business risk
Recapitalization
Leveraged preferred stock to
support business/financial
strategy
Real estates finance
outstanding balance
1. Signed an MOU for business cooperation in August 2021. 2. Asset management for One REIT and One Private REIT commissioned to a subsidiary.
3. NRL + REIT-targeting loans. 4. Brokerage, FA, loan upfront and other fees, etc. 5. Mezzanine finance and fund/REIT investment.
Sharing business risk
Real estate finance
Equity investment
BK
Brokerage, CRE consulting
FA for fund origination
TB
ECM, DCM, M&A
SC
Leasing, mezzanine loans
MHLS
Asset management
Mizuho Realty One
Collaboration with NSKRE REIT management
Combining group-wide strengths to provide various solutions
Strategic planning Risk takingNeeds matching
(FY18 = 100)
100
117 116
FY18 FY19 FY20
Initiatives in the strategic investment (SI) field
Established a team in charge of real estates business strategy
100118 134
94% 96% 96%
50%
70%
90%
110%
130%
150%
170%
190%
0
20
40
60
80
100
120
140
160
FY18 FY19 FY20
残高 投資適格比率
Sell-side needs Buy-side needs
FG
(FY18 = 100)
Balance IG-ratio
Plan Plan Plan Plan
1 2
34

17
30
65
100
Improving business profitability
Improving the profitability of new transactions
Pricing based on internal rating
Pricing based on standard methods
Focus on improving
RORA under both the
current and new
regulations
Building high-quality portfolio by improving the lending spread
Maximizing flow business profits through cross-sells
New
regulation
RORA
Current
RORA
High
profitability
High
profitability
Maximizing profitability (RORA)
Current: Low
New: High
Current: Low
New: Low
Current: High
New: Low
Current: High
New: High
Improving loan spreads
Products
All
Corporate
(bps)
1. Based on the number of low profitability (LP) client groups classified in FY18. Decrease as of FY20. 2. Based on the current Basel III rules. 3. BK CI Div. (internal accounting, excl. lending to the nationalgovernment, etc.). 4. Real estate finance, acquisition finance, project finance, securitization, ship finance, and mezzanine finance. 5. Average balance.
Loan spread trends Loan balance composition
FY17 H1 FY21 Q1
CorporateProducts
4
Improving terms with low profitability groups
# of LP groups
Down 53%
LP-group RWA
Down 35%
17
H1
17
H2
18
H1
18
H2
19
H1
19
H2
20
H1
20
H2
21
Q1
1 2
3
5

18
1,419.8
1,164.6 1,143.8 1,119.8
3.1 59.0
8,000
9,000
10,000
11,000
12,000
13,000
14,000
15,000
19/3末 21/3末 21/6末 22/3末
Reducing cross-shareholding / Controlling credit-related costs
Controlling credit-related costsCross-shareholding reduction
- JPY 300.0B
- JPY 217.0B
Reversion of stocks from
the retirement benefit
trust (temporary increase)
• As of the end of June 2021, we have managed to downsize the portfolio by -JPY 217.0B compared to the end of March 2019.
• We are steadily reducing stocks in the retirement benefit trust in order to right-size the surplus assets.
1. Including RBC clients in Japan. 2. Of which, -JPY 239.9B from sales and -JPY 36.1B due to impairment. 3. Of which, -JPY 219.4B from sales and -JPY 35.8B due to impairment. 4. Internal accounting, with IG ratio based on the internal rating scheme.
Exposure (JPY T) Credit-related costs (JPY B)- JPY 252.1B
90
%
90
%
-66.2
-113.4
9.8
FY19 FY20 FY21 1Q
58 56
90% 90%
70%
75%
80%
85%
90%
95%
100%
0
10
20
30
40
50
60
70
21/3末 21/6末EXP 投資適格比率
• 90% of our exposure is investment grade (IG)-equivalent. We have managed to maintain a high-quality portfolio while the total EXP is declining due to the repayment of COVID-related lending.
• Credit-related costs are expected to decrease gradually, while continued attention is needed on the impact of prolonged emergency declaration related to the pandemic.
• In FY21 Q1, we recorded a reversal due to forward-looking provisioning in the previous years.
IG ratio
Mar-21 Jun-21 Q1Mar-21 Jun-21Mar-19 Mar-22
2
3
4
1

Global Corporate Company

20
Key strategies of Global Corporate Company (GCC)
Current environment
COVID-related funding needs have tempered off; market
spreads are declining.
• Meanwhile, the M&A market is robust in contrast to the slowdown in
2020.
Capital markets issuance is generally strong. Trade volume
is rebounding.
• The IG DCM market has quieted down from the boom in FY20 H1.
The Non-IG DCM/LCM market has recovered since late 2020.
• Trade volume is rebounding and expected to grow mainly in Asia.
Change in workstyle and office usage enhanced by
digitalization
Growing focus on sustainability
• Increased funding needs for sustainability-related products
Actions
1Non-JPY balance
sheet management
• Expand net interest income
• Control non-JPY deposit-loan balance
2Growing business
fields
• Further grow the US capital markets business
• Expand the stable revenue base through
transaction banking business
3
Continued effort to
improve profit-cost
structure
• Control expense ratio
• Improve capital return
4Initiatives for further
growth
• Efforts for sustainability
• Capture further growth potential
Key strategies
Structural
challenge
Structural
challenge
Structural
challenge
Earnings trend
Achieved the 5-yr business plan targets ahead of the
schedule. Set to pursue further growth.
Current 5-year business planPrevious 3-year business plan
(JPY B)
Key strategies for FY21
Profit plan1
1. FY20 accounting rules are applied for FY19 figures, while FY21 accounting rules are applied for FY20 and FY21 figures. 2. FY21 accounting rules are applied for FY16, FY17, FY18, FY20 and FY21 figures, while
FY20 accounting rules are applied for FY19 figures.
(JPY B) FY19 FY20FY21
Plan Q1 YoY
Gross Profits 410.9 456.0 457.0 123.4 +8.9
G&A Expenses - 245.3 - 259.1 - 266.0 - 62.9 - 0.0
Net Business Profits 175.6 207.4 202.0 65.2 +10.8
Net Income 108.2 109.3 118.0 47.5 +18.6
ROE - 4.4% 4.8% 8.0% +3.4%
99.5 84.7
164.2 175.6207.4 202.0
16年度 17年度 18年度 19年度 20年度 21年度 23年度
Gross profits Expenses Net business profits
FY16 FY17 FY18 FY19 FY20 FY21 FY23
180.0
(5-yr target)
CAGR 12%
2
Achieved 5-yr target
ahead of schedule

21
279316 280 277
206236
207 198
74% 75% 74%72%
19/3 20/3 21/3 21/6
外貨貸出金
外貨顧客預金
貸出に対する預金の割合
Non-JPY balance management
• Sound portfolio with the
share of IG exposure
exceeding 80%.2 (G300
Strategy)
• Will keep an eye on the
pandemic-sensitive
sectors, and control risk
through hedging and
off-balancing.
Controlling credit-related costs
Q1 credit costs were offset by the forward-looking reserves recorded in FY20.
(JPY B)
Multi-faceted balance sheet controlExpanding net interest income
Spread remains high while loan balance is rebounding.
• Spread remains around
+20bps compared to the
pre-pandemic level.
• Loan balance is on the
rise again with the
execution of high-spread
loans, while COVID-19-
related loans are being
repaid steadily.
Controlling non-JPY deposit-loan balance
Maintaining a stable non-JPY deposit balance while controlling costs.
• Maintaining non-JPY
deposit-loan ratio (D/L)
to around 70%.
• Controlling costs by
reducing time deposits
with high interest rates,
in line with the trends of
loan balance.
Structural
Challenge
+20bps
(USD B)
Loans• Raising the
profitability bar (for
new regulations)
• Downsizing low
profitability assets
• Building up current
deposits
• Reducing costly
time deposits
Optimizing B/S using lending, deposits, and market funding.
Deposits
ex-Japan
Improving
stability
Maximizing
returns
Market funding and deposits in Japan
B/S
optimization
• Optimizing the funding structure
across divisions
Enhanced cost control
245 258
284 280
258 257 260
0.79% 0.81% 0.83%0.93%
1.01% 1.02%
19/3 19/9 20/3 20/9 21/3 21/6 21/8
貸出金残高 貸出金SP
22.4 31.0 5.6
- 50.8- 59.9
- 2.1- 28.4 - 28.9
3.5
FY19 FY20 FY21Q1
Cost incurred Reversal
Net credit-related cost
Period-end Balance
Loan spread
Non-JPY loans3
Non-JPY customer deposits3
Deposit-to-Loan Ratio
1. Ex-Japan loan balance and monthly average spreads. Company management accounting basis. 2. Exposure basis, IG ratio based on the internal rating system. 3. Non-JPY currencies; including deposits and
loans in Japan. FY21 accounting rules are applied. BK (including subsidiaries in China, the USA, the Netherlands, Indonesia, Malaysia, Russia, Brazil and Mexico).
1
Costs incurred
Net credit-related costs
Reversal
(USD B)

22
3.3% 3.4%3.7%
1.0%1.4% 1.4%
FY19 FY20 FY21Q1
IG DCMNon IG LCM/DCM
Progress of US capital markets business
- Gross profit trends -Winning more mandates from clients
Leveraging strengths nurtured in IG business
Growing business fields (1): US capital markets
Efforts for sustainable business growth
Compared to FY20, IG-related revenue has declined, while Non-IG-related revenue is growing.
Acquisition
(LBO)
IPO/DisposalReCap
finance
Front office
Risk control
• Hiring coverage bankers with sector insights and
M&A knowhow
• Enhancing products and syndication capabilities
• Enhancing credit examination and risk management
capabilities
• Diversifying underwriting risk-hedging methods
• Selective approach to Non-IG deals
Subscription FLCM/DCM
Derivatives
ECM/M&A
Margin loans
Capital raising
(Fund)
Improving asset efficiency and maximizing non-interest
revenues with loan distribution business, etc.
LCM/DCM
Derivatives
Share trends
Products
Events
IG DCM (Apr-Jun 2021)
1 JPMorgan 13.8%
2 BofA 10.7%
3 Citi 7.6%
4 Wells Fargo 7.1%
5 Goldman Sachs 5.2%
6 Morgan Stanley 5.0%
7 Barclays 4.1%
8 Mizuho 3.7%
9 RBC 3.0%
10 Deutsche 2.8%
Non IG LCM/DCM (same)
1 JPMorgan 10.6%
2 BofA 9.6%
3 Barclays 6.4%
4 Goldman Sachs 6.1%
5 Credit Suisse 5.2%
6 Wells Fargo 5.0%
7 Deutsche 4.7%
8 Morgan Stanley 4.4%
9 Citi 3.8%
10 Jefferies 3.8%
20 Mizuho 1.4%
IG
Non-IG
Corp.
Sponsor
ECM/M&ADerivatives, etc.DCM/LCMLoans
IG-dominated stable revenue base
E.g. Sponsor-originated business value chain
FY18 Y19 FY20 FY21 FY20 Q1 FY21 Q1
IG Corp. Non-IG Corp. Non-IG Sponsor
Q1 yoy
comparison
IG: -39%
Non-IG: +108%
Leveraging sector insights
and debt markets presence
Selective approach to sponsors
Building track records
leveraging enhanced
products and
M&A knowhow
* Source: Dealogic, fee-based ranking. Non-US FIs in italics.
Maintaining market share and LT ranking.*

23
Transaction banking revenue in Asia
(current deposits + FX + TF)
FY21 Q1 YoY
Deposits -8%
FX +19%
TF 0%
Progress of transaction banking business in Asia
-Growing profit trends-
Strengthening Non-JP transactions in Asia
Enhancing transaction banking capabilities in Asia
Growing business fields (2): Transaction banking
FX has been the main growth driver; deposits balance is also growing in anticipation of future rate hikes.
+44% (cp. FY16 avg.)
Capturing new
capital flows
Addressing
online needs
• Building API channels, introducing
soft tokens, etc.
e-Banking enhancement
Responding to
trade flow shifts
Developing marketing support tools
Consolidation of TF operations
• Enhancing marketing leveraging
transaction data analysis.
• Leveraging the global operation
center in India.
FY16 FY21 Q1FY20
Impact of rate cuts
+9%
(26% towards
FY target)
FY16 FY21Q1FY21 plan
• Capturing needs for enhanced global cash management
• Quantitative analysis of FX risk
• Expanding WFH needs
• Promoting e-channels such as H2H and MGeB
• Providing trade finance responding to the pandemic-
induced demand and trade flow shifts
Current deposits growth in Asia
(average balance)
• Mainly approaching local companies
and MNCs, whose trade volume is
expected to rise.
Expanding the target market
Leveraging our branch network
• Leveraging our branch network over
14 countries/regions.
• Capture trade flow with collaboration
across regions.
FX
Trade Finance
Deposits
Q1 yoy
comparison
EU
USA
China
Japan/
Korea
ASEAN
Australia
+100
-1
+28
+17
+22
-3
+32
+50
+10
+3
Trade volume outlook (2023 vs 2019)*
Volume (USD Bn)
FX revenue grew
thanks to the rebound
in trade volume as well
as winning major deals.
Steadily building up current
deposits in anticipation of
future rate hikes
FX revenueCAGR 8%
*Sources: BCG Trade Model 2021, UN Contrade, OECD, WEF, IHS, TradeAlert, BCG Analysis
Awards
Total +9%

24
• Global operations consolidation and RPA introduction support
using a global operation center in India.2
Controlling expense ratio
Continuing cost-cutting efforts.
Trends in expense ratio and total G&A expenses1
Structural
Challenge
Advancing cost structure reform
Consolidating global operations
• Consolidating corporate functions, optimizing HR allocation, and reviewing
office space
Loan administration
Trade administration
Credit administration
RPA development
Improving capital returnsStructural
Challenge
17.5%18.7%
20.9%
18.7%
(USD B)
236.9 227.8225.7 235.5 Cumulative
RWA
reduction
FY19 FY21 Q1 FY 21FY20
- 12.2
Continued efforts to tackle structural challenges
• Downsizing low profitability
assets in anticipation of new
Basel regulations
Downsize low
profitability assets
• Capital markets business
• Transaction banking, etc.
Expand non-interest income
• Maintaining loan spreads
• Selecting profitable deals
Maximize asset returns
FY19-21 RWA
reduction
(projected)
- USD 12.2B
Efforts to improve ROE
Improving ROE based on the new Basel rule.
Trends in ROE and RWA
EMEA
AmericasEast Asia
Asia Oceania
1. Calculated based on the FY21 accounting rule. 2. Mizuho Global Services India (established in March 2020). 3. Basel III finalization basis. Gross profit ROE.
3
(JPY B)

25
18年度 19年度 20年度 21年度計画
Initiatives for further growth
Sustainability-related efforts
Green Auto ABS Social HY Bond
Only foreign bank to be appointeda joint MLA for the landmark deal to support EV market.
• Appointed global sustainability business leaders.
• Sharing knowhow and insights via the global network.
Global ESG Champion system
• Sustainable loan : Ranked #2
• Sustainable finance : Grew 3.3x compared to FY18
• Led landmark deals in all regions.
Mizuho Sustainability Finance
volume ex-JapanFY20 sustainability finance (loan) origination
Ranking (global)1
Appointed an active bookrunner for the deal that contributes to financial inclusion.
Accelerating responses to climate change
• Enhancing engagement with clients.
3.3x
compared
to FY2018
FY18 FY19 FY20 FY21(plan)
順位 金融機関 金額($MM) %
1 BNP Paribas 13,326 5.4%
2 みずほ 11,882 4.9%
3 SMFG 10,653 4.4%
4 Credit Agricole 9,419 3.9%
5 MUFG 8,948 3.7%
Leveraging our strengths in the local markets and collaborating
with other companies to capture further growth opportunities.
Capturing further growth opportunities
Capturing the depth of the
US capital markets• Enhancing coverage and products
• Capturing cross-border deals
Asia retail (with RBC)
Collaboration with Japan
(with CIC) Expanding markets products
(with GMC)
Regions
Cross-
in-house
company
Accelerating CIB in EMEA• Promoting O&D by leveraging our
global investor base
Enhancing transaction banking in Asia• Expanding Non-JP client base
• Strengthening capabilities
For long-term sustainable growth
Seeking long-term growth beyond the 5-yr business plan.
FY21 FY23
Structural
improvement
Achieving
growth
GCC’s role: Leading Mizuho’s growth as a growth driver
Achieve the annual
plan
Growth beyond
the 5-yr plan
Achieve the 5-yr targets(cost ratio, capital return, non-JPY D/L ratio)
Long-term
growth
Mizuho
Rank | FI | Vol (USD M) | Share
1. Source: Refinitiv. 2. Framework to enable everyone to access financial services.
1st in China 1st in the US
• Leveraging technologies to
enhance digital services
• Collaboration between Front departments
in Japan and Non-JP coverage bankers
• Enhancing derivatives business, etc.
2

Global Markets Company

27
Key strategies of Global Markets Company (GMC)
Current business environment Key strategies for FY21
Earnings plan
Carry income was steadily accumulated in FY21 Q1, while further
improvement in unrealized gains/losses is a challenge for the Q2
and beyond amid sluggish performance of domestic stock market.
Continue strategies to earn capital gain of stocks responding
appropriately in the event of market movements and secure carry
income while paying attention to the risk of interest rate rise.
Earnings in FY21 Q1 was on plan due to the performance of US
business although customers’ flows of FI and FX were slow
globally.
Further promoting our strategy to integrate banking and securities
businesses along with strategic focus.
(JPY B) FY19 FY20FY21
Plan Q1 YoY
Gross Profits +411.5 +490.3 +471.0 +122.4 -468
G&A Expenses -202.6 -217.7 -216.0 -53.9 -1.3
Net Business
Profits+207.8 +271.7 253.0 68.3 -48.2
Net Income +143.1 +175.9 +169.0 +46.2 -34.5
ROE - +11.1% +8.6% +11.3% -7.6%
1. FY20 accounting rules are applied for FY19 figures, while FY21 accounting rules are applied for FY20 and FY21 figures
Banking
Sales & Trading
Strengthening the fundamental profitability by increasing carry
income while focusing on the balance between realized gains
and unrealized gains/losses.
Performing flexible asset allocation leveraging an early warning
market management framework.
Achieving stable and efficient ALM operations on a global basis.
Advancing sustainability initiatives in each field for investment
and funding.
Strengthening our solution-based approach to meet
diversifying customer needs through further promotion of our
strategy to integrate banking and securities businesses in
Japan.
Further strengthening our market presence in US and EMEA
leveraging unified operations across banking and securities.
Continue our strategies to strengthen the business foundations
in order to diversify and stabilize our business portfolio.
Banking
Sales & Trading1

28
Banking: Keep focusing on the balance between realized gains and unrealized gains/losses
Equities
株式
Fixed
Income
Fundsファンド
Seeking high and stable MTM profit through strategic asset allocation and maintaining high levels of carry income.
Strategic asset allocation to ensure the optimal diversification across
fixed income, equities, and funds based on market conditions
Appropriate portfolio management leveraging market analysis Maintaining high levels of carry income
• Began initiatives to increase the
contribution of carry income in realized
gains in FY19.
• Our carry income has been elevated to
around 60%.
Approach to our
portfolio management
An early warning market
analysis
Scen
ari
o
Sim
ula
tio
n
Earn
ing
pla
n,
Inv
estm
en
t lim
it
1. Structural changes, market stage definitions, forecasted return distributions and etc. 2. In-house company management accounting basis
• Developed an early warning
market management framework
which provides visualizations of
financial market conditions and
patented it in March 2021.
• Daily monitoring on the analysis
results.
1
0.9
1.1
1.3
1.5
1.7
1.9
2020/12/31 2021/3/31 2021/6/30
Risk volume of USD FI
US 10 year treasury yield
(%) Decreased positions in the face of rising interest rates
and then carefully increased positions
Increased positions in the face of lowering interest rates
and then decreased the positions
Case Study: Portfolio management of USD Fixed Income in this year
2
Approx.40%
Approx. 60%
Approx.60%
0%
50%
100%
FY19 FY20 FY21 1Q
Ratio of carry income Ratio of capital gain

29
Integrated
management
Banking:Initiatives for our strategies
Enhance banking operation
• Monitoring funding
environment and gap
between loans and deposits
• Collaborating with customer-
facing in-house companies
• Appropriately controlling the
amount of deposits through
flexibly adjusting funding
rate
Promote sustainability
Inve
sto
rs
Elig
ible
gre
en
pro
jects
F
G
B
K
FundsFundsFunds
Green bond
Project listsReporting
• Using funds for eligible
green projects
• Approaching green
investors’ needs
Planning
ALM
Investment
• Utilizing expertise through
integrated management of
Planning and ALM
• Centralizing investment
portfolios to BK
• Optimizing banking operation
by reducing redundancy and
utilizing knowledge
TB
Planning
ALM
Investment
BK
Centralizing
portfolios to BK
Reducing cost of Non-JPY funding
Expanding ESG investmentIntegration of banking operation (BK and TB) from April 2021
Green bonds issuance
Strengthening our business foundation
through utilizing corporate resourcesPromoting sustainability through our investment and
funding
Assets
Other(Central Banks Deposits,
stocks and other)
Non-JPY bonds
Short term funding
Medium/longTerm funding
Loans
Customer
Deposits
Liabilities
• Steadily expanding our
investment which
contributes to building a
sustainable society
FY20
139FY19
100
1
1. Calculated by internal data and indexed by FY19 as 100

30
S&T:Enhancing profitability through fundamentally strengthening the business foundation
Gross profits in each region
FY18
28FY20
54
FY18
52
FY20
67
Japan
FY18
9FY20
20
Asia
FY18
11FY20
14
Integrated banking and securities
businesses in derivatives, and
established corporate bonds and
structured products business
Gross profits expanded to the size of
Japan as a result of our strategies
Integration of banking and securities
businesses in derivatives and cost
structure reform in equity business
Promoting our strategies and capturing markets change, gross profits on a
global basis increased by 1.5x in FY20 (vs FY18)
Continuing to strengthen credit trading
* Calculated by internal data and indexed by FY18 as 100
Results from the strategies
• Customers’ flows have increased and
diversified by integrated banking and
securities businesses in derivatives.
• Strengthened market presence in Japan.
• Established business foundation
through CIB (Corporate and Investment
Banking) framework and integrated
operation in rates and derivatives.
• Diversified profit sources by strategic
focus in corporate bonds business,
corporate derivatives, and municipal
market businesses.
Established business foundation
and promoted strategic focus
Improved productivity in Fixed
Income and Equity
EMEAAmericas
America
Japan
Fix
ed
In
co
me
Equ
ity
Fix
ed
In
co
me
Equ
ity
• Promotion of strategic focus through
targeting industries and collaboration
with primary business
• Established Equity derivative business.
• Profits have improved by cost structure
reforms and further focusing on
customer transactions

31
Institutional
Investors
Individual
Investors
Financial
Institutions
etc.
Corporates
Financial
Institutions
etc.
S&T: Further promotion of our strategy to integrate banking and securities businesses and strengthening our solution-based approach
Strengthening our solution-based approach responding to various customers’ needs
through completing the integration in the expectation of FW regulation easing.
Improving risk-return efficiency by using centralized
book and matching customers’ flows.
Multi-product solution approach based on
costumers’ various needs
(‘solution-based approach’)
Improving risk-return efficiency by utilizing centralized book
Business risk
hedge needs
Investment
needs
Integration of market back offices (BK/TB/SC) from Dec.2020
• Improving convenience of customers and operational efficiency through consolidating, standardizing, and automating BK, SC, and TB’s operations on a product-by-product basis
(1) Business risk hedge
• FX
• Equity Solution
• Derivatives
• Commodities
(2) Investment and its hedge
• Fixed Income
• Structured products
• Derivatives/FX
• Equities
Financing products related to
(1) and (2), and utilizing assets
• Repo
• Equity derivatives
• Equity swap
Before integration
Pro
po
sin
g M
ulti-p
rod
uc
t so
lutio
ns
Aims of the integration
Room to accumulate more profit since BK and SC
covered their customers’ flows individually.
Difficulty in proposing multi-product solution
approach (‘Product-out’) Collaborating with RBC/CIC/GCC
BK SC
BK
TB
SC
Integrated market
back office
(BK/TB/SC)
AfterBefore

Asset Management Company

33
FY19 FY20FY 21
Plan Q1 YoY
Gross Profits 52.9 50.8 +60.0 14.3 +2.8
G&A Expenses -33.1 -32.9 -35.0 -8.2 -0.3
Net Business
Profits13.3 11.3 19.0 4.6 +2.9
Net Income 6.1 4.7 7.0 2.2 +1.4
ROE - 4.1% 6.6% 8.2% +5.5.%
Accumulated AUM boosted AM-One’s share to 2nd
place in the industry, and contributed to
achievement of target Gross profits of FY20
Key strategies of Asset Management Company (AMC)
Business environment & strategies Key strategies for FY21
FY20 YoY Q1
Publicly offered
investment trust AUMJPY 8.6T +JPY 2.7T JPY 9.0T
Number of Individuals
enrolled in Corporate
DC/iDeCo.1,520 K +90 K 1,530 K
Expense ratio 65% +3% 57%
3
Publicly offered
investment
trust
InstitutionalProvided group-wide solutions which meet client
needs
Customers' asset management needs have significantly changed and expanded, amid the low interest rate andchanges in values brought by COVID-19 pandemic.
ESG investment is expanding.
Business environment
Key strategies for FY21
Progress of strategies Reinforcing
earnings
base
Deepening
Structural
reform
Publicly offered
Investment trust
Providing solutions that make full use of group functions
Institutional
Providing products and investment capabilities responding to asset formation needs
Sharpening investment capabilities through selection and concentration
Pursuit of efficiency to strengthen the foundation for medium to long-term growth
Enhance
investment
capabilities
Strengthen
financial base
Through the asset management business…
Roles to be played by AMC
Earnings plan
1. Data published by the Investment Trusts Association, Japan, Shares of publicly offered equity investment trusts, and excluding ETFs.
2. FY20 accounting rules are applied for FY19 figures, while FY21 accounting rules are applied for FY20 and FY21 figures. 3. Excluding ETFs.
2
Achievements
1
Realizaiton of sustainable
economy and society
Revitalization of
domestic financial assets

34
AUM of ESG Investment
Products
2.2
0.0
1.0
2.0
(JPY T)
Promote improvement of corporate value and transition to
sustainable society, through working on environmental and
social issues, from a global perspective
Role to be played by AMC
Creating a virtuous cycle by contributing to investment chain
1. Products that clearly incorporate ESG elements into their investment philosophy and processes.
InvestorInvestment
Investment
return
DBCorporate
type DCiDeCo
・Provide products for
asset formation
・Provide investment
services utilizing pension
system
Investment
trust
Fund
Wrap
engagement
Investment Company in
investment
portfolio
Improvement of
investment return
・ESG Integration
・Engagement
・Exercise of voting rights
Major participated initiatives (by AM-One)
Enhancement of
Information disclosure
Monthly report Ad hoc report
Prospectus Investment report
Enrich disclosure of ESG Investment
process and that of ESG evaluation
points
Contribution to the further establishment of ESG investment Signatory to PRI (2013)
Support for Montreal Carbon Pledge (2015)
Participation in Climate Action 100 + (2017)
Support for TCFD (2019)
Participation in Net Zero Asset
Managers initiative (2020)
BK
TB
AM-One
Investment base of
Mizuho GroupDC
Private
placement
investment
trust
AMC
DB
Fund wrap
SC
Exercise of
voting rights
Continue to focus on
progress in Responsible
Investment
1
Enhancement of ESG product lineup Initiatives as a responsible institutional investor
Revitalization of domestic financial assets and realization of sustainable economy and society through Asset Management
Promote asset formation
Improve the value ofcompanies in our
investment portfolio
FY19 FY20 FY21

35
0
20
40
60
0
5
10
FY20 FY21(Plan) FY23(Plan)
Reinforcing Earnings Base: Publicly Offered Investment Trust Business
Product strategies for asset formation needs Strong customer base
High evaluation from customers
1. Data published by the Investment Trusts Association, Japan (excl. ETFs). 2. (Source) R&I. “Newsletter on Funds & Money No. 357”.
3. (Source) Refinitiv 4. (Source) R&I “Newsletter on Funds & Money No. 349”.
Extensive support for distributors
• Remote support under the
COVID-19 pandemic
Rich contents
Online Seminars
Web site for
distributorsVideo contents
For salesperson
Collaborating with
distributors for
individual investors
Global Equity fund Balanced fund
“Future World” series “Investment Sommelier”
Stability consiousReturn consious
The amount of net inflows in
FY20 in
Balanced Fund No. 1
5th anniversary since the
inception of this series
R&I Fund Award
2021
Refinitiv Lipper
Fund Award Japan
2021
R&I Customer
Satisfaction Award 2021
Received “The Most
Lipper Japan Fund
Awards of the Year”
Largest number of
awarded prizes
Largest number of
awarded divisions
Awarded in Investment Trust
division
Market Share of Publicly Offered Equity Investment Trusts rose
up to 2nd place
2
3
4
AUM JPY 0.5T (as of the end of FY20)
(2nd place in Balanced Fund)
(Net Assets)
Total AUM of the series
JPY 2.5T (Aug-21)
Outstanding track record
since the inception
One of the largest
distributor bases by
number
Group
distributors
50%
Non-group
distributors
50%
Breakdown of AM-One AUM
by distributor
243
(Mar-21)
Broad distributor base
TB SCBK
Strengthen Top-Line by AUM accumulation(JPY T)(JPY B)
Gross Profit
Approx. +JPY 12.0B
AUM
Approx. +JPY 2.7T
Earnings growth in publicly offered investment trust business
■ Year end AUM of publicly offered equity investment trust
● Gross profit from publicly offered equity investment trust
1

36
• Review pension system in DB/DC (,for extension of retirement age, etc.)
• Transition from DB to DC • Provide tailor-made multi-asset strategy fund
• Post-sales support for expertised personnel development
and accumulation of knowledge
• Controll the increase in customer deposits
• Provide revenue opportunities and opportunities to build
relationships with customers
Deposits
from
Customers
Securities
DepositsShift
Off-balance
Publicly offered
investment trusts
Efficient securities investments
Substitute customer deposits
Proposal for sustainable retirement benefit plan
Contribute to expand the base of investors utilising digital tools
• Provision of investment solutions based on analysis of system, finance and portfolio
Promotion of asset management consulting DB
DB DC
Address the gap between the gap between the environment
at the time of the original design and the current environment Challenge
Private placement
investment trust
Support for strengthening the management
Reinforcing the Earnings Base: Institutional Business
Optimise comprehensive pension consulting Providing solutions to regional banks
• Share recognition of management challenges with customers, and
provide solutions for both assets and liabilities, working together as
a group
• Provide pension solutions utilizing DB and DC, taking a panoramic
view of the entire retirement benefit plan
Longevity
Continued low
interest rate
Extension of
retirement age
Change in
work styles
Necessity for
reviewing pension
plans
Pandemic of
COVID-19
Environmental awareness
Challenge Revealed volatility and financial impact on customers
Investment education
1.53 M
Number of individuals
enrolled in Corporate
DC/iDeCo.(as of Jun-21)
DC
e-Learning
Robo advisor
Life plan simulation
smartphone app
Mizuho DC iDeCo app
Released in June 2021
One of the largest
in the industry
・Increasing excess cash due to the accumulation of deposits
・Decreasing financial margin due to prolonged ultra low
interest rate
Challenges
Balance sheet of regional banks

37
Strengthen overseas business by capturing overseas market growth
▲500
▲300
▲100
100
300
500
700
FY19
Deepening structural reforms and initiatives for further growth
Sophisticate product governance
Strengthen financial base
Initiatives for further growth
Expenses
Gross
profit
Expense
ratio
• Improve cost return by strengthening top line and reviewing
expense structure
65%
54%
• Enhance investment capabilities through selection and focus
• Contribute to stabilization of Mizuho group profits by improving
profitability of AMC
Inorganic strategy
• Enhance customer-oriented product creation process
• Reduce fixed costs by flexible
working styles and office reforms
• Variablise personnel costs
through HR system reform
• Improve operational efficiency by
utilizing Digital Innovation
• Strengthen the top line by
accumulating AUM
Gross margin
Expenses
Domestic non-face-to-face business
Expand customer base and strengthening product development
capability in the non-face-to-face market
Expand AM Business Portfolio
Improve ROE
Stabilize earnings through
product diversification
Businessin Japan
Business outside JapanHigh alpha
active
Alternative
ESG
Redeem poor
performance fund
Redeem poor
profitability
small-sized fund
Improve performance
Improve investment efficiency
Shift resources to priority areas
Improve investment
capabilities
• Accelerating investment strategies in priority areas
• Enhance investment capability and efficiency of gate keeping,
consolidating resources in AMC for each asset class
TB
Real estate
AMOAI
Alternative
such as HF, PA
AM-One
Traditional assets
Consolidate gate keeping resources by asset class
Strengthen investment capabilities
1. Asset Management One Alternative Investments
1
FY20 FY23
(Plan)

- Group aggregate
- In-house company management basis
- Net Business Profits by In-house Company
- Internal risk capital
- ROE by In-house Company
Management accounting
RBC :
CIC :
GCC :
GMC :
AMC :
GPU :
RCU :
Retail & Business Banking Company
Corporate & Institutional Company
Global Corporate Company
Global Markets Company
Asset Management Company
Global Products Unit
Research & Consulting Unit
FG :
BK :
TB :
SC :
AM One: Asset Management One Co., Ltd
RT : Mizuho Research & Technologies, Ltd.
MHLS : Mizuho Leasing Co., Ltd.
Abbreviations
Definitions
Foreign exchange rate
TTM Jun-20 Mar-21 Jun-21
USD/JPY 107.74 110.72 110.61
EUR/JPY 121.05 129.76 131.63
Management
accountingFY21 Planned rate
USD/JPY 108.00
EUR/JPY 126.36
Mizuho Financial Group, Inc.
Mizuho Bank, Ltd.
Mizuho Trust & Banking Co., Ltd.
Mizuho Securities Co., Ltd.
: BK + TB + SC + AM One + other major subsidiaries on a non-consolidated basis
: Figure of the respective in-house company
: Gross Profits - G&A Expenses (excluding Non-Recurring Losses) + Equity in Income from Investments in Affiliates – Amortization of Goodwill and other items
: Risk capital calculated taking account of factors such as regulatory risk-weighted assets (RWA) and interest rate risk in the banking account
: Calculated dividing Net Income by each company’s internal risk capital

Forward-looking Statements
Financial information in this presentation uses figures under Japanese GAAP unless otherwise stated (including management accounting
basis).
This presentation contains statements that constitute forward-looking statements including estimates, forecasts, targets and plans. These
statements reflect our current views with respect to future events and are subject to risks, uncertainties and assumptions. Such forward-
looking statements do not represent any guarantee of future performance by management.
Further information regarding factors that could affect our financial condition and results of operations is included in our most recent Form 20-
F and our report on Form 6-K.
We do not intend to update our forward-looking statements. We are under no obligation, and disclaim any obligation, to update or alter our
forward-looking statements, whether as a result of new information, future events or otherwise, except as may be required by the rules of the
Tokyo Stock Exchange.
Information on companies and entities outside Mizuho group that is recorded in this presentation has been obtained from publicly available
information and other sources. The accuracy and appropriateness of that information has not been verified by Mizuho group and cannot be
guaranteed.
This presentation does not constitute a solicitation of an offer for acquisition or an offer for sale of any securities.


