This file is part of the following reference: O’Leary, Michael John (2007) The stratigraphy and geochronology of emergent fossil reef deposits of Western Australia. PhD thesis, James Cook University. Access to this file is available from: http://eprints.jcu.edu.au/2140
Transcript
This file is part of the following reference:
O’Leary, Michael John (2007) The stratigraphy and geochronology of emergent fossil
reef deposits of Western Australia. PhD thesis, James Cook University.
Corals provide the most widely used sea-level archive. Many coral species survive only in
shallow water, therefore fossil corals emergent or submergent relative to present reefs,
along stable coastlines, suggest variations in past sea level. Along the coastal margin of
Western Australia (WA) an extensive series of marine isotope stage (MIS) 5e reefs
outcrop at 3 ± 1 m above sea level. The consistency of reef elevation along thousands of
km of WA coastline demonstrates the tectonic stability of this trailing intraplate
continental margin. There is also evidence of erosional terraces or incipient reef
development at elevations above this +3 m sea-level benchmark. Some workers reasoned
that the higher elevation of these marine units is an artefact of localized tectonism or
warping. This rationale fails to address: 1) intertidal deposits at multiple elevations in
close proximity; 2) the distinct geomorphological difference between the lower and
upper marine units; and 3) the similarity in elevation between WA emergent marine
deposits and those found on stable carbonate platforms of The Bahamas and Bermuda.
With accurate and precise dating of these emergent reef deposits it may be possible to
characterise the nature of sea level during MIS 5e.
Coral skeletons are constructed of chemically unstable aragonite. Older coral
material is generally more diagenetically altered, often suffering the addition or loss of
uranium or thorium, which leads to inaccurate U-series age calculations. Coral diagenesis
is generally determined by changes in carbonate mineralogy, but a more subtle form of
geochemical alteration may affect the uranium-thorium age of corals that appear
mineralogically pristine.
In an attempt to extract meaningful ages from corals that have undergone
isotopic exchange, modeled alpha-recoil processes were used to calculate open-system
ages. These open-system ages are based on the assumption that alpha-recoil mobilisation
is the only diagenetic process operating within the coral/reef unit. Independent age
controls including: 1) the known duration of MIS 5e; 2) stratigraphic superposition; and
3) age equivalence within individual corals, were used to test the reliability and accuracy
of uncorrected and open-system corrected coral ages. Despite claims to the contrary, this
study found open-system corrections to fail the above prescribed age tests, such that
open-system corrections did not reflect the corals true age.
Investigations into the nature of MIS 5e sea levels were focused on two
contrasting locations, Cape Cuvier, a high-energy coastal site, and Shark Bay, a low
Abstract - iv -
M.J. O’Leary – Ph.D. Thesis
energy marine embayment. Both sites point to an extended period of widespread coral
reef development at +2 to +4 m elevation with incipient reef and erosional terraces at
between +6 and +10 m. The incipient nature of the upper coralgal rim and the fact that
the lower terrace was not able to utilize the newly available accommodation space points
to a brief but rapid sea level excursion to this new elevation. High-precision U-series
dating returned coral ages that were inconsistent with the stratigraphic interpretation of
the site and other known MIS 5e sea level curves.
In an attempt to fill in the temporal and spatial gaps left by coral dating, the U-
series method was applied to crustose coralline algae (CCA). This study shows that living
CCA capture a modern seawater equivalent δ234U value of 147.02 ± 1.5 ‰, and initial
uranium concentrations of 0.2 ± 0.07 ppm. These initial chemistries allow for the
examination of uranium and thorium isotopic evolution over geological timescales,
however uranium uptake and detrital 232Th contamination limit the usage of this material
in U-series dating.
Although we are confident of our interpretation of the sea-level history in WA
during MIS 5e, we offer the following considerations: 1) field observations and
relationships remain the most reliable means of determining the succession of events in
the case of MIS 5e; 2) despite increased measuring precision of “high tech” dating
methods, there is not necessarily a concomitant increase in the accuracy of the ages; and,
3) open-system corrections are not a reliable tool for determining a coral’s true age.
- v -
M.J. O’Leary – Ph.D. Thesis
STATEMENT OF THE CONTRIBUTION BY OTHERS
This thesis has benefited greatly from the contribution by others to the
formulation of ideas, the development of research approaches, and the interpretation and
critical review of the data. Paul Hearty and Malcolm McCulloch were instrumental in
providing the impetus to investigate the nature of sea level and climate during the peak
of the last interglacial as recorded in emergent reef deposits along the West Australian
coastline. Many of the fundamental questions that have been addressed in this thesis
stemmed from previous work undertaken by these individuals and hypotheses that were
generated from the same. Paul Hearty and Malcolm McCulloch acquired the initial
Australian Research Council funding which funded this research and my Ph.D. stipend.
A James Cook University graduate research scheme grant (MRG) provided extra funding
for fieldwork in Western Australia. Both of these individuals have also contributed much
to the acquisition and interpretation of the data generated herein, and in the presentation
of results. However, both recognise This Author’s role as chief investigator in these
studies, and as having acquired the majority of the data, formulating the bulk of the
interpretations, preparing of drafts, and refining of the manuscripts.
STATEMENT OF CONTENT
The body of this thesis is presented as four separate, self-contained works, which will be
submitted to scientific journals of international significance, in a similar format. Due to
the completeness of each section a small amount of repetition has been unavoidable.
This particularly the case with the methods section, which describes the analytical
techniques used in U-series dating of corals. There has also been some overlap in data
interpretation.
Acknowledgements - vi -
M.J. O’Leary – Ph.D. Thesis
ACKNOWLEDGEMENTS
The Author would like to acknowledge the contributions of the following individuals and
groups towards the work presented herein.
The Canberra crew: A big thanks to Malcolm McCulloch at the RSES, Australian
National University for providing support, technical skills and considerable runtime to
analyse my corals, Graham Mortimer for his patience and shared office space as well as
Bridget, Lois, Eva, Carles. To Pete, and Sarah for providing accommodation and Damian
for providing accommodation and homebrew.
The West Australian crew: To all those people who helped me out with field work, a
special thanks to CALM in Exmouth and Denham for access to sites and permission to
collect corals within National Parks. To Dampier Salt Ltd for access onto their mine
lease and finally to Dave Bauer of Arid Landscapes whose logistical support was greatly
appreciated.
The Sydney crew: To Tick, Sav and Dom, although you place was a bit like a transit
lounge for me thanks for being so accommodating, the bed was always soft and the beer
always cold.
The Townsville crew: So many people I would like to thank for their help, friendship and
support. First to my best mates Jo Jo, Belinda and Andy; friends and flat mates, de Jersey,
Katie, Dave, Aileen, and Ellie; as well as Toni and Kirsten; and Thomas for his constant
distractions and wild adventures. Shelley and little Kai my newest (literally) best friend
The Family: To my Mum and Dad you both instilled qualities in me that I am proud and
for that I thankyou, to my sister Lisa who is embarking on her own adventure and the
rest of the Previtera clan.
Academic supervisors official and unofficial: Thanks again must go to Malcolm
McCulloch, Jody Webster and Peter Ridd. But most thanks must go to Paul Hearty,
friend and mentor, for all your support, guidance, encouragement and patience.
Acknowledgements - vii -
M.J. O’Leary – Ph.D. Thesis
Finally I’d like to thank Caro, although you appeared late in the game, you turned out to
be a match winner for me in more ways than one.
Table of Contents - viii -
M.J. O’Leary – Ph.D. Thesis
TABLE OF CONTENTS
STATEMENT OF ACCESS I
STATEMENT OF SOURCES II
ABSTRACT III
STATEMENTS OF THE CONTRIBUTION BY OTHERS V
ACKNOWLEDGEMENTS VI
TABLE OF CONTENTS VIII
LIST OF FIGURES AND TABLES XIII
INTRODUCTION XIX
REFERENCES XXIV
SECTION A
COMPARISON OF UNCORRECTED AND OPEN-SYSTEM CORRECTED U-
SERIES CORAL AGES FROM FOSSIL CORAL REEFS, WESTERN AUSTRALIA
A.1 ABSTRACT 2
A.2 INTRODUCTION 3
A.3 MODELLING OPEN-SYSTEM BEHAVIOR IN CORALS 5
A.4 METHODS 7
A.4.1 Study region and coral samples 7
A.4.2 Sample preparation and analytical procedures 8
A.4.3. Screening of U-series coral dates 9
A.5 INDEPENDENT TESTS OF U-SERIES AGE RELIABILITY 10
A.5.1 Does coral age fall within the accepted duration of MIS 5e? 10
A.5.2 Do ages follow stratigraphic order? 11
A.5.3 Do subsamples from a single coral colony yield equal ages? 11
A.6 RESULTS 12
A.6.1 Coral geochemistry 12
A.6.2 Corrected and uncorrected age and the duration of MIS 5e 12
A.6.3 Uncorrected and corrected ages from a stacked coral sequence 13
Table of Contents - ix -
M.J. O’Leary – Ph.D. Thesis
A.6.4 Uncorrected and corrected ages from individual corals 13
A.7 DISCUSSION 14
A.7.1 The duration of MIS 5e 14
A.7.2 The fundamental principle of stratigraphic superposition 15
A.7.3 Age equivalence in individual corals 17
A.7.4 Potential miscalculations in the Thompson’s alpha-recoil 18
A.7.5 How best to use U-series coral ages 19
A.8 CONCLUSIONS 20
A.9 REFERENCES 21
A.10 FIGURES 25
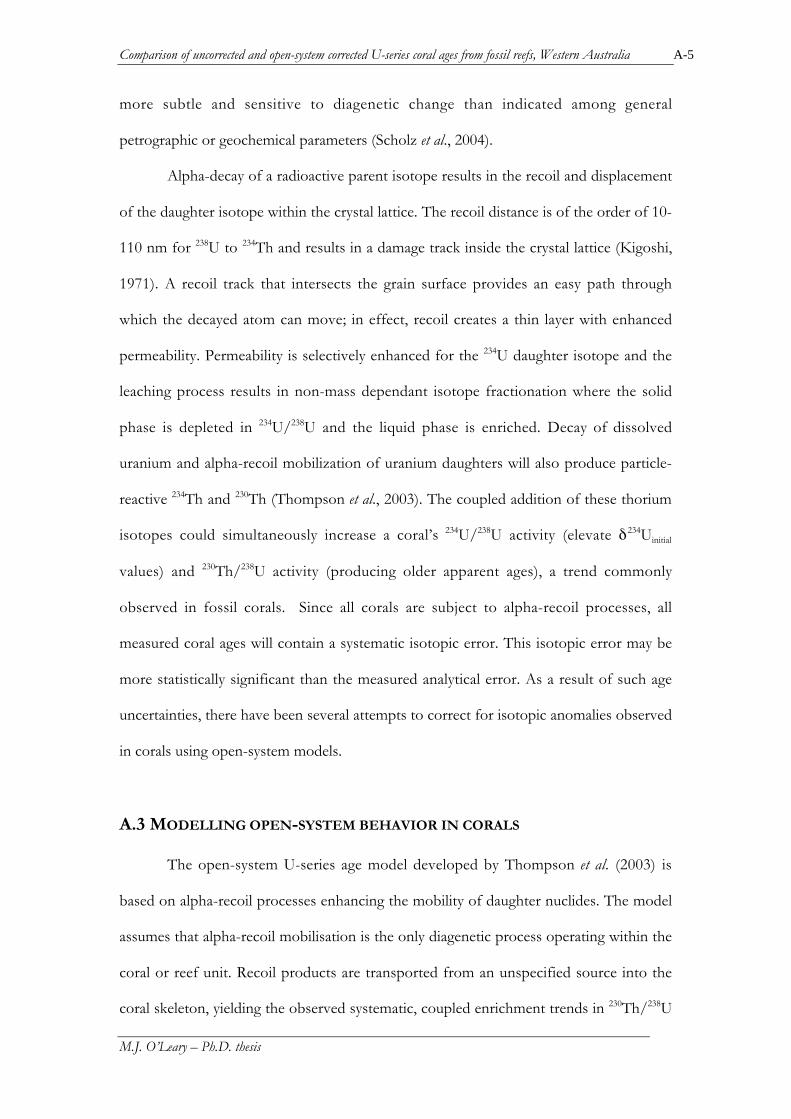
Table 1: U-series data 36
Notes on Table 1. 37
Table 2: XRD data 38
SECTION B
MORPHOSTRATIGRAPHY AND GEOCHRONOLOGY OF A FOSSIL
FRINGING REEF: CAPE CUVIER, WESTERN AUSTRALIA
B.1 ABSTRACT 2
B.2 INTRODUCTION 3
B.3 CLIMATE AND OCEANOGRAPHIC SETTING 4
B.4 METHODS 5
B.4.1 Surveying, site descriptions and sample collection 5
B.4.2 Sample preparation and analytical procedures 6
B.4.3 Reliability of 234U/230Th coral ages 7
B.4.4 Open system corrections 8
B.5 RESULTS 9
B.5.1 Coral reef geomorphology 9
B.5.2 XRD analysis 10
B.5.3 U-series coral dates 10
B.5.4 Stratigraphic correlation of U-series ages 11
Table of Contents - x -
M.J. O’Leary – Ph.D. Thesis
B.5.5 Lateral reef accretion and U-series ages 12
B.5.6 Incipient reef development and U-series ages 12
B.6 DISCUSSION 13
B.6.1 Reef morphology, evolution and neotectonics 13
B.6.1.1 Reef slope advance 14
B.6.1.2 Sea cliff retreat 15
B.6.1.3 Coralgal rim development 15
B.6.2 U-series age dates and open system age corrections 16
B.6.2.1 Stratigraphic integrity of U-series ages 16
B.6.2.2 Lateral reef growth and U-series ages 18
B.6.2.3 Open system age corrections from the coralgal rim 18
B.7 CONCLUSIONS 19
B.8 REFERENCES 21
B.9 FIGURES 24
Table 1: XRD analysis 31
Table 2: U-series data 32
Notes to Table 2.
SECTION C
CORAL REEF AND STROMATOLITE DEVELOPMENT IN SHARK BAY
DURING RECENT AND LAST INTERGLACIAL SEA-LEVEL HIGH-STANDS
C.1 ABSTRACT 2
C.2 INTRODUCTION 3
C.3 MODERN ENVIRONMENTAL SETTING 4
C.3.1 Coastal geomorphology 4
C.3.2 Oceanography 5
C.4 REEF BIOGEOGRAPHY AND ECOLOGY 6
C.4.1 Shark Bay coral communities 6
C.4.2 Shark Bay stromatolite communities 7
C.5 METHODS 7
C.5.1 Stratigraphic logs 8
Table of Contents - xi -
M.J. O’Leary – Ph.D. Thesis
C.5.2 Sample collection 8
C.5.3 Geochronology 8
C.6 RESULTS 9
C.6.1 Baba Head 9
C.6.2 Tetrodon Loop 10
C.6.3 Monkey Mia 10
C.6.4 Gladstone North 11
C.6.5 Pelican Island 12
C.6.6 Nilemah 12
C.7 DISCUSSION 13
C.7.1 Chronological framework 13
C.7.1.1 Age of marine units in Shark Bay 13
C.7.1.2 Timing of coral reef development 13
C.7.2 Timing and emplacement of major morphological features 14
C.7.2.1 Barrier Islands 14
C.7.2.2 Coastal Physiography 15
C.7.3 Disparity in MIS 1 and MIS 5e environments 16
C.7.3.1 Modern Bathymetry 16
C.7.3.2 Paleobathymetry 17
C.7.3.3 Paleosalinities 18
C.8 CONCLUSIONS 19
C.9 REFERENCES 20
C 10 FIGURES 23
Table 1: Shark Bay formations 31
Table 2: U-series data 31
Notes on Table 1. 32
Table 3: Whole rock A/I data 34
SECTION D
URANIUM-SERIES DATING OF CRUSTOSE CORALLINE ALGAE
(CORALLINACEAE)
Table of Contents - xii -
M.J. O’Leary – Ph.D. Thesis
D.1 ABSTRACT 2
D.2 INTRODUCTION 3
D.3 METHODS 5
D.3.1 Sample collection 5
D.3.2 Sample preparation and analytical techniques 6
D.3.2.1 Mechanical cleaning 6
D.3.2.2 Column chemistry 6
D.3.2.3 234U/238U and 230Th/238U measurements 7
D.4 RESULTS 7
D.4.1 Living CCA 7
D.4.2 Submodern CCA 8
D.4.3 MIS 5e 8
D.4.4 MIS 9 10
D.4.5 Middle Pleistocene (MIS 11?) 10
D.4.5 U-series Stratigraphy 11
D.5 DISCUSSION 11
D.5.1 Geochemical evolution of CCA 11
D.5.1.1 Initial chemistries 11
D.5.1.2 Uranium uptake and loss 11
D.5.2 Reliability and accuracy of CCA U-series ages 12
D.5.2.1 Living CCA and U-series age anomalies 13
D.5.2.2 The effect of U and Th uptake on a MIS 5e reef system 13
D.5.2.3 U-series age reliability beyond the last interglacial 14
D.5.2.4 Advanced calcite alteration, uranium loss, and U-series age reliability 15
D.5.2.5 Stratigraphic integrity of CCA U-series ages 16
D.6 CONCLUSIONS 16
D.7 REFERENCES 17
D.8 FIGURES 21
Table 1: U-series 27
Notes on Table 1 28
List of figures and tables - xiii -
M.J. O’Leary – Ph.D. Thesis
LIST OF FIGURES AND TABLES
Section A
Figure 1: A Porites coral (NYC) collected a few metres above sea level at the mouth of
Yardie Creek, Cape Range. A sliced 7 mm thick section (left) and its X-radiograph
positive print (right). The lighter areas on the X-ray print represent denser areas of the
coral and are associated with calcite alteration. Brown staining observed on the sliced
section is sediment contamination, sourced through pore water movement along less
dense growth banding within the coral. A-25
Figure 2: Map of Western Australia showing fossil reef and sample locations. Sample
codes shown in brackets. A-26
Figure 3: A) Compilation of Western Australian U-series data plotted on a 234U/238U
activity ratio diagram. The blue line represents closed system evolution with a modern
seawater 234U/238U activity of 1.1466 and the red segment represents the duration of MIS
5e. The sub-vertical lines are lines of equal 230Th age. B) 234U/238U activity at the time of
coral growth versus 230Th-age. The horizontal grey shaded area represents the zone of age
reliability where δ234Uinitial = 146.6 ± 4‰ (horizontal dotted line). Vertical shaded area
represents the known duration of MIS 5e based on Edwards et al. (2003). Reliable
uncorrected (black circle) and open-system corrected (triangles) ages should plot within
the red box. Open-system ages are corrected to a δ234Uinitial seawater value of 146.6.
A-27
Figure 4: A plot of uranium concentration vs. measured 234U/238U activity. The solid
circles are corals with 232Th concentrations >0.75 ppb and the open circles corals with232Th concentrations <0.75 ppb. The shaded area represents the average spread of
uranium concentrations for modern corals (Shen and Dunbar 1995). A positive
correlation of increasing 234U/238U activities with increasing uranium concentrations is
observed in corals with232Th > 0.75 ppb. A-28
List of figures and tables - xiv -
M.J. O’Leary – Ph.D. Thesis
Figure 5: A plot of 232Th concentrations (log scale) vs. age. Corals with 232Th
concentrations > 1 ppb exhibit greater age variability than corals with 232Th <1 ppb. This
suggest that allochthonous 230Th, 238U or 238U may have been incorporated along with232Th into the coral skeleton. A-29
Figure 6. Coral age collected from a vertical reef section at Cape Cuvier. Circles
represent uncorrected coral age, open for 232Th > 1 ppb and closed for 232Th < 1 ppb.
Triangles represent open-system corrected coral age, open for 232Th > 1 ppb and closed
for 232Th < 1 ppb. A-30
Figure 7. U-series dating results from a Holocene sea cliff cut into a MIS 5e reef terrace
at Cape Cuvier.. Yellow dots represent the sample locations, both corrected and
uncorrected ages are reported. All measured samples had elevated δ234Uinitial, bold
numbers indicate coral samples with 232Th < 1ppb. A-31
Figure 8: Compilation of LDS1(Porites) U-series subsample data plotted on a 234U/238U
activity ratio diagram. Red indicates surface coral subsamples and blue apparent pristine
interior subsamples. The triangles represent open-system corrections. Blue line
represents closed system evolution with and modern seawater 234U/238U activity of
1.1466. Blue dotted line represents closed system evolution with a modern seawater234U/238U activity of 1.1566. A-32
Figure 9: U and Th Isotopic ratios vs. uranium concentration in multiple coral
subsamples taken from LDS1. A-33
Figure 10. Coral subsamples showing δ238Uinitial at the time of coral growth vs. 230Th-age.
Different colours represent a different individual coral. Triangles represent open-system
ages corrected to a δ234Uinitial seawater value of 146.6‰. Grey shaded areas indicate
subsamples from the same coral showing age equivalence. A-34
Figure 11. A compilation of Cape Cuvier corals on a 234U/238U activity ratio diagram.
Blue line represents closed system evolution with a modern seawater 234U/238U activity of
1.1466. The dashed line indicates a linear compositional array representative of those
Cape Cuvier corals. A-35
List of figures and tables - xv -
M.J. O’Leary – Ph.D. Thesis
Table 1: U-series analysis. A-36
Table 2: XRD analysis A-38
Section B
Figure 1: A map showing the locality of Cape Cuvier. B-22
Figure 2: An aerial photograph of Cape Cuvier. B-23
Figure 3: A) Modern and emergent reef platform at Cape Cuvier (looking north) at low
tide, coralline algae can be seen encrusting the fossil reef in the foreground, cliffs in the
background host the upper coralgal rim. B) 3 m high sea cliff section, thick coral (A.
digitifera) plates can be observed with black dots representing a coral drill core. C)
Seaward looking view of the emergent reef flat, a drainage gutter displays similar
morphology to the modern reef flat in the background. D) Coralline algae can be seen
encrusting the paleo-sea-cliff mid way up photo. E) A sectioned sample of A. humulis
collected from the sea cliff. F) a large favid coral exposed on the surface of the emergent
reef flat, it appears truncated and capped by coralline algae. G) Wave cut coral terrace at
an elevation of +10 m capped by a coralline algal conglomerate. H) Fossil beach at 7.4 m.
B-24
Figure 4: Surveyed transect of the emergent reef terrace at Cape Cuvier, red numbers are
conventional ages and the black are corrected ages. B-25
Figure 5: δ234Uinitial vs. 230Th-age. All δ234Uinitial values are greater than the modern marine234U/238U seawater activity of 146.6‰. Corrected U-series ages plot onto the modern
seawater δ234U values but do not conform to the known duration and elevation of MIS
5e sea levels (solid blue area). B-26
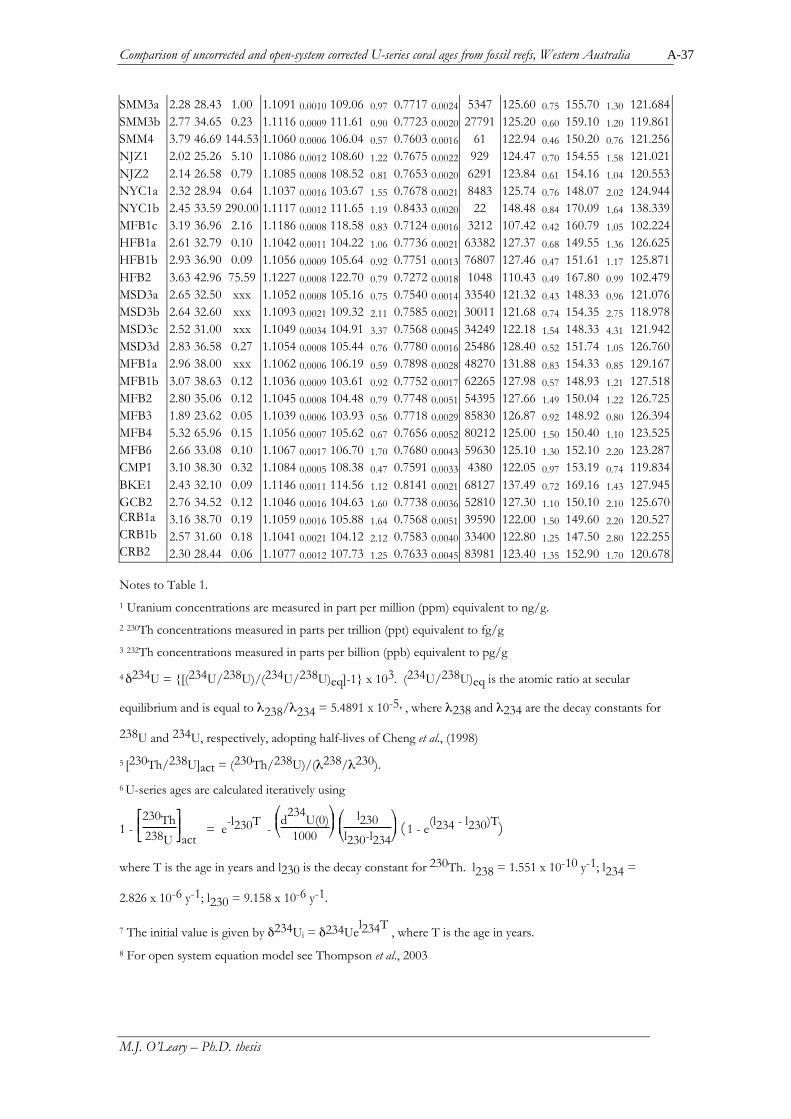
Figure 6: Isotopic ratios and 230Th age for coral collected down a 3 m measured section
conventional (triangle) and corrected (diamond) U-series age in thousands of years (ka).
Shaded represents average values with 1 SD. B-27
Figure 7: Compilation of the U-series data of the MIS 5e corals on a 234U/238U activity
ratio diagram. The solid blue line represents closed system evolution with an initial
modern seawater value of 1.1466. The dashed line indicates a linear compositional array
which intersects the closed-system evolution curve at 124 ka. B-28
Table 1: XRD analysis. B-29
Table 2: U-series data. B-29
Section C
Figure 1: Map of Australia showing location of three principal reef growing regions
along the West Australian coast including; Ningaloo Reef (Cape Range) 21˚- 23˚ S, Shark
Bay (study location), 25.5 - 26.5˚ S and the Houtman Abrolhos (island group) 28˚ S.
Arrows indicate Leeuwin Current flow direction. C-23
Figure 2: Location Map of Shark Bay. C-24
Figure 3: Salinity contours for Shark Bay in parts per thousand (ppt). Thick black lines
represent areas of extensive stromatolite growth and black stars indicate presence of
living corals (modified from Marsh 1990). The crosses indicate the location of an
emergent fossil coral reef. C-25
Figure 4: A) a coral community at Broadhurst Bay and B) Stromatolite community at
Goat Point. C-26
Figure 5: A) Baba Head, B) Tetrodon Loop, C) Monkey Mia, D) Gladstone North E)
Satellite image of the 850 m long Pelican Island, F) Photo of sample SHP1, a living
stromatolite from Nilemah, Hamlin Pool. The sample was impregnated with resin before
sectioning. The growth substrate was a Pleistocene coral. C-27
List of figures and tables - xvii -
M.J. O’Leary – Ph.D. Thesis
Figure 6: Satellite image of the southern tip of Dirk Hartog Island, including South
Passage and Tetrodon Loop. The brown indicates vegetated areas and the white areas of
active dune movement. C-28
Figure 7: Diagrammatic sections of field sites around Shark Bay. Coral elevations are
accurate to within ± 10 cm. C-29
Figure 8: U-series coral ages for Shark Bay. C-30
Table 1: Stratigraphic nomenclature for Shark Bay. C-31
Table 2: U-Series data. C-32
Table 3: Whole rock A/I data. C-34
Section D
Figure 1: Map of the Indo-Pacific showing coral species diversity (taken from Veron
Corals of the World 1998). Localities of coral collection are indicated by the red dots. Fossil
reef ages were established by previous workers. D-21
Figure 2: Measured δ234U activities for living and modern CCA. The black dotted line
represents modern seawater δ234U activities (Robinson et al., 2004); the shaded area
represents 2 s.e. error. D-22
Figure 3: Compilation of U (blue) and 230Th (red) concentrations versus age for all CCA.
D-23
Figure 4: U and 230Th concentrations in living (actual age = 0) CCA versus measured
age. The lower the U concentration the higher the age error encountered. D-24
List of figures and tables - xviii -
M.J. O’Leary – Ph.D. Thesis
Figure 5: Isotopic ratios and age for CCA (black triangle) and coral (grey circle) collected
down a 3 m measured section at Cape Cuvier. 5a) 232Th concentrations in parts per
billion. 5b) 234U/238U isotopic ratios. 5c) 230Th/238U isotopic ratios. 5d) U-series age in
thousands of years (ka). 5e) δ234Uinitial back calculated for CCA and coral, closed system
evolution should plot within the shaded area. D-25
Figure 6 Compilation of the U-series data for CCA (black) and corals (grey) on a234U/238U activity ratio diagram. The solid blue line represents closed system evolution
with and initial modern seawater value of 1.1466. The dashed line indicates a linear
compositional array representative of those observed for CCA. D-26
Table 1: U-series data. D-27
Introduction - xix -
M.J. O’Leary – Ph.D. Thesis
INTRODUCTION
Western Australia (WA) figures prominently in the traditional literature on Quaternary
sea level, largely as a result of Fairbridge (1948; 1950; 1954; 1961), Teichert (1947; 1950),
and Logan et al. (1970). In the context of the ‘stable coast’ paradigm WA holds a strong
attraction. Its position as an intraplate continental margin, in the far field of former ice
sheets, minimizes the potential for vertical displacement as a result of glacio-isostatic or
tectonic processes. This is exemplified in the near constant +3 ± 1 m elevations of well-
developed fossil reef deposits and erosional terraces exposed along 2500 km of WA
coastline (Stirling et al., 1998) from Cape Leeuwin in the south (34.4˚ S) to Vlamingh
Head in the northwest (21.8˚ S). These reef and terrace features are common to many
stable coastlines around the world (Hearty et al., in review (a))
Based on field studies and gemorphological interpretations, Fairbridge, Teichert
and Logan correctly identified these emergent coral reef units as belonging to Late
from Fairbridge Bluff, Rottnest Island and Boundary Beach, Red Bluff (Veeh, 1966)
returned somewhat imprecise ages of 100 ± 20 and 120 ± 40 ka, but did confirm that
reef units belonged to the broad last interglacial cycle known as marine isotope stage
(MIS) 5 (~74-135 ka). Veeh et al. (1976) further refined the interval of reef development
to the peak of the last interglacial, marine isotope stage (MIS) 5e, via α-spectrometry of
corals from an emergent fringing reef complex at Cape Cuvier.
Despite the ubiquitous nature of the +3 ± 1 m terrace along the WA coastline,
geomorphological investigations (Denman and Van de Graaff, 1977; Veeh et al., 1979
and Van de Graaff et al., 1979) from the Lake Macleod and Cape Range areas identified
incipient reef and erosional terraces up to 6 m higher than the archetypal +3 ± 1 m
benchmark. There appears to be a contradiction when invoking a warping or uplift
Introduction - xx -
M.J. O’Leary – Ph.D. Thesis
scenario for these higher marine units against a stable coast paradigm, and lacking
accurate dating methods, the true nature of these upper marine deposits could not be
assessed with confidence.
Since the introduction of high-precision thermal ionisation (TIMS) and multi-
collector inductively coupled plasma mass spectrometric (MC ICPMS) dating techniques,
over 100 coral dates have been published from WA (Zhu et al., 1993; Collins et al., 1993a;
Stirling et al., 1995; Eisenhauer et al., 1996; Stirling et al., 1998; Collins et al., 2003).
Despite this, the exact timing, duration and behaviour of sea level during MIS 5e in WA
remain controversial. Not only do estimates for the timing of onset and termination of
the last interglacial vary widely between localities, the details of sea-level fluctuations
within this interval also remain uncertain. For example Stirling et al. (1995; 1998) reported
a single phase of constant high sea-level for WA between 128 ± 1 and 116 ± 1 ka, while
studies by Chen et al. (1991) from Bahamas, and Muhs et al. (2002) from Hawaii place the
initiation and termination of MIS 5e at 132 and 114 ka, respectively. Furthermore, studies
from the Bahamas (Neumann and Hearty, 1996), Bermuda (Hearty, 2002), Hawaii
(Sherman et al., 1993; Hearty et al., 2000), and the Mediterranean (Hearty et al., 1986;
Riccio et al., 2001) report multiple sea-level oscillations during MIS 5e. These studies
describe MIS 5e sea level as a series of intervals of transition and stability. First a
relatively stable early 5e at +2.5 ± 1 m, second, a short regression of a few meters, third,
another brief rise to +3-4 m. The termination of MIS 5e was marked by abrupt shifts of
sea level between +6 and +9 m that formed multiple notches and narrow benches.
Much of the uncertainty surrounding the timing and absolute elevations of sea-
level events is the result of both poor stratigraphic interpretation and inaccurate uranium-
series (U-series) age calculations. Furthermore, coral reefs are less than ideal monitors of
sea-level change; rather, they might be preferred as monitors of sea-level stability as their
response time and depositional tempo may be measured in hundreds or thousands of
Introduction - xxi -
M.J. O’Leary – Ph.D. Thesis
years (Hearty et al. (in review (b)). Given the possibility that sea-level shifts of several
metres may take as little as tens to hundreds of years to occur (Blanchon and Shaw, 1995;
Neumann and Hearty, 1996), reefs are a less than optimal geological media for
monitoring such sea-level changes. Their response may be slow, or nonexistant.
In paleo-sea-level reconstructions the first presumption is that a measured sea-
level datum has not been affected by vertical displacement and so represents eustatic sea
level. If vertical displacement is suspected, knowledge of uplift rate over time will be
required. This is usually resolved by correlating the uplifted sea-level benchmark with a
contemporaneous benchmark from regions that have not experienced tectonic uplift.
The second presumption is that a measured U-series age represents a coral’s true
age. The primary criterion in determining the reliability of coral U-series ages has been to
back calculate measured δ234U activity ratios (Edwards et al., 1987a; Chen et al., 1991;
Stirling et al., 1995) that should correspond to modern seawater 234U/238U activity of
146.6 ± 2.5‰ (Robinson et al 2004). However, it is more often the case that fossil corals
exhibit higher initial δ234U (δ234Uinitial) values than living corals (Bender et al., 1979; Bard et
al., 1992; Gallup et al., 1994; Stirling et al., 1995; 2001) usually the result of open-system
isotopic exchange processes. There are a number of potential mechanisms that may
contribute to open-system behaviour in corals including dissolution and precipitation
reactions (Bar-Matthews et al., 1993), decay dependent alpha-recoil mobilization (Fruijtier
et al., 2000; Henderson et al., 2001) and solid state diffusion (Cherniak, 1997). While
uranium solid-state diffusion is expected to be negligible on a 104-105 year timescale and
not an important process (Robinson et al., 2006) in this case, other mechanisms related to
mineralisation (Bar-Matthews et al., 1993) and alpha-recoil processes (Thompson et al.,
2003) are known to produce the range of isotopic anomalies commonly observed in
corals.
Introduction - xxii -
M.J. O’Leary – Ph.D. Thesis
While it is possible to screen corals for diagenetic anomalies using general
petrographic and geochemical parameters, the effects of alpha-recoil isotopic exchange
can lead to age uncertainties in even the most pristine coral samples. This isotopic error
may be more statistically significant than measured analytical error. As a result of these
age uncertainties, there have been several attempts to correct for isotopic anomalies
observed in corals using open-system models of Thompson et al. (2003), Villament and
Feuillet (2003) and Scholz et al. (2004). However, it is understood that these open-system
corrections can introduce their own age uncertainties (Robinson et al., 2006).
The desire to understand the true nature of sea level in WA during the
penultimate interglacial, and its relation to other globally important sites, has motivated
the work presented in this dissertation. However, in the attempt to resolve these
outstanding sea-level issues, we must first address the following questions: 1) Does the
measured sea-level datum represent a eustatic sea-level elevation? 2) How reliable are the
measured U-series coral dates? 3) Do open-system age corrections represent a coral’s
true age?
I attempted to resolve some of these questions through: 1) detailed geologic and
morphologic investigations using the same techniques successfully employed by early
workers (Teichert, Fairbridge and Logan); 2) examination of the degree of uranium and
thorium isotopic shift from a closed-system seawater evolution curve; and 3) comparison
of U-series age with independent age controls including stratigraphic superposition and
age equivalence within individual corals.
The initial aim of Section A is to select corals, based on geochemical and age
control protocols, whose uncorrected and corrected U-series ages come closest to
representing the corals true age. This screened age data are then applied to two
geographically different locations at Cape Cuvier (Section B) and Shark Bay (Section C).
Detailed stratigraphic and geomorphic analyses are combined with U-series coral age data
Introduction - xxiii -
M.J. O’Leary – Ph.D. Thesis
in an attempt to resolve paleosea-level and tectonic issues at both these localities. This
study also recognises some of the geographical and ecological limitations in utilizing
corals as a dating medium. Thus, in the final section (D), the potential utility of U-series
dating of crustose coralline algae is explored.
It is evident from previous publications from stable carbonate platforms
(Neumann and Hearty, 1996; Hearty and Neumann 2001; Hearty 2002) that sea-level
events may be brief and oscillatory, leaving little geological evidence, and making them
very difficult do date. The brief duration of the stillstand results in notches, rubble
benches, or incipient coral reef development. These thin and patchy incipient reefs are
generally more prone to burial, erosion or diagenesis, thus rarely offering any datable
material. At the outset of this study, it was hoped that the dual use of detailed
stratigraphic analysis and high-precision U-series dating would offer the best opportunity
to resolve the outstanding questions of Quaternary sea levels. This overall objective will
be evaluated in the following Sections.
References - xxiv -
M.J. O’Leary – Ph.D. Thesis
REFERENCES
Bar-Matthews, M., Wasserburg, G.J., Chen J.H., 1993. Diagenesis of fossil coralskeletons—correlation between trace-elements, textures, and U-234/U-238.Geochimica et Cosmochimica Acta 57, 257-276.
Bard, E., Fairbanks, R.G., Hamelin, B., 1992. How accurate are the U/Th ages obtainedby mass spectrometry on coral terraces, in: G.J. Kukla, E. Went (Eds.), Start of aGlacial, NATO ASI Series 13, Springer, Berlin, pp. 15-21.
Blanchon, P., Shaw, J., 1995. Reef drowning during the last deglaciation: Evidence forcatastrophic sea-level rise and ice-sheet collapse. Geology 23(1), 4-8.
Bender, M.L., Fairbanks, R.G., Taylor, F.W., Matthews, R.K., Goddard, J.G., Broecker,W.S., 1979. Uranium-series dating of Pleistocene reef tracts of Barbados, WestIndies. Geological Society of America Bulletin 90, 577-594.
Cherniak, D.J., 1997. An experimental study of strontium and lead diffusion in calcite,and implications for the carbonate diagenesis and metamorphism. Geochimica etCosmochimica Acta 61, 4173-4179.
Chen J.H., Curran H.A., White, B., Wasserburg, G.J., 1991. Precise chronology of theLast Interglacial period: 234U230Th data from fossil coral reefs in the Bahamas.Geological Society of America Bulletin 103, 82-97.
Collins, L.B., Zhu, Z.R., Wyrwoll, K.H., Hatcher, B.G., Playford, P.E., Chen, J.H.,Eisenhauer, A., Wasserburg, G.J., 1993a. Late Quaternary evolution of coral reefson a cool-water carbonate margin: the Abrolhos carbonate platforms, SouthwestAustralia. Marine Geology 110, 203 – 212.
Denman, P.D., van de Graaff, W.J.E., 1977. Emergent Quaternary marine deposits in theLake MacLeod area, Western Australia. Western Australia Geological SurveyAnnual Report, 1976, 32-36.
Edwards, R.L., Chen, J.H., Wasserburg, G.J., 1987a. 238U, 234U, 230Th, 232Th systematicsand the precise measurement of time over the past 500,000 years. Earth andPlanetary Science Letters 81, 175-192.
Eisenhauer, A., Zhu, Z.R., Collins, L.B., Wyrwoll, K.H., Eichstatter, R., 1996. The LastInterglacial sea level change: new evidence from the Abrolhos Islands, WestAustralia. Geol. Rundsch. 85, 606-614.
Fairbridge, R.W., 1948. Notes on the geomorphology of the Pelsart Group of theHoutman’s Abrolhos Islands. Journal of the Royal Society of Western Australia 33,1-36.
Fairbridge, R.W., 1950. The geology and geomorphology of Point Peron, WesternAustralia. Journal of the Royal Society of Western Australia 34, 35-72.
Fairbridge, R.W., 1954. Quaternary eustatic data for Western Australia and adjacentstates. Proceedings' of the Pan Indian Ocean Science Congress, Perth, Western
References - xxv -
M.J. O’Leary – Ph.D. Thesis
Australia, 64-84.
Fairbridge, R.W., 1961. Eustatic changes in sea level. Physics and Chemistry of the Earth4, 99-187.
Fruijtier, C., Elliot, T., Schlager, W., 2000. Mass-spectrometric 234U/230Th ages from theKey Largo Formation, Florida Keys, United States: Constraints on diagenetic agedisturbance. GSA Bulletin 112, 267-277.
Gallup, C.D., Edwards, R.L., Johnson, R.G., 1994. The Timing of high sea levels overthe past 200,000 years. Science 263, 796-800.
Hearty, P.J., 1987. New data on the Pleistocene of Mallorca. Quaternary Science Reviews6, 245-257.
Hearty, P.J., 1998. The geology of Eleuthera Island, Bahamas: a Rosetta Stone ofQuaternary stratigraphy and sea-level history. Quaternary Science Reviews 17,333-355.
Hearty, P.J., Kaufman, D.S., Olson, S.L., and James, H.F., 2000. Stratigraphy and whole-rock amino acid geochronology of key Holocene and Last Interglacial carbonatedeposits in the Hawaiian Islands. Pacific Science 54(4), 423-442.
Hearty, P.J., and Neumann, A.C., 2001. Rapid sea-level and climate change at the close ofthe Last Interglaciation (MIS 5e): Evidence from the Bahama Islands. QuaternaryScience Reviews 20, 1881-1895.
Hearty, P.J., 2002. A revision of the late Pleistocene stratigraphy of Bermuda.Sedimentary Geology 153 (1-2), 1-21.
Hearty, P.J., Neumann, A.C., Hollin, J.T., O’Leary M.J., McCulloch M.T., in review (a).Sea level oscillations during the last interglaciation (sensu stricto MIS 5e).Quaternary Science Reviews.
Hearty, P.J., Neumann, A.C., O’Leary M.J., in review (b). Comment on “Record of MIS5 sea-level highstands based on U/Th dated coral terraces of Haiti” (B. Dumas,C.T. Hoang, and J. Raffy, 2006, Quaternary International, v. 145-146, p. 106-118).Quaternary International.
Henderson, G.M., Slowey, N.C., Fleisher, M.Q., 2001. U-Th dating of carbonateplatform and slope sediments. Geochemica et Cosmochemica Acta 65, 2757-2770.
Logan, B.W., Read, J.F., Davis, G.R., 1970. History of carbonate sedimentation,Quaternary Epoch, Shark Bay, Western Australia. American Association ofPetroleum Geologists Memoirs 13, 38 – 84.
Muhs, D.R., Simmons, K.R., Steinke, B., 2002. Timing and warmth of the LastInterglacial period: new U/Th evidence from Hawaii and Bermuda and a newfossil compilation for North America. Quaternary Sciences Reviews 21, 1355-1383.
References - xxvi -
M.J. O’Leary – Ph.D. Thesis
Neumann, A.C., Hearty, P.J., 1996. Rapid sea-level changes at the close of the lastinterglacial (stage 5e) recorded in Bahamian Island geology. Geology 24, 775-778.
Riccio, A., Riggio, F., Romano, P., 2001. Sea level fluctuations during Oxygen IsotopeStage 5: new data from fossil shorelines in the Sorrento Peninsula (Southern Italy).Zeitschrift fur Geomorphologie N.F. 45(1), 121-137.
Robinson, L.F., Belshaw, N. S., Henderson ,G.M., 2004. U and Th concentrations andisotope ratios in modern carbonates and waters from the Bahamas. Geochimica etCosmochimica Acta 68, 1777–1789.
Robinson, L.F., Adkins, J.F., Fernandez, D.P., Burnett D.S., Wang, S-L., Gagnon, A.C.,Krakauer, N., 2006. Primary U-distribution in scleractinian corals and itsimplications for U-series dating. Geochemistry Geophysics Geosystems 7 (5), 1-20.
Sherman, C.E., Glenn, C.R., Jones, A.T., Burnett, W.C., Schwarcz, H.P., 1993. Newevidence for two highstands of the sea during the last interglacial, oxygen isotopesubstage 5e. Geology 21, 1079-1082.
Stirling, C.H., Esat, T.M., McCulloch, M.T., Lambeck, K., 1995. High-precision U-seriesdating of corals from Western Australia and implications for the timing andduration of the Last Interglacial. Earth and Planetary Science Letters 135, 115-130.
Stirling, C.H., Esat, T.M., Lambeck, K., McCulloch, M.T., 1998. Timing and duration ofthe Last Interglacial: evidence for a restricted interval of widespread coral reefgrowth. Earth and Planetary Science Letters 160, 745-762.
Stirling, C.H., Esat, T.M., Lambeck, K., McCulloch, M.T., Blake, S.G., Lee D.C.,Halliday, A.N., 2001. Orbital forcing of the marine isotope stage 9 interglacial.Science 291 (5502), 290-293.
Scholz, D, Mangini, A, Felis, T., 2004. U-series dating of diagenetically altered fossil reefcorals. Earth And Planetary Science Letters 218 (1-2), 163-178.
Thompson, W.G., Spiegelmann, M.W., Goldstein, S.L., Speed, R.C., 2003. An open-system model for U-series age determinations of fossil corals. Earth PlanetaryScience Letters 210, 365–38.
Teichert, C., 1947. Contributions to the geology of Houtman’s Abrolhos. Proceedings ofthe Linnean Society of Western Australia. New South Wales 71, 145 – 196.
Teichert, C., 1950. Late Quaternary changes of sea level at Rottnest Island, WesternAustralia. Royal Society of Victoria Proceedings 59, 63 – 79. 275 – 298.
Van de Graaff, W.J.E., Denman, P.D., Hocking, R.M., 1976. Emerged Pleistocenemarine terraces on Cape Range, Western Australia. Geological Survey of WesternAustralia Annual Report 1975, 62-69.
Veeh, H.H., 1966. Th/U and U/U ages of Pleistocene high sea level stand. Journal ofGeophysical Research 71, 3379 – 3386.
References - xxvii -
M.J. O’Leary – Ph.D. Thesis
Veeh, H.H., Sehwebel, D., van de Graaf, W.J.E., Denman, P.D., 1979. Uranium-seriesages of eoralline terrace deposits in Western Australia. Journal of the GeologicalSociety of Australia, 26, 285-292.
Villemant, B., Feuillet, N., 2003. Dating open systems by the 238U-234U-230Th method:application to Quaternary reef terraces. Earth and Planetary Science Letters 210,105–118.
Zhu, Z.R., Wyrwoll, K-H., Collins L.B., Chen J.H., Wasserburg G.J., Eisenhauer A.,1993. High-precision U-series dating of Last Interglacial events by massspectrometry: Houtman Abrolhos Islands, western Australia. Earth and PlanetaryScience Letters 118, 281–293.
Comparison of uncorrected and open-system corrected U-series coral ages from fossil reefs, Western Australia A-1
M.J. O’Leary – Ph.D. thesis
SECTION A
Comparison of uncorrected and open-system
corrected U-series coral ages from fossil reefs,
Western Australia
Comparison of uncorrected and open-system corrected U-series coral ages from fossil reefs, Western Australia A-2
M.J. O’Leary – Ph.D. thesis
A.1 ABSTRACT
West Australian fossil corals exhibit a high degree of open-system behaviour manifest
in elevated 232Th concentrations and high δ234Uinitial values. In an attempt to extract
meaningful ages from corals that have undergone isotopic exchange, modeled alpha-
recoil processes were used to calculate open-system ages. These open-system ages are
based on the assumption that alpha-recoil mobilisation is the only diagenetic process
operating within the coral or reef unit. This study attempted to independently verify the
true accuracy of open-system corrections through the use of independent age controls
including; 1) ages falling within the known duration of marine isotope stage (MIS) 5e, 2)
ages that conform to stratigraphic superposition and, 3) age equivalence within individual
corals. The corrected age data showed a poor correlation to independent age controls
suggesting that; 1) there may be systematic errors built into the open-system model or, 2)
alpha-recoil mobilisation is not the only isotopic exchange process operating within the
corals. Without independent age verification, then U-series open-system correction must
be approached with caution. We propose the following recommendations:
1. Analysis of multiple subsamples from individual corals as the best quantitative
test in determining U-series age.
2. Where possible corals should be sampled in a stratigraphic context.
3. Open-system corrections should only be used in conjunction with independent
age controls.
Comparison of uncorrected and open-system corrected U-series coral ages from fossil reefs, Western Australia A-3
M.J. O’Leary – Ph.D. thesis
A.2 INTRODUCTION
Direct paleosea-level reconstructions rely heavily on dated fossil corals. Corals
provide a fairly precise sea-level constraint with reef development principally controlled
by water depth (Kennedy and Woodroffe, 2002; Cabioch et al., 1999). The 238U-234U-230Th
decay series can provide an accurate chronometer extending over the last few hundred
thousand years (Broecker, 1963; Edwards et al., 1987a; Bard et al., 1990 Stirling et al.,
1995) under optimal circumstances. Accurate dating is based on an assumption that
corals have remained closed to isotopic exchange. With the introduction of thermal
ionisation mass spectrometry (TIMS) (Chen et al., 1986; Edwards et al., 1987b) and more
recently multi-collector inductively coupled plasma mass spectrometry (MC ICPMS)
(Anderson et al., 2004), there has been an increase in analytical precision by orders of
magnitude, and a corresponding improvement in the ability to detect diagenetic alteration
in isotopic ratios. This new analytical precision has shown corals to be more susceptible
to open-system chemical and isotopic exchange than previously thought (Bard et al.,
1991). Consequently, the improvement in analytical precision has not lead to a
corresponding improvement in age accuracy (Bard et al., 1992). As a result, criteria have
been established to screen corals for exposure to open-system U/Th exchange.
The primary criterion in determining the reliability of coral U-series ages has been
to back calculate measured δ234U activity ratios (Edwards et al., 1987a; Chen et al., 1991;
Stirling et al., 1995), which should correspond to a modern seawater 234U/238U activity of
146.6 ± 2.5‰ (Robinson et al 2004). Generally fossil corals exhibit higher initial δ234U
(δ234Uinitial) values than is accounted for in living corals (Bender et al., 1979; Bard et al.,
1991; Gallup et al., 1994; Stirling et al., 1995; Stirling et al., 2001). These higher values may
be the result of changing seawater δ234U activities over successive interglacials, or a result
of post mortality U/Th mobilization within the coral. Studies of δ234U values in seawater
show a variation of less than 15‰ over the last 360 ka (Henderson, 2002). In addition,
Comparison of uncorrected and open-system corrected U-series coral ages from fossil reefs, Western Australia A-4
M.J. O’Leary – Ph.D. thesis
coeval corals that grew on the same reef, and multiple analyses of the same coral, can
show variations in initial δ234U (δ234Uinitial) activity greater than the known variability of
historical δ234U seawater (Gallup et al., 2002). We therefore assume that the variability
observed in fossil corals is more likely the result of U/Th mobilization.
The are a number of mechanisms that may contribute to open-system behavior
in corals including dissolution and precipitation reactions (Bar-Matthews et al., 1993),
decay dependent alpha-recoil mobilization (Fruijtier et al., 2000; Henderson et al., 2001)
and solid state diffusion (Cherniak, 1997). While uranium solid-state diffusion is expected
to be negligible on 104-105 year timescales and not an important process (Robinson et al.,
2006), mineralisation (Bar-Matthews et al., 1993) and alpha-recoil processes (Thompson et
al., 2003) are known to produce the range of isotopic anomalies commonly observed in
corals.
Primary coral skeletons are composed of metastable aragonite, most fossil corals
older than ~ 2 x 10⁴ years will show some evidence of calcite alteration and potential
U/Th mobilization (Bar-Matthews et al., 1993) depending on diagenetic history. A
qualitative assessment of the degree of calcite contamination can be made through visual
inspection and X-radiograph positive prints, which identify the more dense calcite bands
in the coral (Fig. 1). Quantitative assessment can be made using X-ray diffraction where
total calcite content for near pristine coral samples should measure less than 2%. It
should also be noted that secondary aragonite precipitation is known to infill micropore
space within the coral (Lazar et al., 2004). This is a potential source of allochthonous
uranium or thorium isotopes, detectable only by scanning electron microscopy and
petrographic examination. However, the fact that apparently pristine coral samples
exhibit δ234Uinitial values higher than modern seawater or modern corals (Ku et al., 1990;
Hamlin et al., 1991), suggests that the isotopic systems operating in these corals are far
Comparison of uncorrected and open-system corrected U-series coral ages from fossil reefs, Western Australia A-5
M.J. O’Leary – Ph.D. thesis
more subtle and sensitive to diagenetic change than indicated among general
petrographic or geochemical parameters (Scholz et al., 2004).
Alpha-decay of a radioactive parent isotope results in the recoil and displacement
of the daughter isotope within the crystal lattice. The recoil distance is of the order of 10-
110 nm for 238U to 234Th and results in a damage track inside the crystal lattice (Kigoshi,
1971). A recoil track that intersects the grain surface provides an easy path through
which the decayed atom can move; in effect, recoil creates a thin layer with enhanced
permeability. Permeability is selectively enhanced for the 234U daughter isotope and the
leaching process results in non-mass dependant isotope fractionation where the solid
phase is depleted in 234U/238U and the liquid phase is enriched. Decay of dissolved
uranium and alpha-recoil mobilization of uranium daughters will also produce particle-
reactive 234Th and 230Th (Thompson et al., 2003). The coupled addition of these thorium
isotopes could simultaneously increase a coral’s 234U/238U activity (elevate δ234Uinitial
values) and 230Th/238U activity (producing older apparent ages), a trend commonly
observed in fossil corals. Since all corals are subject to alpha-recoil processes, all
measured coral ages will contain a systematic isotopic error. This isotopic error may be
more statistically significant than the measured analytical error. As a result of such age
uncertainties, there have been several attempts to correct for isotopic anomalies observed
in corals using open-system models.
A.3 MODELLING OPEN-SYSTEM BEHAVIOR IN CORALS
The open-system U-series age model developed by Thompson et al. (2003) is
based on alpha-recoil processes enhancing the mobility of daughter nuclides. The model
assumes that alpha-recoil mobilisation is the only diagenetic process operating within the
coral or reef unit. Recoil products are transported from an unspecified source into the
coral skeleton, yielding the observed systematic, coupled enrichment trends in 230Th/238U
Comparison of uncorrected and open-system corrected U-series coral ages from fossil reefs, Western Australia A-6
M.J. O’Leary – Ph.D. thesis
activities and δ234U. The model mathematically removes excess 234U and 230Th and re-
calculates an open-system age that intercepts the seawater evolution curve; assuming an
invariant δ234U composition in the marine environment throughout the late Quaternary.
Extending the approach of Henderson et al. (2001), Villament and Feuillet (2003)
propose a consistent model that accounts for possible initial 230Th excess and where
continuous selective redistribution (gain or loss) of 234U, 234Th and 230Th is controlled by
recoil processes. The model calculates one open-system U-series model age based on an
integration of the data for all samples, making the critical assumption that all corals
developed concurrently. This age assumption biases the integrated “average” age towards
anomalous values if corals are of differing ages (Anderson et al., in review).
The linear regression open-system isochron model of Scholz et al. (2004)
examined a suite of corals exposed to meteoric waters through some of their post-
mortem history. The authors applied episodic pulses of uranium loss and gain, with the
δ234U of the additional uranium determined by multiple measurements on sub-samples
from the same coral. A model assuming different degrees of uranium addition and loss in
different sub-samples of one coral produces straight lines (isochrons) on a 234U/238U vs.
230Th/238U plot and predicts that the true age of the coral can be calculated by
intersecting this isochron with the seawater evolution curve.
Despite advances in dating techniques and improvements in the understanding of
uranium and thorium exchange in corals, important aspects of the systematics which
produce elevated δ234U have yet to be satisfactorily explained. As a result, open-system
models that successfully correct for U/Th exchange at one fossil locality do not resolve
open-system behavior globally. Despite these modelling uncertainties open-system
models are used to improve the timing and resolution of past sea-level highstands, e.g.
Thompson and Goldstein (2005)
Comparison of uncorrected and open-system corrected U-series coral ages from fossil reefs, Western Australia A-7
M.J. O’Leary – Ph.D. thesis
Here we report on 76 new MC ICPMS U-series coral dates from West Australian
(WA) fossil reefs. This large database provides a unique opportunity to compare
uncorrected U-series coral ages with open-system models. Corals were sampled along
reef-growth-axis to provide stratigraphic age control prior to analysis. This provides a
benchmark to test for reliability and accuracy in both uncorrected and modelled U-series
coral dates.
Thus, this study has three distinct goals:
1. Using independent age controls, determine the reliability of geochemical
parameters in screening for isotopic anomalies.
2. Using independent age controls assess the true accuracy of open-system age
models.
3. Critically evaluate which measured coral ages can be considered reliable and used
in further chronostratigraphic interpretations.
A.4 METHODS
A.4.1 Study region and coral samples
Emergent fossil reef terraces of the south and central coast of WA contain a
continuous record of coral growth during MIS 5e. Many of these sites have been
previously described (Farbridge 1950; Logan et al., 1970; Van de Graaff et al., 1976
Denman and Van de Graaff, 1977; Veeh et al., 1979; Stirling et al., 1995; Collins et al.,
Comparison of uncorrected and open-system corrected U-series coral ages from fossil reefs, Western Australia A-8
M.J. O’Leary – Ph.D. thesis
1996; Eisenhauer et al., 1996). In this study, morpho- and chronostratigraphy were the
primary tools used at 14 surveyed sites (Fig. 2). Cross-terrace geomorphic profiles and
vertical sections were constructed, logged and photographed. Hand-level and theodolite
surveys established the elevation of the deposits relative to mean sea level. Positive
elevations in this study are expressed simply as “+” (as +8 m) for height above present
mean sea level.
Topographic profiles determined terrace elevation and aided in the
reconstruction of the fringing reef growth histories. Corals in growth position were
collected using rock-drills and cold-chisels across the reef flat, at cliff exposures and
particularly at measured stratigraphic sections. We preferentially targeted corals from the
Faviidae family for U-series dating because their well-developed wall structures are
composed of dense aragonite and are generally free of detrital or recrystallised material.
Where the family Faviidae was absent, coral from the genus, Porites and Acropora were
sampled. Corals of these genera are less than ideal due to the porus nature of their
skeleton, which limits effective precleaning (Scholz et al., 2004).
Locality names were assigned based on the nearest topographic landmark on
either 1:100 000 or 1:250 000 map sheets. Each sample-site was assigned a three-letter
code e.g. LDS1c. The three letters indicate the region “L”, and the specific site “DS”
Dampier Salt, while the numerical is one of several samples collected at the site. A lower
case letter LDS1 “c” indicates a sub-sample from a single coral.
A.4.2 Sample preparation and analytical procedures
A total of 76 West Australian coral samples were selected for U-series analysis.
Samples were sectioned and micro-sampled to an approximate weight of 200 µg using a
dental drill. Mechanical cleaning involved soaking in Milli-Q water and sonication.
Samples were first dissolved in distilled water with a subsequent step addition of 10M
Comparison of uncorrected and open-system corrected U-series coral ages from fossil reefs, Western Australia A-9
M.J. O’Leary – Ph.D. thesis
HNO3 then spiked with a 50 mg “U-2” 233Th/235U isotope tracer and later evaporated to
a minimum solution. A few drops of H2O2 were added to oxidise any remaining organic
material. Samples were redissolved in 3 ml of 2M HNO3 and transferred to bio-spin
Tru.spec columns which separated U and Th from the solution. A 0.1 normal solution
of HF/HCl was then passed though the columns to collect and concentrate U and Th.
The solution was evaporated to dryness then redissolved with 2 ml 2% HNO3, prior to
injection.
All measurements were performed a using a MC-ICPMS at the Research School
of Earth Sciences, Australian National University. Measurements were conducted using
recently developed multiple-Faraday cup protocols reported in Andersen et al. (2004)
Potter et al. (2005) and Stirling et al. (2005). This multiple-Faraday approach yields
significantly better precision and reproducibility compared with the uncorrected use of
less stable ion counter electron multipliers for the minor 234U and 230Th isotopes, thus
reducing the U-series age uncertainties by up to a factor of ten (Stirling et al., 2001).
A.4.3 Screening of U-series coral dates prior to open-system corrections
Following the procedures of earlier workers (Chen et al., 1991; Stirling et al., 1995;
1998; Robinson et al., 2004), uncorrected coral measurements were screened for potential
U/Th loss or gain based on the following criteria:
1) We consider the calculated δ234Uinitial to be the best quantitative test for open-
system behavior in corals. For a coral age to be considered strictly reliable
δ234Uinitial values should reflect a modern seawater value of 146.6 ± 4‰.
2) The total uranium concentration of fossil corals should approximate modern
coral values of about 3 ± 0.5 ppm of uranium.
Comparison of uncorrected and open-system corrected U-series coral ages from fossil reefs, Western Australia A-10
M.J. O’Leary – Ph.D. thesis
3) Fossil corals should be free of allochthonous 230Th, as indicated by the absence of
detrital 232Th (< 1 ppb).
4) Corals should show primary aragonitic structures or have < 2% calcite
concentration.
A.5 INDEPENDENT TESTS OF U-SERIES AGE RELIABILITY
A.5.1 Does coral age fall within the accepted duration of MIS 5e?
Emergent fossil reef terraces along the West Australian coastline are known to
have grown during MIS 5e (Collins et al., 1993a,b; McCulloch and Esat, 2000; Stirling et
al., 1995, 1998). Therefore, the most obvious test of whether uncorrected or corrected
coral age is appropriate or accurate, is to see if measured ages fall within the known
duration of this sea-level event. A large number of studies have attempted to define the
onset, duration and termination of MIS 5e, but the results have been mixed. For example
Muhs et al. (2002) give a range of 132 to 113 for coral from Oahu, while Stirling et al.
(1998) suggest a period widespread reef growth occur between 128 and 121 ka with less
robust reef development occurring up to 116 ka. Again these sorts of discrepancies are
the likely result of U-series reliability issues. However in one of the more complete
synthesis of MIS 5e U-series coral dates, Edwards et al. (2003) place the duration of MIS
5e at 130 ± 1 and termination at 116 ± 1 ka. Therefore, based on these age boundaries
any of the 76 West Australian U-series ages that fall outside this interval may be
imprecise regardless of reliability criteria or open-system corrections.
Comparison of uncorrected and open-system corrected U-series coral ages from fossil reefs, Western Australia A-11
M.J. O’Leary – Ph.D. thesis
A.5.2 Do coral ages follow stratigraphic order?
In a stacked sequence of growth positions corals, true age should decrease from
the base to the top. At Cape Cuvier, fringing reef development during MIS 5e occurred
in shallow water. Once accommodation space was filled, reef growth would continue
laterally (Kennedy and Woodroffe 2002). Based on this type of growth history age
isochrons should be parallel to the reef front, meaning a relatively narrow but decreasing
coral age range is expected up section (Kennedy and Woodroffe 2002). A total of 15
coral samples (LCC) were collected from a 3 m high vertical cliff section at Cape Cuvier.
With approximately 30 m of reef-flat landward of the reef-crest there was an extended
period of reef accretion prior to these corals growing, and the presence of Holocene
notching suggests an active period of coastal erosion. This information provides a
stratigraphic context for evaluating uncorrected or corrected U-series ages, using the
fundamental principle of superposition and at the highest levels of stratigraphic
resolution.
A.5.3 Do subsamples from a single coral colony yield equal ages?
The most stringent way to test the reliability of uncorrected U-series ages or
open-system corrections is to analyse multiple samples from an individual coral. Because
the coral grew during a very restricted time interval (annual banding can indicate growth
age) this should be reflected in the U-series age. Coral LDS1 is a large head 3 m in
diameter of the genus Porites, growth banding indicates its total lifespan to be less than
100 yrs. Under closed-system conditions we expect the 10 subsamples samples from
LDS1 to show age equivalence. Multiple subsamples from a further 5 coral colonies also
underwent U-series analysis.
Comparison of uncorrected and open-system corrected U-series coral ages from fossil reefs, Western Australia A-12
M.J. O’Leary – Ph.D. thesis
A.6 RESULTS
A.6.1 Coral geochemistry
Coral 234U/238U vs. 230Th/238U activity do not plot on the seawater evolution
curve (blue line), which describes the (closed-system) ingrowth and decay of 234U and
230Th isotopes from an initial seawater activity 1.1466; or more specifically, plot within
the known duration of MIS 5e (red line segment) (Fig. 3a,b). This reveals that more than
85% of measured WA corals were subject to isotopic exchange, with a coupled shift
towards elevated values for both 234U/238U and 230Th/238U activities. Uranium
concentrations range from 1.24 to 5.32 ppm with an average of 2.91 ± 0.59 ppm (Fig.
4), within a range (2.0-3.5 ppm) typical of modern coral concentrations (Shen and
Dunbar 1995).
232Th concentrations proved highly variable with values ranging between 0.05 ppb
up to 533 ppb. It was found that those corals with 232Th concentrations >1 ppb exhibited
greater age discrepancies (Fig. 5). In addition, corals with elevated 232Th exhibit a
positive correlation between increasing uranium concentrations and 234U enrichment
(Fig. 4). Evidence of 232Th contamination may indicate the presence of allochthonous
(non alpha-recoil) 230Thnr and/or 234U isotopes. Thus, to best evaluate Thompson’s
modelling parameters, age corrections were only conducted on 53 coral samples with
232Th concentrations below 1 ppb.
A.6.2 Corrected and uncorrected age and the duration of MIS 5e
West Australian corals returned an average uncorrected U-series age of 127.6 ±
4.5 ka (n=76). Only 10 coral samples or approximately 13% of the total sample
population have a δ234Uinitial, which falls within the 146.6 ± 4‰-confidence band (Fig.
3b) and have ages that cluster between 126 and 128 ka and around 122 ka. A total of 12
corals have ages older than the accepted duration of MIS 5e (>130 ka). The result of
Comparison of uncorrected and open-system corrected U-series coral ages from fossil reefs, Western Australia A-13
M.J. O’Leary – Ph.D. thesis
open-system corrections is for an overall lowering of coral age to an average of 120.3 ±
5.3 ka (n=53) (Fig. 6b). This correction slightly improves the total number of ages that
fall within the accepted duration of MIS 5e. However, 7 corals return ages that follow the
termination of MIS 5e (<116 ka), all having δ234Uinitial values greater than 174‰. Since
these corrected coral ages plot well outside the accepted duration of MIS 5e we question
their reliability.
A.6.3 Uncorrected and corrected ages from a stacked coral sequence
down section. These near equivalent 230Th/238U activities produce coeval coral ages of
around 130.5 ± 3 ka (Fig. 6). However, there does appear to be a slight younging up-
section within the bottom 2/3’s of the sequence, from 132.4 ± 1.5 ka at 2.25 m below
the reef surface to 127.7 ± 1.1 ka at 1.15 m below the reef surface (Fig. 6; Fig. 7). This
gives a vertical accretion rate of 0.25 mm/yr-1. Open-system corrections lowered overall
age to 116.7 ± 3.6, coinciding with the termination of MIS 5e. There was a very tight age
correlation within the bottom 2/3’s of the section where corals returned an average age
of 117.4 ± 0.6 ka (Fig. 6; Fig. 7). Either rapid vertical accretion or lateral reef growth
can explain this age relationship.
A.6.4 Uncorrected and corrected ages from individual corals
A suite of 10 bulk (200 µg) coral samples analysed from LDS1 were found to be
chemically distinct from each other (Fig. 8). Uranium concentrations ranged from 2.62
to 3.38 ppm, a trend commonly observed in modern corals (Shen and Dunbar 1995)
(Fig. 9). However, crustal subsamples LDS1g and LDS1i were found to be highly
enriched in 232Th having concentrations of 235 and 533 ppb respectively (Fig. 9). A few
centimetres below the crustal surface subsamples LDS1h and LDS1j show 232Th
Comparison of uncorrected and open-system corrected U-series coral ages from fossil reefs, Western Australia A-14
M.J. O’Leary – Ph.D. thesis
enrichment dropping to 2 and 7.7 ppb respectively. Subsamples collected from more
pristine central parts of the coral LDS1d, e and f had 232Th concentrations < 2 ppb and
returned an average age of 124.2 ± 1.2 ka with a δ234Uinitial of 166.3 ± 2‰. Attempts to
use an open-system correction on subsamples contaminated with 232Th proved
unsuccessful, coming no closer to yielding a single concise coral age (Fig. 8). However,
even corals with minimal 232Th contamination (< 2 ppb) as in samples LDS1d, e, f, and h,
it made no improvement in the overall spread of ages. There was also a general trend for
increasing uranium concentration to decrease 230Th/238U activities and increase 234U/238U
activities (Fig. 9).
Multiple subsample analysis was made on 5 other corals (Fig. 10). Those with
232Th concentrations > 1 ppm and δ234Uinitial values than > 180 are excluded from the
plot. A single coral CRB1 has both its subsamples fall within the allowable 146.6 ± 4‰
range for reliable uncorrected ages, and an age difference of 800 yrs but is still within
analytical error. All other coral subsamples have δ234Uinitial values fall outside the 146.6 ±
4‰ range so have been subject to isotopic exchange. Uncorrected subsamples from
corals MSD3, SMM3 and HFB1 display equal age, despite having dissimilar δ234Uinitial
values. The application of Thompson’s open-system corrections did not improve age
variability within individual corals.
A.7 DISCUSSION
A.7.1 The duration of MIS 5e
Uncorrected fossil corals with elevated 232Th concentrations (> 1ppb) exhibit a
broad scattering of U-series ages that range within and beyond the accepted duration of
MIS 5e (Fig.3b; Fig. 5). This suggests that the presence of detrital 232Th is evidence for
the contemporaneous (non-subtle) addition of non-radiogenic 230Th in samples older
than 140 ka, or uranium uptake in samples younger than 110 ka (measured age).
Comparison of uncorrected and open-system corrected U-series coral ages from fossil reefs, Western Australia A-15
M.J. O’Leary – Ph.D. thesis
However, corals with 232Th < 1 ppb also exhibit evidence of isotopic exchange with
elevated δ234Uinitial and ages that range beyond the accepted duration of MIS 5e (Fig. 3b).
Based on the Thompson et al. (2003) model, these isotopic anomalies are the result of the
coupled addition of particle reactive 234Th and 230Th, produced by the decay of dissolved
uranium and alpha-recoil mobilisation of uranium daughters. By mathematically stripping
of this excess 234U and 230Th, Thompson calculates an open-system age that intercepts the
seawater evolution curve (Fig. 3b). While there are no geochemical protocols to test
whether open-system ages are accurate, we provide evidence of open-system corrections
in seven samples that fall outside the accepted duration of MIS 5e, suggesting the
corrected ages remain inaccurate (Fig. 3b). There is no obvious evidence among
elemental concentration or isotopic activity in these seven invalid ages that reveal
alternative exchange processes, other than those reported in Thompson et al., 2003. If 7
out of 53 ages are determined to be inaccurate, then how many other open-system
corrections might ultimately be considered spurious?
A.7.2 The fundamental principle of stratigraphic superposition
Corals collected from a measured section at Cape Cuvier exhibit roughly
equivalent 230Th/238U of activities of 0.8 ± 0.1, and produce a small range of ages centred
at 130.5 ± 3.0 ka (Fig. 6; Fig. 7). Corals also produce progressively younger ages in the
lower two thirds of the reef sequence. Ages of 132.4 ± 1.5 ka were determined at a depth
of 2.25 m, and 127.7 ± 1.1 ka at 1.15 m depth, yielding a vertical reef accretion rate of
0.25 mm/yr-1. Vertical accretion at this rate appears entirely reasonable for a reef
framework dominated by coralgal boundstone considering the shallow water depth and
potentially high wave energy at the site (Kennedy and Woodroffe 2002).
When open-system corrections (Thompson et al., 2003) are applied to our
uncorrected U-series ages, we observe a reduction in average age to 116.7 ± 3.6 ka (Fig.
Comparison of uncorrected and open-system corrected U-series coral ages from fossil reefs, Western Australia A-16
M.J. O’Leary – Ph.D. thesis
6; Fig.7). The lower 2/3’s of the age modelled section showed a tight cluster at 117.4 ±
0.6 ka suggesting either rapid vertical accretion > 8 mm/yr –1 or, a more likely scenario,
that of a dominant lateral accretion.
Based on the accepted duration of MIS 5e (116-130 ka) the uncorrected ages
place timing of coral growth at the beginning of 5e. However the position of these corals
within the reef framework clearly cannot represent the beginning of 5e. There is a 40 m
wide reef flat landward of the sea cliff and even based on maximum vertical or lateral
accretion rates, it would have taken several thousand of years before growth could reach
this current mid-reef, morphostratigraphic position. So although uncorrected coral ages
do display some relative age relationships up section, their overall age appears older than
their stratigraphic location within the reef complex.
Open-system corrections also display relative age relationships, with the tight
coeval age of 116.7 ± 3.6 ka and attributable to lateral reef accretion (Fig. 6). However,
the overall ages do not agree with reef accretion and erosion processes. Erosion rates
along tropical carbonate coastlines can range anywhere from 2 to 15 mm/yr and up to 33
mm/yr (Playford, 1997). Even using a conservative rate of 4 mm/yr (Trudgill, 1983), the
lower emergent reef must have retreated by at least 30 m over the intervening Holocene
period. The fossil corals now exposed at the shoreface should represent a growth period
sometime prior to the termination of MIS 5e (coral ages > 116 ka) and the emergence of
the reef. Hence corrected coral ages appear too young to represent the true coral age.
Considering all aspects of this site and section we would expect a mid 5e age to be the
most logical.
Despite the apparent variance in δ234Uinitial, when 234U/238U and 230Th/238U are
plotted on an activity ratio diagram, a linear isotopic array intersects the closed-system
seawater evolution curve at around 124 ka (Fig. 11). This linear configuration suggests
that coeval age corals gained different amounts of uranium with a fixed δ234U value
Comparison of uncorrected and open-system corrected U-series coral ages from fossil reefs, Western Australia A-17
M.J. O’Leary – Ph.D. thesis
around the same time, such as observed by Scholz et al. (2004). Corals that do not
conform to this linear configuration may have been subjected to late uranium uptake or
different 234U/238U groundwater activities. Based on the linear regression age model of
Scholz et al. (2004), the intersection point of the modelled isochrons with the seawater
evolution curve corresponds with evolution under a closed system and therefore
approximates the true age of these corals. Cape Cuvier corals return an isochron age of
124 ka. The Scholz model suffers from fundamental condition that corals need to be
coeval in age. However, the Scholz model does offer the most reasonable assessment for
a mid MIS 5e coral age at this site.
A.7.3 Age equivalence in individual corals
The presence of chemical heterogeneity within a single Porites coral head (LDS1)
has resulted in a range of uncorrected ages between 123.0 and 135.5 ka and δ234Uinitial of
156.19 ‰ to 173.62 ‰ (Fig. 8; Fig. 9). These subsamples generally have 232Th
concentrations >1 ppb. It would therefore appear that 232Th enrichment also
incorporated 230Thnr, which yields an older age for DLS1i. However, the lowering of
δ234Uinitial in LDS1j towards modern seawater values could have resulted only from the
complementary addition of 238U (234U/238U activities < 1) or preferential loss of 234U
(234U/238U activities > 1). This shows that presence of detrital 232Th is a strong indicator
for chemical or isotopic exchange in corals. We argue that open-system corrections were
not able to return any sensible ages due to the presence of detrital 232Th. It would also
appear that the surrounding continental dune complex that buried parts of the reef in
which the Porites was collected as a likely source of the detrital 232Th.
Analysis of 5 other corals showed equivalent uncorrected ages despite having
different δ234Uinitial values (Fig. 10). It would appear that heterogeneous enrichment in
δ234Uinitial has not affected the 230Th/238U activity (overall age). This would require the
Comparison of uncorrected and open-system corrected U-series coral ages from fossil reefs, Western Australia A-18
M.J. O’Leary – Ph.D. thesis
addition of 234U without 238U or 230Th; this is not possible under normal alpha-recoil
process. Corrected U-series ages did not improve internal age variability in individual
corals. Five out of the six age corrected corals actually showed an increase of between
500 and 1500 yrs between the minimum and maximum subsample age within individual
corals. In these samples, despite elevated δ234Uinitial values, the uncorrected ages exhibited
tighter subsample age equivalence than was achievable using open-system corrections
A.7.4 Potential miscalculations in the Thompson’s alpha-recoil
Because alpha-recoil mobilization results in the coupled addition of 234U and 230Th,
those corals with higher δ234Uinitial should yield older U-series ages (see Fig. 9 for an
example). However, we observe in Figure 8, that there are at least 3 examples where coral
subsamples with different δ234Uinitial values yield equal ages. This is possible only through
the addition of 234U without 238U or 230Th. Robinson et al., (2006) identified a uranium
enriched ferromanganese layer (>10 ppm) on the surface of fossil corals as a potential
source of excess 234U. Robinson et al. (2006) modeled alpha-recoil diffusion across this
ferromanganese rich surface layer. Using a diffusion coefficient of 0.1 _m2yr-1, Robinson
found whole-coral δ234Uinitial values increased to 147‰ after 20 ka and 164‰ after 200 ka
without affecting the overall coral age. Thus, alpha-recoil diffusion from a high uranium
surface coating can cause increase in δ234Uinitial values with minimal changes to the
modeled age. It appears that this process may be responsible for the apparent difference
in δ234Uinitial from replicate coral subsamples that exhibit equal ages (Fig. 10). Robinson et
al. (2006) stress that without detailed knowledge of the U/Th distribution within a
specific coral sample, it is not possible to convert closed-system ages to open-system
ages.
Comparison of uncorrected and open-system corrected U-series coral ages from fossil reefs, Western Australia A-19
M.J. O’Leary – Ph.D. thesis
A.7.5 How best to use U-series coral ages
The primary criterion in determining the reliability of coral U-series ages has been
to back calculate measured δ234U activity ratios (Edwards et al., 1987a; Chen et al., 1991;
Stirling et al., 1995), which should correspond to a modern seawater 234U/238U activity of
146.6 ± 2.5‰ (Robinson et al 2004). The more elevated the δ234Uinitial the more unreliable
the age. Based on independent age controls in this study it has been determined that
higher δ234Uinitial values do not always equate to more erroneous ages (Fig. 3b; Fig. 8; Fig
11; Fig 12). It was found that the presence of > 1ppb of detrital 232Th produces the
largest discrepancy in age (Fig. 5; Fig. 6; Fig. 8; Fig. 9). We propose that this criterion
should be used as a primary determinant in age reliability. It was also observed that equal-
age subsamples from the same coral could have different δ234Uinitial values (Fig. 8 Fig. 10),
suggesting that an increase in δ234Uinitial may not lead to a corresponding increase in age.
Similar relationships were also observed in a recent study of deep-sea scleractinian corals
(Robinson et al., 2006).
This study recommends the use of the following protocols in determination and
assessment of the reliability of U-series coral ages:
1. Analysis of multiple subsamples from individual corals as the best quantitative
test in determining U-series age;
2. Detrital 232Th concentrations should be < 1ppb;
3. Allowable error in back calculated δ234Uinitial should be extended from 146.6 ± 4
‰ to 146.6 ± 10 ‰;
Comparison of uncorrected and open-system corrected U-series coral ages from fossil reefs, Western Australia A-20
M.J. O’Leary – Ph.D. thesis
4. Uranium concentrations should be between 2.5 and 3.5 ppm; and
5. Open-system corrections should only be used in conjunction with rigorous
independent age tests.
A.8 CONCLUSIONS
The coupled shift in 234U/238U and 230Th/238U activity observed in pristine coral
samples (that results in elevated δ234Uinitial and older apparent ages) has been attributed to
alpha-recoil mobilization of particle reactive 234Th and 230Th by Thompson et al. (2003)
and Thompson and Goldstein (2005). This study questions the accuracy and reliability of
the open-system model, used to correct for alpha-recoil-based anomalies commonly
observed in fossil corals. Until this study, independent tests to validate the accuracy of
open-system corrections were lacking. Without an independent measure of accuracy,
corrected U-series age is required to be accepted at face value. We evaluated open-
system corrections against independent age controls such that; 1) corrected ages fall
within the accepted duration of MIS 5e, 2) corrected coral age correspond with
stratigraphic order, and 3) coral subsamples from a single coral colony produce a
reasonably tight cluster of ages. We find that open-system corrections fail to satisfy any
of these age tests. It is also apparent that there are no isotopic indicators that identify
spurious coral age among our several tests. Moreover, even if a number of corrected
coral ages agree with the test criteria, they still may not represent true and accurate coral
ages. These findings not only call into question the validity of the Thompson et al. (2003)
open-system correction, but also the use of such corrections to alter or modify Upper
Pleistocene sea-level history.
Comparison of uncorrected and open-system corrected U-series coral ages from fossil reefs, Western Australia A-21
M.J. O’Leary – Ph.D. thesis
A.9 REFERENCES
Andersen, M.B., Stirling, C.H., Potter, E.K., Halliday, A.N., 2004. Toward epsilon levelsof measurement precision on 234U/238U by using MC-ICPMS. International Journalof Mass Spectrometry 237 (2-3), 107-118.
Andersen M.B., Stirling C.H., Potter E-K., Halliday, A.N., Blake, S.G., McCulloch M.T.,Ayling B.F., O’Leary M.J., in review. Direct chronology of the Marine Isotope Stage15 (~600 ka) estimated from high-precision U-series ages from Henderson Island,south Pacific.
Bard, E., Hamelin, B., Fairbanks, R.G., 1990. U/Th ages obtained by mass-spectrometryin corals from Barbados: sea level during the past 130,000 years. Nature 346(6283), 456-458.
Bard, E., Fairbanks, R.G., Hamelin, B., Zindler, A., Huong, C.T., 1991. 234U anomalies incorals older than 150,000 years. Geochimica et Cosmochimica Acta 55, 2385-2390.
Bard, E., Fairbanks, R.G., Hamelin, B., 1992. How accurate are the U/Th ages obtainedby mass spectrometry on coral terraces, in: G.J. Kukla, E. Went (Eds.), Start of aGlacial, NATO ASI Series 13, Springer, Berlin, pp. 15-21.
Bar-Matthews, M., Wasserburg, G. J., Chen, J.H., 1993. Diagenesis of fossil coralskeletons: correlation between trace-elements, textures, and 234U/238U. Geochimicaet Cosmochimica Acta 57, 257-276.
Bender, M.L., Fairbanks, R.G., Taylor, F.W., Matthews, R.K., Goddard, J.G., Broecker,W.S., 1979. Uranium-series dating of Pleistocene reef tracts of Barbados, WestIndies. Geological Society of America Bulletin 90, 577-594.
Broecker, W.S., 1963. A preliminary evaluation of uranium series in equilibrium as a toolfor absolute age measurement on marine carbonates. Journal of GeophysicalResearch 68, 2817-2834.
Cabioch, G., Montaggioni, L.F., Faure, G., Ribaud-Laurenti, A., 1999. Reef coralgalassemblages as recorders of paleobathymetry and sea level changes in the Indo-Pacific province. Quaternary Science Reviews 18, 1681-1695.
Chen, J.H., Edwards, R.L., Wasserburg, G.J., 1986. 238U, 234U and 232Th in seawater, Earthand Planetary Science Letters 80 (3-4), 241-251.
Chen, J.H., Curran, H.A., White, B., Wasserburg, G.J., 1991. Precise chronology of theLast Interglacial period: 234U230Th data from fossil coral reefs in the Bahamas.Geological Society of America Bulletin 103, 82-97.
Cherniak, D.J., 1997. An experimental study of strontium and lead diffusion in calcite,and implications for the carbonate diagenesis and metamorphism. Geochimica etCosmochimica Acta 61, 4173-4179.
Collins, L.B., Zhu, Z.R., Wyrwoll, K.H., Hatcher, B.G., Playford, P.E., Chen, J.H.,Eisenhauer, A., Wasserburg, G.J., 1993a. Late Quaternary evolution of coral reefs
Comparison of uncorrected and open-system corrected U-series coral ages from fossil reefs, Western Australia A-22
M.J. O’Leary – Ph.D. thesis
on a cool-water carbonate margin: the Abrolhos carbonate platforms, SouthwestAustralia. Marine Geology 110, 203-212.
Collins, L.B., Zhu, Z.R., Wyrwoll, K.H., Hatcher, B.G., Playford, P.E., Eisenhauer, A.,Chen, J.H., Wasserburg, G.J., Bonani, G., 1993b. Holocene growth history of areef complex on a cool-water carbonate margin: Easter Group of the HoutmanAbrolhos, eastern Indian Ocean. Marine Geology 115, 29-46.
Collins, L.B., Zhu, Z.R., Wyrwoll, K.-H., 1996. The structure of the Easter Platform,Houtman Abrolhos Reefs: Pleistocene foundations and Holocene reef growth.Marine Geology 135, 1-13.
Denman, P.D., Van de Graaff, W.J.E., 1976. Emergent Quaternary marine deposits inthe Lake MacLeod area, Western Australia. Western Australia Geological SurveyAnnual Report 1977, 32-36.
Eisenhauer, A., Zhu, Z.R., Collins, L.B., Wyrwoll, K.H., Eichstatter, R., 1996. The LastInterglacial sea-level change: new evidence from the Abrolhos Islands. WestAustralia. Geol Rundsch 85, 606-614.
Edwards, R.L., Chen, J.H., Wasserburg, G.J., 1987a. 238U, 234U, 230Th, 232Th systematicsand the precise measurement of time over the past 500,000 years. Earth andPlanetary Science Letters 81, 175-192.
Edwards, R.L., Chen, J.H., Ku T.-L., Wasserburg, G.J., 1987b. Precise timing of the lastinter-glacial period from mass spectrometric analysis of 230Th in corals. Science236, 1547-1553.
Fairbridge, R.W., 1950. The geology and geomorphology of Point Peron, WesternAustralia. Royal Society of Western Australia Journal 34, 35-72.
Fruijtier, C., Elliot, T., Schlager, W., 2000. Mass-spectrometric 234U/230Th ages from theKey Largo Formation, Florida Keys, United States: Constraints on diagenetic agedisturbance. Geological Society of America Bulletin 112, 267-277.
Gallup, C.D., Edwards, R.L., Johnson, R.G., 1994. The Timing of high sea levels overthe past 200,000 years. Science 263, 796-800.
Gallup, C. D., Cheng, H., Taylor, F. W., Edwards, R.L., 2002. Direct determination ofthe timing of sea-level change during Termination II. Science 295, 310-313.
Hamelin, B., Bard, E., Zindler, A., Fairbanks, R.G., 1991. 234U/238U mass spectrometry ofcorals: How accurate is the U-Th age of the last interglacial period? Earth andPlanetary Science Letters 106, 169-181.
Henderson, G. M., Slowey, N. C.,Fleisher, M.Q., 2001. U/Th dating of carbonateplatform and slope sediments. Geochemica et Cosmochemica Acta 65, 2757-2770.
Comparison of uncorrected and open-system corrected U-series coral ages from fossil reefs, Western Australia A-23
M.J. O’Leary – Ph.D. thesis
Henderson, G.M., 2002. Seawater 234U/238U during the last 800 thousand years. Earthand Planetary Science Letters 199, 97-11.
Kennedy, D.M., Woodroffe, C.D., 2002. Fringing reef growth and morphology: a reviewEarth-Science Reviews 57 255-277.
Kigoshi, K., 1971. Alpha-recoil thorium-234: dissolution into water and the uranium-234/ uranium-238 disequilibrium in nature. Science 173 (3991), 47-48.
Ku, T.-L., Ivanovich, M., Luo, S., 1990. U-series dating of Last Interglacial high seastands: Barbados revisited. Quaternary Research 33, 129-147.
Lazar, B., Enmar, R., Schossberger, M., Bar-Matthews, M., Halicz, L., Stein, M., 2004.Diagenetic effects on the distribution of uranium in live and Holocene corals fromthe Gulf of Aqaba. Geochimica et Cosmochimica Acta 68 (22), 4583-4593.
Logan, B.W., Read, J.R., Davies, G.R., 1970. History of carbonate sedimentation,Quaternary Epoch, Shark Bay, Western Australia. American Association ofPetroleum Geologists Memoir 13: 38-85.
McCulloch, M.T., Esat T., 2000. The coral record of last interglacial sea levels and seasurface temperatures. Chemical Geology 169, 107-129.
Muhs, D.R., Simmons, K.R., Steinke, B., 2002. Timing and warmth of the LastInterglacial period: new U-series evidence from Hawaii and Bermuda and a newfossil compilation for North America. Quaternary Science Reviews 21 (12-13),1355-1383.
Playford, P.E., 1997. Geology and hydrology of Rottnest Island, Western Australia, in:Vacher, H.L., T. Quinn, (Eds.), Geology and Hydrology of Carbonate Islands,Developments in Sedimentology 54, Elsevier, London, pp. 783–810
Potter, E.K., Stirling, C.H., Andersen, M.B., Halliday, A.N., 2005. High precision Faradaycollector MC-ICPMS thorium isotope ratio determination. International Journal ofMass Spectrometry 247 (1-3), 10-17.
Robinson, L.F., Belshaw, N. S., Henderson G.M., 2004. U and Th concentrations andisotope ratios in modern carbonates and waters from the Bahamas. Geochimica etCosmochimica Acta 68, 1777–1789.
Robinson, L.F., Adkins, J.F., Fernandez, D.P., Burnett, D.S., Wang, S-L., Gagnon, A.C.,Krakauer, N., 2006. Primary U-distribution in scleractinian corals and itsimplications for U-series dating. Geochemistry Geophysics Geosystems 7 (5), 1-20.
Scholz, D., Mangini, A., Felis, T., 2004. U-series dating of diagenetically altered fossil reefcorals. Earth and Planetary Science Letters 218 (1-2), 163-178.
Shen, G.T., Dunbar, R.B., 1995. Environmental Controls on Uranium in Reef Corals.Geochimica et Cosmochimica Acta 59 (10), 2009-2024.
Comparison of uncorrected and open-system corrected U-series coral ages from fossil reefs, Western Australia A-24
M.J. O’Leary – Ph.D. thesis
Stirling, C.H., Esat, T.M., McCulloch, M.T., Lambeck, K., 1995. High-precision U-seriesdating of corals from Western Australia and implications for the timing andduration of the Last Interglacial. Earth and Planetary Science Letters 135, 115-130.
Stirling, C.H., Esat, T.M., Lambeck, K., McCulloch, M.T., 1998. Timing and duration ofthe Last Interglacial: evidence for a restricted interval of widespread coral reefgrowth. Earth and Planetary Science Letters 160, 745-762.
Stirling, C.H., Esat, T.M., Lambeck, K., McCulloch, M.T., Blake, S.G., Lee D.C.,Halliday, A.N., 2001. Orbital forcing of the marine isotope stage 9 interglacial.Science 291 (5502), 290-293.
Stirling, C.H., Halliday A.N., Porcell, D., 2005. In search of live Cm-247 in the early solarsystem. Geochimica et Cosmochimica Acta 69 (4), 1059-1071.
Thompson, W.G., Spiegelmann M.W., Goldstein S.L., Speed R.C., 2003. An open-systemmodel for U-series age determinations of fossil corals. Earth Planetary ScienceLetters 210, 365-38.
Trudgill, S.T., 1983. Preliminary estimates on intertidal limestone erosion, One TreeIsland, Southern Great Barrier Reef, Australia. Earth Surface Processed andLandforms 8 (2), 189-193.
Veeh, H.H., Van de Graaff, W.J.E., Denman, P.D., 1979. Uranium-series ages ofcoralline terrace deposits in Western Australia. Journal of the Geological Society ofAustralia 26, 285-292.
Van de Graaff, W.J.E., Denman, P.D., Hocking, R.M., 1976. Emerged Pleistocenemarine terraces on Cape Range, Western Australia. Geological Survey of WesternAustralia Annual Report 1975, 62-69.
Villemant, B., Feuillet, N., 2003. Dating open systems by the 238U-234U-230Th method:application to Quaternary reef terraces. Earth and Planetary Science Letters 210,105-118.
Comparison of uncorrected and open-system corrected U-series coral ages from fossil reefs, Western Australia A-25
M.J. O’Leary – Ph.D. thesis
A.10 FIGURES 1-11
Figure 1: A Porites coral (NYC) collected a few metres above sea level at the mouth of
Yardie Creek, Cape Range. A sliced 7 mm thick section (left) and its X-radiograph
positive print (right). The lighter areas on the X-ray print represent denser areas of the
coral and are associated with calcite alteration. Brown staining observed on the sliced
section is sediment contamination sourced through pore water movement along less
dense growth banding within the coral.
Comparison of uncorrected and open-system corrected U-series coral ages from fossil reefs, Western Australia A-26
M.J. O’Leary – Ph.D. thesis
Figure 2: Map of Western Australia showing fossil reef and sample locations.
Comparison of uncorrected and open-system corrected U-series coral ages from fossil reefs, Western Australia A-27
M.J. O’Leary – Ph.D. thesis
Figure 3: A) Compilation of Western Australian U-series data plotted on a 234U/238U
activity ratio diagram. The blue line represents closed system evolution with and modern
seawater 234U/238U activity of 1.1466 and the red segment represents the duration of MIS
5e. The sub-vertical lines are lines of equal 230Th age B) 234U/238U activity at the time of
coral growth versus 230Th-age. The horizontal grey shaded area represents zone of age
reliability where δ234Uinitial = 146.6 ± 4‰ (horizontal dotted line). Vertical shaded area
represents the known duration of MIS 5e based on Edwards et al. (2003). Reliable
uncorrected (black circle) and open-system corrected ages (triangles) should plot within
the red box. Open-system ages corrected to a δ234Uinitial seawater value of 146.6.
Comparison of uncorrected and open-system corrected U-series coral ages from fossil reefs, Western Australia A-28
M.J. O’Leary – Ph.D. thesis
Figure 4: A plot of uranium concentration vs. measured 234U/238U activity. The solid
circles are corals with 232Th concentrations >0.75 ppb and the open circles corals with232Th concentrations <0.75 ppb. The shaded area represents the average spread of
uranium concentrations for modern corals (Shen and Dunbar 1995). A positive
correlation of increasing 234U/238U activities with increasing uranium concentrations is
observed in corals with232Th > 0.75 ppb.
Comparison of uncorrected and open-system corrected U-series coral ages from fossil reefs, Western Australia A-29
M.J. O’Leary – Ph.D. thesis
Figure 5: A plot of 232Th concentrations (log scale) vs. age. Corals with 232Th
concentrations > 1 ppb exhibit greater age variability than corals with 232Th <1 ppb. This
suggest that allochthonous 230Th, 238U or 238U may have be incorporated along with 232Th
into the coral skeleton.
Comparison of uncorrected and open-system corrected U-series coral ages from fossil reefs, Western Australia A-30
M.J. O’Leary – Ph.D. thesis
Figure 6. Coral age collected from a vertical reef section at Cape Cuvier. Circles
represent uncorrected coral age, open for 232Th > 1 ppb and closed for 232Th < 1 ppb.
Triangles represent open-system corrected coral age, open for 232Th > 1 ppb and closed
for 232Th < 1 ppb.
Comparison of uncorrected and open-system corrected U-series coral ages from fossil reefs, Western Australia A-31
M.J. O’Leary – Ph.D. thesis
Figure 7. U-series dating results from a Holocene sea cliff cut into a MIS 5e reef terrace
at Cape Cuvier.. Yellow dots represent the sample location, both corrected and
uncorrected ages are reported. All measured samples had elevated δ234Uinitial, bold
numbers indicate coral samples with 232Th < 1ppb.
Comparison of uncorrected and open-system corrected U-series coral ages from fossil reefs, Western Australia A-32
M.J. O’Leary – Ph.D. thesis
Figure 8: Compilation of LDS1 (Porites) U-series subsample data plotted on a 234U/238U
activity ratio diagram. Red indicates surface coral subsamples and blue apparent pristine
interior subsamples. The triangles represent open-system corrections. Blue line
represents closed system evolution with and modern seawater 234U/238U activity of
1.1466. Blue dotted line represents closed system evolution with and modern seawater234U/238U activity of 1.1566.
Comparison of uncorrected and open-system corrected U-series coral ages from fossil reefs, Western Australia A-33
M.J. O’Leary – Ph.D. thesis
Figure 9: U and Th Isotopic ratios vs. uranium concentration in multiple coral
subsamples taken from LDS1.
Comparison of uncorrected and open-system corrected U-series coral ages from fossil reefs, Western Australia A-34
M.J. O’Leary – Ph.D. thesis
Figure 10. Coral subsamples showing δ238Uinitial at the time of coral growth vs. 230Th-age.
Different colours represent a different individual coral. Triangles represent open-system
ages corrected to a δ234Uinitial seawater value of 146.6‰. Grey shaded areas indicate
subsamples from the same coral showing age equivalence.
Comparison of uncorrected and open-system corrected U-series coral ages from fossil reefs, Western Australia A-35
M.J. O’Leary – Ph.D. thesis
Figure 11. A compilation of Cape Cuvier corals on a 234U/238U activity ratio diagram.
Blue line represents closed system evolution with and modern seawater 234U/238U activity
of 1.1466. The dashed line indicates a linear compositional array representative of those
Cape Cuvier corals.
Comparison of uncorrected and open-system corrected U-series coral ages from fossil reefs, Western Australia A-36
1 Uranium concentrations are measured in part per million (ppm) equivalent to ng/g.2 230Th concentrations measured in parts per trillion (ppt) equivalent to fg/g3 232Th concentrations measured in parts per billion (ppb) equivalent to pg/g
4 δ234U = {[(234U/238U)/(234U/238U)eq]-1} x 103. (234U/238U)eq is the atomic ratio at secular
equilibrium and is equal to λ238/λ234 = 5.4891 x 10⁻⁵, , where λ238 and λ234 are the decay constants for
238U and 234U, respectively, adopting half-lives of Cheng et al., (1998)
5 [230Th/238U]act = (230Th/238U)/(λ238/λ230).
6 U-series ages are calculated iteratively using
1 -
230Th
238U act = e
-l230T -
d
234U(0)
1000
l230
l230-l234 ( )1 - e
(l234 - l230)T
where T is the age in years and l230 is the decay constant for 230Th. l238 = 1.551 x 10⁻¹⁰ y-1; l234 =
2.826 x 10⁻⁶ y-1; l230 = 9.158 x 10⁻⁶ y-1.
7 The initial value is given by δ234Ui = δ234Uel234T
, where T is the age in years.
8 For open system equation model see Thompson et al., 2003
Comparison of uncorrected and open-system corrected U-series coral ages from fossil reefs, Western Australia A-38
Morphostratigraphic evidence for unstable sea levels during marine isotope stage 5e: Cape Cuvier, Western Australia
M.J. O’Leary – Ph.D. thesis
B-1
SECTION B
Morphostratigraphic evidence for Unstable sea levels
during marine isotope stage 5e: Cape Cuvier, Western
Australia
Morphostratigraphic evidence for unstable sea levels during marine isotope stage 5e: Cape Cuvier, Western Australia
M.J. O’Leary – Ph.D. thesis
B-2
B.1 ABSTRACT
Geomorphologic and morphostratigraphic investigations of an emergent fringing
reef complex at Cape Cuvier, Western Australia reveals two geomorphically distinct
marine units. We record a lower coralgal reef platform between 3 and 5.5 m above
MLWS (mean low water spring) and an upper thin, coralgal rim and planation surface at
8.5 to 10.5 m above MLWS. The difference in morphology and elevation suggests reef
development occurred at different times and under environmentally discrete conditions.
In an attempt to better refine the timing of emplacement of each marine unit, high-
precision U-series dating of 27 corals collected along vertical and lateral reef growth axis
was undertaken. All measured corals exhibited elevated δ234Uinitial values, suggesting that
there was pervasive uptake of 234U-enriched uranium. This open-system behaviour
resulted in older apparent U-series ages that conflict with the known duration of MIS 5e
and the apparent growth history of the reef. Open-system corrections were applied to
these corals in an attempt to improve their age reliability, however, they also returned
ages that conflicted our empirical data.
Morphostratigraphic evidence for unstable sea levels during marine isotope stage 5e: Cape Cuvier, Western Australia
M.J. O’Leary – Ph.D. thesis
B-3
B.2 INTRODUCTION
At Cape Cuvier (Fig 1), an emergent fringing reef complex provides stratigraphic
and geomorphic evidence of a complex sea-level highstand during marine isotope stage
(MIS) 5e. Two marine erosion terraces were previously identified (Denman and Van de
Graff, 1977): a lower well-developed coralgal reef at 3 to 5.5 m above mean low water
springs (all subsequent elevations are noted as “+” relative to this datum), and an upper
erosional unit at about +10 m with in situ coral at +9.4 m. Based on field evidence, Veeh
et al. (1979) considered that the two marine units observed at Cape Cuvier may be the
result of a bimodal rather than single sea level high stand event. Alternatively they
postulated that the difference in elevation between lower and upper reef deposits could
be an artefact of tectonic uplift.
Early U-series dates (Veeh et al. 1979) utilizing alpha counting methods returned
ages for the lower terrace of 123 ± 11 ka (n=2) and 134 ± 8, 120 ± 10 and 140 ± 12 ka
for the higher coral/algal rim. More recently, TIMS coral ages (Stirling et al., 1998) from a
location to the north of Cape Cuvier at + 6.75 m and + 8.61 m returned dates of 128 ±
0.7 ka and 126 ± 0.5 ka respectively. However both these ages are considered unreliable
due to elevated initial δ234U (δ234Uinitial) values. Although it has not proved possible to
constrain the timing of the lower and upper marine units into separate sea level events
due to low-precision or reliability issues, it is however possible to place a last interglacial
(MIS 5e) age to these marine deposits.
This study addresses eustatic and tectonic issues regarding the age and elevation
of these emergent marine deposits by better defining the timing of emplacement and
duration of growth. This will be achieved through field interpretation of fringing reef
development, utilization of high-precision dating methods and open-system corrections
to obtain precise age information.
Morphostratigraphic evidence for unstable sea levels during marine isotope stage 5e: Cape Cuvier, Western Australia
M.J. O’Leary – Ph.D. thesis
B-4
B.3 CLIMATE AND OCEANOGRAPHIC SETTING
Cape Cuvier (24˚ 13.45’ S 113˚ 23.42’ E) is located on the central west coast of
WA and is one of three prominent headlands situated along the 180 km long north south
trending coastal Quobba Ridge (Fig. 1). Modern fringing reefs extend from Point
Quobba in the south into the Ningaloo reef tract at Cape Range 300 km to the north. Sea
surface temperatures at Cape Cuvier are regulated by the southward migration of the
warm low salinity Leeuwin current during winter months (Thompson, 1984) and the
northward flowing Ningaloo current during the summer (Taylor and Pearce, 1999). This
combination of ocean currents results in a narrow range of annual sea surface
temperature from 26.3˚C in April to 21.4˚C in September. Such marine conditions are
suitable for hermatypic coral growth.
The 3 pm wind rose for Carnarvon (Fig. 2) (located 40 km south of Cape
Cuvier) records frequent fresh to strong, south-to-south west winds throughout most of
the year. During the summer these winds generate moderate seas characterised by a
significant wave height of 2.0 - 2.5 ± 0.7 m with a mean wave period of 8.8 s. During
winter months mid latitude depressions can generate a ground swell of >5 m for 60 to 90
days per year (World Wave Atlas; http://www.knmi.nl/waveatlas). Consequently, modern
fringing reefs along the Cape Cuvier coastline are frequently exposed to very high wave
energies.
B.4 METHODS
B.4.1 Surveying, site descriptions and sample collection
Reef framework was described and photographed, and when possible,
corals were identified to species level. The lower emergent reef flat (Fig. 3a) was
surveyed using a transit. The top surface of the adjacent modern fringing reef,
representing MLWS was assigned the 0 m benchmark. The measured transect
Morphostratigraphic evidence for unstable sea levels during marine isotope stage 5e: Cape Cuvier, Western Australia
M.J. O’Leary – Ph.D. thesis
B-5
incorporated the broadest section of reef, from the seaward edge of the terrace
(perpendicular to the coast) that had corals exposed at the surface. The upper coralgal
rim (Fig. 3b) was traced from the exposed southern side to the protected northern side
of the cape, with elevations measured using a survey staff. An actively eroding 3 m high
sea cliff section at the base of the lower emergent platform was measured and logged in
detail (Fig. 3c).
Coral and coralline algal samples were collected using a petrol powered
rock drill, with 15 mm diameter barrel and diamond-impregnated bit. Drill penetration
averaged between 15 and 20 cm. A total of 15 stratigraphically oriented coral cores were
taken from the measured sea cliff section, while 7 cores were drilled across the lower
emergent reef flat transect. Due to the limited exposure of corals along the upper coralgal
rim only two samples were collected using a chisel and hammer.
B.4.2 Sample preparation and analytical procedures
A representative suite of 7 corals were analysed using XRD to assess the degree
of calcite alteration. Thirty-two coral samples were selected for U-series analysis. Samples
were sectioned and micro-sampled to an approximate weight of 200 mg with a dental
drill. Due to the porous nature of the coral skeleton (Fig. 3d), it proved very difficult to
identify or remove any potential secondary mineral crystallization of detrital
contamination. As a result, bulk coral samples had to be analysed. Mechanical cleaning
involved soaking in MilliQ water and sonication.
Samples were first dissolved in distilled water by step addition of 10M HNO3
then spiked with a 50 mg “U-2” 229Th/233U isotope tracers and evaporated to a
minimum solution. A few drops of H2O2 were added to oxidise any remaining organic
material. Samples were redissolved in 3 ml of 2M HNO3 and transferred to bio-spin
®Tru.spec columns which separated U and Th from solution. A 0.1 normal solution of
Morphostratigraphic evidence for unstable sea levels during marine isotope stage 5e: Cape Cuvier, Western Australia
M.J. O’Leary – Ph.D. thesis
B-6
HF/HCl was then passed though the columns to collect and concentrate U and Th. The
solution was evaporated to dryness then redissolved with 2 ml 2% HNO3, prior to
injection.
U-series measurements were performed using a Neptune MC-ICPMS at the
Research School of Earth Sciences, Australian National University. Measurements were
conducted using a combination of simultaneous multiple-Faraday cup and ion counter
protocols based on those previously described for TIMS (Stirling et al., 1998 and
McCulloch and Esat 2000). The main difference being that ion counting/faraday gains
where determined by reference to an external standard (SRM 960) for determination of
234U/235U ratios where 234U is measured using ion counting. For the low abundance
isotopes 230Th and 229Th (spike) these where both measured using the central ion counter,
but simultaneously with 235U and 238U and 232Th on Faraday cups allowing corrections for
both beam instability as well as mass bias. For detailed protocols see McCulloch and
Mortimer (in prep). This multiple-Faraday approach yield higher precision in conjunction
with a significantly reduced sample size requirement, lowering age uncertainties by up to
a factor of five (Stirling et al., 2001) compared to single cup procedures. Although higher
precision measurements are possible using multiple Faraday only procedures (Bernal et al.
(2002), Andersen et al. (2004) Potter et al. (2005) and Stirling et al. (2005)), these suffer
from the disadvantage of requiring much larger, gram size samples. For the labour
intensive preparation of carefully selected portions of coral walls adopted in this study,
the measurement of relatively small samples (<50 mg) is a distinct advantage.
B.4.3 Reliability criteria for 234U/230Th coral ages
Following the procedures of earlier workers (Chen et al., 1991; Stirling et al., 1995
and 1998; Robinson et al., 2004), corals were screened for potential U and Th loss or
gain based on the following criteria:
Morphostratigraphic evidence for unstable sea levels during marine isotope stage 5e: Cape Cuvier, Western Australia
M.J. O’Leary – Ph.D. thesis
B-7
1. We consider the calculated δ234Uinitial to be the best quantitative test for open
system behaviour in corals. For a coral age to be considered strictly reliable
δ234Uinitial values should reflect a modern seawater value of 146.6 ± 4‰.
2. The total uranium concentration of fossil corals should approximate modern
coral values of about 3 ± 0.5 ppm of uranium.
3. Fossil corals should be free of allochthonous 230Th, as indicated by the absence of
detrital 232Th (< 1 ppb).
4. Corals should show primary aragonitic structures or have < 2% calcite
concentration.
B.4.4 Open system corrections
The pervasive nature of coral diagenesis means that most Pleistocene corals have
been subjected to at least some degree uranium or thorium gain or loss. There have been
several attempts to model open-system behaviour in corals, most notably, Thompson et
al. (2003), Villemant and Feuillet (2003) and Scholz et al. (2004). Thompson et al. (2003)
uses a quantitative model where the positive correlation between (234U/238U) meas. and
(230Th/238U) meas. activity ratios is explained by coupled addition of particle-reactive 234U
and 230Th, which is produced by decay and alpha-recoil mobilisation 238U and its
daughters. This study does, however, provide an excellent opportunity to investigate the
utility and reliability of U-series open-system corrections from Cape Cuvier fossil corals.
All corals exhibiting open system behaviour were corrected using the Thompson et al.
(2003) model, which can be most usefully applied to single dates from individual corals
with low initial non-radiogenic 230Th collected from the same reef system.
B.5 RESULTS
Morphostratigraphic evidence for unstable sea levels during marine isotope stage 5e: Cape Cuvier, Western Australia
M.J. O’Leary – Ph.D. thesis
B-8
B.5.1 Coral reef geomorphology
A measured transect finds the windward edge of the lower emergent reef at 3.2 m
above the modern reef terrace (Fig. 4). The reef flat slopes landward at 1.5˚ over 50 m
with the surface covered predominantly in CCA, where corals are exposed at the surface
they generally represent an erosional surface (Fig. 3e). Reef gradient steepens to 3.3˚
over the next 50 m up to 7.4 m with a thin veneer of coralline algal material overlying an
eroded Tertiary eolianite surface. Drainage gutters and rills found on the lower emergent
reef terrace have a similar surface morphology to that of the modern reef (Fig. 3f).
A poorly preserved rim of coralgal material at +8.4 to +10.5 m is found
encrusting a paleosea cliff on both the lee and windward side of the Cape, also described
by Denman and Van de Graaf (1976). On the exposed southern side of the Cape, a
cobble conglomerates at +8-10 m and encrusted with CCA are found to lie
unconformably over an erosional terrace cut into the Tertiary calcarenite (Fig. 3g).
Coarse indurated carbonate deposits with shallow seaward dipping planar beds at +7.4
and +12 m are interpreted to be a beach facies (Fig. 3h).
The modern sea cliff exposes the internal structure of the lower emergent
platform and is found to comprise of medium to coarse-grained detrital sediments and
CCA bindstone, which then grades into a metre high alternating sequence of
monospecific coral (Acropora humulis) and detrital sediment packages. The upper half of
the section is dominated by an alternating coral and CCA bindstone which is then
capped at the surface by CCA.
B.5.2 XRD analysis
The results of XRD analysis conducted on corals from lower reef flat and the
upper coralgal rim are shown in Table 1. Corals LCV7_1 and LCV7_3 collected from the
exposed surface of the main reef terrace were found to be 99% aragonite. Corals from
the upper coralgal rim showed some evidence of calcite alteration with samples LCV2_1
Morphostratigraphic evidence for unstable sea levels during marine isotope stage 5e: Cape Cuvier, Western Australia
M.J. O’Leary – Ph.D. thesis
B-9
and LCV1_2 composed of 96 and 86% aragonite respectively. Samples LCV1e_3,
LCV2e_2, LCV2e_3 and LCV2e_4 were composed of 99% aragonite.
B.5.3 U-series coral dates
The results of 27 U-series coral dates from Cape Cuvier are shown in Table 2 and
(Fig. 5). Uranium concentrations for all corals but one fall within the 2.5 - 3.5 ppm range
that is anticipated for modern corals (Edwards et al., 1988; Eisenhauer et al., 1993; Stirling
et al., 1995). The one outlying coral, LCV2e_4 from the upper coralgal rim had a uranium
concentration of 4.37 ppm. Of the 27 corals analysed, 20 had 232Th concentrations < 1
ppb suggesting minimal non-radiogenic 230Th contamination. Those 7 corals with
suspected detrital contamination had 232Th concentrations ranging between 1.27 and
18.92 ppb, visually showed red staining (though initial micro-sampling attempted to
avoid these areas) and generally gave higher U-series ages (Fig. 5). These corals were not
used in any age interpretations or open system corrections. All corals analysed had
elevated δ234Uinitial values ranging from 168 to 211‰, and as such all dates are considered
unreliable (Fig. 5). The reliability of both uncorrected and corrected coral ages was also
tested against our current understanding of timing, duration and oscillations of 5e sea
levels and how that relates of the timing and nature of fringing reef development.
B.5.4 The reliability of U-series ages in stratigraphic succession
The reliability of both uncorrected and corrected coral ages was also tested
against our current understanding of timing, duration and oscillations of 5e sea levels and
how that relates of the timing and nature of fringing reef development.
Ten coral samples collected from a 3 m high vertical cliff section provide the
fundamental test of stratigraphic superposition for U-series ages (Fig. 6a,b,c). Measured
Morphostratigraphic evidence for unstable sea levels during marine isotope stage 5e: Cape Cuvier, Western Australia
M.J. O’Leary – Ph.D. thesis
B-10
230Th/238U isotope ratios exhibit fairly uniform values of 0.8 ± 0.01 up section (Fig. 6b).
These near equivalent 230Th/238U values produce near equivilent coral ages of 130.5 ± 3
ka (Fig. 6c). This is despite having elevated δ234Uinitial values of 181.6 to 195.1‰, which
are the product of more variable 234U/238U isotopic ratios (Fig. 6a). Based on an earlier
MIS 5e sea level curve by Stirling et al. (1995 and 1998), these conventional (uncorrected)
coral ages coincide with the early stages of the highstand.
Open-system corrections were applied to these corals in an attempt to correct for
post mortality uranium and thorium mobilization. The result was a systematic lowering
of mean coral age from 130.5 ± 3 to 117.3 ± 3.5 ka, a shift of some 13 ka. Once again
there was a tight correlation in coral age down section, where the mean age of lower 5
corals was 117.4 ± 0.6 ka. The minor age inversions observed in the upper half of the
section may be the result of sampling bias, where corals were collected approximately 1
m off section. These corrected ages place suggest the timing of coral growth occured at
the end of MIS 5e.
B.5.5 Lateral reef accretion and U-series ages
The age of the reef flat should correspond to the time the reef reached sea level
and was no longer able to accrete vertically. Five corals collected along a measured
transect across the lower reef terrace and had ages ranging from 118 ka to 138 ka and
had δ234Unitial values of between 171.92 and 211.66‰. These uncorrected coral ages do
not display a uniform sequence of stratigraphic age across the reef flat (Fig. 4).
As a result of open system corrections, coral age increases landward of the
current seaward edge of the reef terrace from 109.82 ka to 121.16 ka at the back reef
(Fig. 4). This age sequence conforms with the laterally prograding reef model
Morphostratigraphic evidence for unstable sea levels during marine isotope stage 5e: Cape Cuvier, Western Australia
M.J. O’Leary – Ph.D. thesis
B-11
(Kennedy and Woodroffe, 2002), however coral age appears younger than the
excepted duration of MIS 5e (Edwards et al., 2003)
B.5.6 Incipient reef development and U-series ages
Due to the exposed setting and poor preservation, corals collected from the
upper coralgal rim samples were less than pristine. Of the 5 corals analysed only
LCV1e_3 and LCV2e_3 had equivalent modern uranium concentrations and minimal
calcite alteration (Table 1; Table 2). The loss of skeletal definition may be the result of
secondary aragonite or calcite precipitation. These two corals returned conventional ages
of 136.0 ± 0.7 and 131.3 ± 0.9 ka and δ234Uinitial values of 167.76 and 189.10‰
respectively. Open system corrections returned ages for LCV1e_3 and LCV2e_3 of 127.0
and 114.0 ka
B.6 DISCUSSION
B.6.1 Reef morphology, evolution and neotectonics
Two geomorphically distinct emergent marine units are evident at Cape Cuvier, a
lower mature reef terrace and an incipient upper coralgal rim. The lower reef unit
represents a prolonged interval of stable sea level, while the under-developed nature of
the upper unit represents a brief seal level hiatus. The difference in elevation between
these two units has been attributed to tectonic displacement (Stirling et al., 1998) but local
geomorphic evidence points to a multiple eustatic sea-level highstand event at Cape
Cuvier.
Western Australia has a tectonically stable coastal margin (Murray-Wallace, 2002).
Its position as an intraplate continental margin in the far field of former ice sheets
minimizes the potential for vertical displacement as a result of glacio-isostatic or tectonic
Morphostratigraphic evidence for unstable sea levels during marine isotope stage 5e: Cape Cuvier, Western Australia
M.J. O’Leary – Ph.D. thesis
B-12
processes. Well-developed early MIS 5e reef flat, terrace, or subtidal features are well
documented in WA. That they show no significant variation across 2500 km of coastline
(Hearty et al., 2004) is testament to this stability. However, suggestions have been made
that significant warping and faulting has occurred during the Quaternary, particularly in
Cape Range (Van de Graff et al., 1976), Shark Bay (Playford, 1990) and Cape Cuvier
(Stirling et al., 1998). Even so, Cape Cuvier also reveals features common to many stable
coastlines around the world such as Bermuda and the Bahamas, including a mature
MIS5e reef terrace at an elevation of +3.5 to +5.5 m. This suggests that this site has not
been subject to tectonic displacement. Therefore the upper coral rim at +8 to 10 m,
found just inboard of the lower reef, which is geomorphically distinct from the lower
platform, must have resulted from a brief eustatic sea level event at this new elevation
and not tectonic displacement.
B.6.1.1 Lateral reef accretion
The presence of a marine planation terrace beneath parts of the lower emergent
reef is revealed where modern erosive processes have excavated deep grooves across the
seaward face of the emergent reef, exposing sections perpendicular the shoreline. This
indicates that coastal erosion took place prior to reef development, with coral growth
occurring close to the shoreline in a shallow water high-energy setting. The resulting lack
of vertical accommodation space would have produced a laterally accreting reef sequence
(Kennedy and Woodroffe 2002). Based on this type of growth history age isochrons
should be parallel to the reef front, meaning progressively older corals will be exposed on
the reef surface landward of the crest.
The surface of the lower reef is veneered by a ~ 10cm thick coralline algae crust
of Hydrolithon or Neogoniolithon (Fig. 3f), which are commonly found in shallow water
Morphostratigraphic evidence for unstable sea levels during marine isotope stage 5e: Cape Cuvier, Western Australia
M.J. O’Leary – Ph.D. thesis
B-13
high-energy environments (Cabioch et al., 1999). This again highlights the high-energy
setting in which the reef developed. Drainage gutters are exposed across the reef flat and
where corals do outcrop at the surface they appear to be truncated (Fig. 3e,f). This
suggests that the reef flat was at times an active zone of both accretion and erosion, likely
influenced by minor oscillations in sea level and local changes in the intensity of
mechanical and bioerosive processes. Age isochrons across the reef flat may be more
varied as a result.
B.6.1.2 Sea cliff retreat
The present seaward limit of the emergent reef at Cape Cuvier does not represent
the true maximum lateral extent of the fossil reef flat. Recent erosive processes within
the mid and upper literal zone have resulted in the notching and retreat of the lower
emergent reef terrace (Fig.3a). It is difficult to calculate erosion rates on limestone
coasts, requiring the quantification of a number of variables including: 1) diversity and
density of bioeroding species; 2) the chemical action of seawater; 3) the mechanical
action of wave-laden sediment; 4) substrate density (Spencer and Viles, 2002); and 5)
freshwater dissolution. Erosion rates along tropical carbonate coastlines can range
anywhere from 2 to 15 mm/yr and up to 33 mm/yr (Playford, 1988). Even using a
conservative rate of 4 mm/yr (Trudgill, 1983) would mean that the lower emergent reef
has retreated by at least 30 m during the Holocene. The fossil corals now exposed at the
shoreface should represent a growth period sometime prior to the termination of MIS 5e
(coral ages > 116 ka) and the emergence of the reef.
Morphostratigraphic evidence for unstable sea levels during marine isotope stage 5e: Cape Cuvier, Western Australia
M.J. O’Leary – Ph.D. thesis
B-14
B.6.1.3 Coralgal rim development
At Cape Cuvier geomorphic features infer a brief but rapid sea level rise of
between 4 and 6 metres during MIS 5e. Evidence includes an erosional terrace (+10 m)
in situ coral (+9.4 m), coralline algal rim (+10.5 m) and beach deposits (+7.4 and +12.5
m) (Denman and Van de Graaff 1976). The difference in elevation and morphology of
the upper coralgal rim compared the lower emergent reef terrace indicate vastly different
development histories. The mature nature of the lower reef terrace points to an extensive
growth history during a period of relative stable sea level, while the underdeveloped
nature of the upper coralgal rim points to a rapid sea level rise brief hiatus then rapid fall.
Neumann and Hearty (1996) argued on the basis of bioerosion rates of a Bahamian +6 m
notch that this peak 5e sea level event may have lasted for less than 600 years. This
period of time was insufficient to promote abundant coral growth at this new elevation
or for the lower reef terrace to fill the newly available accommodation space. The short
duration of this peak sea level event should result in a brief period of coral growth and
consequently a tight cluster of coral ages.
B.6.2 U-series dates and reef development
B.6.2.1 Stratigraphic integrity of uncorrected and corrected U-series ages
Corals collected from the eroded sea cliff provide a stratigraphic context for the
measured U-series ages. Age isochrons of a laterally accreting reef should be parallel to
the reef front. Therefore, corals collected from the sea cliff section should be
approximately similar in age. Of the 10 corals collected, nine display comparatively
similar ages of 130.5 ± 3.0 ka (Fig. 6c), and correspond to measured isotopic ratios,
which exhibit roughly equivalent values up section (Fig 6a,b). These concordant age and
Morphostratigraphic evidence for unstable sea levels during marine isotope stage 5e: Cape Cuvier, Western Australia
M.J. O’Leary – Ph.D. thesis
B-15
isotope values are in contrast to their δ234Uinitial values, which range between 172 and 193
‰.
Despite the apparent variance in δ234Uinitial, when 234U/238U and 230Th/238U are
plotted on an activity ratio diagram there appears a linear array of isotopic anomalies
intersecting the closed-system seawater evolution curve at around 124 ka (Fig 7). A
linear array such as this suggests that coeval age corals gained different amounts of
uranium with a fixed δ234U value around the same time (Scholz et al., 2004). Those corals
that do not lie on the linear array may have been subjected to late uranium uptake or
different 234U/238U groundwater activities, or detrital 230Th contamination.
When an open system correction (Thompson et al., 2003) is applied to these
conventional U-series ages, we observe an over all reduction in age to 116.7 ± 3.6 ka.
Again based on the known duration of MIS 5e (116-132 ka) these corrected ages place
timing of coral growth at the end of 5e. We know that modern erosive processes have
conservatively removed over 1/3 of the original total width of the reef. Consequently,
the current seaward extent of the lower reef terrace cannot represent the final position of
the 5e reef crest, as an age of 116 ka would suggest. Therefore, these corrected ages are
again too young to correlate with the predicted growth history of this laterally accreting
fringing reef.
B.6.2.2 Lateral reef growth and uncorrected and corrected U-series ages
Assuming a laterally accreting growth history for the lower emergent reef, U-
series coral ages are expected to become progressively older landward of the shoreface.
This trend was not expressed in the U-series analyses of five corals collected from a
surveyed cross reef transect (Fig. 4). The lack of consistency across the reef flat could be
explained by differential erosion and vertical accretion, resulting in a mixture of coral
Morphostratigraphic evidence for unstable sea levels during marine isotope stage 5e: Cape Cuvier, Western Australia
M.J. O’Leary – Ph.D. thesis
B-16
ages exposed at the reef surface. However elevated δ234Uinitial values, a consequence of
U/Th exchange, can also produce errors in U-series age calculations and stratigraphic age
inversions (Fig. 6).
When an open system correction (Thompson et al., 2003) is applied to these
conventional U-series ages, the cross reef flat age succession conforms to the laterally
accreting reef growth model. The closest shore face coral returned an age of 109.82 ka
increasing incrementally to a back reef age of 121.16 ka. These open system age
corrections despite showing age order across the reef flat open would seem to have
underestimated the actual coral age by about 10 ka, based on the established duration of
MIS 5e of 116 ± 1 to 129 ± 1 ka (Edwards et al., 2003).
B.6.2.3 Open system age corrections from the coralgal rim
The incipient nature the upper coralgal rim suggests a brief period of coral
growth at this new sea level elevation, and a tight clustering of coral ages is expected.
Unfortunately, due to the exposed nature of the deposit all samples were subject to
U/Th exchange, expressed in elevated δ234Uinitial values and ages ranging from between
126.46 ± 0.53 and 137.73 ± 0.9 ka. Open system corrections were applied to the two
remaining corals with minimal 232Th contamination or elevated U concentrations and
returned ages of 127 ka for LV1_3 and 116 ka for LCV2_1. The timing of this peak 5e
sea level event is believed to have occurred at the end of 5e (Hearty and Neumann et al.,
2001), and although LCV2_1 (116 ka) does return a corrected age that agrees with the
timing of this sea level event the other coral LCV1_3 (127 ka) does not. There is nothing
in these corals geochemistry that could distinguish why one corrected coral age should be
considered more reliable than the other corrected coral age. Consequently, as a result of
Morphostratigraphic evidence for unstable sea levels during marine isotope stage 5e: Cape Cuvier, Western Australia
M.J. O’Leary – Ph.D. thesis
B-17
advanced diagenesis and U/Th mobilisation and ambiguous open-system corrections
from coralgal rim corals, no reliable age data could be obtained from this upper unit.
B.7 CONCLUSIONS
1. Emergent marine units at Cape Cuvier can be divided in two morphostratigraphic
units. Lower terrace reef growth initiated close to shore atop an erosional terrace.
The lack of vertical accommodation space forced the reef to accrete laterally
creating a seaward thickening wedge of carbonate sediment. Reef structure is
composed primarily of coral framestone and coralgal bindstone. The well-
developed nature of the reef suggests it developed during an extended sea level
stillstand. Coral and coralline algae are found encrusting paleosea cliff 5 to 7 m
above the height of lower reef terrace. The incipient nature of the deposit and the
fact that the lower terrace was not able to utilize the newly available
accommodation space points to a brief but rapid sea level excursion to this new
elevation; in line with observations from other stable carbonate platforms.
2. U-series dating of fossil corals were undertaken in order better define the timing
and duration of multiple sea level events at Cape Cuvier. All measured corals
exhibited elevated δ234Uinitial values, suggesting that there was at pervasive uptake
of 234U-enriched uranium within the reef system. A result of this open system
behaviour was for corals to exhibit older apparent ages that conflicted with the
known duration of MIS 5e and the apparent growth history of the reef.
3. Open system corrections were applied to these corals in an attempt to improve
their age reliability. However, like the conventional U-series ages, these corrected
Morphostratigraphic evidence for unstable sea levels during marine isotope stage 5e: Cape Cuvier, Western Australia
M.J. O’Leary – Ph.D. thesis
B-18
ages do not correspond to either the known duration of MIS 5e or the apparent
growth history of the reef. Whereas the conventional ages are too old by several
thousand years, the corrected ages appear too young by several thousand years.
Morphostratigraphic evidence for unstable sea levels during marine isotope stage 5e: Cape Cuvier, Western Australia
M.J. O’Leary – Ph.D. thesis
B-19
B.8. REFERENCES
Andersen, M.B., Stirling, C.H., Potter E.K., Halliday, A.N., 2004. Toward epsilon levels ofmeasurement precision on 234U/238U by using MC-ICPMS. International Journal of MassSpectrometry 237 (2-3), 107-118.
Bard, E., Fairbanks, R.G., Hamelin, B., Zindler, A., Huang, C.T., 1991. 234U anomalies in coralsolder than 150,000 years. Geochimica et Cosmochimica Acta 55, 2385-2390.
Cabioch, G., Montaggioni, L.F., Faure, G., Ribaud-Laurenti, A., 1999. Reef coralgal assemblagesas recorders of paleobathymetry and sea level changes in the Indo-Pacific province.Quaternary Science Reviews 18, 1681-1695.
Chen, J.H., Curran, H.A., White, B., Wasserburg, G.J., 1991. Precise chronology of the LastInterglacial period: 234U230Th data from fossil coral reefs in the Bahamas. GeologicalSociety of America Bulletin 103, 82-97.
Denman, P.D., Van de Graaff, W.J.E., 1976. Emergent Quaternary marine deposits in the LakeMacLeod area, Western Australia. Western Australia Geological Survey Annual Report1977, 32-36.
Eisenhauer, A., Zhu, Z.R., Collins, L.B., Wyrwoll, K.-H., Eichstatter, R., 1993. The LastInterglacial sea level change: new evidence from the Abrolhos Islands, West Australia.Geol. Rundsch. 85, 606-614.
Edwards, R.L., Taylor, F.W., Wasserburg, G.J., 1988. Dating earthquakes with high-precisionthorium-230 ages of very young corals. Earth and Planetary Science Letters 90, 371-381.
Hamelin, B., Bard, E., Zindler, A., Fairbanks, R.G., 1991. 234U/238U mass spectrometry of corals:How accurate is the U-Th age of the last interglacial period? Earth and Planetary ScienceLetters 106, 169-18.
Hearty, P.J., Neumann, A.C., 2001. Rapid sea level and climate change at the close of the Lastinterglaciation (MIS 5e): evidence from the Bahamas Islands. Quaternary Science Reviews20, 1881-1895.
Hearty, P.J., O’Leary M.J., 2004 Stratigraphy of Quaternary Peri-continental carbonate andquartz dunes of W. Australia. 17th Australian Geological Convention, Hobart, Tasmania.
Henderson, G.M., 2002. Seawater (234U/238U) during the last 800 thousand years. Earth andPlanetary Science Letters 199, 97-110.
Kennedy, D.M., Woodroffe, C.D., 2002. Fringing reef growth and morphology: a review Earth-Science Reviews 57 255-277.
Morphostratigraphic evidence for unstable sea levels during marine isotope stage 5e: Cape Cuvier, Western Australia
M.J. O’Leary – Ph.D. thesis
B-20
McCulloch, M.T., Esat T., 2000. The coral record of last interglacial sea levels and sea surfacetemperatures. Chemical Geology 169, 107-129.
Murray-Wallace, C. V. 2002. Pleistocene coastal stratigraphy, sea-level highstands andneotectonism of the southern Australian passive continental margin - a review.Journal of Quaternary Science 17, 469 - 489.
Neumann, A.C., Hearty, P.J., 1996. Rapid sea-level changes at the close of the last interglacial(substage 5e) recorded in Bahamian island geology. Geology 24 (9), 775-778.
Playford PE. 1988. Guidebook to the Geology of Rottnest Island. Excursion Guidebook No. 2,Western Australia Division of the Geological Society of Australia: Perth; 67 pp.
Playford, P.E., 1990. Geology of the Shark Bay area, Western Australia. In: Berry, P.F.,Bradshaw, S.D. & Wilson, B.R. (Eds.). Research in Shark Bay. Report of the France-Australe Bicentenary Expedition Committee. Western Australian Museum, Perth, 13-31.
Potter, E.K., Stirling, C.H., Andersen, M.B., Halliday, A.N., 2005. High precision Faradaycollector MC-ICPMS thorium isotope ratio determination. International Journal of MassSpectrometry 247 (1-3), 10-17.
Robinson, L.F., Belshaw, N. S., Henderson G.M., 2004. U and Th concentrations and isotoperatios in modern carbonates and waters from the Bahamas. Geochimica et CosmochimicaActa 68, 1777 - 1789.
Scholz, D., Mangini, A., Felis, T., 2004. U-series dating of diagenetically altered fossil reef corals.Earth And Planetary Science Letters 218 (1-2), 163-178.
Stirling, C.H., Esat, T.M., McCulloch, M.T., Lambeck, K. 1995. High-precision U-series datingof corals from Western Australia and implications for the timing and duration of the LastInterglacial. Earth and Planetary Science Letters 135, 115-130.
Stirling, C.H., Esat, T.M., Lambeck, K., McCulloch, M.T. 1998. Timing and duration of the LastInterglacial: evidence for a restricted interval of widespread coral reef growth. Earth andPlanetary Science Letters 160, 745-762.
Stirling, C.H., Halliday A.N., Porcell, D., 2005. In search of live Cm-247 in the early solar system.Geochimica et Cosmochimica Acta 69 (4), 1059-1071.
Stirling, C.H., Esat, T.M., Lambeck, K., McCulloch, M.T., Blake, S.G., Lee D.C., Halliday, A.N.,2001. Orbital forcing of the marine isotope stage 9 interglacial. Science 291 (5502), 290-293.
Spencer, T., Viles, H., 2002. Bioconstruction, bioerosion, and disturbance on coral reefs androcky carbonate coasts. Geomorphology 48, 23-50.
Taylor, J.G., Pearce, A.F., 1999. Ningaloo Reef Current observations and implications forbiological systems: Coral spawn dispersal, zooplankton and whale shark abundance.Journal of the Royal Society of Western Australia 82, 57-65.
Morphostratigraphic evidence for unstable sea levels during marine isotope stage 5e: Cape Cuvier, Western Australia
M.J. O’Leary – Ph.D. thesis
B-21
Thompson, R.O.R.Y., 1984. Observations of the Leeuwin Current off Western Australia. Journalof Phyical Oceanography 14, 623-628.
Thompson, W.G., Spiegelmann, M.W., Goldstein, S.L., Speed, R.C., 2003. An open-systemmodel for U-series age determinations of fossil corals. Earth and Planetary Science Letters210, 365-380.
Trudgill, S.T., 1983. Preliminary estimates on intertidal limestone erosion, One Tree Island,Southern Great Barrier Reef, Australia. Earth Surface Processed and Landforms 8 (2), 189-193.
Van de Graaff, W.J.E., Denman, P.D. and Hocking, R.M., 1976. Emerged Pleistocene marineterraces on Cape Range, Western Australia. Geological Survey of Western AustraliaAnnual Report, 62-69.
Veeh, H.H., Schwebel, D., van de Graaff, W.J.E., Denman, P.D., 1979. Uranium series ages ofcoralline terrace deposits in Western Australia. Journal of the Geological Society ofWestern Australia, 26 285-292.
Villemant, B., Feuillet N., 2003. Dating open systems by the 238U-234U-230Th method:application to Quaternary reef terraces. Earth and Planetary Science Letters. 210, 105-118.
Morphostratigraphic evidence for unstable sea levels during marine isotope stage 5e: Cape Cuvier, Western Australia
M.J. O’Leary – Ph.D. thesis
B-22
B.9 FIGURES 1-7
Figure 1: Location of Cape Cuvier, Western Australia
Morphostratigraphic evidence for unstable sea levels during marine isotope stage 5e: Cape Cuvier, Western Australia
M.J. O’Leary – Ph.D. thesis
B-23
Figure 2: An aerial photograph of Cape Cuvier showing the lower MIS 5e reef platform and
upper coralgal rim. The 9am and 3pm wind rose are also shown.
Morphostratigraphic evidence for unstable sea levels during marine isotope stage 5e: Cape Cuvier, Western Australia
M.J. O’Leary – Ph.D. thesis
B-24
Figure 3: A) Modern and emergent reef platform at Cape Cuvier (looking north) at low tide,
coralline algae can be seen encrusting the fossil reef in the foreground, cliffs in the background
host the upper coralgal rim. B) 3 m high sea cliff section, thick coral (A. digitifera) plates can be
observed with black dots representing a coral drill core. C) Seaward looking view of the
emergent reef flat, a drainage gutter displays similar morphology to the modern reef flat in the
background. D) Coralline algae can be seen encrusting the paleo-sea-cliff mid way up photo. E)
A sectioned sample of A. Digitifera collected from the sea cliff. F) a large favid coral exposed on
the surface of the emergent reef flat, it appears truncated and capped by coralline algae. G) Wave
cut coral terrace at an elevation of +10 m capped by a coralline algal conglomerate. H) Fossil
beach at 7.4 m.
Morphostratigraphic evidence for unstable sea levels during marine isotope stage 5e: Cape Cuvier, Western Australia
M.J. O’Leary – Ph.D. thesis
B-25
Figure 4: Surveyed transect of the emergent reef terrace at Cape Cuvier and U-series ages (000).
Corrected U-series ages are bracketed.
Morphostratigraphic evidence for unstable sea levels during marine isotope stage 5e: Cape Cuvier, Western Australia
M.J. O’Leary – Ph.D. thesis
B-26
Figure 5: δ234Uinitial vs. 230Th-age. The duration and elevation of MIS 5e sea levels (based on data
from Hearty and Neumann 2001) are also plotted (shaded areas). All corals exhibit δ234Uinitial
values that are greater than modern seawater, which has a 234U/238U activity of 146.6‰.
Thompson et al. (2003) open-system model was used to correct those corals with elevated δ234U
to modern seawater activity of 146.6‰. The corrected ages would suggest coral growth
occurred almost exclusively at the end of MIS 5e.
Morphostratigraphic evidence for unstable sea levels during marine isotope stage 5e: Cape Cuvier, Western Australia
M.J. O’Leary – Ph.D. thesis
B-27
Figure 6: Isotopic ratios and 230Th age for corals collected up a 3 m measured section at Cape
Morphostratigraphic evidence for unstable sea levels during marine isotope stage 5e: Cape Cuvier, Western Australia
M.J. O’Leary – Ph.D. thesis
B-30
Notes to Table 2.
1 Uranium concentrations are measured in parts per million (ppm).2 230Th concentrations measured in parts per trillion (ppt).3 232Th concentrations measured in parts per billion (ppb).
4 δ234U = {[(234U/238U)/(234U/238U)eq]-1} x 103. (234U/238U)eq is the atomic ratio at secular equilibrium and is equal to
λ238/λ234 = 5.4891 x 10⁻⁵, , where λ238 and λ234 are the decay constants for 238U and 234U, respectively, adopting half-
lives of Cheng et al., (1998)
5 [230Th/238U]act = (230Th/238U)/(λ238/λ230).
6 U-series ages are calculated iteratively using:
1- [230Th/238U]act = exp-λ230T – (δ234U(0)/1000)(λ230/(λ230-λ234))(1-exp(λ234-λ230T) where T is the age in years and λ230 is
the decay constant for 230Th. λ238= 1.551 x 10⁻¹⁰ y-1; λ234= 2.826 x 10⁻⁶ y-1; λ230= 9.158 x10⁻⁶ y-1. Strictly reliable ages
will have 234Uinitial 146.6 ± 5‰
7 The initial value is given by δ234Ui = δ234U(0)exp(λ234T), where T is the age in years.8 Open system ages were modelled after Thompson et al., 2003.
Coral reef and stromatolite development in Shark Bay during Recent and Marine Isotope Stage 5e sea level high-stands
M.J. O’Leary – Ph.D. Thesis
C-1
SECTION C
Coral reef and stromatolite development in Shark Bay
during Recent and Marine Isotope Stage 5e sea level high-
stands
Coral reef and stromatolite development in Shark Bay during Recent and Marine Isotope Stage 5e sea level high-stands
M.J. O’Leary – Ph.D. Thesis
C-2
C.1 ABSTRACT
Field observations and U-series ages reveal that Shark Bay, Western Australia (WA) has
been flooded on at least 3 occasions during the Upper Pleistocene/Holocene period, resulting in
a succession of marine deposits around the Bay. The exact age of these deposits has until now
been problematic due to a lack of reliable and accurate age data. This study reports 17 new U-
series coral dates from emergent reef deposits around Shark Bay which together with new field
data, point to an extended period of coral reef development during the peak of the last
interglacial, marine isotope stage (MIS) 5e. There is little direct evidence of fossil reef
development occurring during interglacials of the Middle/Upper Pleistocene (MIS 9/11). This
places most of the fossil reefs currently assigned to the Dampier Formation (Middle Pleistocene)
such as those observed at Tetrodon Loop and Monkey Mia into the Bibra Formation, which is
shown to be of Last Interglacial (MIS 5e) age.
Coral reef communities in Shark Bay were significantly more widespread during MIS 5e
compared to those of the present day, despite similar architecture of the bay and coastal
configuration. This can be attributed to higher sea levels and an absence of major sill and bank
structures that together with increased water depth, resulted in an enhancement of marine
circulation within the reaches and basins. The youngest geomorphic features in Shark Bay are
bathymetrically controlled, and include the formation of Faure and Fork Flat sills, a result of
extensive carbonate sedimentation during the Holocene. Stromatolites are absent from the
geological record within Shark Bay until the Holocene; suggesting that sea levels and marine
sedimentary processes that have operated during the present sea-level highstand are unique to
this period.
Coral reef and stromatolite development in Shark Bay during Recent and Marine Isotope Stage 5e sea level high-stands
M.J. O’Leary – Ph.D. Thesis
C-3
C.2 INTRODUCTION
Present-day Shark Bay on the central west coast of Australia (25.5˚ to 26.5˚ South
latitude) has a depauperate (to non-existent in inner bay waters) coral fauna when compared to
Ningaloo reef in the North and the Houtman-Abrolhos in the south (Fig. 1a). The presence of
large barrier islands to the east and north, as well as the length and shallowness of the
embayments restrict oceanic circulation within Shark Bay (Logan and Cebulski, 1970). As a
result, strong, permanent high salinities and steep temperature gradients limit the occurrence of
modern coral growth to the seaward margins of the embayments (Marsh, 1990). There is
however evidence of reef development occurring well within the present metahaline and
hypersaline embayments during previous interglacials (Logan et al., 1970).
Although limiting present-day coral growth, the hypersaline environments such as those
present today in the southern end of Hamelin Pool, Shark Bay, are ideal for the development of
microbial communities responsible for building stromatolites. Although they are amongst the
oldest form of life being recorded back to the early Archean, stromatolites have an extremely
limited present-day occurrence being restricted to a few other hypesaline lakes along the Western
Australian coastline and a restricted occurrence in the Bahamas. Thus understanding the
evolution of the Shark Bay environment is critical to understanding this unique and once prolific
form of life.
The history of the evolution and carbonate sedimentation of Shark Bay is summarised by
Playford (1990) and reported in two American Association of Petroleum Geologists (AAPG)
Memoirs, “Carbonate Sedimentation and Environments, Shark Bay, Western Australia”, No. 13,
1970 and “Evolution and Diagenesis of Quaternary Carbonate Sequences, Shark Bay”, Western
Australia No. 22, 1974. While the sedimentological aspects of both AAPG memoirs are highly
detailed and descriptive, the terminology and chronology of the marine highstand events is
Coral reef and stromatolite development in Shark Bay during Recent and Marine Isotope Stage 5e sea level high-stands
M.J. O’Leary – Ph.D. Thesis
C-4
questionable due to the absence of reliable dating techniques and a limited understanding of
timing and amplitude of Quaternary sea-level change.
The early work of Logan et al. (1970) recognized that the ancestral dune landscape of
Shark Bay was flooded on three separate occasions during the latter part of the Quaternary.
Evidence for these marine transgressions is revealed in marine carbonate sequences that outcrop
along the Shark Bay coastline. These marine transgressions are referred to in order of decreasing
C.8.1 Holocene sea levels and the marine development of Shark Bay
A series of Holocene coquina beach ridges composed exclusively of the halotolerent
mollusc species, Fragum erugatum are found along the southern margin of Hamlin Pool (Playford,
1990), with the oldest ridge returning an age of 5500 YBP (Nott, 2006). This would suggest
Hamlin Pool reached meta/hypersaline levels not long after the initial +2 m early-Holocene sea-
level highstand event, which in Western Australia occurred around 7 ka (Collins et al., 2006)
(Fig. 5). For such a rapid transition from oceanic to hypersaline conditions, it is likely a relict
Pleistocene high (proto-Faure Sill), with its surface projections manifest in Faure and Pelican
Islands, presented an initial barrier for seawater exchange between Hamlin Pool and Hopeless
Reach (Fig. 4). Tidal flow across this barrier facilitated ooid precipitation, with vertical bank
accretion reducing sill depth to its current 2 m, while the basin itself has an average depth of 4
m. This bathymetric configuration combined with a gradual late Holocene sea-level regression
(Collins et al., 2006) further restricted oceanic circulation where by 1250 YBP stromatolites had
become firmly established (Chivas et al., 1990) and contemporary salinities now reach 60-70‰
(Fig. 5).
Reduced marine circulation may also be aided by the lack or carbonate transport
onshore, a consequence of shallow sand banks, extensive seagrass habitats and limited fetch, all
of which reduce the ability of waves and currents to mobilise sediments. As a result carbonate
deposition has been confined exclusively to the bays and reaches, filling available
Coral reef and stromatolite development in Shark Bay during Recent and Marine Isotope Stage 5e sea level high-stands
M.J. O’Leary – Ph.D. Thesis
C-18
accommodation space, reducing oceanic circulation and raising salinities. Given the present
extent of the bank and shoal features and the fact that sea-level has only reached its present
position within the last 7 ka (Collins et al., 2006), continual filling and further oceanic restriction
within Shark Bay is expected.
Whilst Hamlin Pool might be considered the near end product of carbonate infilling
Freycinet Harbour might be considered as an intermediate stage. Its northern Fork Flat Sill has
an average depth of 5 m, the bay itself has an average depth of 10 m. This bathymetric
configuration has resulted in a metahaline (46-48‰) environment. While Freycinet still supports
extensive seagrass habitats and other carbonate producing communities, both coral and
stromatolite communities are absent. We therefore observe that with a more porous sill and
deeper basin, as in Freycinet Harbour, circulation is increased and the potential for hypersalinity
is diminished. The question then arises, if carbonate production was and is such an active
process during the most recent sea level highstand, and assuming similar processes operated
during previous interglacial highstands, why then are habitats once occupied by a diverse coral
fauna now the exclusive domain of stomatolites?
C.8.2 MIS 5e sea levels and the marine development of Shark Bay
The rapid onset of hypersaline conditions in Hamlin Pool during the Holocene is in
marked contrast to the MIS 5e marine environment, which shows periods of coral growth
between 129 and 124 ka and another around 122 ka (Fig. 3). The primary difference between
these two highstand events is in their respective sea level histories. Sea levels during the early
stages of MIS 5e were at least 3 m higher than they are today, as is evidenced from emergent
fossil reef terraces in Shark Bay and other MIS 5e sites (Hearty and Neumann 2001, McCulloch
and Esat, 2000). This would mean, assuming an average embayment depth of 10 m, that there
was 30% more accommodation space available during MIS 5e, allowing for enhanced marine
Coral reef and stromatolite development in Shark Bay during Recent and Marine Isotope Stage 5e sea level high-stands
M.J. O’Leary – Ph.D. Thesis
C-19
circulation (such as we observe in modern day Freycinet Harbour), also increasing the time
required to infill the embayment and hence ultimately restrict oceanic circulation (Fig. 4).
Coral growth increased during the early and middle stages of MIS 5e and up to about 125
ka, before apparently abruptly halting at around 124 ka (Fig 3). The cause of this reduction in
coral reef development could be twofold. By 124 ka, carbonate sedimentation within the bays
and reaches may have been sufficient to restricted marine circulation thereby increasing salinities,
as is the current situation in Hamlin Pool. However, coral development along the oceanic
sections of the bay also seems to show a similar pattern, suggesting that it is not controlled by
local features and does not appear to be an artefact from a sampling bias. The other possibility is
a regression in sea level caused by a brief but complete halt to coral development within the bay.
Several sea-level curves for the last interglacial including, Hearty and Neumann (2001) and
Sherman et al. (1993), point to a brief regression in sea-level during mid 5e (Fig. 5), this could be
correlated with the apparent age gap with the number of dated corals at 125 ka decreasing from
six to nil at 124 ka.
Sea level is believed to have recovered from the mid-MIS 5e regression by 123 ka to an
elevation of +3 to +4 m above current MSL (Hearty et al., in review). This event saw a
reestablishment of coral grow at sites deep within Shark Bay’s embayments, including Pelican
Island and Baba Head. The termination of MIS 5e was marked by a brief but rapid excursion to
+6 to +9 m with an apparent rapid decent to MIS 5d at around 118 ka. The youngest Shark Bay
coral is dated to 119 ka.
It would appear that the marine environments of Shark Bay have been strongly
influenced by even relatively small changes in sea level. We observe that minor shifts in sea-level
elevation can strongly affecting the hydrodynamics of the bay, more so where embayments are
deep and water depths shallow. Fluctuations in highstand sea levels can have a major affect on
Coral reef and stromatolite development in Shark Bay during Recent and Marine Isotope Stage 5e sea level high-stands
M.J. O’Leary – Ph.D. Thesis
C-20
salinity gradients, which in turn control the distribution type and extent of carbonate producing
habitats.
C.9 CONCLUSIONS
1. U-series dating of emergent fossil reefs point to an extended period of coral reef
development within Shark Bay during the peak of the last interglacial - MIS 5e. There is
little evidence of fossil reef development during the Middle/Upper Pleistocene (MIS 9 to
11). This then places most of the fossil reefs previously assigned to the Dampier
Formation (Middle Pleistocene) such as those at Tetrodon Loop and Monkey Mia into
the Bibra Formation - MIS 5e. Therefore the occurrence of an emergent coral reef within
Shark Bay can be positively correlated to MIS 5e and be used as a chronostratigraphic
benchmark. The extensively calcretized beach and dune ridges exposed along the coastal
parts of Shark Bay also support evidence for Middle Pleistocene sea-level transgressions
into Shark Bay.
2. Most of the major morphological features currently observed in Shark Bay were also
prominent features during MIS 5e. This is based on the older ages of both the Peron
sand complex and eolianites which form the major geomorphic features of Shark Bay, as
well as the proximity of MIS 5e shorelines to those of present Holocene shorelines. The
most recent features in Shark Bay have been bathymetric, and include the formation of
Faure and Fork Flat sills, the latter being due to extensive carbonate sedimentation
during the Holocene.
Coral reef and stromatolite development in Shark Bay during Recent and Marine Isotope Stage 5e sea level high-stands
M.J. O’Leary – Ph.D. Thesis
C-21
3. Coral reef development was widespread in MIS 5e Shark Bay compared to Modern Shark
Bay. This can be attributed to higher sea levels and absence of major sill and bank
structures that increase water depth, thereby enhancing marine circulation within the
reaches and basins. Stromatolites are absent from the earlier geological record within
Shark Bay; suggesting that the marine sedimentary processes that have operated over the
precent Holocene sea-level highstand were unique in filling available accommodation
space and thus reducing oceanic circulation and causing hypersaline conditions within
upper embayments of Shark Bay, whereas during MIS 5e the persistence of higher sea
levels resulted in the embayments having more open marine conditions.
Coral reef and stromatolite development in Shark Bay during Recent and Marine Isotope Stage 5e sea level high-stands
M.J. O’Leary – Ph.D. Thesis
C-22
C.9 REFERENCES
Andersen, M.B., Stirling, C.H., Potter, E.K., Halliday, A.N., 2004, Toward epsilon levels ofmeasurement precision on 234U/238U by using MC-ICPMS: International Journal ofMass Spectrometry v. 237 (2-3), p. 107-118.
Bard, E., Fairbanks, R.G., Hamelin, B., Zindler, A., Huong, C.T., 1991, 234U anomalies in coralsolder than 150,000 years, Geochimica et Cosmochimica Acta v. 55, 2385-2390.
Bernal, J.P., McCulloch, M.T., Mortimer, G.E., Esat, T., 2002, Strategies for the determination ofthe isotopic composition of natural Uranium, Geochemica et Cosmochemica Acta v. 66(15A), p. A72-A72.
Bricker, O.P., 1971, Introduction: beachrock and intertidal cement, in Bricker, O.P. (Ed.),Carbonate Cements: John Hopkins Press, Baltimore, MD, p. 1-3.
Burling, M.C., Ivey, G.N., Pattiaratchi, C.B., 1999, Convectively driven exchange in a shallowcoastal embayment: Continental Shelf Research 19, p. 1599-1616.
Chen, J.H., Curran, H.A., White, B., Wasserburg, G.J., 1991, Precise chronology of the LastInterglacial period: 234U230Th data from fossil coral reefs in the Bahamas, GeologicalSociety of America Bulletin v. 103, p. 82-97.
Chivas, A.R., Torgersen, T., Polach, H.A., 1990, Growth rates and Holocene development ofstromatolites from Shark Bay, Western Australia: Australian Journal of Earth Science v. 37,p. 113-121.
Donald, A., 2003, Marine and continental sediment flux in Shark Bay, Western Australia: Thesis(B.Sc. Hons) - James Cook University.
Hamelin, B., Bard, E., Zindler, A., Fairbanks, R.G., 1991, 234U/238U mass spectrometry of corals:How accurate is the U-Th age of the last interglacial period? Earth and Planetary ScienceLetters v. 106, p. 169-181.
Hatcher, B.G., 1991, Coral reefs in the Leeuwin Current – an ecological perspective: Journal ofthe Royal Society of Western Australia, v. 74, p. 115-127.
Hearty, P.J., Kaufman, D.S., 2000, Whole-rock aminostratigraphy and Quaternary sea-levelhistory of the Bahamas: Quaternary Research, v 54, p. 163-173.
Hearty, P.J., Neumann, A.C., 2001, Rapid sea level and climate change at the close of the LastInterglaciation (MIS 5e): evidence from The Bahama Islands: Quaternary Science Reviews,v. 20, p. 1881-1895.
Hearty, P.J., Neumann, A.C., Hollin, J.T., O’Leary M.J., McCulloch M.T., in review, Sea leveloscillations during the last interglaciation (sensu stricto MIS 5e): Quaternary ScienceReviews.
Coral reef and stromatolite development in Shark Bay during Recent and Marine Isotope Stage 5e sea level high-stands
M.J. O’Leary – Ph.D. Thesis
C-23
Henderson, G.M., 2002, Seawater 234U/238U during the last 800 thousand years, Earth andPlanetary Science Letters v. 199, p. 97-11.
Hocking, R.M., Moors, H.T., Van De Graff, W.J.E., 1987, Geology of the Carnarvon Basin ofWestern Australia: Geological Survey of Western Australia Bulletin, v. 133.
Kendrick, G.A., Huisman, J.M., Walker, D.I., 1990, Benthic Macroalgae of Shark Bay, WesternAustralia: Botanica Marina v. 33, p. 47-54.
Logan, B.W., Cebulski, D.E., 1970, Sedimentary environments of Shark Bay, Western Australia:The American Association of Petroleum Geologists, Memoir No. 13, p. 1-37.
Logan, B.W., Read, J.R., Davies, G.R., 1970, History of carbonate sedimentation, QuaternaryEpoch, Shark Bay, Western Australia: American Association of Petroleum GeologistsMemoir No. 13, p. 38-85.
Marsh, L.M., 1990, Hermatypic corals of Shark Bay, Western Australia, in: Berry, P.F., Bradshaw,S.D. & Wilson, B.R. (Eds.), Research in Shark Bay. Report of the France-AustraleBicentenary Expedition Committee: Western Australian Museum, Perth, p. 107-114.
McCulloch, M.T., Esat T., 2000, The coral record of last interglacial sea levels and sea surfacetemperatures, Chemical Geology v. 169, p. 107-129.
Nott, J., 2006, Tropical cyclones and the evolution of the sedimentary coast of northernAustralia, Journal of Coastal research, v. 22 (1) p, 49-62.
Playford, P.E., Cockbain, A.E., Low, G.H., 1976, Geology of the Perth Basin, Western Australia:Bulletin Geological Survey of Western Australia, v. 124, p. 298.
Playford, P.E., 1990. Geology of the Shark Bay area, Western Australia, in: Berry, P.F.,Bradshaw, S.D. & Wilson, B.R. (Eds.), Research in Shark Bay, Report of the France-Australe Bicentenary Expedition Committee: Western Australian Museum, Perth, p. 13-31.
Potter, E.K., Stirling, C.H., Andersen, M.B., Halliday, A.N., 2005, High precision Faradaycollector MC-ICPMS thorium isotope ratio determination: International Journal of MassSpectrometry v. 247 (1-3), p. 10-17.
Read, J.F., 1974, Calcrete deposits and Quaternary sediments, Edel Province, Shark Bay, WesternAustralia: American Association of Petroleum Geologists Memoirs No. 22, p. 250-282.
Robinson, L.F., Belshaw, N. S., Henderson G.M., 2004, U and Th concentrations and isotoperatios in modern carbonates and waters from the Bahamas, Geochimica et CosmochimicaActa v. 68, p. 1777–1789.
Stirling, C.H., Esat, T.M., McCulloch, M.T., Lambeck, K., 1995, High-precision U-series datingof corals from Western Australia and implications for the timing and duration of the LastInterglacial: Earth and Planetary Science Letters 135, 115-130.
Coral reef and stromatolite development in Shark Bay during Recent and Marine Isotope Stage 5e sea level high-stands
M.J. O’Leary – Ph.D. Thesis
C-24
Stirling, C.H., 1996. High-precision U-series dating of corals from Western Australia:implications for Last Interglacial sea levels: Thesis (Ph.D.) – Australian NationalUniversity.
Stirling, C.H., Esat, T.M., Lambeck, K., McCulloch, M.T., 1998, Timing and duration of the LastInterglacial: evidence for a restricted interval of widespread coral reef growth, Earth andPlanetary Science Letters v. 160, p. 745-762.
Stirling, C.H., Esat, T.M., Lambeck, K., McCulloch, M.T., Blake, S.G., Lee D.C., Halliday, A.N.,2001, Orbital forcing of the marine isotope stage 9 interglacial, Science v. 291 (5502), p.290-293.
Stirling, C.H., Halliday A.N., Porcell, D., 2005, In search of live Cm-247 in the early solar system:Geochimica et Cosmochimica Acta v. 69 (4), p. 1059-1071.
Thompson, W.G., Spiegelmann M.W., Goldstein S.L., Speed R.C., 2003, An open-system modelfor U-series age determinations of fossil corals, Earth Planetary Science Letters, v. 210, p.365-38.
Walker, D.I., 1991, The effect of sea temperature on seagrasses and algae on the WesternAustralian coastline: Journal of the Royal Society of Western Australia v. 74, p. 71-77.
Walker, D.I., Woelkerling, Wm.J., 1988, Quantitative study of sediment contribution byepiphytic coralline red algae in seagrass meadows in Shark Bay, Western Australia: MarineEcology-Progress Series v. 43, p. 71-77.
Coral reef and stromatolite development in Shark Bay during Recent and Marine Isotope Stage 5e sea level high-stands
M.J. O’Leary – Ph.D. Thesis
C-25
C.10 FIGURES 1-5
Figure 1: A) Map of Australia showing location of three principal reef growing regions along the
West Australian coast including; Ningaloo Reef (Cape Range) 21˚- 23˚ S, Shark Bay (study
location), 25.5 - 26.5˚ S and the Houtman Abrolhos (island group) 28˚ S. B) Location Map of
Shark Bay. Salinity contours for in parts per thousand (ppt). Thick black lines represent areas of
extensive stromatolite growth and black stars indicate presence of living corals (modified from
Marsh 1990)
Coral reef and stromatolite development in Shark Bay during Recent and Marine Isotope Stage 5e sea level high-stands
M.J. O’Leary – Ph.D. Thesis
C-26
Figure 2: A) Baba Head, B) Tetrodon Loop, C) Monkey Mia, D) Gladstone North E) Satellite
image of the 850 m long Pelican Island, F) Photo of sample SHP1, a living stromatolite from
Nilemah, Hamlin Pool, impregnated with resin before sectioning, coral is approximately 15 cm
wide, G) Zuytdorp sea cliffs looking north H) stromatolite community at Goat Point. H) Coral
community at Broadhurst Bay.
Coral reef and stromatolite development in Shark Bay during Recent and Marine Isotope Stage 5e sea level high-stands
M.J. O’Leary – Ph.D. Thesis
C-27
Figure 3: A) U-series coral ages for Shark Bay. The additional coral ages for Shark Bay (in grey)
were excerpted from Stirling et al. (1995) figure 4a. B) Initial 234U values verses 230Th age, reliable
U-series ages should fall within the 146.6 ± 10‰ initial δ234U range, acceptable for reliable U-
series age measurements.
Coral reef and stromatolite development in Shark Bay during Recent and Marine Isotope Stage 5e sea level high-stands
M.J. O’Leary – Ph.D. Thesis
C-28
Figure 4: A) Present Shark Bay shoreline, lighter areas represent shallow bank or sill structures.
B) A representation of Shark Bay shoreline during early MIS 5e. The position of the MIS 5e
shoreline is based on the location of MIS 5e marine outcrops and current low-lying areas below
+2 m MSL, basin depth is unknown.
Coral reef and stromatolite development in Shark Bay during Recent and Marine Isotope Stage 5e sea level high-stands
M.J. O’Leary – Ph.D. Thesis
C-29
Figure 5: Sea level curves for Shark Bay and respective timing of both coral and stromatolite
development. MIS 5e curve was excerpted from Hearty et al. (in review) and the Holocene sea
level curve was excerpted from Collins et al. (2006) figure 5.
Coral reef and stromatolite development in Shark Bay during Recent and Marine Isotope Stage 5e sea level high-stands
M.J. O’Leary – Ph.D. Thesis
C-30
Table 1: Stratigraphic nomenclature for Shark Bay.
Period/Epoch Teichert 1950 Playford 1990 Logan et al., 1970 MISHolocene Holocene-Recent MIS 1
Last Glacial Cycle Nilmah SandsDepuch Formation MIS 2-4
Upper Pleistocene Bibra formationMarine deposits MIS 5a-5e
Middle Pleistocene Dampier formationCarbla oolite MIS 11
Lower Pleistocene Tamala Eolianite
Tamala Limestone
Peron SandstoneMIS 11 > 37
Upper Pliocene
CoastalLimestone
Trealla Calcarenite
Coral reef and stromatolite development in Shark Bay during Recent and Marine Isotope Stage 5e sea level high-stands
M.J. O’Leary – Ph.D. Thesis
C-31
Table 2: U-series data
Sample1 U 230Th 232Th δ 234U 230Th/ error [230Th/ Age Age Initial δ 234U Locationppm2 ppt3 ppb4 234U5 error 238U6 232Th] (ka)7 error δ 234U8 error
Notes to Table 2.1 Uranium concentrations are measured in parts per million (ppm).2 230Th concentrations measured in parts per trillion (ppt).3 232Th concentrations measured in parts per billion (ppb).4 δ234U = {[(234U/238U)/(234U/238U)eq]-1} x 103. (234U/238U)eq is the atomic ratio at secular equilibrium and is equal
to λ238/λ234 = 5.4891 x 10⁻⁵, , where λ238 and λ234 are the decay constants for 238U and 234U, respectively, adopting
half-lives of Cheng et al., (1998)5 [
230Th/
238U]act = (
230Th/
238U)/(λ238/λ230).
6 U-series ages are calculated iteratively using:
1- [230Th/238U]act = exp-λ230
T – (δ234U(0)/1000)(λ230/(λ230-λ234))(1-exp(λ234-λ
230T) where T is the age in years and λ230
is the decay constant for 230Th. λ238= 1.551 x 10⁻¹⁰
ages will have 234Uinitial 146.6 ± 5‰7 The initial value is given by δ234Ui = δ234U(0)exp(λ234
T), where T is the age in years.
Uranium-series dating of crustose coralline algae (Corallinaceae) D-1
SECTION D
Uranium-series dating of crustose coralline algae
(Corallinaceae)
Uranium-series dating of crustose coralline algae (Corallinaceae) D-2
D.1 ABSTRACT
To investigate the geochemical evolution of CCA, 24 samples were analysed from
a suite of coral reefs encompassing modern to marine isotope stage (MIS) 11
interglacials. Age control was provided by 21 U-series coral ages collected from the same
fossil reefs.We find that living CCA record a δ234U value of 147.02 ± 1.5‰, which is
consistent with modern seawater values. Therefore it is possible to examine the isotope
systematics of uranium and thorium over geological timescales and assess their potential
utility for U-series dating. CCA underwent a three-fold increase in uranium concentration
from 0.2 ± 0.07 ppm in living samples to 0.72 ± 0.15 ppm in MIS 5e samples. This
additional uranium increases the 234U/238U atomic ratio, and reduces the 230Th/238U
atomic ratio, resulting in higher initial δ234U ratios, and younger overall ages when
compared to similar age corals. Additionally, a several order-of-magnitude increase in
detrital 232Th in fossil CCA suggests that 230Thnr (non-radiogenic) may also be
incorporated along with uranium. Due to the low initial concentrations of uranium in
living CCA even a small addition of 230Thnr can result in large age errors. Uptake of 234U-
enriched uranium is responsible for the majority of observed age errors in CCA, and
preludes it from accurate U-series dating. Although the source of excess 234U has yet to
be accurately determined, diagenetically altered Middle Pleistocene corals, were found to
be depleted in 234U and may contribute excess 234U to the system.
Uranium-series dating of crustose coralline algae (Corallinaceae) D-3
D.2 INTRODUCTION
A reliable chronology, combined with accurate geological interpretation, is vital
to both understand and reconstruct paleoclimate events. The 238U-234U-230Th decay series
(U-series) is the principal method for absolute dating of carbonate material beyond the
range of 14C (>50 ka) and up to 500 ka. The U-series dating method has been applied to
corals due to their relatively high uranium concentrations, negligible initial thorium
concentrations, and the incorporation of isotopic ratios in equilibrium with the seawater
in which they grew. Coral ages are calculated from the radioactive decay and in-growth
relationships among 238U, 234U and 230Th. Assuming that the coral has remained closed to
chemical exchange, it is possible to produce reliable and accurate absolute ages.
However, fossil corals >20 ka are susceptible to calcite diagenesis or secondary aragonite
precipitation, and it is now accepted that corals do not always operate as a closed system
(Bard et al., 1991; Hamilin et al., 1991; Thompson et al., 2003). Coral is additionally
disadvantaged due to its geographic restriction to shallow-water, pan-tropical regions,
and a growth interval limited to relatively short and warm interglacial periods. Also,
lowstand subaerial exposure of the corals will cause significant diagenetic alteration.
In an effort to fill the temporal and spatial limitations, several attempts have been
made to date other carbonate materials including; deep-sea corals (Slowey et al., 1996),
slope sediments (Henderson et al., 2001), mollusks (Kaufman, 1971 and Kaufman et al.,
1996), and planktonic foraminifera (Henderson and O’Nions, 1995). Each of these
dating materials is subject to a particular set of limitations. Deep-sea corals and slope
sediments often contain high values of non-radiogenic 230Thnr (i.e. 230Th not generated by
in situ uranium decay), resulting from thorium adsorption from seawater or the
surrounding sediments (Edwards et al., 2003). Mollusks and planktonic foraminifera have
uranium concentrations an order of magnitude lower than corals making them more
difficult to date, they are also susceptible to post mortality uptake of uranium (Kaufman
Uranium-series dating of crustose coralline algae (Corallinaceae) D-4
et al., 1971). Until now, the potential use of crustose coralline algae (CCA) in U-series
dating had not been investigated in any detail.
CCA are potentially excellent biomarkers as they provide relatively accurate
information on paleo-sea level and paleoenvironmental change (Cabioch et al., 1999).
They are one of the dominant autotrophs in tropical and subtropical reef environments
(Payri, 1997; Payri et al., 2004) and like corals, the growth form and framework structure
of CCA are directly related to the local hydrodynamic setting in which they grew
(Gherardi and Bocense, 2001). Certain coralline associations (e.g., thick crusts of
Hyrolithon onkoides or Neogoniolithon) can provide very precise sea-level information in
shallow <5 m waters (Cabioch et al., 1999). CCA also inhabit a greater latitudinal range
compared to that of corals (Kennedy and Woodroffe 2002).
Unlike aragonitic corals, CCA precipitate a high-magnesium calcite (HMC) skeleton
(Goldsmith et al., 1955, Millman et al., 1971 and Kolesar, 1978). HMC is metastable and
more susceptible to post mortality leaching and dissolution compared to aragonite
(Bathurst, 1975). This potentially makes CCA more prone to chemical exchange and thus
less suitable for U-series dating compared to corals.
This study has three distinct goals: 1). Establish the U-series systematics for modern
CCA;2). Examine the geochemical evolution of CCA over successive interglacial periods
and3). Determine the reliability and accuracy of CCA U-series age dates.
D.3 MATERIAL AND METHODS
D.3.1 Sample collection
Samples were collected from modern and succeeding emergent interglacial reefs
across the Indo-Pacific (Fig. 1). Care was taken to collect in situ fossil samples from reef
Uranium-series dating of crustose coralline algae (Corallinaceae) D-5
crest biozones to insure that the samples grew in shallow water, high-energy
paleoenvironments and at least originate from the taxonomic family, Corallinaceae.
The Australian Institute of Marine Science (AIMS) collected living CCA from
windward reef crests of Myrmidon Reef (MYR), John Brewer Reef (JBR) and Yange Reef
(NYR), central Great Barrier Reef, in water depths < 5 metres. Sub-modern CCA,
encrusting branching coral rubble, was collected from storm ridge deposits at Point
Quobba, Western Australia and North Beach, Henderson Island.
MIS 5e corals and CCA were collected from an emergent fossil reef complex at
Cape Cuvier (LCC), Western Australia. Samples were collected stratigraphically from a 3
m high modern sea-cliff cut into a lower emergent fossil reef using a rock drill. Samples
from an upper incipient coralgal reef were collected using a cold chisel and hammer.
A coral of the genus Galaxia exposed within a shallow wave cut notch at +21 m
above sea level on “North Beach” Henderson Island, has a thick encrustation of CCA
and was drilled to sample both the coral and the CCA. This outcrop was previously
sampled by Pandolfi (1995) and dated to MIS 9 by Stirling et al. (2001).
Coral and CCA was collected from an emergent +7 to +9 m Middle Pleistocene
reef (Jurabi Terrace), exposed along the seaward flank of Cape Range, Western Australia.
CCA samples were collected from an emergent predominantly algal reef at Pilgonaman
Gorge, Cape Range. An additional six corals were drilled across a section of reef at
Tantabiddi Creek.
D.3.2 Sample preparation and analytical techniques
D.3.2.1 Mechanical cleaning
CCA >10 mm thick and showing no visual signs of detrital contamination were
selected for pre-cleaning. The encrusting CCA was easily separated from the coral
Uranium-series dating of crustose coralline algae (Corallinaceae) D-6
fragment. Using a diamond drill, the outermost surfaces of the CCA were removed and
samples were sliced into smaller fragments. Due to its low uranium concentration, a
larger bulk sample of 500 mg was required for CCA, compared to 200 mg for corals.
Samples were sonicated for several hours to remove foreign material adhering to the
surface.
D.3.2.2 Column chemistry
Samples were progressively dissolved in distilled water by step addition of 10M
HNO3; any remaining solid organic material was removed dried and weighed. The
dissolved samples were then spiked with a 50 mg ‘U-2’ 233Th/235U isotope solution and
evaporated to a minimum solution. A few drops of H2O2 were added to oxidise any
remaining organic material. Samples were redissolved in 3 ml of 2M HNO3, then
transferred to bio-spin ®Tru.spec columns for separation of uranium and thorium
isotopes. A 0.1 normal solution of HF/HCl was then passed though the columns to
collect and concentrate uranium and thorium. The solution was evaporated to dryness
then redissolved with 2 ml 2% HNO3 prior to injection.
D.3.2.3 234U/238U and 230Th/238U measurements
U-series measurements were performed using a Neptune MC-ICPMS at the
Research School of Earth Sciences, Australian National University. Measurements were
conducted using a combination of simultaneous multiple-Faraday cup and ion counter
protocols based on those previously described for TIMS (Stirling et al., 1998 and
McCulloch and Esat 2000). The main difference being that ion counting/faraday gains
where determined by reference to an external standard (SRM 960) for determination of
234U/235U ratios where 234U is measured using ion counting. For the low abundance
isotopes 230Th and 229Th (spike) these where both measured using the central ion counter,
Uranium-series dating of crustose coralline algae (Corallinaceae) D-7
but simultaneously with 235U and 238U and 232Th on faraday cups allowing corrections for
both beam instability as well as mass bias. For detailed protocols see McCulloch and
Mortimer (in prep). This multiple-Faraday approach yield higher precision in conjunction
with a significantly reduced sample size requirement, lowering age uncertainties by up to
a factor of five (Stirling et al., 2001) compared to single cup procedures.
D.4 RESULTS
Twenty-four U-series measurements of CCA from recent to MIS 11 reefs are
presented in Table 1; a further twenty-one coral dates provided additional age control.
D.4.1 Living CCA (< 10 years)
Living CCA collected from the Great Barrier Reef (Table 1) returned an average
δ234U activity ratio of 147.02 ± 1.5‰ (n=6) (Fig. 2), which is slightly higher, but within
the error for Bahamian seawater, which average 146.6 ± 2.5‰ (Robinson et al., 2004). A
living coral from the Great Barrier Reef MYR1_C returned an equivalent δ234U activity
ratio of 147.11‰. These values are consistent with CCA incorporating ambient seawater
δ234U activities.
Living CCA has an order of magnitude lower uranium concentration, averaging
0.2 ± 0.07 ppm, compared to that of living coral, (Fig. 2; Fig. 3). Sample NYR2a_A has
a lower uranium concentration of 0.042 ppm, however this sample was analysed along
with the organic fraction, potentially diluting the overall concentration. 232Th
concentrations in living CCA range between 11.4 and 115.9 ppt (parts per trillion) (Table
1). Living corals are also found to have similar detrital 232Th concentrations (Edwards et
al., 1987a; 1988; Cobb et al., 2003).
Uranium-series dating of crustose coralline algae (Corallinaceae) D-8
Living CCA returned U-series ages of 0.53 ± 0.03 ka and up to 1.83 ± 0.03 ka,
which is inconsistent with their exceptionally young age (< 10 yrs) (Fig. 4). These
elevated ages coincide with the inclusion of 230Thnr, which ranges between 0.013 and
0.065 ppt. Contrary to expectations increasing 230Th concentrations coincided with a
decrease in U-series age, while decreasing uranium concentrations correspond to an
increase in U-series age.
D.4.2 MIS 5e (116-130 ka)
CCA collected from emergent MIS 5e reefs have an average uranium
concentration of 0.72 ± 0.15 ppm, 3 times higher than their modern counterparts (Fig.
3). Highly variable 232Th concentrations ranging from 0.02 up to 66.86 ppb were also
measured (Table 1). Extremely high 232Th values were often associated with visual red
staining along micro fractures within the sample or where fine sediment was observed
following carbonate dissolution.
CCA collected from an emergent MIS 5e reef at Cape Cuvier return highly
variable U-series ages and δ234Uinitial values compared to corals from the same reef (Fig.
5e). CCA U-series age range from 81.5 ± 0.45 ka to 197.9 ± 2.4 ka, while coral age ranged
from 109 ± 0.8 to 149 ± 1.7 ka (Fig. 5d). δ234Uinitial values averaged 206 ± 43‰ for the
CCA compared to 180 ± 7‰ for the corals.
Plot of measured δ234U versus 230Th/238U activity clearly reveals that CCA and
coral did not behave as a closed system, because data points do not plot on the seawater
evolution curve (Fig. 6), which describes the development of activity ratios with an initial
value δ234U of 146.6‰ under closed system conditions. CCA open-system exchange
processes resulted in a broadly linear array of isotopic anomalies that intersect the closed
system evolution curve at around 90 ka. A linear array is generated when different parts
Uranium-series dating of crustose coralline algae (Corallinaceae) D-9
of a coral (or reef system) gained varying amounts of uranium with a fixed δ234U value at
the same time (Scholz et al., 2004). This isotopic trend is not repeated in the coral
samples (Fig. 6), and is evidence of a CCA isotopic uptake history in that is distinct from
that of coral.
Coral mortality events generally result in rapid colonization of CCA at the coral
surface (Harrington et al., 2005), consequently the age of the coral and the encrusting
CCA should be roughly coeval in age. This growth relationship allowed a direct
comparison of U-series age from a coral and its encrusting CCA. CCA exhibited an
average overall U-series age, 18.9 ± 2.1 ka (n=3) younger than the coral that they grew.
One outlier, LCCq, displayed reverse stratigraphy with an untenable CCA age, 31 ka
older than the coral in which it grew. However, in all cases, CCA have higher measured
234U/238U activity ratios compared to corals (Fig. 5e).
D.4.3 MIS 9
MIS 9 corals and CCA were collected from Henderson Island, an emergent coral
atoll in the central South Pacific. Stirling et al. (2001) dated corals from the northern coast
of the island at 292.8 ± 5.3 ka and 333.8 ± 3.9 ka, conforming to MIS 9. U-series
measurements made on a single MIS 9 coral HEN1a_C, and its surface encrusting CCA
HEN1a_A, returned ages and δ234Uinitial values of 313.8 ± 8.2 and 158.9 ± 3.85‰, and
305.9 ± 4.2 ka and 178.4 ± 2.2‰ respectively (Table 1). Both these ages fall within the
known duration of MIS 9. Again we measure a younger (8.1 ka) age and higher measured
δ234U values for CCA compared to the coral.
D.4.4 Middle Pleistocene (MIS 11?)
The age of the Jurabi terrace is yet to be reliably dated, however, its elevation and
state of diagenesis and position (landward of a MIS 5e reef) suggest a Middle Pleistocene
MIS 11 age. CCA samples were collected from an emergent predominantly algal reef at
Uranium-series dating of crustose coralline algae (Corallinaceae) D-10
Pilgromana Gorge, Cape Range. Of the two MIS 11 CCA samples, RMS1_A returned a
U-series age of 329 ± 6.5 ka with a δ234Uinitial of 561 ± 6.1‰, while RMS2_A returned an
incalculable age. A total of 6 corals were also dated from the same reef but all returned
incalculable ages (Table 1). These incalculable ages may result from advanced diagenesis,
the fact that the corals have reached a secular equilibrium age, or both. The measured age
of RMS1_A is too young to correlate with a possible Middle Pleistocene MIS 11
development, but with an extremely high δ234Uinitial of 561 ± 6.1‰, its age cannot be
considered reliable. The advanced state of diagenesis in these corals and CCA is not
conducive to reliable or accurate U-series ages.
D.4.5 U-series stratigraphy
A total of 9 CCA and 15 coral samples were collected and dated from a 3 m high
reef section at Cape Cuvier (Fig. 5) This provides a stratigraphic context with which to
compare CCA and coral age. Corals displayed approximate coeval ages of 130.5 ± 3.0 ka
(n = 10) up section despite having elevated δ234U values of 181.6 to 195.1‰. The CCA
age trend up section was more erratic compared to the corals with ages ranging from
81.5 ka to 140.0 ka. However, if we discard the 91.8 and 81.5 ka samples, which, despite
having reliable δ234Uinitial values of 145.4‰ and 141.1‰ are much younger than the
known duration of MIS 5e, the remaining samples do display some stratigraphic integrity.
CCA show an increase in 234U/238U activity and a decrease in 230Th/238U activity up
section (Fig. 5b,c). This is manifest as an age decrease of 125 ka to 110 ka up section,
but does not correspond to the U-series age model defined by the corals.
Uranium-series dating of crustose coralline algae (Corallinaceae) D-11
D.5 DISCUSSION
D.5.1 Geochemical evolution of CCA
D.5.1.1 Initial chemistries
The δ234Uinitial isotope ratio is used to screen carbonates and test whether diagenesis
has occurred since formation (Edwards et al., 1987b). This approach requires that marine
carbonates incorporate the same δ234U value as seawater, and that seawater has a known
δ234U history. The latter issue has been discussed in the literature and 234U has not
changed significantly over the last few hundred thousand years (Gallup et al., 1994;
Henderson, 2002). This study shows that living CCA record a δ234U value of 147.02 ± 1.5
‰, which is slightly higher but within error of modern Bahamian seawater values of
146.6 ± 2.5 ‰. Robinson et al. (2004) analysed two living Bahamian red algal samples
and found they also capture slightly higher seawater value of approximately 148.0‰.
Because living CCA incorporate modern seawater 234U/238U activities the examination of
uranium and thorium evolution over geological timescales and an assessment of their
utility in U-series dating is possible.
D.5.1.2 Uranium uptake and loss
Results from this study demonstrate that CCA experience post mortality uranium
uptake (Fig 3); living CCA have uranium concentrations of 0.2 ± 0.07 ppm, while those
from MIS 5e show a three fold increase with concentrations averaging 0.72 ± 0.15 ppm.
Knowledge of the timing of any uranium migration is important. If uranium uptake
occurs soon after death then reliable U-series age determinations are possible, whereas if
late uptake occurs, it effectively dilutes the 238U/230Th atomic ratio giving younger
apparent ages and higher δ234Uinitial ratios (Thompson et al., 2003). In this study, whether
this uptake is early, late, linear, or specific to particular environmental conditions remains
Uranium-series dating of crustose coralline algae (Corallinaceae) D-12
uncertain. The principal cause of uranium uptake may be post mortality decay of the
organic matrix within the CCA, creating microporosity, which in turn provides a pathway
for fluid movement. These micropores potentially allow for the transport and
redistribution of thorium or uranium isotopes within CCA and provide nucleation sites
for secondary mineral precipitation.
The oldest dated CCA in this study, RMS1_A and RMS2_A, from the
Middle Pleistocene Jurabi Terrace, Cape Range, returned an average uranium
concentration 0.3 ppm lower than those observed in MIS 5e CCA. Middle Pleistocene
corals from the Jurabi Terrace also exhibit a uranium loss of at least 1 ppm compared to
modern corals. Both coral and CCA from the Jurabi Terrace show evidence to suggest
advanced calcite alteration, including loss of microstructural definition and crystal
cleavage. With a net gain of uranium in MIS 5e reef systems and with highly altered
Middle Pleistocene showing a net loss, it appears that these older reef systems may be a
source of excess uranium observed in MIS 5e reef systems.
D.5.2 Reliability and accuracy of CCA U-series ages
The accuracy of U/Th dating depends on carbonates incorporating seawater
234U/238U activities and subsequently being closed to uranium and thorium gain or loss
(Broecker, 1963). The standard quantitative approach of testing whether carbonates have
acted as an open or closed system is to compare their back-calculated δ234Uinitial with
modern seawater δ234Uinitial. If the two values do not correspond then the sample is likely
to have undergone some chemical exchange. Several empirical approaches such as
petrologic and XRD evidence of diagenetic alteration, changes in uranium concentrations
or addition of detrital 232Th also confirm open system behavior within carbonates. A
combination of these criteria was used to test for open system behavior in CCA.
Uranium-series dating of crustose coralline algae (Corallinaceae) D-13
D.5.2.1 Living CCA and U-series age anomalies
In general the incorporation of 230Thnr will increase the age of very young
carbonates samples because radiogenic 230Th ingrowth is an isotopically minor
component. This age error can be corrected by measuring the 232Th concentration against
an initial 232Th/230Th background activity (Cobb et al., 2003). However, in living CCA,
where uranium concentrations are an order of magnitude lower than corals, this age error
is amplified. The incorporation of 230Thnr into living CCA results in elevated measured
ages of between 0.59 and 1.83 ka, this error is much greater than that observed in corals
(see Cobb et al. 2003 for a comparison).
It is expected that higher concentrations of 230Thnr should lead to older measured
ages, but for living CCA the opposite it true. It appears that the youngest ages
correspond with the highest uranium concentrations. The concentration of uranium is a
major controlling factor in age determination of very young CCA (Fig. 4). When
uranium concentrations are low (> 0.2 ppm) as they are in living CCA, even a small (>
0.1 ppm) gain or loss of uranium can effectively half or double the concentration. This
will have a dramatic effect on the 230Th/238U atomic ratio and the overall age
measurement. This demonstrates the inherent difficulties in determining age for very
young carbonate material, particularly where uranium concentrations are below 0.5 ppm
D.5.2.2 Affect of uranium and thorium uptake on a MIS 5e reef system
The addition of 234U-enriched uranium will increase 234U/238U activity and
decrease 230Th/238U activity, resulting in younger apparent U-series ages and elevated
δ234Uinitial values. This isotopic trend is observed in CCA collected from a MIS 5e reef,
which undergoes a three-fold increase in uranium concentration compared to modern
counterparts. Uranium enrichment results in measured δ234Uinitial, being significantly
higher than that of corals of 206 ± 43‰ compared to 180 ± 7‰, and more variable but
Uranium-series dating of crustose coralline algae (Corallinaceae) D-14
generally younger U-series ages of 113.8 ± 17 ka compared to 131.5 ± 8 for corals. (Fig.
5c,d).
Despite the apparent variability in age and δ234Uinitial, when 234U/238U and
230Th/238U activities are plotted on an activity ratio diagram, a linear array of isotopic
anomalies appears to intersect the closed-system seawater evolution curve at around 90
ka (Fig 6). This linear array suggests that CCA may have gained different amounts of
uranium with a fixed δ234U value at around the same time (Scholz et al., 2004). Those
CCA that do not lie on the linear array may have been subjected to late uranium uptake
or 234U/238U of different activities.
Corals from the same section of reef are likely to have been subject to the same
groundwater chemistry and hydrology yet they did not display a similar linear array to
CCA. This suggests that isotopic exchange processes that operate on CCA differ to those
of corals. Simply put, CCA absorbs a higher proportion or uranium into their total
fraction compared to corals, resulting in higher measured δ234U values and younger ages.
This was further illustrated when coeval coral/CCA couplets were analysed; CCA that
grew on the surface of corals have younger average U-series of 18.9 ± 2.1 ka (Fig. 5) and
had 20 to 30‰ higher δ234U values.
D.5.2.3 Age reliability beyond the last interglacial
A single CCA sample (HEN1_A), collected from a known MIS 9 emergent reef
(Stirling et al., 2001), returned U-series age of 305.9 ± 4.2 ka. Thus despite the
geochemical anomalies associated with dating CCA, as a sample material it was
successfully able to identify the reef as belonging to MIS 9. The coral in which the CCA
was encrusting returned an older U-series age of 313.8 ± 8.2 ka, again illustrating how
uranium uptake can lead to younger apparent ages. A uranium concentration of 0.81
ppm is similar to levels recorded in MIS 5e CCA. This suggests that peak uranium
Uranium-series dating of crustose coralline algae (Corallinaceae) D-15
concentration may be reached by MIS 5e (Fig. 3) after which concentrations remain
fairly stable. As datable material CCA, despite the geochemical anomolies can at least
identify the MIS in which they grew.
D.5.2.4 Advanced calcite alteration, uranium loss, and U-series age reliability
It is known that the magnitude of isotopic anomalies recorded in aragonitic
corals increase systematically with age to at least 550 ka (Bard et al., 1991), but because
CCA is composed of more unstable HMC, they are even less likely to maintain their
chemical integrity over longer timescales. Advanced calcite alteration in Middle
Pleistocene age CCA has resulted in the loss of uranium (Fig. 3). Uranium loss has the
potential to alter uranium and thorium isotopic ratios and lead to inaccurate U-series age
calculations. Whereas the uptake of uranium has results in younger ages by decreasing
230Th/238U activity ratio, the loss of uranium should increase the 230Th/238U activity ratio
thereby return older ages. This is true for RMS2_A; with a 230Th/238U activity of 1.259
the sample returned an infinite (equilibrium) age. RMS1_A also had a near secular
230Th/238U activity, but returned a measured age of 329 ± 6.5 ka. This anomalously young
age is due largely to 234U enrichment, which resulted in an extremely high 234U/238U
activity of 1.231 and an extremely high δ234Uinitial of 561 ± 9.9‰. The shift from HMC to
low magnesium calcite and the subsequent loss of uranium makes it very difficult to
obtain reliable U-series age data in older Middle Pleistocene age CCA.
D.5.2.5 Stratigraphic integrity of CCA U-series ages
A three metre high, stacked sequence of in situ reef framework provide a
stratigraphic context for evaluating coral and CCA U-series age relationships (Fig. 5).
Behaving as isotopically closed systems U-series coral and CCA age should decrease up-
section. However, δ234Uinital values of coral and CCA are incompatible with closed-system
Uranium-series dating of crustose coralline algae (Corallinaceae) D-16
decay from modern seawater, thus, all measured ages are considered unreliable (Fig. 5e).
Despite this, measured 230Th/238U and 234U/238U activities for both coral and CCA do
show the expected isotopic trends for decreasing age up section (Fig. 5b,c). The
problem is that despite coral and CCA showing stratigraphic age conformity, they do not
show age equivalence between each other (Fig.5d). This suggests that isotopic exchange
systematics within coral and CCA is not the same.
D.6 CONCLUSIONS
1) Like corals, this study shows that living CCA inherit a δ234U value of 147.02 ±
1.5‰, well within the range of modern seawater. The fact that living CCA
captures modern seawater 234U/238U isotopic ratios prompts the examination of
uranium and thorium evolution over geological timescales and an assessment of
their potential use in U-series dating.
2) Living CCA has uranium concentrations of 0.2 ± 0.07 ppm, similar to mollusks
and planktonic foraminifera, but an order of magnitude lower than corals. A
threefold post mortality increase in uranium peaks at 0.72 ± 0.15 ppm in MIS 5e
samples. A several order of magnitude 232Th increase in fossil CCA suggests
addition of 230Thnr may accompany uranium enrichment. Uranium loss occurs
with advanced carbonate diagenesis. This can advance secular equilibrium ages as
well as introduce 234U-enriched uranium into a mobile phase.
3) Back-calculated CCA 234Uinitial is higher than modern seawater values. This limits
the ability of CCA to provide accurate U-series ages. The geochemical anomalies
observed are greater than those observed in corals and are directly related to the
degree of uranium enrichment. Young CCA has sufficiently low uranium
Uranium-series dating of crustose coralline algae (Corallinaceae) D-17
concentrations that even minor inclusion of 230Thnr can result in older apparent
ages. In contrast, MIS 5e and MIS 9 CCA undergo 234U-enrichment, increasing
234U/238U activities. This enrichment results in higher δ234Uinitial values, lowering
238Th/238U activities and decreasing the overall calculated ages in a systematic
manner.
Uranium-series dating of crustose coralline algae (Corallinaceae) D-18
D.7 REFERENCES
Andersen, M.B., Stirling, C.H., Potter, E.K., Halliday, A.N., 2004. Toward epsilon levelsof measurement precision on U-234/U-238 by using MC-ICPMS, InternationalJournal of Mass Spectrometry 237 (2-3), 107-118.
Bard, E., Fairbanks, R.G., Hamelin, B., Zindler, A., Huang, C.T., 1991. Uranium-234anomalies in corals older than 150,000 years. Geochimica et Cosmochimica Acta55, 2385–2390.
Bathurst, R.G.C., 1971. Carbonate sediments and their diagenesis: Developments inSedimentology: Amsterdam, Elsevier, v. 12, 620 p.
Bosence ,D.W.J., 1983. Coralline algal reef frameworks. Journal of the Geological Societyof London 140, 365-367.
Broecker, W.S., 1963. A preliminary evaluation of uranium series inequilibrium as a toolfor absolute age measurement on marine carbonates. Journal of GeophysicalResearch 68, 2817-2834.
Cabioch, G., Montaggioni, L.F., Faure, G., Ribaud-Laurenti A., 1999. Reef coralgalassemblages as recorders of paleobathymetry and sea level changes in theIndo–Pacific province. Quaternary Science Reviews 18, 1681–1695
Cobb, M.M., Charles, D.D., Cheng, H., Kastner, M., Edwards, R.L., 2003. U/Th-datingliving and young corals from the central tropical Pacific. Earth and PlanetaryScience Letters 210, 91-103.
Edwards, R.L., Chen, J.H., Wasserburg, G.J., 1987a. 238U, 234U, 230Th, 232Th systematicsand the precise measurement of time over the past 500,000 years. Earth andPlanetary Science Letters 81, 175-192.
Edwards, R.L., Chen, J.H., Ku, T.L., Wasserburg, G.J., 1987b. Precise timing of the lastinterglacial period from mass spectrometric determination of 230Th in corals.Science 236, 1547-1553.
Edwards, R.L., Taylor, F.W., Wasserburg, G.J., 1988. Dating earthquakes with high-precision 230Th ages of very young corals. Earth and Planetary Science Letters 90,371-381.
Edwards, R.L., Cutler, K.B., Cheng, H., Gallup, C.D., 2003. Geochemical evidence forQuaternary sea-level change. in H., Elderfield: The Oceans and MarineGeochemistry Treatise on Geochemistry, Elviser 6 (13), 343-364.
Gallup, C.D., Edwards, R.L., Johnson, R.G., 1994. The Timing of High Sea Levels overthe Past 200,000 Years, Science 263, 796-800.
Gherardi, D.F.M., Bosence, D.W.J., 2001. Composition and community structure of thecoralline algal reefs from Atol das Rocas, South Atlantic, Brazil. Coral Reefs19,205-19.
Uranium-series dating of crustose coralline algae (Corallinaceae) D-19
Goldsmith, J.R., 1955. The occurrence of magnesian calcites in Nature. Geochemica etCosmochemica Acta 7, 212
Hamelin, B., Bard, E., Zindler, A., Fairbanks, R.G., 1991. 234U/238U mass spectrometry ofcorals: How accurate is the U-Th age of the last interglacial period? Earth andPlanetary Science Letters 106, 169-180.
Harrington L., Fabricius K., Eaglesham G., Negri A., 2005. Synergistic effects of diuronand sedimentation on photosynthesis and survival of crustose coralline algae.Marine Pollution Bulletin 51 (1-4): 415-427
Henderson, G.M., Slowey, N.C., Fleisher, M.Q., 2001. U-Th dating of carbonateplatform and slope sediments. Geochemica et Cosmochemica Acta 65, 2757-2770.
Henderson, G.M., O’Nions R.,K., 1995. U-234/U-238 ratios in Quaternary planktonicforaminifera. Geochemica et Cosmochemica Acta 59 (22), 4685-4694.
Henderson, G.M., 2002. Seawater (234U/238U) during the last 800 thousand years.Earth and Planetary Science Letters 199, 97–11
Kaufman, A., Broecker, W.S., Ku, T.-L., Thurber D.L., 1971. The status of U-seriesmethods of mollusc dating. Geochimica et Cosmochimica Acta 35 (11), 1155-1183.
Kaufman, A., Ghaleb, B., Wehmiller, J.F., Hillaire-Marcel, C., 1996. Uraniumconcentration and isotope ratio profiles within Mercenariu shells: Geochronologicalimplications. Geochimica et Cosmochimica Acta 60 (19), 3735-3746.
Kaufman, A., Ghaleb, B., Wehmiller, J.F., Hillaire-Marcel, C., 1996. Uraniumconcentration and isotope ratio profiles within Mercenariu shells: Geochronologicalimplications. Geochimica et Cosmochimica Acta 60 (19), 3735-3746.
Kennedy, D.M., Woodroffe, C.D., 2002. Carbonate sediments of Elizabeth andMiddleton Reefs close to the southern limits of reef growth in the southwestPacific. Australian Journal of Earth Sciences 51, 847–857.
Kolesar, P.T., 1978. Magnesium in Calcite from a coralline algae. Journal of SedimentaryPetrology 48 (3), 815-819.
McCulloch, M.T., Esat T., 2000. The coral record of last interglacial sea levels and seasurface temperatures. Chemical Geology v. 169, p. 107-129.
Milliman, J.D., 1971. Utilization of magnesium in coralline algae. Geological Society ofAmerica Bulletin 82, 573.
Morse, J.W., 2004. Formation and diagenesis of carbonate sediments. In F.T. Mackenzie,ed., Sediments, Diagenesis, and Sedimentary Rocks: Treatise on Geochemistry,Elsevier, v. 7, 67-85. 768.
Pandolfi J.M., 1995. Geomorphology of the uplifted Pleistocene atoll at HendersonIsland, Pitcairn Group. Biological Journal of the Linnean Society 56, 63-77.
Uranium-series dating of crustose coralline algae (Corallinaceae) D-20
Payri, C.E, Cabioch, G., 2004. The systematics and significance of coralline red algae inthe rhodolith sequence of the Amedee 4 drill core (Southwest New Caledonia).Palaeogeography Palaeoclimatology Palaeoecology 204, 187–208.
Payri, C.E., 1997. Hydrolithon reinboldii rhodolith distribution, growth and carbonproduction of a French polynesian reef. Proceedings of the 8th Internaitonal CoralReef Symposium. 1:755–60.
Potter, E.K., Stirling, C.H., Andersen, M.B., Halliday, A.N., 2005. High precision Faradaycollector MC-ICPMS thorium isotope ratio determination, International Journal ofMass Spectrometry 247 (1-3), 10-17.
Robinson, L.F., Belshaw, N. S., Henderson, G.M., 2004. U and Th concentrations andisotope ratios in modern carbonates and waters from the Bahamas. Geochimica etCosmochimica Acta 68, 1777-1789.
Scholz, D., Mangini, A., Felis, T., 2004. U-series dating of diagenetically altered fossil reefcorals. Earth and Planetary Science Letters 218 (1-2), 163-178
Slowey, N.C., Henderson, G.M., Curry, W.B., 1996. Direct U – Th dating of marinesediments from the two most recent interglacial periods. Nature 383, 242-244.
Stirling, C.H., Halliday A.N., Porcell, D., 2005. In search of live Cm-247 in the early solarsystem, Geochimica Et Cosmochimica Acta 69(4), 1059-1071.
Stirling, C.H., Esat, T.M., Lambeck, K., McCulloch, M.T., Blake, S.G., Lee, D.C.,Halliday, A.N., 2001. Orbital forcing of the marine isotope stage 9 interglacial,Science 291, 290-293.
Thompson, W.G., Spiegelmann, M.W., Goldstein, S.L., Speed, R.C., 2003. An open-system model for U-series age determinations of fossil corals. Earth and PlanetaryScience Letters 210, 36-380.
Veizer, R,J., Mackenzie, F.T., 2004. Evolution of sedimentary rocks, in F. T. Mackenzie,ed., Sediments, Diagenesis, and Sedimentary Rocks: Treatise on Geochemistry:Amsterdam, Elsevier, v. 7, p. 369-407.
Veron, J.E.N., 2000. Corals of the world. Australian Institute Marine Science, vol. 3,463 pp.+429 pp.+490 pp.
Uranium-series dating of crustose coralline algae (Corallinaceae) D-21
D.8 FIGURES 1-6
Figure 1: Map of the Indo-pacific showing sample locations; fossil reef ages have already
been previously established (see body text).
Uranium-series dating of crustose coralline algae (Corallinaceae) D-22
Figure 2: Measured δ234U activities for living and modern CCA. The black dotted line
represents modern seawater δ234U activities (Robinson et al., 2004); the shaded area
represents 2 s.e. error. Higher measured δ234U activities in living CCA corresponds to
higher concentrations or uptake of 234U enriched uranium.
Uranium-series dating of crustose coralline algae (Corallinaceae) D-23
Figure 3: Uranium concentrations versus age for all CCA. There is an initial uptake of
uranium in CCA with is then leached out of older samples.
Uranium-series dating of crustose coralline algae (Corallinaceae) D-24
Figure 4: U and 230Th concentrations in living (actual age <10 yearsß) CCA versus
measured age. The lower the U concentration the higher the age error encountered.
Uranium-series dating of crustose coralline algae (Corallinaceae) D-25
Figure 5: Isotopic ratios and age for CCA (black triangle) and coral (grey circle) collected
down a 3 m measured section at Cape Cuvier. 5a – 232Th concentrations in parts per
billion. 5b – 234U/238U isotopic ratios. 5c – 230Th/238U isotopic ratios. 5d – U-series age in
thousands of years (ka). 5e - δ234Uinitial back calculated for CCA and coral, closed system
evolution should plot within the shaded area.
Uranium-series dating of crustose coralline algae (Corallinaceae) D-26
Figure 6 Compilation of the U-series data for CCA (grey) and corals (open circles) on a234U/238U activity ratio diagram. The solid black line represents closed system evolution
with and initial modern seawater 234U/230U activity of 1.1466. The dashed line indicates a
linear compositional array representative of those observed for CCA.
Uranium-series dating of crustose coralline algae (Corallinaceae) D-27
Table 1: U-series
Sample U 230Th 232Th 234U/ Error δ Error 230Th/ Error 230Th/ Age Age Initial δ234UCode ppm1 ppt2 ppb3 238U4 234U 238U5 232Th (yrs)6 Error δ234U7 Error
Uranium-series dating of crustose coralline algae (Corallinaceae) D-28
Notes to Table 1.1 Uranium concentrations are measured in part per million (ppm) equivalent to ng/g.
2 230Th concentrations measured in parts per trillion (ppt) equivalent to fg/g3 232Th concentrations measured in parts per billion (ppb) equivalent to pg/g
4 δ234U = {[(234U/238U)/(234U/238U)eq]-1} x 103. (234U/238U)eq is the atomic ratio at secular
equilibrium and is equal to λ238/λ234 = 5.4891 x 10⁻⁵, , where λ238 and λ234 are the decay constants for
238U and 234U, respectively, adopting half-lives of Cheng et al., (1998)
5 [230Th/238U]act = (230Th/238U)/(λ238/λ230).
6 U-series ages are calculated iteratively using
1 -
230Th
238U act = e
-l230T -
d
234U(0)
1000
l230
l230-l234 ( )1 - e
(l234 - l230)T
where T is the age in years and λ230 is the decay constant for 230Th. λ238 = 1.551 x 10⁻¹⁰ y-1; λ234 =
2.826 x 10⁻⁶ y-1; λ230 = 9.158 x 10⁻⁶ y-1. Ages in bold type are strictly reliable
7 The initial value is given by δ234Ui = δ234Uel234T
, where T is the age in years.
Conclusions - 1 -
M.J. O’Leary – Ph.D. Thesis
SECTION E
CONCLUSIONS
The aim of this thesis was to improve our understanding of abrupt sea level
change during MIS 5e though detailed stratigraphic and geomorphic mapping of
emergent marine deposits and advanced high-precision U-series dating techniques. This
involved a regional survey of West Australian Pleistocene fossil reef sites, some of which
were logged and sampled, in best cases along reef growth axes. U-series dating was
conducted on 101 coral and 25 CCA samples utilizing MC ICPMS techniques.
The improvement in analytical precision has shown corals to be more susceptible
to chemical and isotopic exchange than previously thought. Therefore prior to any
geochronological interpretations all uncorrected and open-system corrected coral ages
were subject to a rigorous geochemical screening procedures and independent age tests,
including stratigraphic superposition and multiple dates from single coral colonies. Two
areas, Cape Cuvier and Shark Bay provided the largest amount of stratigraphic and
geochronological data for interpreting nature of sea level during MIS 5e as well as
provide a geologic case study for assessing the reliability of U-series age dates. This study
also afforded the opportunity to test the potential benefits of crustal coralline algae in U-
series dating.
While geomorphological investigations of emergent marine deposits along the
West Australian coast reveal evidence supporting unstable MIS 5e sea levels,
geochronological data was not able to offer corroborating evidence. This is solely due to
the inability to obtain reliable U-series age data, resulting from open-system exchange
processes. The application of independent age controls to both uncorrected and
corrected U-series coral ages: 1) reveal the false credence given to analytical precision
where multiple ages from a single coral often exceed analytical error; and 2) call into
question the validity of open-system corrections which fail to agree with any of the age
tests.
While this multi-method approach was originally applied to improve our
understanding of high frequency sea level oscillations the ability to identify measured U-
series that come closest to representing the corals true age, this study reveals just how
unreliable U-series dating of corals can be. It also revealed how open-system ‘systematics’
does not operate in a systematic way and questions the utility of open-system corrections.
REFERENCES
Andersen, M.B., Stirling, C.H., Potter, E.K., Halliday, A.N., 2004. Toward epsilon levelsof measurement precision on 234U/238U by using MC-ICPMS. International Journalof Mass Spectrometry 237 (2-3), 107-118.
Andersen M.B., Stirling C.H., Potter E-K., Halliday, A.N., Blake, S.G., McCulloch M.T., AylingB.F., O’Leary M.J., in review. Direct chronology of the Marine Isotope Stage 15 (~600 ka)estimated from high-precision U-series ages from Henderson Island, south Pacific.
Bard, E., Fairbanks, R.G., Hamelin, B., Zindler, A., Huong, C.T., 1991. 234U anomalies incorals older than 150,000 years. Geochimica et Cosmochimica Acta 55, 2385-2390.
Bard, E., Hamelin, B., Fairbanks, R.G., 1990. U/Th ages obtained by mass-spectrometryin corals from Barbados: sea level during the past 130,000 years. Nature 346(6283), 456-458.
Bard, E., Fairbanks, R.G., Hamelin, B., 1992. How accurate are the U/Th ages obtainedby mass spectrometry on coral terraces, in: G.J. Kukla, E. Went (Eds.), Start of aGlacial, NATO ASI Series 13, Springer, Berlin, pp. 15-21.
Bar-Matthews, M., Wasserburg, G. J., Chen, J.H., 1993. Diagenesis of fossil coralskeletons: correlation between trace-elements, textures, and 234U/238U. Geochimicaet Cosmochimica Acta 57, 257-276.
Bathurst, R.G.C., 1971. Carbonate sediments and their diagenesis: Developments inSedimentology: Amsterdam, Elsevier, v. 12, 620 p.
Bender, M.L., Fairbanks, R.G., Taylor, F.W., Matthews, R.K., Goddard, J.G., Broecker,W.S., 1979. Uranium-series dating of Pleistocene reef tracts of Barbados, WestIndies. Geological Society of America Bulletin 90, 577-594.
Bosence ,D.W.J., 1983. Coralline algal reef frameworks. Journal of the Geological Societyof London 140, 365-367.
Broecker, W.S., 1963. A preliminary evaluation of uranium series in equilibrium as a toolfor absolute age measurement on marine carbonates. Journal of GeophysicalResearch 68, 2817-2834.
Burling, M.C., Ivey, G.N., Pattiaratchi, C.B., 1999. Convectively driven exchange in ashallow coastal embayment. Continental Shelf Research 19, 1599-1616.
Cabioch, G., Montaggioni, L.F., Faure, G., Ribaud-Laurenti, A., 1999. Reef coralgalassemblages as recorders of paleobathymetry and sea level changes in the Indo-Pacific province. Quaternary Science Reviews 18, 1681-1695.
Chen, J.H., Edwards, R.L., Wasserburg, G.J., 1986. 238U, 234U and 232Th in seawater, Earthand Planetary Science Letters 80 (3-4), 241-251.
Chen, J.H., Curran, H.A., White, B., Wasserburg, G.J., 1991. Precise chronology of theLast Interglacial period: 234U230Th data from fossil coral reefs in the Bahamas.Geological Society of America Bulletin 103, 82-97.
Cheng, H., 2003. Uranium-series dating of marine and lacustrine carbonates (in Uranium-series geochemistry). Reviews in Mineralogy and Geochemistry 52, 363-405
Cherniak, D.J., 1997. An experimental study of strontium and lead diffusion in calcite,and implications for the carbonate diagenesis and metamorphism. Geochimica etCosmochimica Acta 61, 4173-4179.
Chivas A.R., Torgersen T., Polach H.A., 1990. Growth rates and Holocene developmentof stromatolites from Shark Bay, Western Australia. Australian Journal of EarthScience 37, 113-121.
Coles, S.L., Jokiel, P., 1992. Effects of salinity on coral reefs. In D. W. Connell and D.W. Hawker (eds.), Pollution in tropical aquatic systems, Chapter 6, 147-166. CRCPress, Boca Raton.
Coles, S.L., 1988. Limitations on coral reef development in the Arabian Gulf:Temperature or algal competition? Proc. 6th Int. Coral Reef Symposium, 3, 211.
Collins, L.B., Zhu, Z.R., Wyrwoll, K.H., Hatcher, B.G., Playford, P.E., Chen, J.H.,Eisenhauer, A., Wasserburg, G.J., 1993a. Late Quaternary evolution of coral reefson a cool-water carbonate margin: the Abrolhos carbonate platforms, SouthwestAustralia. Marine Geology 110, 203-212.
Collins, L.B., Zhu, Z.R., Wyrwoll, K.H., Hatcher, B.G., Playford, P.E., Eisenhauer, A.,Chen, J.H., Wasserburg, G.J., Bonani, G., 1993b. Holocene growth history of areef complex on a cool-water carbonate margin: Easter Group of the HoutmanAbrolhos, eastern Indian Ocean. Marine Geology 115, 29-46.
Collins, L.B., Zhu, Z.R., Wyrwoll, K.-H., 1996. The structure of the Easter Platform,Houtman Abrolhos Reefs: Pleistocene foundations and Holocene reef growth.Marine Geology 135, 1-13.
Collins, L.B., Zhu, Z.R., Wyrwoll, K-H., Eisenhauer, A., 2003. Late Quaternary structureand development of the northern Ningaloo Reef, Australia. Sedimentary Geology159, 81-94.
Denman, P.D., Van de Graaff, W.J.E., 1976. Emergent Quaternary marine deposits inthe Lake MacLeod area, Western Australia. Western Australia Geological SurveyAnnual Report 1977, 32-36.
Eisenhauer, A., Zhu, Z.R., Collins, L.B., Wyrwoll, K.H., Eichstatter, R., 1996. The LastInterglacial sea-level change: new evidence from the Abrolhos Islands. WestAustralia. Geol Rundsch 85, 606-614.
Edwards, R.L., Chen, J.H., Wasserburg, G.J., 1987a. 238U, 234U, 230Th, 232Th systematicsand the precise measurement of time over the past 500,000 years. Earth andPlanetary Science Letters 81, 175-192.
Edwards, R.L., Chen, J.H., Ku T.-L., Wasserburg, G.J., 1987b. Precise timing of the lastinter-glacial period from mass spectrometric analysis of 230Th in corals. Science236, 1547-1553.
Edwards, R.L., Taylor, F.W., Wasserburg, G.J., 1988. Dating earthquakes with high-precision 230Th ages of very young corals. Earth and Planetary Science Letters 90,371-381.
Edwards, R.L., Cutler, K.B., Cheng, H., Gallup, C.D., 2003. Geochemical evidence forQuaternary sea-level change. in H., Elderfield: The Oceans and MarineGeochemistry Treatise on Geochemistry, Elviser 6:13, 343-364.
Fabricius, K., De'ath G., 2001. Environmental factors associated with the spatialdistribution of crustose coralline algae on the Great Barrier Reef. Coral Reefs 19(4), 303-309
Fairbridge, R.W., 1950. The geology and geomorphology of Point Peron, WesternAustralia. Royal Society of Western Australia Journal 34, 35-72.
Fruijtier, C., Elliot, T., Schlager, W., 2000. Mass-spectrometric 234U/230Th ages from theKey Largo Formation, Florida Keys, United States: Constraints on diagenetic agedisturbance. Geological Society of America Bulletin 112, 267-277.
Gallup, C.D., Edwards, R.L., Johnson, R.G., 1994. The Timing of high sea levels overthe past 200,000 years. Science 263, 796-800.
Gallup, C. D., Cheng, H., Taylor, F. W., Edwards, R.L., 2002. Direct determination ofthe timing of sea-level change during Termination II. Science 295, 310-313.
Gherardi, D.F.M., Bosence, D.W.J., 2001. Composition and community structure of thecoralline algal reefs from Atol das Rocas, South Atlantic, Brazil. Coral Reefs19,205-19.
Goldsmith, J.R., 1955. The occurrence of magnesian calcites in Nature. Geochemica etCosmochemica Acta 7, 212
Hamelin, B., Bard, E., Zindler, A., Fairbanks, R.G., 1991. 234U/238U mass spectrometry ofcorals: How accurate is the U-Th age of the last interglacial period? Earth andPlanetary Science Letters 106, 169-181.
Harrington L., Fabricius K., Eaglesham G., Negri A., 2005. Synergistic effects of diuronand sedimentation on photosynthesis and survival of crustose coralline algae.Marine Pollution Bulletin 51 (1-4): 415-427
Hatcher, B.G., 1991. Coral reefs in the Leeuwin Current – an ecological perspective.Journal of the Royal Society of Western Australia 74, 115-127.
Hagan, G.M., Logan, B.W., 1974. Development of carbonate banks and hypersalinebasins, Shark Bay, Western Australia. American Association of PetroleumGeologists Memoir 22: 61-139.
Helfrich, P., 1973. The feasibility of brine shrimp production on Christmas Island, SeaGrant Tech. Rep. UNIHI-SEAGRANT-TR-73-02, University of Hawaii,Honolulu.
Hearty, P.J., 1987. New data on the Pleistocene of Mallorca. Quaternary Science Reviews6, 245-257.
Hearty, P.J., Neumann, A.C., 2001. Rapid sea level and climate change at the close of theLast Interglaciation (MIS 5e): evidence from The Bahama Islands. QuaternaryScience Reviews 20 (18), 1881-1895.
Henderson, G.M., O’Nions R.,K., 1995. U-234/U-238 ratios in Quaternary planktonicforaminifera. Geochemica et Cosmochemica Acta 59 (22), 4685-4694.
Henderson, G.M., Slowey, N.C., 2000. Evidence from U-Th dating against NorthernHemisphere forcing of the penultimate deglaciation. Nature 404 (6773), 61-66
Henderson, G. M., Slowey, N. C.,Fleisher, M.Q., 2001. U/Th dating of carbonateplatform and slope sediments. Geochemica et Cosmochemica Acta 65, 2757-2770.
Henderson, G.M., 2002. Seawater 234U/238U during the last 800 thousand years. Earthand Planetary Science Letters 199, 97-11.
Hocking, R.M., Moors, H.T., Van De Graff, W.J.E., 1987. Geology of the CarnarvonBasin of Western Australia. Geological Survey of Western Australia Bulletin 133.
Kaufman, A., Broecker, W.S., Ku, T.-L., Thurber D.L., 1971. The status of U-seriesmethods of mollusc dating. Geochimica et Cosmochimica Acta 35 (11), 1155-1183.
Kaufman, A., Ghaleb, B., Wehmiller, J.F., Hillaire-Marcel, C., 1996. Uraniumconcentration and isotope ratio profiles within Mercenariu shells: Geochronologicalimplications. Geochimica et Cosmochimica Acta 60 (19), 3735-3746.
Kingsman D.J.J., 1964. Reef tolerance of high temperatures and salinities. Nature 202,1280.
Kendrick, G.W., Wyrwoll, K.H., Szabo, B.J., 1991. Pliocene-Pleistocene coastal eventsand history along the western margin of Australia. Quaternary Science Reviews 10,419-439.
Kennedy, D.M., Woodroffe, C.D., 2002. Fringing reef growth and morphology: a reviewEarth-Science Reviews 57 255-277.
Kigoshi, K., 1971. Alpha-recoil thorium-234: dissolution into water and the uranium-234/ uranium-238 disequilibrium in nature. Science 173 (3991), 47-48.
Kolesar, P.T., 1978. Magnesium in Calcite from a coralline algae. Journal of SedimentaryPetrology 48 (3), 815-819.
Ku, T.-L., Ivanovich, M., Luo, S., 1990. U-series dating of Last Interglacial high seastands: Barbados revisited. Quaternary Research 33, 129-147.
Lazar, B., Enmar, R., Schossberger, M., Bar-Matthews, M., Halicz, L., Stein, M., 2004.Diagenetic effects on the distribution of uranium in live and Holocene corals fromthe Gulf of Aqaba. Geochimica et Cosmochimica Acta 68 (22), 4583-4593.
Logan, B.W., Read, J.R., Davies, G.R., 1970. History of carbonate sedimentation,Quaternary Epoch, Shark Bay, Western Australia. American Association ofPetroleum Geologists Memoir 13: 38-85.
Marsh, L.M. 1990. Hermatypic corals of Shark Bay, Western Australia. In: Berry, P.F.,Bradshaw, S.D. & Wilson, B.R. (Eds.). Research in Shark Bay. Report of theFrance-Australe Bicentenary Expedition Committee. Western Australian Museum,Perth, 107-114.
McCulloch, M.T., Esat T., 2000. The coral record of last interglacial sea levels and seasurface temperatures. Chemical Geology 169, 107-129.
Milliman, J.D., 1971. Utilization of magnesium in coralline algae. Geological Society ofAmerica Bulletin 82, 573.
Morse, J.W., 2004. Formation and diagenesis of carbonate sediments, in F. T. Mackenzie,ed., Sediments, Diagenesis, and Sedimentary Rocks: Treatise on Geochemistry,Elsevier, v. 7, 67-85. 768.
Muhs, D.R., Simmons, K.R., Steinke, B., 2002. Timing and warmth of the LastInterglacial period: new U-series evidence from Hawaii and Bermuda and a newfossil compilation for North America. Quaternary Science Reviews 21 (12-13),1355-1383.
Murray-Wallace, C. V. 2002. Pleistocene coastal stratigraphy, sea-level highstands andneotectonism of the southern Australian passive continental margin - a review.Journal of Quaternary Science17, 469 - 489.
Neumann, A.C., Hearty, P.J., 1996. Rapid sea-level changes at the close of the lastinterglacial (substage 5e) recorded in Bahamian island geology Geology 24 (9), 775-778.
O’Leary, M.J., Hearty, P.J., McCulloch, M.T., 2003. ICPMS 234U anomalies of WestAustralian fossil coral reefs. 80th Australian Coral Reef Society convention,Townsville, Queensland.
Payri, C.E, Cabioch, G., 2004. The systematics and significance of coralline red algae inthe rhodolith sequence of the Amedee 4 drill core (Southwest New Caledonia).Palaeogeography Palaeoclimatology Palaeoecology 204, 187–208.
Payri, C.E., 1997. Hydrolithon reinboldii rhodolith distribution, growth and carbonproduction of a French polynesian reef. Proceedings of the 8th Internaitonal CoralReef Symposium
Playford PE. 1988. Guidebook to the Geology of Rottnest Island. Excursion GuidebookNo. 2, Western Australia Division of the Geological Society of Australia: Perth; 67pp.
Playford, P.E., 1990. Geology of the Shark Bay area, Western Australia. In: Berry, P.F.,Bradshaw, S.D. & Wilson, B.R. (Eds.). Research in Shark Bay. Report of theFrance-Australe Bicentenary Expedition Committee. Western Australian Museum,Perth, 13-31.
Playford, P.E., 1997. Geology and hydrology of Rottnest Island, Western Australia, in:Vacher, H.L., T. Quinn, (Eds.), Geology and Hydrology of Carbonate Islands,Developments in Sedimentology 54, Elsevier, London, pp. 783–810.
Penrose, D.L., 1996a. Genus Hydrolithon. In: Womersley, H.B.S. (Ed.) The MarineBenthic Flora of Southern Australia - Part IIIB. Gracilariales, Rhodymeniales,Corallinales and Bonnemaisoniales. Canberra, Australian Biological Resources Study(effective publication date 29.vi.1996). pp.255-266.
Potter, E.K., Stirling, C.H., Andersen, M.B., Halliday, A.N., 2005. High precision Faradaycollector MC-ICPMS thorium isotope ratio determination. International Journal ofMass Spectrometry 247 (1-3), 10-17.
Reid, R.P., Visscher, P.T., Decho, A.W., Stoltz, J.F., Bebout, B.M., Dupraz, C.,Macintyre, I.G., Paerl, H.W., Pinckney, J.L., Prufert-Bebout, L., Steppe, T.F.,DesMarais D.J., 2000. The role of microbes in the accretion, lamination and earlylithification of modern stromatolites. Nature 406, 989-993.
Robinson, L.F., Belshaw, N. S., Henderson G.M., 2004. U and Th concentrations andisotope ratios in modern carbonates and waters from the Bahamas. Geochimica etCosmochimica Acta 68, 1777–1789.
Robinson, L.F., Adkins, J.F., Fernandez, D.P., Burnett, D.S., Wang, S-L., Gagnon, A.C.,Krakauer, N., 2006. Primary U-distribution in scleractinian corals and itsimplications for U-series dating. Geochemistry Geophysics Geosystems 7 (5), 1-20.
Read, J.F., 1974. Calcrete deposits and Quaternary sediments, Edel Province, Shark Bay,Western Australia. American Association of Petroleum Geologists Memoirs 22,250 - 282.
Scholz, D., Mangini, A., Felis, T., 2004. U-series dating of diagenetically altered fossil reefcorals. Earth and Planetary Science Letters 218 (1-2), 163-178.
Shen, G.T., Dunbar, R.B., 1995. Environmental Controls on Uranium in Reef Corals.Geochimica et Cosmochimica Acta 59 (10), 2009-2024.
Shepard, C.R.C., 1988. Similar trends, different causes: responses of corals to stressedenvironments in Arabian Seas. 6th Int. Coral Reef Symposium, 3, 297.
Sherman, C.E., Glenn, C.R., Jones, A.T., Burnett, W.C., Schwarcz, H.P., 1993. Newevidence for 2 highstands of the sea during the last interglacial, oxygen-isotopesubstage-5e. Geology 21 (12), 1079-1082.
Slowey, N.C., Henderson, G.M., Curry, W.B., 1996. Direct U – Th dating of marinesediments from the two most recent interglacial periods. Nature 383, 242-244.
Steneck, R.S., 1997. Crustose corallines, other algal functional groups and sediments:complex interactions along reef productivity gradients. Proc. 8th Int. Coral ReefSym. 1: 695-700.
Stirling, C.H., Esat, T.M., McCulloch, M.T., Lambeck, K., 1995. High-precision U-seriesdating of corals from Western Australia and implications for the timing andduration of the Last Interglacial. Earth and Planetary Science Letters 135, 115-130.
Stirling, C.H., Esat, T.M., Lambeck, K., McCulloch, M.T., 1998. Timing and duration ofthe Last Interglacial: evidence for a restricted interval of widespread coral reefgrowth. Earth and Planetary Science Letters 160, 745-762.
Stirling, C.H., Halliday A.N., Porcell, D., 2005. In search of live Cm-247 in the early solarsystem. Geochimica et Cosmochimica Acta 69 (4), 1059-1071.
Stirling, C.H., Esat, T.M., Lambeck, K., McCulloch, M.T., Blake, S.G., Lee D.C.,Halliday, A.N., 2001. Orbital forcing of the marine isotope stage 9 interglacial.Science 291 (5502), 290-293.
Taylor, J.G., Pearce, A.F., 1999. Ningaloo Reef Current observations and implications forbiological systems: Coral spawn dispersal, zooplankton and whale sharkabundance. Journal of the Royal Society of Western Australia 82, 57-65.
Thompson, R.O.R.Y., 1984. Observations of the Leeuwin Current off Western Australia.Journal of Phyical Oceanography 14, 623-628.
Thompson, W.G., Spiegelmann M.W., Goldstein S.L., Speed R.C., 2003. An open-systemmodel for U-series age determinations of fossil corals. Earth Planetary ScienceLetters 210, 365-38.
Trudgill, S.T., 1983. Preliminary estimates on intertidal limestone erosion, One TreeIsland, Southern Great Barrier Reef, Australia. Earth Surface Processed andLandforms 8 (2), 189-193.
Van de Graaff, W.J.E., Denman, P.D., Hocking, R.M., 1976. Emerged Pleistocenemarine terraces on Cape Range, Western Australia. Geological Survey of WesternAustralia Annual Report 1975, 62-69.
Veeh, H.H., Van de Graaff, W.J.E., Denman, P.D., 1979. Uranium-series ages ofcoralline terrace deposits in Western Australia. Journal of the Geological Society ofAustralia 26, 285-292.
Veizer, R,J., Mackenzie, F.T., 2004. Evolution of sedimentary rocks, in F. T. Mackenzie,ed., Sediments, Diagenesis, and Sedimentary Rocks: Treatise on Geochemistry:Amsterdam, Elsevier, v. 7, p. 369-407.
Villemant, B., Feuillet, N., 2003. Dating open systems by the 238U-234U-230Th method:application to Quaternary reef terraces. Earth and Planetary Science Letters 210,105-118.
Walker, D.I., Woelkerling, Wm.J., 1988. Quantitative study of sediment contribution byepiphytic coralline red algae in seagrass meadows in Shark Bay, Western Australia,Marine Ecology-Progress Series 43, 71-77.
Walker, D.I., 1985. Correlations between salinity and growth of the seagrassAmphibolis[A1] Antarctica in Shark Bay, Western Australia, using a new method formeasuring production rate. Aquatic Botany, 23, 13-26.