30
THE BRITA PRODUCTS COMPANY

THE BRITA PRODUCTS COMPANY
The Brita Products Company
Introduction
Brief of the Case
Brita’s Success Story
Highlights

Brita Products Company
Industry: Water Filtration
• 2013: $ 362.64 mn• 2014: $ 394.42 mn
Founded: 1966, 49 years old
Headquarter: Taunusstein (near Wiesbaden), Germany
Corporate structure: Owner-managed family company Limited liability company (GmbH)
Number of employees worldwide: 1,430
Sales Turnover - Worldwide
BRITA Products: Filters for private households and commercial houses
Spread: Over 60 Countries

Clorox
Industry: Consumer Household Products, Healthcare and Food
Headquarters: Oakland California, US
Products: Cleaning, Food Storage, Food, Cat litter, Charcoal, Personal Care, Healthcare and Water filtration
Number of employees: 7,700
Revenue: $5.5 Billion
Operating Income: $ 977 Million

Brief of The Case
1987 – Charlie Couric, a Marketing Executive with Clorex Company proposed that Clorex acquires the right to market Brita in USA.
Charlie Couric looked at the repeat buying of filters (derived demand) as strategy and targeted to put a pitcher on every kitchen countertop, at a loss if necessary.
Clorex supported Couric’s deficit-spending proposal.
Sep 1988 – Clorex formed a subsidIary, Brita USA, to be the sole US distributor of Brita products.
Brita’s entry attracted large number of competitors.
1999 – Brita became Clorex’s one of the biggest brands; generating close to $200 mn revenue a year.
Late 1990s Changing external dynamics challenged and impeded Brita’s dream run demanding interventions
The Product
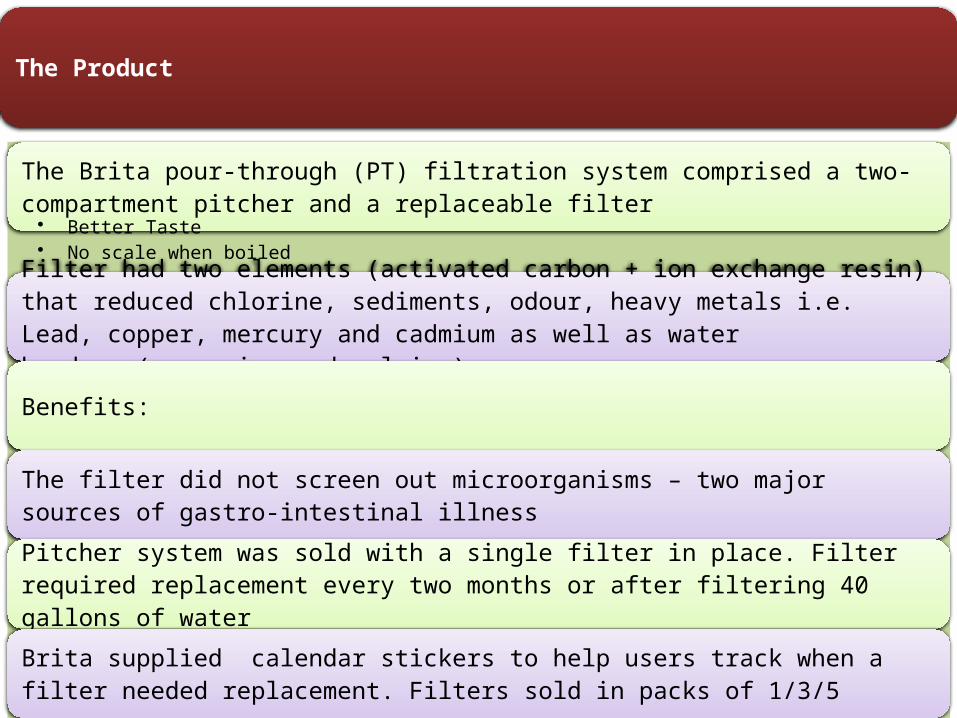
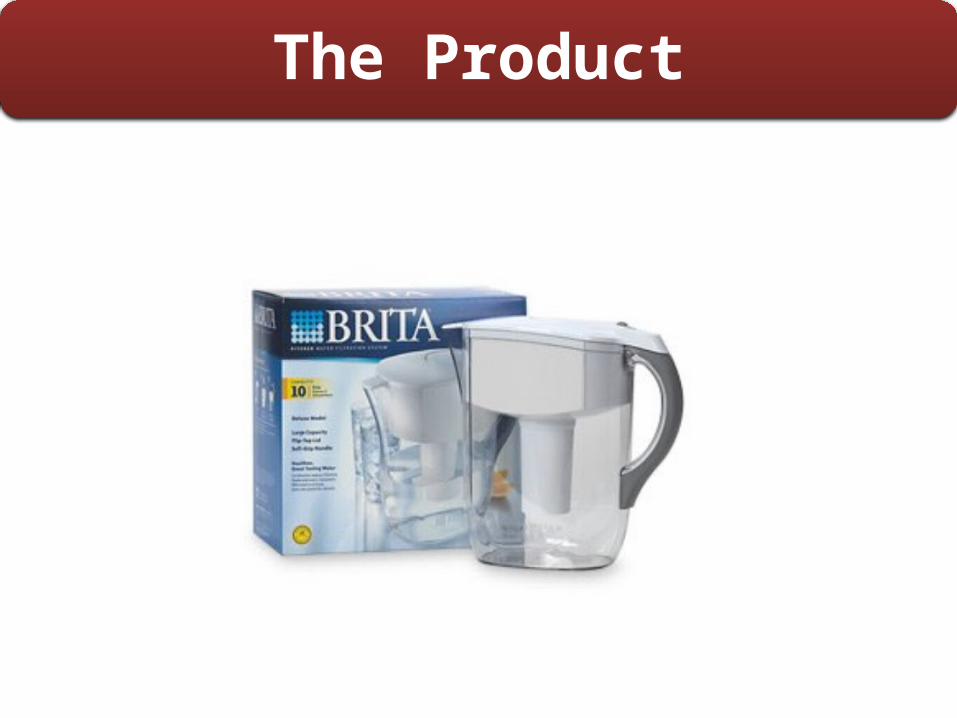
The Brita pour-through (PT) filtration system comprised a two-compartment pitcher and a replaceable filter
• Better Taste• No scale when boiled• Heavy metal free
Filter had two elements (activated carbon + ion exchange resin) that reduced chlorine, sediments, odour, heavy metals i.e. Lead, copper, mercury and cadmium as well as water hardness(magnesium and calcium)
Benefits:
The filter did not screen out microorganisms – two major sources of gastro-intestinal illness
Pitcher system was sold with a single filter in place. Filter required replacement every two months or after filtering 40 gallons of water
Brita supplied calendar stickers to help users track when a filter needed replacement. Filters sold in packs of 1/3/5
The Product

Selling a Need: Filtered Water
Determining a Price: Lower price may need to be charged in order to acquire market share
Product Quality: Brita water filters do not eliminate as many pollutants as its competitors
Product Taste: People are worried about taste as much as health
Aesthetics: Product appearance must be comparably nice to the competition
Defining A Market Focus

1988-93
• First in the market with value proposition of ‘Great Tasting Water’
• Educational ad campaigns on - ‘How to use Brita’ and ‘Tap water transformed’ sensitized markets
• Initial sluggish sales anticipated as per UK and Canada pattern
1994-98
• Derived demand matched anticipation• Customers word of mouth preference and
presentation of pitchers as gift helped sale and branding
• System and Filter revenues grew steadily in range of 65% - 75%
• ‘BOGO’ scheme doubled systems sales*
1999
• Brand awareness grew by 70%• Consumer choice limited to tap water or PT• 18% of 103mn households used Brita • 80% of customers still using it one year on• 70 competitors failed• Industry worth $350 mn (owned 70%)• National distribution (40,000 stores)
Brita’s Success – The “Blue-Water” Decade
Brita created the market for filtered water, aided by shifting consumer values towards safety, health, and great taste

• Brita USA emphasised on ‘Taste Benefit’• Taste and Health Benefits don’t go together• No other brand talked of health benefits• Desire to be at the top – any impurity removal claim could be
counter claimed • $100 mn cumulative advertising budget helped Brita find a
place in households• Brita owns ‘Waterfall Imagery’• Minimum Advertised Price policy – No retailer was
permitted to advertise a Brita line at below the set price; retailers incentivised for featuring products in their advertising display
POSITIONING AND ADVERTISING
• Brita USA exploited its existing breadth of distribution channel i.e health foods chain for introduction and establishment of variety of products
• ‘Class to Mass’ Strategy: • Up scaled pitcher ‘Ultra’ for department stores – 35%• Standard pitcher through Target, Walmart, Drug and
Grocery stores – 25% • Bonus pack system and a 5-pack filters for Club retailers
like Costco • Over 40,000 outlets in total
DISTRIBUTION
Growth Drivers
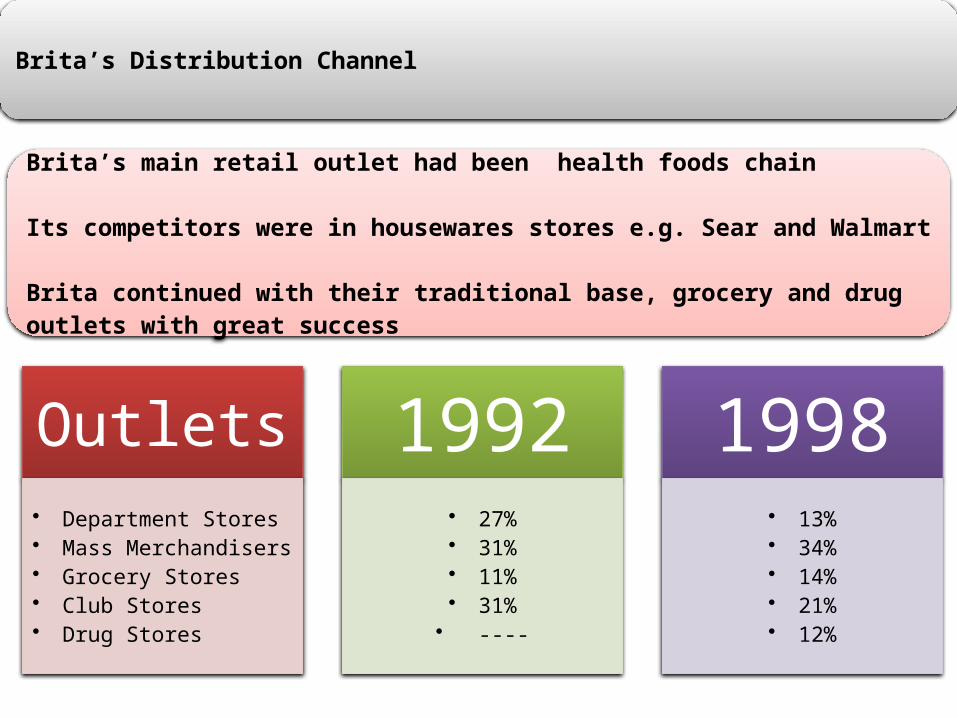
Outlets• Department Stores• Mass Merchandisers• Grocery Stores• Club Stores• Drug Stores
1992• 27%• 31%• 11%• 31%• ----
1998• 13%• 34%• 14%• 21%• 12%
Brita’s Distribution Channel
Brita’s main retail outlet had been health foods chain
Its competitors were in housewares stores e.g. Sear and Walmart
Brita continued with their traditional base, grocery and drug outlets with great success

Retail Market Shares: Systems
Type 1992 1993 1994 1995 1996 1997 1998
Pitcher(1000 of Units)
375 640 1,405 2,636 4,381 5,689 6,307
Brita 82% 82% 75% 77% 77% 80% 83%
PUR - - - - - 4% 8%
Rubbermaid - - - - - 7% 4%
All Others 18% 18% 25% 23% 23% 11% 5%
Faucet Mount(1000 of Units)
1,186 782 602 659 898 1,249 1,291
PUR - - - 9% 30% 67% 74%
Teledyne 23% 23% 30% 43% 43% 27% 23%

Retail Market Shares: Filters
Type 1992 1993 1994 1995 1996 1997 1998
Filter Sales($ Millions)
20.5 26.5 38.7 63.3 82.3 116.3 154.7
Brita 32% 43% 59% 65% 75% 75% 75%
Teledyne 25% 20% 15% 10% 9% 7% 4%
PUR 0% 0% 0% 1% 2% 8% 17%
Omni 12% 13% 8% 8% 5% 3% 2%
Sears 7% 6% 3% 2% 2% 1% 1%
Pollonex 7% 4% 2% 1% 1% 0% 1%

Brita Unit Sales
Type(in 1000)
1989 1990 1991 1992 1993 1994 1995 1996 1997 1998
Systems 171 194 202 302 546 1,056 2,030 3,363 4,565 5,266
Filters 402 581 876 1292 2,205 4,458 8,164 15,246 23,293 27,413

1989 1990 1991 1992 1993 1994 1995 1996 1997 19980
5000
10000
15000
20000
25000
30000
SystemsFilters
Sales of Brita Pitcher Systems and Filter
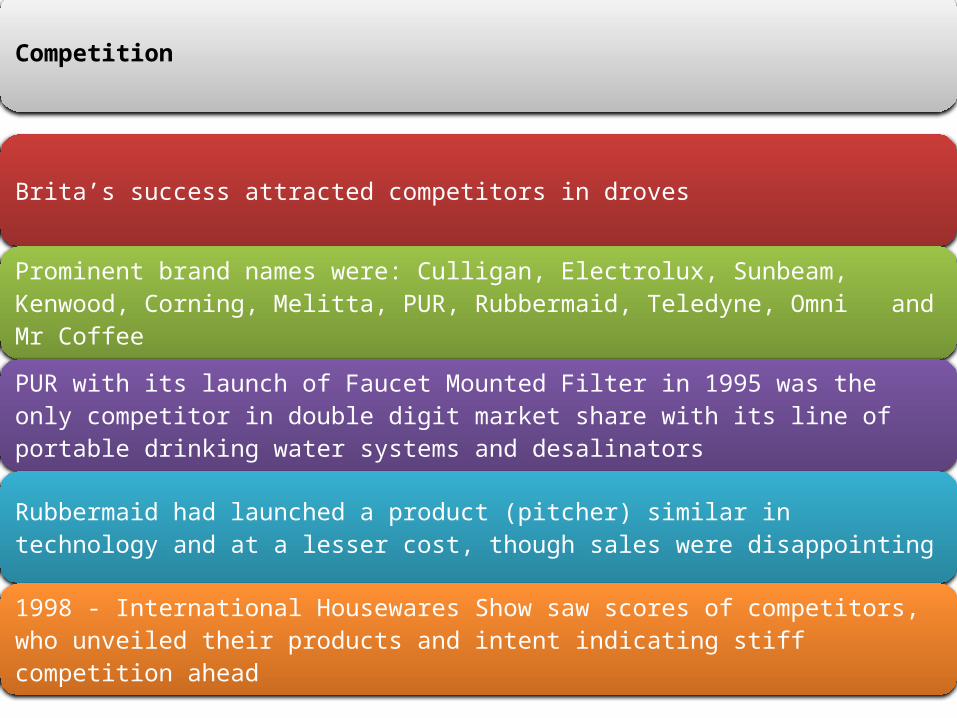
Brita’s success attracted competitors in droves
Prominent brand names were: Culligan, Electrolux, Sunbeam, Kenwood, Corning, Melitta, PUR, Rubbermaid, Teledyne, Omni and Mr Coffee
PUR with its launch of Faucet Mounted Filter in 1995 was the only competitor in double digit market share with its line of portable drinking water systems and desalinators
Rubbermaid had launched a product (pitcher) similar in technology and at a lesser cost, though sales were disappointing
1998 - International Housewares Show saw scores of competitors, who unveiled their products and intent indicating stiff competition ahead
Competition

Over the decade of 1990’s the safety of tap water became a topic of growing concern for US households
• 72% of all respondents and 89% of young adults, voiced some concern about quality of their household’s water supply• Majority of households used either bottled water or some purification system• Numbers taking no precautions declined from 47% in 1995 to 35%
By end decade survey’s found 47% of respondents preferred not to drink water straight from tap
Sales of bottled water from US super markets and home delivery services grew rapidly during the decade
By 1999:
Customer Attitude and Behaviour

1988 1989 1990 1991 1992 1993 1994 1995 19960
20
40
60
80
100
120
140
160
180
SpiritsWineCoffeeMilkTeaTotal MarketSoft DrinksBeerFruit JuiceBottled Water
Growth of Segments US Beverage Market
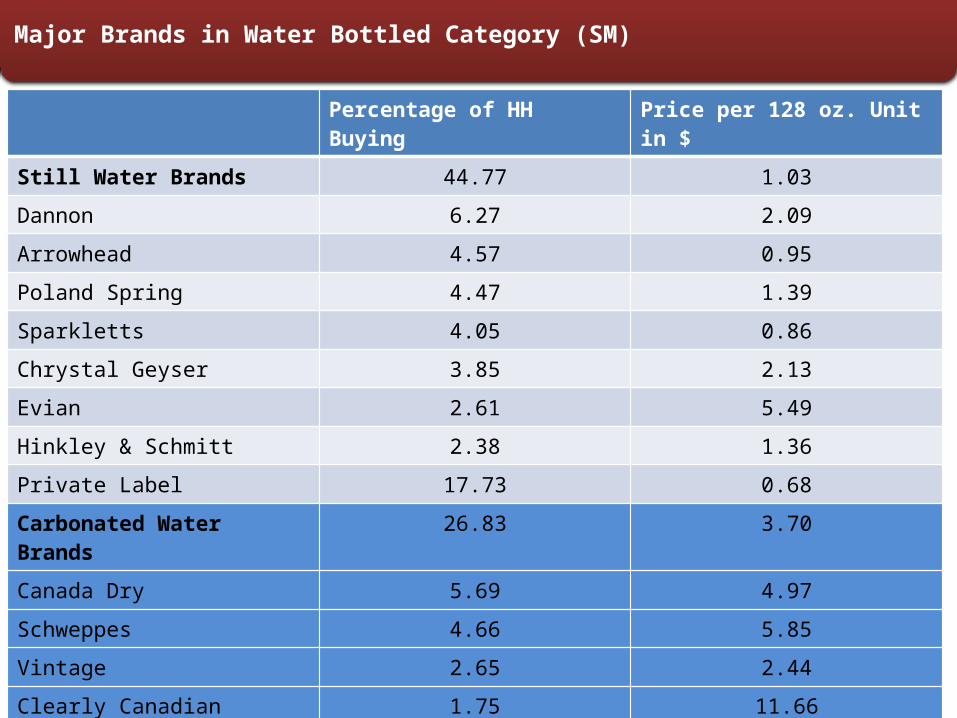
Percentage of HH Buying Price per 128 oz. Unit in $
Still Water Brands 44.77 1.03
Dannon 6.27 2.09
Arrowhead 4.57 0.95
Poland Spring 4.47 1.39
Sparkletts 4.05 0.86
Chrystal Geyser 3.85 2.13
Evian 2.61 5.49
Hinkley & Schmitt 2.38 1.36
Private Label 17.73 0.68
Carbonated Water Brands 26.83 3.70
Canada Dry 5.69 4.97
Schweppes 4.66 5.85
Vintage 2.65 2.44
Clearly Canadian 1.75 11.66
Perrier 1.31 9.47
Private Lable 12.52 2.78
Major Brands in Water Bottled Category (SM)
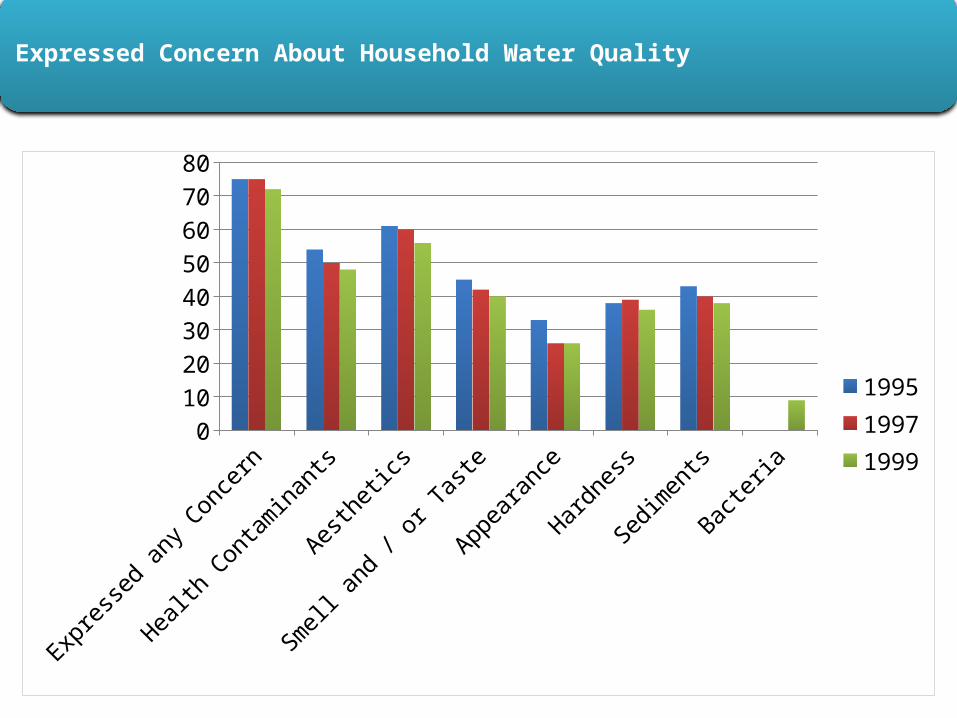
Expressed Concern About Household Water Quality
Expresse
d any C
oncern
Health Contam
inants
Aesthetics
Smell a
nd / or T
aste
Appearance
Hardness
Sedim
ents
Bacteria
0
10
20
30
40
50
60
70
80
199519971999

Expressed Concern: Household Water Quality By Age
Expressed any Concern Health Contaminants0
10
20
30
40
50
60
70
80
90
100
18-2425-3435-4445-5455-6565+
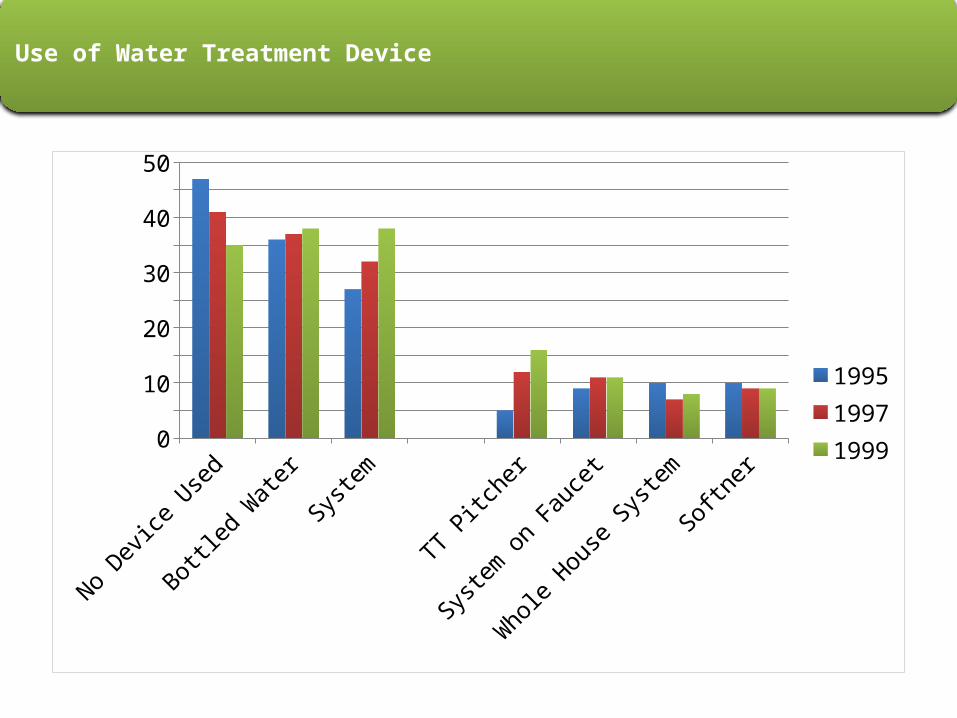
Use of Water Treatment Device
No Device Used
Bottled Water
System TT Pitcher
System on
Faucet
Whole House System
Softner0
5
10
15
20
25
30
35
40
45
50
199519971999

Use of Water Treatment Device By Region - 1999
Bottled Water
TT Pitcher System on Faucet
Whole House Syste
Softner0
5
10
15
20
25
30
35
40
45
50
North EastNorth CentralSouthWest
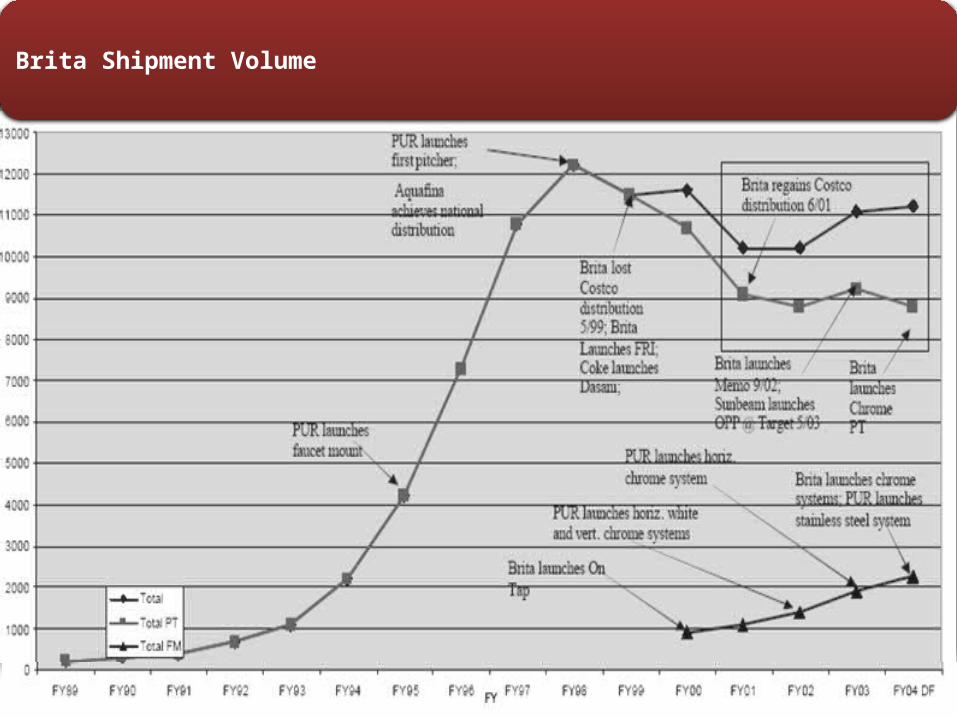
Brita Shipment Volume
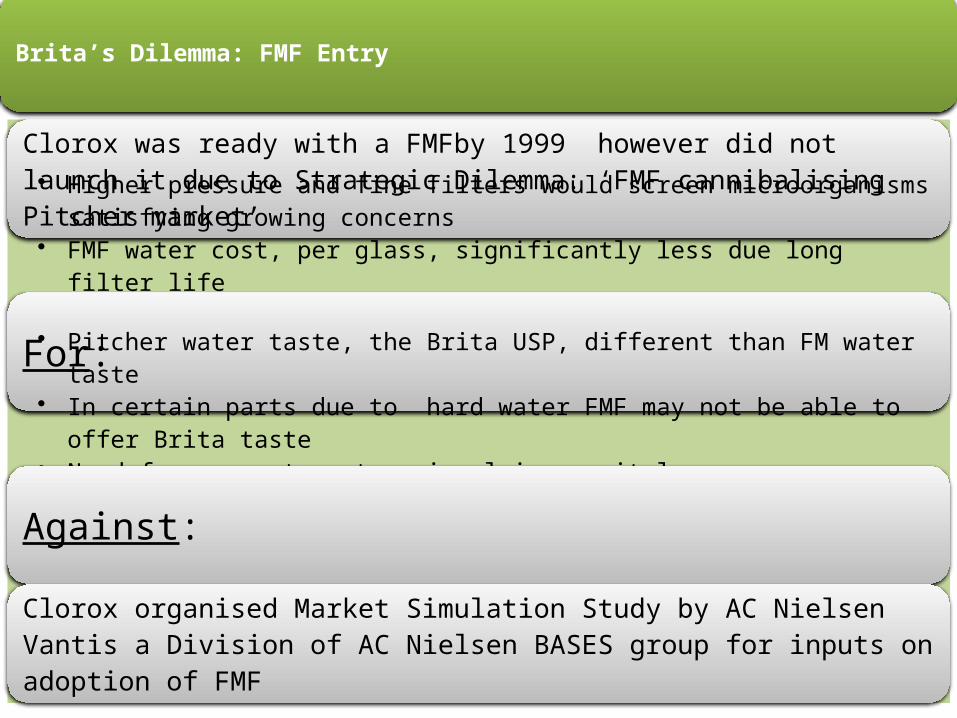
Clorox was ready with a FMFby 1999 however did not launch it due to Strategic Dilemma: ‘FMF cannibalising Pitcher market’• Higher pressure and fine filters would screen microorganisms satisfying growing concerns• FMF water cost, per glass, significantly less due long filter life• Customers who had reverted back to tap water would graduate up to more convenient
and sophisticated faucet unit
For: • Pitcher water taste, the Brita USP, different than FM water taste• In certain parts due to hard water FMF may not be able to offer Brita taste • Need for separate set up involving capital• Addl royalty required to be paid to Brita GmbH as Clorex had no license for FMF
manufacture
Against:
Clorox organised Market Simulation Study by AC Nielsen Vantis a Division of AC Nielsen BASES group for inputs on adoption of FMF
Brita’s Dilemma: FMF Entry

The introduction of FMF will increase likelihood of buying a product from the Brita line
It however did not increase interest in the filtration category as a whole.
Combined Pitcher and FMF market not expected to increase
Though higher priced Brita FMF generated similar levels of purchase intention to the Brita Spacesaver Pitcher
About half the Brita pitcher owners who bought the FMF would continue to use the pitcher in conjunction with the faucet product
Both Brita and PUR FMF considered superior to Brita pitcher, however only Brita’s FMF was perceived to improve the water’s taste
Even after drop in sale price by PUR Brita’s sale was not likely to be significantly impacted
Revelations

Right or Wrong!!!!!
Marketing Mix
Customer Value Proposition
Segmentation – Target Group
Cannibalisation

Water Consumption by Segment(8oz. Glasses)

Strong Positioning without Segmentation
Icarus Paradox
Extended product line extension characterised by derived demand/ follow on revenue structure
Strong Channel Partners provided great shelf life to the product
Cooperative Advertising (at minimum advertised price)
Emerging environmental trends
Means-Ends Chains to identify ways to reduce Cannibalisation
Highlights

Thanks


