140
2016 Annual Report Memphis Light, Gas and Water Division MLGW: Advancing Our Future

2016 Annual ReportMemphis Light, Gas and Water Division
MLGW: Advancing Our Future

Table of ContentsAbout MLGW . . . . . . . . . . . . . 2
President’s Message . . . . . . . . . . . . . 3
MLGW Leadership . . . . . . . . . . . 4
Advancing Technology . . . . . . . . . . 5
Advancing Customer Service . . . . . . . . 6
Advancing Conservation . . . . . . . . . 7
Advancing Smart Energy at Home . . . . . . 8
Advancing Education . . . . . . . . . . 9
Advancing Our Community . . . . . . . 11
Advancing Economic Prosperity . . . . . 13
Advancing Financial Security. . . . . . . 14
Letter of Transmittal . . . . . . . . . . L-1
Financial Highlights . . . . . . . . . . H-1
Financial SectionIndependent Auditor’s Report . . . . . . A-1
Management’s Discussion and Analysis . . . M-1
Financial StatementsStatements of Net Position . . . . . . . . F-1
Statements of Revenues, Expenses and Changes in Net Position . . . . . . . . F-4
Statements of Cash Flows . . . . . . . . F-5
Notes to Financial Statements . . . . . . N-1
Required Supplementary Information . . . . R-1
Supplemental Information. . . . . . . . S-1
Report on Internal Control over Financial Reporting and on Compliance and Other Matters Based on Audit of Financial Statements Performed in Accordance with Government Auditing Standards . . . . . . . . . . Z-1
1

2
About MLGWMemphis Light, Gas and Water Division is the nation’s largest three-service municipal utility, serving nearly 430,000 customers. Since 1939, MLGW has met the utility needs of Memphis and Shelby County residents by delivering reliable and a�ordable electricity, natural gas and water services.
Electricity is supplied to MLGW by the Tennessee Valley Authority, while natural gas is purchased from a variety of suppliers and transported by three pipeline companies — Texas Gas Transmission Corporation, Trunkline Gas Company and ANR Pipeline Company. Memphis receives its water from one of the largest arte-sian water systems in the world.
MLGW is led by a President and a �ve-member Board of Commissioners who are appointed by the Mayor of Memphis and approved by the Memphis City Council.

3
President’s Message MLGW President and CEO Jerry R. Collins Jr.
At Memphis Light, Gas and Water, we have a lot to be proud of . With almost 430,000 customers, we’re the largest three-service municipal utility in the nation . Our customers consistently enjoy some of the lowest rates among all major U .S . cities . Since 2013, Memphis residential customers have had the lowest combined winter utility bill among 29 major cities . In the past 25 years, we’ve held that number-one rank 14 times . In addition, Memphis has access to an abundant supply of the best drinking water anywhere, requiring very little treatment compared to most of the country .
Though all these facts have been true for many years, we at MLGW are not content to rest on these accomplishments . Society continues to advance and grow; we must strive to evolve with it . That’s why we are looking to the future .
Technology is more a part of our lives now than ever before, and information is shared around the world in an instant . When MLGW was founded in 1939, no one could have guessed all the incredible advancements that would impact how we serve our customers . From smart meters to electrical system upgrades, we are embracing the technological revolution and harnessing it to improve customer experiences across our service area .
A healthy economy is essential for any city to thrive . We are proud to be a financially sound institution that strengthens the community we serve . We provide more than 2,500 stable jobs for local residents, along with excellent benefits for current employees as well as retirees . MLGW spending brought $75 .4 million to Shelby County businesses . Our Supplier Diversity programs encourage diversity in the marketplace, with minority-, women- and locally owned small business contracts accounting for one third of our overall spending in 2016 .
Memphis and Shelby County are growing and changing . MLGW has a duty to educate our customers about energy efficiency and safety . We are committed to providing opportunities for empowerment to help them to make smart decisions about energy use for their own families . We are also investing in our community’s future by taking an active role in the education of students across our service area by providing classroom speakers and learning experiences .
Memphis, as every major city, has had its share of challenges in previous decades . While we hope to learn from the past, our eyes are fixed on what’s ahead . The advancements of the future have no intention of slowing down, and neither do we . Memphis Light, Gas and Water Division is charging ahead and leading the way to a bright tomorrow, filled with possibilities .
Jerry R . Collins Jr .

4
MLGW Board of CommissionersSteven Wishnia, ChairCarlee McCullough, Vice ChairDerwin SisnettMitch GravesLeon Dickson Sr.
MLGW Executive Leadership Jerry R. Collins Jr., President and CEOChristopher Bieber, Vice President of Customer CareVon Goodloe, Vice President of Human ResourcesDana Jeanes, Vice President, CFO and Secretary-TreasurerNicholas Newman, Vice President of Construction and MaintenanceCheryl Patterson, Vice President and General CounselLashell Vaughn, Vice President and Chief Technology OfficerAlonzo Weaver III, Vice President of Engineering and OperationsGale Jones Carson, Director of Corporate CommunicationsClifford DeBerry, Director of Analysis, Strategy and PerformanceLesa Walton, Director of Internal AuditRoland McElrath, Controller

5
Advancing TechnologyOne of the most ambitious undertakings for technological advancement in MLGW’s history, our project to install a million smart utility meters, is well under way. �e project is moving ahead of schedule and is on track for completion slightly ahead of the 2020 target. By the end of 2016, MLGW had installed 147,308 electric, 20,505 gas and 29,898 water smart meters for our residential and commercial customers. Replacing aging analog dial meters, smart meters wirelessly and securely transmit usage data to MLGW, eliminating the need for manual or estimated readings and the complications and cost that accompany them. �e meters also alert MLGW to potential problems such as unusual voltage levels, water leaks and potential utility the�. Customers can also log into their online accounts to see details about usage in real time and take action to conserve energy. Combined savings for MLGW and customers are estimated to exceed $50 million annually. In 2016, smart meter customers saved $208,000 on connection and related fees alone.
While smart meters are an upgrade customers can see �rsthand, MLGW is also committing to less obvious improvements that will have a big impact on system reliability and integrity. With over 7,000 combined miles of overhead and underground cable, system integrity is an important focus. We are currently making improvements to our electrical infrastructure to reduce restoration times, add capacity for current and future growth and protect against future potential disasters. Several existing facilities will receive signi�cant upgrades within the next two years, and two new
substations will be added by 2022. We are also adding state-of-the-art technologies such as IntelliRupters and Scada-Mate switches, allowing customer outages to be addressed much more quickly and e�ciently.
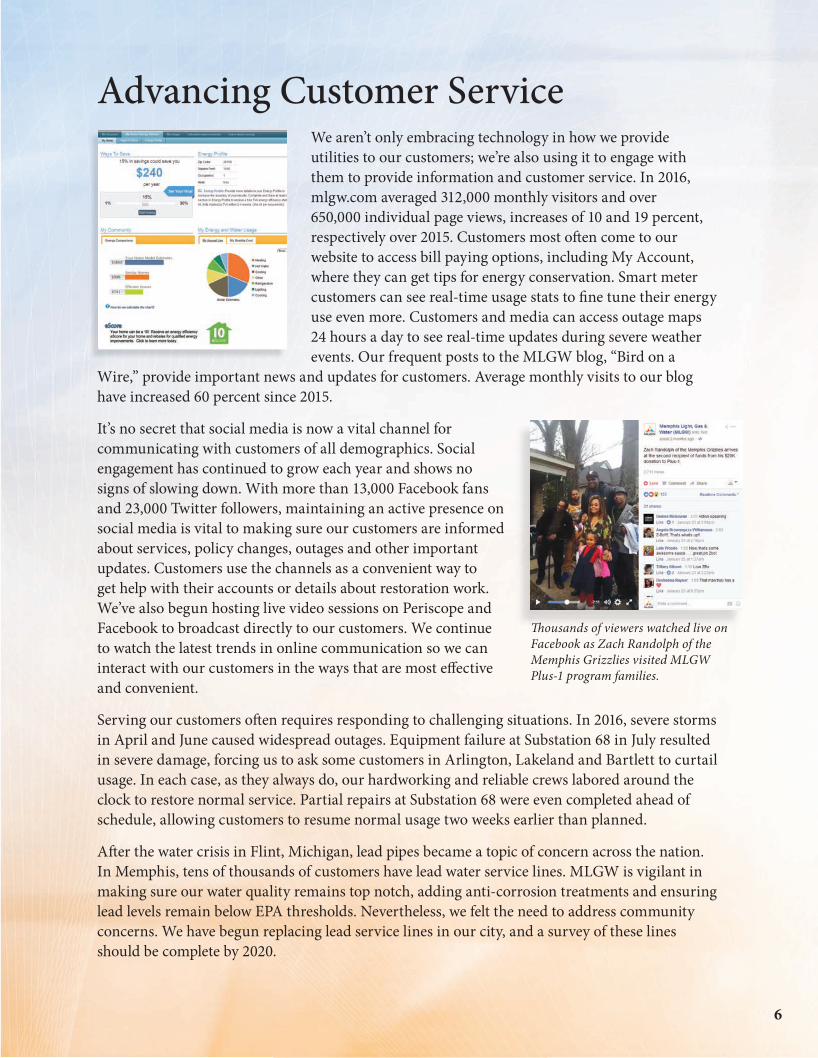
We aren’t only embracing technology in how we provide utilities to our customers; we’re also using it to engage with them to provide information and customer service. In 2016, mlgw.com averaged 312,000 monthly visitors and over 650,000 individual page views, increases of 10 and 19 percent, respectively over 2015. Customers most o�en come to our website to access bill paying options, including My Account, where they can get tips for energy conservation. Smart meter customers can see real-time usage stats to �ne tune their energy use even more. Customers and media can access outage maps 24 hours a day to see real-time updates during severe weather events. Our frequent posts to the MLGW blog, “Bird on a
Wire,” provide important news and updates for customers. Average monthly visits to our blog have increased 60 percent since 2015.
It’s no secret that social media is now a vital channel for communicating with customers of all demographics. Social engagement has continued to grow each year and shows no signs of slowing down. With more than 13,000 Facebook fans and 23,000 Twitter followers, maintaining an active presence on social media is vital to making sure our customers are informed about services, policy changes, outages and other important updates. Customers use the channels as a convenient way to get help with their accounts or details about restoration work. We’ve also begun hosting live video sessions on Periscope and Facebook to broadcast directly to our customers. We continue to watch the latest trends in online communication so we can interact with our customers in the ways that are most e�ective and convenient.
Serving our customers o�en requires responding to challenging situations. In 2016, severe storms in April and June caused widespread outages. Equipment failure at Substation 68 in July resulted in severe damage, forcing us to ask some customers in Arlington, Lakeland and Bartlett to curtail usage. In each case, as they always do, our hardworking and reliable crews labored around the clock to restore normal service. Partial repairs at Substation 68 were even completed ahead of schedule, allowing customers to resume normal usage two weeks earlier than planned.
A�er the water crisis in Flint, Michigan, lead pipes became a topic of concern across the nation. In Memphis, tens of thousands of customers have lead water service lines. MLGW is vigilant in making sure our water quality remains top notch, adding anti-corrosion treatments and ensuring lead levels remain below EPA thresholds. Nevertheless, we felt the need to address community concerns. We have begun replacing lead service lines in our city, and a survey of these lines should be complete by 2020.
6
Advancing Customer Service
�ousands of viewers watched live on Facebook as Zach Randolph of the Memphis Grizzlies visited MLGW Plus-1 program families.

Year a�er year, MLGW is praised for being a leader in energy conservation. TVA named MLGW as an EnergyRight Solutions Top Performer in 2016, earning special recognition in four categories. In TVA’s self-audit program, MLGW ranked �rst overall, with 1,400 customers participating in self-audits. We also ranked �rst overall in the EnergyRight Solutions for Business category, with 26 million kWh saved. In the EnergyRight Solutions for Industry division, MLGW was third overall, saving 3 million kWh. We were third in Green Power Switch as well, representing nearly 11 percent of the program total. Overall, MLGW was the number one local power company performer in total EnergyRight Solutions total program savings with 31 million kWh, more than 11 percent of all program savings.MLGW is taking an active role in protecting our environment as well. In spring of 2016, preparations began to repopulate 13 acres of electric transmission right of way in John F. Kennedy Park in northeast Memphis with native �ora and fauna. In partnership with the Wolf River Conservancy and Clean Memphis, MLGW is planting several species of wild�owers and grasses in the area. �e plants will provide a habitat and food source for insects and wildlife such as birds, bees and butter�ies, increasing the overall population and health of the local ecosystem. �e growth of woody plants and vines, which could interfere with transmission lines, will be naturally suppressed. �at means less active maintenance of the land — including mowing and herbicide — equaling lower cost, reduced fuel usage and less pollution. Water runo� from the area will be better �ltered before it reaches the Wolf River. Students from the Memphis Business Academy volunteered to help begin the planting process, installing 200 wild�ower seedlings in June 2016. �e area should be well populated by spring of 2018.
7
Advancing Conservation

While MLGW places a high priority on large-scale conservation projects, saving energy begins at home. Advances in energy-e�cient technology can help individuals in their homes, and we’re committed to educating customers about ways to save money on their energy costs. Our Energy Doctor program allows customers to schedule a free visit from one of our energy technicians to inspect their homes and o�er advice for improvements and behavior changes that can reduce wasted energy. We performed 296 Energy Doctor inspections in 2016.
�e City of Memphis requires landlords to uphold certain standards for their rental homes. We perform free inspections of rental units. We made 220 inspections in 2016 on behalf of renters. If conditions are below standard, MLGW advocates for the renter to have repairs made and will even take the property owner to environmental court if necessary. So far, every property owner has responded to requirements resulting from inspections in order to bring their properties up to standards.
Our energy technicians also help educate residents and business owners through EnergySmart workshops and participation in community events, such as festivals and neighborhood meetings. In addition to information about increasing energy e�ciency and reducing costs, customers receive energy kits with light bulbs, water faucet regulators, electrical outlet insulators and more. MLGW hosted 37 EnergySmart workshops in 2016 and gave away nearly 12,000 energy kits.
8
Advancing Smart Energy at Home

�e future of MLGW depends on fostering an interest in STEM �elds within our young people. Today’s students will become tomorrow’s engineers and technicians. �ese bright young minds will be instrumental in developing and implementing the latest technologies to help us continue serving Memphis and Shelby County for many decades to come. To that end, MLGW participates in promoting STEM education in our local schools.
In October 2016, our annual A-Blazing Race saw 35 teams of middle and high school students from 20 schools compete in constructing and racing model solar cars. MLGW provides kits containing a solar panel and motor and hosts an engineering workshop to help students plan their designs. Students build their creations from any other materials, then gather to compete in a 20-meter race, harnessing the power of the sun. �ey see their studies of energy, physics and math come to life in a real-world application.
Also in October, MLGW’s Junior Engineer/Professional Engineer (JEPE) program, in partnership with TVA, local schools and representatives from VEX Robotics and the For Inspiration and Recognition of Science and Technology (FIRST) program, hosted a robotics exhibition featuring teams from seven schools. Students from elementary to high school showed o� their robot and computer-controlled LEGO creations, which picked up and threw basketballs, moved over obstacles, transported objects and navigated paths. FIRST participation encourages students to pursue education and careers in STEM-related �elds and inspires them to become leaders and innovators.
9
Advancing Education
President Collins bravely tests a FIRST student group’s ball-throwing robot.

10
Our involvement in education isn’t limited to engineering exhibitions. �e MLGW Speakers Bureau coordinates more than 100 visits to local schools and community events annually. Employees from all across the Division — distribution, security, �nance, legal — represent our company at career days throughout the school year. O�en, our line workers will take MLGW vehicles and equipment on their visits to show students how they do their jobs.
In 2016, we renovated a decommissioned bucket truck for our workers who visit schools as the Terminator — a safety-focused superhero who teaches kids how to be responsible with energy sources at home. �e truck was wrapped with graphics and safety tips, giving our Terminator volunteers an exciting and helpful way to educate students. In addition to visiting schools all around Memphis and Shelby County, our Terminators represented MLGW in two community Christmas parades, sharing candy and ideas for keeping safe and saving energy.
JEPE President Kerry Roy talks to students about her work as an Environmental Engineer.

We understand that li�ing up others helps create a brighter future for us all. As a civic leader, MLGW strives to set an example by giving to our community through donations, volunteering and fundraising. In 2016, MLGW employees donated or raised more than $700,000 in money, supplies and gi�s for organizations such as United Way, the Mid-South Food Bank, St. Jude, the American Cancer Society, the Salvation Army and many more. We also had more than 40 participants in the city-wide United Way Day of Caring, during which workers made signi�cant repairs and renovations at local nonpro�ts Hope House and Grace House.
MLGW gave away 200 air conditioning units, 100 space heaters and 100 electric blankets to low-income seniors and disabled residents as part of our “Play It Cool” and “Power of Warmth” programs. Customers received nearly 12,000 energy e�ciency kits to help lower energy costs at home. MLGW even donated 500 cases of water to the people of Flint, Michigan to help with their water crisis.
Plus-1, in partnership with MIFA, is a one-time assistance program to help customers who are facing a crisis, like a medical emergency. Customers can add a dollar to their bill each month to help out those who need assistance. Our �rst-ever LipSync Plus event invited residents and local celebrities to face-o� for a lip-sync competition, raising money and
Advancing Our Community
11
President Collins, Memphis City Mayor Jim Strickland and Bernal E. Smith II, owner and publisher of the New Tri-State Defender, address the media as MLGW donates water to Flint, Michigan.
Latasha Peeples, winner of the 2016 LipSync Plus competition, sings in a commercial promoting Plus-1.

12
awareness for our Plus-1. Not only was it a fun event for all who attended, it also raised nearly $13,000 for the program.
Share the Pennies is another program that lets customers help out fellow residents. For those enrolled, we round up utility costs to the next whole dollar amount each month. �e di�erence is donated to Project Care, which helps low-income customers make household repairs that reduce wasted energy, thereby lowering costs to heat and cool their homes.
For customers who get behind on their bills, we o�er OnTrack, a program that provides �nancial management tools, deferred billing plans and one-on-one counseling to get expenses under control. OnTrack puts a high priority on education, including advice for saving energy and reducing utility costs. Five hundred customers were enrolled in the program in 2016.

13
Advancing Economic ProsperityA strong community needs a dynamic economy. Memphis is a city of diversity, and MLGW has consistently shown our commitment to supporting its diverse business community. �irty-two percent of all MLGW spending for 2016 took place right here in Shelby County. Our Supplier Diversity program provides opportunities for minority-, women- and locally owned small businesses to establish a professional relationship with MLGW through our bidding process and events to connect with department leaders in our company.
MLGW bases its diversity spending on independent certi�cation that businesses are at least 51 percent owned, controlled, operated and managed by a person or persons who represent one of the three business classi�cations outlined in the program de�nition. In another record year for Supplier Diversity, MLGW spent $76.4 million on contracts with MWBE/LSBs — a remarkable 61.5 percent increase over 2015. �is amount has risen each year since the program began in 2012.
MLGW established its Sheltered Market Program in 2014 to provide opportunities for local organizations to compete for business on a more level playing �eld. �is race- and gender-neutral program shelters any purchase under $100,000 by o�ering three or more certi�ed local small businesses the opportunity to bid on products or services. In 2016, MLGW spent $10.6 million through our Sheltered Market Program, helping area businesses grow and stimulating our local economy. Fi�y percent of this spending was also with MWBEs, who have dual certi�cation as local and minority- and/or women-owned.
Recently retired Procurement Manager Jozelle Booker and Supplier Diversity Coordinator Renise Holliday recognize local business owner Lee A. Bean with a Lifetime Achievement Award.
Fred Johnson, owner and president of Shelby Packaging and Logistics, stands in one of his facilities, housing thousands of smart meters. �e smart meter installation project has accounted for more than $15 million of MLGW’s supplier diversity spending.

14
Advancing Financial SecuritySmart �nancial planning builds a solid foundation for the future. MLGW helps its employees prepare for what lies ahead by maintaining strong retirement funds and healthcare bene�ts. In fact, the MLGW Other Post Employment Bene�ts and Pension Funds (OPEB) are among the most well-funded across the nation. At year-end 2016, the Pension Fund was 93.2 percent funded, compared to an average of about 81 percent for the 100 largest corporate pensions in the country. Overall for 2016, the pension fund grew 8.6 percent, outpacing the goal of 7.5 percent. �e OPEB fund grew 8.2 percent.
MLGW has been recognized by market leaders as an excellent and high quality credit investment. MLGW issued $110 million in bonds in August 2016 with record low interest rates of 2.459 percent for each of the Electric and Gas Divisions and 2.322 percent for water. �e Water Division received Standard and Poor’s highest credit rating — AAA — and an Aa1 rating by Moody’s. �e Electric Division was rated AA+ by Standard and Poor’s and Aa2 by Moody’s. Gas received AA- and Aa1 ratings, respectively, even though it was the Gas Division’s �rst issuance since 1984, resulting in the agencies rating those bonds similar to a new credit. �e recognition of MLGW’s exemplary creditworthiness will help us continue making improvements while minimizing expense to our customers.
Recent MLGW retiree Doris Douglas (le�) can enjoy her well-earned retirement knowing her Pension and OPEB funds are secure.
MLGW’s �nancial stability means our employees can plan for their families’ futures.
�e MLGW OPEB board works hard to ensure the �nancial security of our retirees.

L-1
MEMPHIS LIGHT, GAS AND WATER DIVISION
Letter of Transmittal
To the Board of Commissioners and Valued Stakeholders:
We are pleased to submit the Annual Report of Memphis Light, Gas and Water Division (MLGW) for the �scal year ended December 31, 2016, as required by the Charter Provisions of the City of Memphis (City) creating the Memphis Light, Gas and Water Division. �is report has been prepared in conformity with accounting principles generally accepted in the United States of America (GAAP) for proprietary funds of governmental entities.
Responsibility for the accuracy and presentation of the information provided is the full responsibility of the management of MLGW. Disclosures necessary to assist the reader in understanding of the �nancial statements have been included.
MLGW’s �nancial statements have been audited by Mayer Ho�man McCann P.C., licensed certi�ed public accountants. �e goal of the independent audit was to provide reasonable assurance that the �nancial statements of MLGW for the �scal year ended December 31, 2016 are free from material misstatement. �e independent audit involved performing procedures to obtain audit evidence about the amounts and disclosures in the �nancial statements; evaluating the appropriateness of accounting policies used and the reasonableness of signi�cant estimates made by management; and evaluating the overall �nancial statement presentation.
�e independent auditors concluded, based upon the audit, that there was a reasonable basis for rendering an unmodi�ed opinion that MLGW’s �nancial statements for the �scal year ended December 31, 2016 are fairly presented in conformity with GAAP. �e independent auditor’s report is presented as the �rst component of the �nancial section of the report.
GAAP requires that management provide a narrative introduction, overview and analysis to accompany the basic �nancial statements in the form of a Management’s Discussion and Analysis (MD&A). �is letter of transmittal is designed to complement the MD&A and should be read in conjunction with it. MLGW’s MD&A can be found immediately following the report of the independent auditors.
Pro�le of the Government — MLGW was created by an amendment to the City Charter by Chapter 381 of the Private Acts of the General Assembly of Tennessee, adopted March 9, 1939, as amended (the “Private Act”). MLGW operates three separate utilities, as divisions, providing electricity and gas in the City and Shelby County. Water service is provided by MLGW in the City, and together with other municipal systems, in Shelby County.
Each division operates as a separate entity for accounting and �nancial purposes in accordance with the Private Act. For economic reasons, activities common to all three divisions are administered jointly and costs are prorated monthly among the divisions. A 1981 amendment to the City Charter permits the establishment of additional divisions to provide other energy services.
MLGW controls the administration of its activities and business a�airs. It operates independently, manages its own �nances and is responsible for obligations incurred in such operations, including indebtedness payable from operations of the Division. MLGW must have the approval of the City Council before incurring certain obligations, including purchasing real estate and exercising the right of eminent domain; the annual budget is also subject to approval by the City Council.

L-2
MLGW is managed by a Board of Commissioners, which consists of �ve members nominated by the Mayor and approved by the City Council. Under the Private Act, the Board is responsible for doing all things necessary to supply the Division’s service area with electricity, gas and water. �e members of the Board serve staggered terms of three years each. Every two years, the Board elects a Chairman and a Vice Chairman, whose terms begin January 1. �e Chairman, Vice Chairman and Board Members continue to serve until a new Chairman, Vice Chairman or Board Member is elected or appointed by the Mayor.
�e daily operations of MLGW are managed by the President and Chief Executive O�cer, who is nominated for a �ve-year term by the Mayor and approved by the City Council. Under the Private Act, the President generally supervises the operations of MLGW and its o�cers and employees.
Local Economy — Sitting on the southwestern corner of Tennessee alongside the Mississippi River, Memphis is the largest city in the state and the 23rd largest in the nation. Shelby County has a population of 945,757 people (according to 2015 census data) and more than 400,000 housing units utilizing MLGW services. Memphis is home to a diverse range of employers, including three Fortune 500 world headquarters (FedEx, International Paper and AutoZone). Numerous globally recognized brands have major o�ces or distribution facilities in Memphis, including Nike, Coca-Cola, Hilton and Medtronic. According to the U.S. Bureau of Labor Statistics, the Memphis Metro Area added a net of 4,000 new jobs in 2016. �e trade, transportation and utilities sectors saw the largest growth and now make up approximately 28 percent of the area’s total nonfarm workforce. Professional and business services make up 15 percent of employment, followed by education and health services at 14 percent.
In recent years, Memphis has earned many distinctions, including being ranked among the “Top 4 Markets for Millennials” (Wall Street Journal), “Happiest Cities for Job-Seeking College Grads” (Forbes and CareerBliss), “Best Cities to Start a Business” (WalletHub) and “Cities Creating the Most Tech Jobs” (Forbes). In its 2016 annual in-depth analysis, Business Facilities magazine once again named Memphis the “undisputed logistics champion,” highlighting the city’s “tremendous assets serving all modes of transportation: air, land, water and rail.” In addition to being home to FedEx and the world’s second busiest cargo airport, Memphis is a major hub for UPS and USPS, home to more than 400 trucking companies, serviced by �ve class-one railroads and a key port on the Mississippi River. Business Facilities also named Memphis as the sixth city in lowest cost of business, citing competitive advantages in industrial facility leasing and construction, transportation, statutory and bene�t costs and low natural gas prices.
MLGW has a major impact on the local economy. Division spending within Memphis during 2016 amounted to $61.1 million, and $75.4 million went to Shelby County overall. Of that, nearly 48.8 percent went to businesses owned by minorities and women or local small businesses. For the fourth consecutive year, MLGW has the lowest combined electric, gas and water residential rates among 25 major metropolitan cities. �e Electric, Gas and Water Divisions all received excellent credit ratings from Standard and Poor’s and Moody’s, designating MLGW as a reliable and stable �nancial investment.
National Economy — According to the Bureau of Economic Analysis, a division of the U.S. Department of Commerce, real gross domestic product (GDP), a key indicator of economic growth, increased 1.6 percent, compared with 2.6 percent growth in 2015. Increases in consumer spending, residential investment, state and local government spending, exports and federal government spending contributed to the growth of GDP in 2016.
Financial Policies and Major Initiatives — MLGW maintains a comprehensive cash �ow model which assesses the growth of the separate divisions and determines future rate increase and debt issuance requirements. MLGW also incorporates a �ve-year capital plan in its budgeting process. MLGW’s Electric, Gas and Water Engineering Departments develop detailed technical master plans for their respective systems which are then correlated with the �nancial plan. �e �ve-year capital plans are updated periodically during the year in order to provide the most current possible cash �ow projections.

L-3
Among the three divisions, MLGW averages around $105 million in capital expenditures annually. Major projects are currently underway in each division. Our comprehensive smart meter project is installing new meters across all divisions — electric, gas and water — and is moving ahead of schedule. Electric infrastructure upgrades include two new substations, upgrades at existing facilities and the installation of advanced distribution technologies to increase safety and decrease outage response time.
�e Gas Division’s 30-year natural gas cast iron pipe retro�t program continues on schedule for completion by 2022. More than 330 miles of cast iron pipes are being replaced with polyethylene or steel, increasing the safety and reliability of our natural gas system. MLGW has also constructed a 13-mile-long 24-inch gas pipeline to feed TVA’s combined-cycle Allen Plant, which will replace the coal-burning Allen Fossil Plant upon completion.
In the Water Division, major renovations at the Sheahan Pumping Station and MLGW Water Lab continue. MLGW is also creating an inventory of water service lines and has begun replacing those which are made of lead, while continuing everyday water quality testing and protection measures that always ensure EPA standards are met or exceeded.MLGW also has a formal �ve-year Strategic Plan and engages in joint endeavors with the City of Memphis, the Tennessee Valley Authority and other stakeholders when possible to streamline costs through collaborative e�orts. �e plan also addresses MLGW’s commitment to cost control, which is discussed in other sections of this �nancial report.Acknowledgements — �e preparation of this report was made possible by the overall dedication of MLGW’s Finance Division. We would like to express our appreciation to all members of the Finance Division who contributed to the preparation of this report. Special thanks must also be given to Mayer Ho�man McCann P.C. and Jones & Tuggle PLLC for their e�cient and timely completion of this year’s audit.
Respectfully submitted,
Jerry R. Collins Jr. Dana JeanesPresident and CEO Vice President, CFO and Secretary-Treasurer
H-1
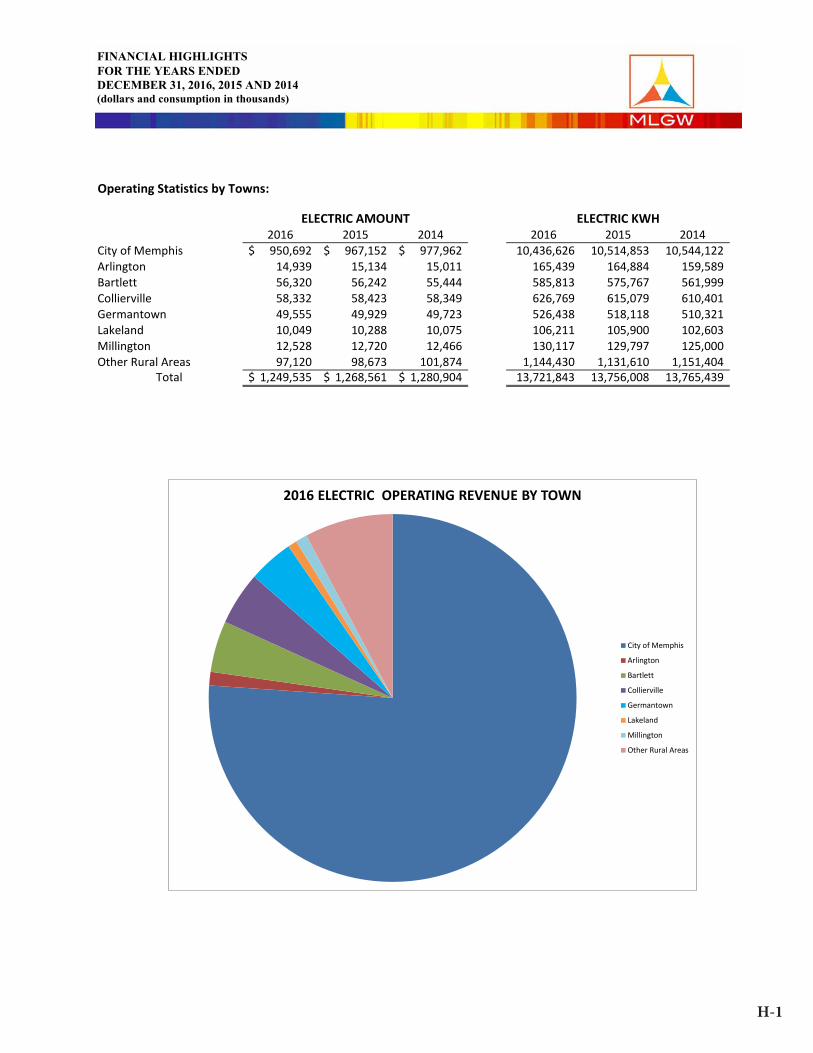
FINANCIAL HIGHLIGHTSFOR THE YEARS ENDED DECEMBER 31, 2016, 2015 AND 2014 (dollars and consumption in thousands)
Operating Statistics by Towns:
2016 2015 2014 2016 2015 2014City of Memphis 950,692$ 967,152$ 977,962$ 10,436,626 10,514,853 10,544,122Arlington 14,939 15,134 15,011 165,439 164,884 159,589Bartlett 56,320 56,242 55,444 585,813 575,767 561,999Collierville 58,332 58,423 58,349 626,769 615,079 610,401Germantown 49,555 49,929 49,723 526,438 518,118 510,321Lakeland 10,049 10,288 10,075 106,211 105,900 102,603Millington 12,528 12,720 12,466 130,117 129,797 125,000Other Rural Areas 97,120 98,673 101,874 1,144,430 1,131,610 1,151,404
Total 1,249,535$ 1,268,561$ 1,280,904$ 13,721,843 13,756,008 13,765,439
ELECTRIC AMOUNT ELECTRIC KWH
2016 ELECTRIC OPERATING REVENUE BY TOWN
City of Memphis
Arlington
Bartlett
Collierville
Germantown
Lakeland
Millington
Other Rural Areas

H-2
FINANCIAL HIGHLIGHTSFOR THE YEARS ENDED DECEMBER 31, 2016, 2015 AND 2014(dollars and consumption in thousands)
Operating Statistics by Towns:
2016 2015 2014 2016 2015 2014City of Memphis 155,671$ 188,488$ 248,358$ 20,940 25,189 27,997Arlington 2,444 3,047 4,182 370 448 506Bartlett 10,224 12,312 16,788 1,438 1,682 1,916Collierville 10,125 12,170 16,925 1,541 1,778 2,030Germantown 8,718 10,584 14,850 1,360 1,568 1,792Lakeland 1,939 2,506 3,494 281 351 406Millington 2,036 2,580 3,356 314 372 384Other Rural Areas 14,719 18,218 25,859 2,097 2,510 2,954
Total 205,876$ 249,905$ 333,812$ 28,341 33,898 37,985
GAS AMOUNT GAS MCF
2016 GAS OPERATING REVENUE BY TOWN
City of Memphis
Arlington
Bartlett
Collierville
Germantown
Lakeland
Millington
Other Rural Areas
FINANCIAL HIGHLIGHTSFOR THE YEARS ENDED DECEMBER 31, 2016, 2015 AND 2014 (dollars and consumption in thousands)
Operating Statistics by Towns:
2016 2015 2014 2016 2015 2014City of Memphis 950,692$ 967,152$ 977,962$ 10,436,626 10,514,853 10,544,122Arlington 14,939 15,134 15,011 165,439 164,884 159,589Bartlett 56,320 56,242 55,444 585,813 575,767 561,999Collierville 58,332 58,423 58,349 626,769 615,079 610,401Germantown 49,555 49,929 49,723 526,438 518,118 510,321Lakeland 10,049 10,288 10,075 106,211 105,900 102,603Millington 12,528 12,720 12,466 130,117 129,797 125,000Other Rural Areas 97,120 98,673 101,874 1,144,430 1,131,610 1,151,404
Total 1,249,535$ 1,268,561$ 1,280,904$ 13,721,843 13,756,008 13,765,439
ELECTRIC AMOUNT ELECTRIC KWH
2016 ELECTRIC OPERATING REVENUE BY TOWN
City of Memphis
Arlington
Bartlett
Collierville
Germantown
Lakeland
Millington
Other Rural Areas

H-3
FINANCIAL HIGHLIGHTSFOR THE YEARS ENDED DECEMBER 31, 2016, 2015 AND 2014(dollars and consumption in thousands)
Operating Statistics by Towns:
2016 2015 2014 2016 2015 2014City of Memphis 82,677$ 70,107$ 71,395$ 43,243 44,264 46,047Resale to Other Munic ipalities:Arlington 1,916 1,526 1,510 605 590 598Bartlett 48 40 46 3 3 7Collierville 160 161 154 46 59 55Germantown 108 94 84 32 35 31Lakeland 1,734 1,443 1,410 543 556 545Millington 179 162 160 62 60 58Other Rural Areas 13,025 10,958 11,422 4,197 4,528 4,726
Total 99,847$ 84,491$ 86,181$ 48,731 50,095 52,067
WATER AMOUNT WATER CCF
2016 WATER OPERATING REVENUE BY TOWN
City of Memphis
Arlington
Bartlett
Collierville
Germantown
Lakeland
Millington
Other Rural Areas
FINANCIAL HIGHLIGHTSFOR THE YEARS ENDED DECEMBER 31, 2016, 2015 AND 2014 (dollars and consumption in thousands)
Operating Statistics by Towns:
2016 2015 2014 2016 2015 2014City of Memphis 950,692$ 967,152$ 977,962$ 10,436,626 10,514,853 10,544,122Arlington 14,939 15,134 15,011 165,439 164,884 159,589Bartlett 56,320 56,242 55,444 585,813 575,767 561,999Collierville 58,332 58,423 58,349 626,769 615,079 610,401Germantown 49,555 49,929 49,723 526,438 518,118 510,321Lakeland 10,049 10,288 10,075 106,211 105,900 102,603Millington 12,528 12,720 12,466 130,117 129,797 125,000Other Rural Areas 97,120 98,673 101,874 1,144,430 1,131,610 1,151,404
Total 1,249,535$ 1,268,561$ 1,280,904$ 13,721,843 13,756,008 13,765,439
ELECTRIC AMOUNT ELECTRIC KWH
2016 ELECTRIC OPERATING REVENUE BY TOWN
City of Memphis
Arlington
Bartlett
Collierville
Germantown
Lakeland
Millington
Other Rural Areas

Financial Section
Memphis Light, Gas andWater Division

5100 Poplar Ave., 30th Floor ■ Memphis, TN 38137 Main: 901.685.5575 ■ Fax: 901.685.5583 ■ www.mhmcpa.com
Member of Kreston International — a global network of independent accounting firms
Independent Auditor's Report
To the Board of Commissioners and ManagementMemphis Light, Gas and Water DivisionMemphis, Tennessee
Report on the Financial Statements
We have audited the accompanying financial statements of the Electric, Gas and Water Divisions(the "Divisions") of Memphis Light, Gas and Water Division, enterprise funds of the City of Memphis,Tennessee, as of and for the years ended December 31, 2016 and 2015, and the related notes tothe financial statements, which collectively comprise the Divisions' basic financial statements aslisted in the table of contents.
Management’s Responsibility for the Financial Statements
The Divisions' management is responsible for the preparation and fair presentation of thesefinancial statements in accordance with accounting principles generally accepted in the UnitedStates of America; this includes the design, implementation, and maintenance of internal controlrelevant to the preparation and fair presentation of financial statements that are free from materialmisstatement, whether due to fraud or error.
Auditor’s Responsibility
Our responsibility is to express opinions on these financial statements based on our audits. Weconducted our audits in accordance with auditing standards generally accepted in the United Statesof America and the standards applicable to financial audits contained in Government AuditingStandards, issued by the Comptroller General of the United States. Those standards require that weplan and perform the audit to obtain reasonable assurance about whether the financial statementsare free from material misstatement.
An audit involves performing procedures to obtain audit evidence about the amounts anddisclosures in the financial statements. The procedures selected depend on the auditor’s judgment,including the assessment of the risks of material misstatement of the financial statements, whetherdue to fraud or error. In making those risk assessments, the auditor considers internal controlrelevant to the Divisions' preparation and fair presentation of the financial statements in order todesign audit procedures that are appropriate in the circumstances, but not for the purpose ofexpressing an opinion on the effectiveness of the entity’s internal control. Accordingly, we expressno such opinion. An audit also includes evaluating the appropriateness of accounting policies usedand the reasonableness of significant accounting estimates made by management, as well asevaluating the overall presentation of the financial statements.
We believe that the audit evidence we have obtained is sufficient and appropriate to provide a basisfor our audit opinions.
A-1

Opinions
In our opinion, the financial statements referred to above present fairly, in all material respects, thefinancial position of the Electric, Gas and Water Divisions of Memphis Light, Gas and Water Divisionas of December 31, 2016 and 2015, and the changes in their financial position and cash flows forthe years then ended in accordance with accounting principles generally accepted in the UnitedStates of America.
Emphasis of Matter
As discussed in note 1, the financial statements present only the Electric, Gas and Water Divisionsof Memphis Light, Gas and Water Division, and do not purport to, and do not, present fairly thefinancial position of the City of Memphis, Tennessee, as of December 31, 2016 and 2015, and thechanges in its financial position, or, where applicable, its cash flows for the years then ended inconformity with accounting principles generally accepted in the United States of America.
Other Matters
Required Supplementary Information
Accounting principles generally accepted in the United States of America require thatmanagement's discussion and analysis; schedule of changes in net pension liability; schedule ofemployer contributions - pension; schedule of funding progress for OPEB; and the schedule ofemployer contributions - OPEB, on the pages listed in the table of contents, be presented tosupplement the basic financial statements. Such information, although not a part of the basicfinancial statements, is required by the Governmental Accounting Standards Board, who considersit to be an essential part of financial reporting for placing the basic financial statements in anappropriate operational, economic, or historical context. We have applied certain limited proceduresto the required supplementary information in accordance with auditing standards generally acceptedin the United States of America, which consisted of inquiries of management about the methods ofpreparing the information and comparing the information for consistency with management'sresponses to our inquiries, the basic financial statements, and other knowledge we obtained duringour audits of the basic financial statements. We do not express an opinion or provide anyassurance on the information because the limited procedures do not provide us with sufficientevidence to express an opinion or provide any assurance.
Other Information
Our audits were conducted for the purpose of forming opinions on the basic financial statements ofeach Division. The introductory section and supplemental information on the pages listed in thetable of contents are presented for purposes of additional analysis and are not a required part of thebasic financial statements. The schedule of bonds, principal and interest requirements; schedule ofcurrent utility rates; non-revenue water; and schedule of insurance are required by the State ofTennessee Comptroller of the Treasury's Audit Manual.
A-2

The supplementary information shown as the schedule of bonds, principal and interest requirementsand schedule of additions and retirements to utility plant is the responsibility of management andwas derived from and relate directly to the underlying accounting and other records used to preparethe basic financial statements. Such information has been subjected to the auditing proceduresapplied in the audits of the basic financial statements and certain additional procedures, includingcomparing and reconciling such information directly to the underlying accounting and other recordsused to prepare the basic financial statements or to the financial statements themselves, and otheradditional procedures in accordance with auditing standards generally accepted in the United Statesof America. In our opinion, this supplementary information is fairly stated, in all material respects inrelation to the basic financial statements as a whole.
The introductory section and supplementary information shown as the schedule of current utilityrates, non-revenue water, and schedule of insurance have not been subjected to the auditingprocedures applied in the audit of the basic financial statements and, accordingly, we do notexpress an opinion or provide any assurance on them.
Other Reporting Required by Government Auditing Standards
In accordance with Government Auditing Standards, we have also issued our report dated June 7,2017, on our consideration of the Divisions' internal control over financial reporting and on our testsof their compliance with certain provisions of laws, regulations, contracts, and grant agreements andother matters. The purpose of that report is to describe the scope of our testing of internal controlover financial reporting and compliance and the results of that testing, and not to provide an opinionon internal control over financial reporting or on compliance. That report is an integral part of anaudit performed in accordance with Government Auditing Standards in considering the Divisions'internal control over financial reporting and compliance.
Memphis, TennesseeJune 7, 2017
A-3
MANAGEMENT’S DISCUSSION AND ANALYSIS FOR THE YEARS ENDED DECEMBER 31, 2016 AND 2015
M-1
The following management discussion and analysis (“MD&A”) for the Electric, Gas, and Water Divisions of Memphis Light, Gas and Water Division (“MLGW”) is intended as an introduction and should be read in conjunction with the financial statements and the notes that follow this section. Highlights MLGW was named as an Energy Right Solutions Top Performer in four categories for energy savings by
the Tennessee Valley Authority (“TVA”).
In 2015, MLGW’s Smart Meter Project contract was approved to begin the full-scale implementation of smart meters that will be completed by the end of 2020. Existing MLGW meters are being replaced with smart electric, gas, and water models. This enables MLGW to communicate with meters on a daily basis instead of sending a meter reader to each property to collect consumption data once a month and this enables the customer to be more energy efficient. In 2016, MLGW began full-scale implementation with installation of more than 200,000 electric, gas, and water smart meters.
MLGW issued debt for the capital programs for the Electric, Gas, and Water Divisions in September 2016. The Electric Division’s Senior Lien Series 2016 bonds were rated Aa2 by Moody’s Investors Service (“Moody’s”) and AA+ by Standard & Poor’s Ratings Services (“S&P”). Senior Lien means a lien on one or more categories of revenues that entitles the beneficiaries of such lien to have a claim on such revenues prior to any other person and ahead of the use of such revenues for any purpose other than payment of operating expenses provided one or more series of revenue obligations, contracts and related beneficiaries may have parity Senior Liens on the same categories of revenues pursuant to the terms of the bond resolution. MLGW’s electric subordinate lien bonds, related to the electric prepay agreement with TVA, were reaffirmed with the rating of Aa2 from Moody’s. The S&P rating on the subordinate lien bonds was rated AA. The Gas Division’s Series 2016 bonds were rated Aal by Moody’s and AA- by S&P. The Water Division’s Series 2016 bonds were rated Aa1 by Moody’s and AAA by S&P. The AAA rating is the highest rating given by S&P.
Construction of the new TVA gas-fired generation plant is progressing well towards the December 2018 completion date. MLGW has completed the construction of the 13 plus mile transmission pipeline portion of the project that will be the primary supply for this new gas-fired plant. The entire project is due to be completed July 2017 and will generate additional gas transportation revenues for the gas division.
MLGW recorded another record-breaking year for supplier diversity in 2016. The Division spent $76.4 million on contracts with MWBE/LSBs.

MANAGEMENT’S DISCUSSION AND ANALYSIS FOR THE YEARS ENDED DECEMBER 31, 2016 AND 2015 (Continued)
M-2
Overview of the Financial Statements MLGW’s financial statements are comprised of the Statements of Net Position; the Statements of Revenues, Expenses and Changes in Net Position; the Statements of Cash Flows; and the accompanying Notes. This report also contains required and supplemental information in addition to the basic financial statements. The Statement of Net Position reports the assets and deferred outflows of resources less liabilities and deferred inflows of resources, with the difference being the net position. Net position will be displayed in three components: net investment in capital assets, restricted, and unrestricted. Over time, increases or decreases in net position may serve as an indicator of whether the financial position is improving or declining. The Statements of Revenues, Expenses and Changes in Net Position show how net position changed during each year based on revenues and expenses. All changes in net position are reported as soon as the underlying event giving rise to the change occurs, regardless of the timing of related cash flows. The Statements of Cash Flows report changes in cash and cash equivalents summarized by net changes from operating, capital and related financing and investing activities. The Notes provide additional detailed information to support the financial statements. The statements present the current year and preceding year for comparison. The report also includes Statistical Highlights: these highlights convey significant data that afford the reader a better historical perspective and assist in assessing the current financial status and trends of MLGW. The highlights present a three-year comparison beginning with the current year and preceding two years for the Electric, Gas, and Water Divisions. During the fiscal year 2016, MLGW adopted GASB Statement No. 72, Fair Value Measurement and Application. The purpose of this Statement is to establish financial reporting standards for fair value measurements for state and local governments. The definition of fair value is the price that would be received to sell an asset or paid to transfer a liability in an orderly transaction between market participants at the measurement date. The Statement requires investment assets and liabilities be measured at fair value. MLGW comprises the utility operations of the City of Memphis. Pursuant to the Memphis City Charter, MLGW is required to maintain separate books and accounts of the electric, gas, and water operations, so that said books and accounts reflect the financial condition of each division separately, to the end that each division shall be self-sustaining. Costs are allocated to the three divisions in a manner that ensures results of operations and changes in financial position are presented fairly and consistently from year to year. MLGW’s statements are provided to the City of Memphis and reformatted to conform to the City’s format for enterprise funds. The City of Memphis incorporates MLGW’s statements ending December 31 into its statements ending June 30.

MANAGEMENT’S DISCUSSION AND ANALYSIS FOR THE YEARS ENDED DECEMBER 31, 2016 AND 2015 (Continued)
M-3
STATISTICAL HIGHLIGHTS-ELECTRIC DIVISIONYears Ended December 31
CATEGORIES 2016 2015 2014OPERATING REVENUE
Residential 505,811,638$ $ 513,804,077 $ 512,467,698Commercial - General Service 585,812,041 592,357,531 591,269,532Industrial 95,656,535 108,647,814 119,347,528Outdoor Lighting and Traffic Signals 11,330,518 11,300,413 11,354,154Street Lighting Billing 13,076,088 13,061,894 12,958,669Interdepartmental 8,117,897 9,281,301 9,676,904Green Power (255,347) (220,049) (264,636)Miscellaneous 30,505,018 30,253,807 33,769,237Accrued Unbilled Revenue 6,309,242 (3,360,498) (1,965,202)Revenue Adjustment for Uncollectibles (6,828,137) (6,564,675) (7,709,385) TOTAL OPERATING REVENUE 1,249,535,493$ $ 1,268,561,615 $ 1,280,904,499
CUSTOMERSResidential 366,265 366,721 364,624Commercial - General Service 43,373 43,761 43,589Industrial 133 152 154Outdoor Lighting and Traffic Signals 17,004 17,110 17,048Interdepartmental 41 45 47 Total Customers 426,816 427,789 425,462
KWH SALES (THOUSANDS)
Residential 5,322,901 5,295,187 5,221,001Commercial - General Service 6,286,966 6,326,434 6,212,068Industrial 1,859,280 1,866,238 2,053,626Outdoor Lighting and Traffic Signals 88,928 88,441 93,395Street Lighting Billing 75,141 75,321 74,690Interdepartmental 88,627 104,387 110,659 Total KWH Sales (Thousands) 13,721,843 13,756,008 13,765,439
OPERATING REVENUE/CUSTOMER
Residential 1,381.00$ $ 1,401.08 $ 1,405.47Commercial - General Service 13,506.38 13,536.20 13,564.65 Industrial 719,222.07 714,788.25 774,983.95 Outdoor Lighting and Traffic Signals 666.34 660.46 666.01 Interdepartmental 197,997.49 206,251.13 205,891.58
OPERATING REVENUE/KWH*
Residential 0.095$ $ 0.097 $ 0.098Commercial - General Service 0.093 0.094 0.095 Industrial 0.051 0.058 0.058 Outdoor Lighting and Traffic Signals 0.127 0.128 0.122 Street Lighting Billing 0.174 0.173 0.173Interdepartmental 0.092 0.089 0.087
KWH/CUSTOMER
Residential 14,532.92 14,439.28 14,318.86Commercial - General Service 144,951.14 144,567.86 142,514.58Industrial 13,979,548.87 12,277,881.58 13,335,233.77Outdoor Lighting and Traffic Signals 5,229.83 5,168.97 5,478.36Interdepartmental 2,161,634.15 2,319,711.11 2,354,446.81
*See graph on M-6.

MANAGEMENT’S DISCUSSION AND ANALYSIS FOR THE YEARS ENDED DECEMBER 31, 2016 AND 2015 (Continued)
M-4
STATISTICAL HIGHLIGHTS-GAS DIVISIONYears Ended December 31
CATEGORIES 2016 2015 2014OPERATING REVENUE
Residential $ 120,179,376 $ 150,174,338 $ 207,334,707Commercial - General Service 55,227,388 69,815,939 95,601,873Industrial 1,681,543 2,652,791 3,765,082Interdepartmental 172,754 315,995 464,944Transported Gas 6,350,515 5,385,298 5,800,804Spot Gas 6,388,974 7,936,852 11,239,189Liquefied Natural Gas (LNG) 4,571,710 7,892,439 7,139,441Compressed Natural Gas (CNG) 107,847 400,439 324,971Miscellaneous 8,439,778 12,486,159 11,748,814Accrued Unbilled Revenue 4,161,055 (5,847,200) (6,949,921)Revenue Adjustment for Uncollectibles (1,404,506) (1,308,386) (2,657,455) TOTAL OPERATING REVENUE $ 205,876,434 $ 249,904,664 $ 333,812,449
CUSTOMERSResidential 289,592 291,448 290,690Commercial - General Service 21,634 21,931 21,917Industrial 31 32 34Interdepartmental 12 12 14Transported Gas 98 113 104Spot Gas 33 44 45
Subtotal 311,400 313,580 312,804LNG 3 4 6CNG (Sales Transactions) 212 732 542 Total Customers 311,615 314,318 313,352
MCF SALESResidential 16,713,964 20,326,974 23,403,113Commercial - General Service 9,308,766 10,951,838 11,882,928Industrial 405,442 544,046 587,953Interdepartmental 35,733 57,180 64,482Spot Gas 1,877,488 2,017,649 2,046,775
Subtotal 28,341,393 33,897,687 37,985,251LNG 654,780 1,062,917 775,168CNG 10,949 44,204 31,799 Total MCF Sales 29,007,122 35,004,808 38,792,218
OPERATING REVENUE/CUSTOMERResidential $ 415.00 $ 515.27 $ 713.25Commercial - General Service 2,552.81 3,183.44 4,362.00 Industrial 54,243.32 82,899.71 110,737.70 Interdepartmental 14,396.17 26,332.96 33,210.31 Transported Gas 64,801.17 47,657.51 55,776.96 Spot Gas 193,605.29 180,383.00 249,759.76
OPERATING REVENUE/MCF*Residential $ 7.190 $ 7.388 $ 8.859Commercial - General Service 5.933 6.375 8.045 Industrial 4.147 4.876 6.404 Interdepartmental 4.835 5.526 7.210 Spot Gas 3.403 3.934 5.491
MCF/CUSTOMERResidential 57.72 69.74 80.51Commercial - General Service 430.28 499.38 542.18Industrial 13,078.77 17,001.44 17,292.74Interdepartmental 2,977.75 4,765.00 4,605.86Spot Gas 56,893.58 45,855.66 45,483.89
*See graph on M-6.

MANAGEMENT’S DISCUSSION AND ANALYSIS FOR THE YEARS ENDED DECEMBER 31, 2016 AND 2015 (Continued)
M-5
STATISTICAL HIGHLIGHTS-WATER DIVISIONYears Ended December 31
CATEGORIES 2016 2015 2014OPERATING REVENUE
Residential $ 49,486,005 $ 41,072,210 $ 41,562,047Commercial - General Service 42,137,657 35,036,929 36,295,016Resale 255,521 571,067 510,950Fire Protection 5,056,147 4,152,650 4,075,927Interdepartmental 55,699 47,425 45,082Miscellaneous 3,611,421 3,742,311 4,781,049Accrued Unbilled Revenue 340,781 545,218 (164,704)Revenue Adjustment for Uncollectibles (1,095,891) (676,130) (924,209) TOTAL OPERATING REVENUE $ 99,847,340 $ 84,491,680 $ 86,181,157
CUSTOMERSResidential 227,171 228,562 228,147Commercial - General Service 20,580 20,844 20,792Resale 12 12 11Fire Protection 5,297 5,270 5,171Interdepartmental 49 52 55 Total Customers 253,109 254,740 254,176
METERED WATER (CCF)Residential 22,442,729 22,853,763 23,208,066Commercial - General Service 26,146,652 26,712,414 28,355,246Resale 122,936 509,467 484,975Interdepartmental 19,093 19,318 19,175 Total CCF Sales 48,731,410 50,094,962 52,067,462
OPERATING REVENUE/CUSTOMERResidential $ 217.84 $ 179.70 $ 182.17Commercial - General Service 2,047.51 1,680.91 1,745.62Resale 21,293.42 47,588.89 46,450.00Fire Protection 954.53 787.98 788.23Interdepartmental 1,136.71 912.02 819.67
OPERATING REVENUE/CCF*Residential $ 2.205 $ 1.797 $ 1.791Commercial - General Service 1.612 1.312 1.280Resale 2.078 1.121 1.054Interdepartmental 2.917 2.455 2.351
CCF/CUSTOMERResidential 98.79 99.99 101.72Commercial - General Service 1,270.49 1,281.54 1,363.76Resale 10,244.67 42,455.58 44,088.64Interdepartmental 389.65 371.50 348.64
*See graph on M-7.

MANAGEMENT’S DISCUSSION AND ANALYSIS FOR THE YEARS ENDED DECEMBER 31, 2016 AND 2015 (Continued)
M-6
GRAPHS Electric Division
Gas Division
$0.0
95
$0.0
97
$0.0
98
$0.0
93
$0.0
94
$0.0
95
$0.0
51
$0.0
58
$0.0
58
2016 2015 2014
Operating Revenue Per KWH
Residential Commercial Industrial
$7.1
90
$7.3
88
$8.8
59
$5.9
33
$6.3
75
$8.0
45
$4.1
47
$4.8
76
$6.4
04
2016 2015 2014
Operating Revenue Per MCF
Residential Commercial Industrial

MANAGEMENT’S DISCUSSION AND ANALYSIS FOR THE YEARS ENDED DECEMBER 31, 2016 AND 2015 (Continued)
M-7
Water Division
$2.2
05
$1.7
97
$1.7
91
$2.0
78
$1.1
21
$1.0
54
2016 2015 2014
Operating Revenue Per CCF
Residential Commercial Resale

MANAGEMENT’S DISCUSSION AND ANALYSIS FOR THE YEARS ENDED DECEMBER 31, 2016 AND 2015 (Continued)
M-8
Bond Ratings MLGW’s Electric Division, Gas Division and Water Division own strong bond ratings. In 2016 all three divisions issued debt to fund a portion of their respective capital improvement programs. During 2016, the Electric Division issued $40 million in debt and the series was assigned ratings of AA+ and Aa2 by Standard and Poor’s (S&P) and Moody’s Investors Service (Moody’s), respectively. Both S&P and Moody’s affirmed the senior-lien underlying ratings at AA+ and Aa2. The Electric Division has total debt outstanding of $341,455 as of December 31, 2016. MLGW’s debt service coverages are 35.01 and 1.60 for the senior and total composite liens, respectively. These coverages are well above the 1.2 and the 1.0 required by the Electric Division bond covenant for the senior lien and subordinate lien debt, respectively. The Gas Division issued $40 million in debt during 2016. The Gas Division’s series was assigned AA- and Aa1 ratings by S&P and Moody’s, respectively. The Gas Division has total debt outstanding of $40,000 as of December 31, 2016. The Gas Division’s debt service coverage is 29.71. This coverage is well above the 1.2 required by the Gas Division bond covenant. The Water Division issued $30 million in debt during 2016. This series was assigned AAA and Aa1 ratings by S&P and Moody’s, respectively and the agencies affirmed the underlying series at the same ratings. The Water Division has debt outstanding of $43,870 as of December 31, 2016. The Water Division’s debt service coverage is 15.54. This coverage is well above the 1.2 required by the Water Division bond covenant. The following tables show MLGW bond ratings and debt administration for the Electric, Gas and Water Divisions as of December 31, 2016: Figure 1: Bond Ratings and Debt Administration for the Electric and Water Divisions
MLGW Bond Ratings Debt Administration (In Thousands) Outstanding Coverage
S&P Moody's Fitch Balance Electric Series Electric Senior $106,105 35.01 2003A AA Aa2 AA+ Electric Subordinate $235,350
2008 AA Aa2 AA+ Electric Composite
2010 AA Aa2 AA+ Coverage Ratio $341,455 1.60 2014 AA+ Aa2
2016 AA+ Aa2 Gas Series Gas $40,000 29.71 2016 AA- Aa1 Water Series Water $43,870 15.54 2014 AAA Aa1 2016 AAA Aa1

MANAGEMENT’S DISCUSSION AND ANALYSIS FOR THE YEARS ENDED DECEMBER 31, 2016 AND 2015 (Continued)
M-9
Analysis of the Electric Division’s Statements of Net Position Condensed financial information comparing the Electric Division’s net position for the past three fiscal years is presented below:
FY16 - FY15 FY15 - FY14Percentage Percentage
2016 2015 Change 2014 Change
Current assets (excluding restricted funds) 487,560$ 524,914$ -7.1% 453,306$ 15.8%Restricted assets 67,923 64,361 5.5% 96,049 -33.0%Other assets 11,210 4,325 159.2% 4,647 -6.9%Prepaid power cost - long-term 112,821 232,517 -51.5% 349,595 -33.5%Utility plant 1,079,463 1,041,753 3.6% 1,018,928 2.2% Total assets 1,758,977 1,867,870 -5.8% 1,922,525 -2.8%
Deferred outflows of resources Employer Pension Contribution 12,271 12,271 - - - Pension liability experience 1,088 - - - - Pension investment earnings experience 39,341 - - - - Accumulated decrease in fair value of hedging derivatives - 40 - 305 -86.9% Unamortized balance of refunded debt 1,499 3,509 -57.3% 6,400 -45.2%
Total assets and deferred outflows 1,813,176 1,883,690 -3.7% 1,929,230 -2.4%
Current liabilities payable from current assets 276,460 301,365 -8.3% 256,756 17.4%Current liabilities payable from restricted assets 33,587 33,092 1.5% 31,086 6.5%Long-term debt 243,701 325,747 -25.2% 450,603 -27.7%Non-current liabilities 81,955 29,556 177.3% 27,711 6.7% Total liabilities 635,703 689,760 -7.8% 766,156 -10.0%
Deferred inflows of resources Pension liability experience 6,252 7,815 -20.0% - - Pension changes of assumptions 8,462 10,577 -20.0% - - Pension investment earnings experience 197 262 -24.8% - -
Total liabilities and deferred inflows 650,614 708,414 -8.2% 766,156 -7.5%
Net position: Net investment in capital assets 958,213 964,812 -0.7% 938,844 2.8% Restricted 19,155 18,534 3.4% 52,900 -65.0% Unrestricted 185,194 191,930 -3.5% 171,330 12.0%Total Net position 1,162,562$ 1,175,276$ -1.1% 1,163,074$ 1.0%
Table 1Electric Division Condensed Statements of Net Position
December 31(In Thousands)

MANAGEMENT’S DISCUSSION AND ANALYSIS FOR THE YEARS ENDED DECEMBER 31, 2016 AND 2015 (Continued)
M-10
Assets 2016 Compared to 2015: As of December 31, 2016, total assets and deferred outflows were $1.81 billion, a decrease of $70.5 million, or 3.7%, compared to December 31, 2015. This decrease is primarily due to a decrease in prepaid power cost (long-term) of $119.7 million due to amortization (see Note 12), a decrease in current assets (excluding restricted funds) of $37.4 million, and a decrease in the deferred unamortized balance of refunding debt for Series 2010 Bonds of $2.0 million, partially offset by an increase in pension investment earnings experience of $39.3 million, net utility plant of $37.7 million resulting from additions to electric plant in-service, other assets of $6.9 million, restricted assets of $3.6 million and pension liability experience of $1.1 million. The decrease in current assets is primarily the result of a decrease in cash and cash equivalents of $47.1 million due, in part, to the timing of the in lieu of tax payments and transfers to the City paid in 2016, a decrease in investments of $2.9 million and a decrease in inventories of $1.5 million, offset by increases in unbilled revenues of $6.3 million due, in part, to delayed customer billings as a result from the transitional issues associated with the mass deployment of smart meters, accounts receivable less allowance for doubtful accounts of $4.1 million, and prepaid power costs of $2.6 million. 2015 Compared to 2014: As of December 31, 2015, total assets and deferred outflows were $1.88 billion, a decrease of $45.5 million, or 2.4%, compared to December 31, 2014. This decrease is primarily due to a decrease in prepaid power cost (long-term) of $117.1 million due to amortization (see Note 12) and a decrease in restricted assets due to depleting the Series 2014 revenue bond proceeds for capital expenditures of $34.9 million, partially offset by increases in current assets (excluding restricted funds) of $71.6 million and net utility plant of $22.8 million resulting from additions to electric plant in-service. The increase in current assets is primarily the result of an increase in cash and cash equivalents of $59.1 million due in part to the timing of the in lieu of tax payments and transfers to the City of $21.0 million. These disbursements were not paid until 2016. Other contributors to the increase in current assets include investments of $17.8 million, prepaid power cost (current) of $3.5 million and inventories of $2.1 million, offset in part by decreases in accounts receivable less allowance for doubtful accounts of $7.4 million and unbilled revenues of $3.4 million. The deferred outflows of resources increased $9.1 million due to employer pension contribution of $12.3 million, offset in part by the decrease in the deferred unamortized balance of refunding debt for Series 2010 Bonds of $2.9 million. Capital Assets and Construction Activities 2016 Compared to 2015: The Electric Division’s utility plant assets, net of accumulated depreciation were $1.08 billion as of December 31, 2016, an increase of 3.6% over fiscal year 2015. During 2016, the Electric Division expended $94.2 million on construction activities and capital purchases, an increase of $23.5 million, or 33.3%, compared to fiscal year 2015. Major Electric Division construction activities included the purchase of meters and metering equipment ($21.8 million), substation and transmission projects ($16.4 million), data processing equipment and upgrades ($8.8 million), extensions to serve new customers ($8.0 million), street and leased outdoor lighting ($7.2 million), the purchase of distribution and network transformers ($6.9 million), smart meter telecommunication infrastructure ($4.1 million), and the purchase of transportation and power operated equipment ($4.1 million). Other significant Electric Division capital expenditures consisted of the replacement of poles ($2.6 million), replacement of feeder and defective cable ($2.0 million), communication network improvements ($1.5 million), and new circuits out of substations ($0.9 million).

MANAGEMENT’S DISCUSSION AND ANALYSIS FOR THE YEARS ENDED DECEMBER 31, 2016 AND 2015 (Continued)
M-11
2015 Compared to 2014: The Electric Division’s utility plant assets, net of accumulated depreciation were $1.04 billion as of December 31, 2015, an increase of 2.2% over fiscal year 2014. During 2015, the Electric Division expended $70.7 million on construction activities and capital purchases, an increase of $3.6 million, or 5.4%, compared to fiscal year 2014. Major Electric Division construction activities included substation and transmission projects ($13.5 million), smart meter telecommunication infrastructure ($8.6 million), extensions to serve new customers ($7.8 million), the purchase of meters and metering equipment ($7.6 million), the purchase of transportation and power operated equipment ($6.4 million), street and leased outdoor lighting ($5.4 million), the purchase of distribution and network transformers ($4.6 million), replacement of feeder and defective cable ($3.5 million), and utility monitoring systems ($2.9 million). Other significant Electric Division capital expenditures consisted of relocation of facilities to accommodate road improvements ($1.7 million), data processing equipment and upgrades ($1.6 million), communication network improvements ($1.5 million), replacement of poles ($0.9 million), and smart grid ($0.9 million). Liabilities
2016 Compared to 2015:
As of December 31, 2016, total liabilities and deferred inflows were $650.6 million, representing a $57.8 million (8.2%) decrease compared to $708.4 million at December 31, 2015. These decreases are attributable to decreases in long-term debt of $82.0 million, current liabilities payable from current assets of $24.9 million due to a decrease in accrued taxes (payment in lieu of taxes and transfers) of $35.1 million, pension changes of assumptions of $2.1 million, and pension liability experience of $1.6 million, offset in part by an increase in non-current liabilities of $52.4 million due to an increase in the net pension liability-long term of $47.9 million and an increase in customer deposits of $2.4 million. The decrease in long-term debt is due to a reclassification of a portion of long-term debt to the current portion of debt of $117.5 million, offset by an increase in the long-term portion of the issuance of Series 2016 Bonds of $38.7 million and an increase in premium amortization of $0.9 million (see Note 11). 2015 Compared to 2014:
As of December 31, 2015, total liabilities and deferred inflows were $708.4 million, representing a $57.7 million (7.5%) decrease compared to $766.2 million at December 31, 2014. These decreases are attributable to decreases in long-term debt of $124.9 million resulting from a reclassification of a portion of long-term debt to the current portion of debt and premium amortization (see Note 11), offset in part by an increase in current liabilities payable from current assets of $44.6 million due to an increase in accrued taxes (payment in lieu of taxes and transfers) of $36.3 million and current liabilities payable from restricted assets of $2.0 million largely due to an increase in medical benefits. The deferred inflows of resources increased $18.7 million due to the pension changes of assumptions of $10.6 million and the pension liability experience of $7.8 million as a result of GASB 68 implementation in 2015.

MANAGEMENT’S DISCUSSION AND ANALYSIS FOR THE YEARS ENDED DECEMBER 31, 2016 AND 2015 (Continued)
M-12
Net Position 2016 Compared to 2015: As of December 31, 2016, the Electric Division’s total net position (total assets and deferred outflows of resources less total liabilities and deferred inflows of resources) was $1.16 billion, a decrease of $12.7 million, or 1.1%, compared to December 31, 2015. The decrease was due to a decrease in unrestricted net position (used to finance day-to-day operations) of $6.7 million and a decrease in net investment in capital assets of $6.6 million. Eighty-two percent of the net position was related to net investment in capital assets. 2015 Compared to 2014:
As of December 31, 2015, the Electric Division’s total net position (total assets and deferred outflows of resources less total liabilities and deferred inflows of resources) was $1.18 billion, an increase of $12.2 million, or 1.0%, compared to December 31, 2014. The increase was due to increases in unrestricted net position (used to finance day-to-day operations) of $20.6 million and net investment in capital assets of $26.0 million, partially offset by a decrease in restricted net position of $34.4 million. Eighty-two percent of the net position was related to net investment in capital assets.

MANAGEMENT’S DISCUSSION AND ANALYSIS FOR THE YEARS ENDED DECEMBER 31, 2016 AND 2015 (Continued)
M-13
Figure 2: Electric Division’s Net Position (in thousands):
2016 2015 2014
$185,194 $191,930 $171,330
$19,155 $18,534 $52,900
958,213 964,812 938,844
Net Position By Component
Net investment incapital assetsRestricted
Unrestricted
MANAGEMENT’S DISCUSSION AND ANALYSIS FOR THE YEARS ENDED DECEMBER 31, 2016 AND 2015 (Continued)
M-14
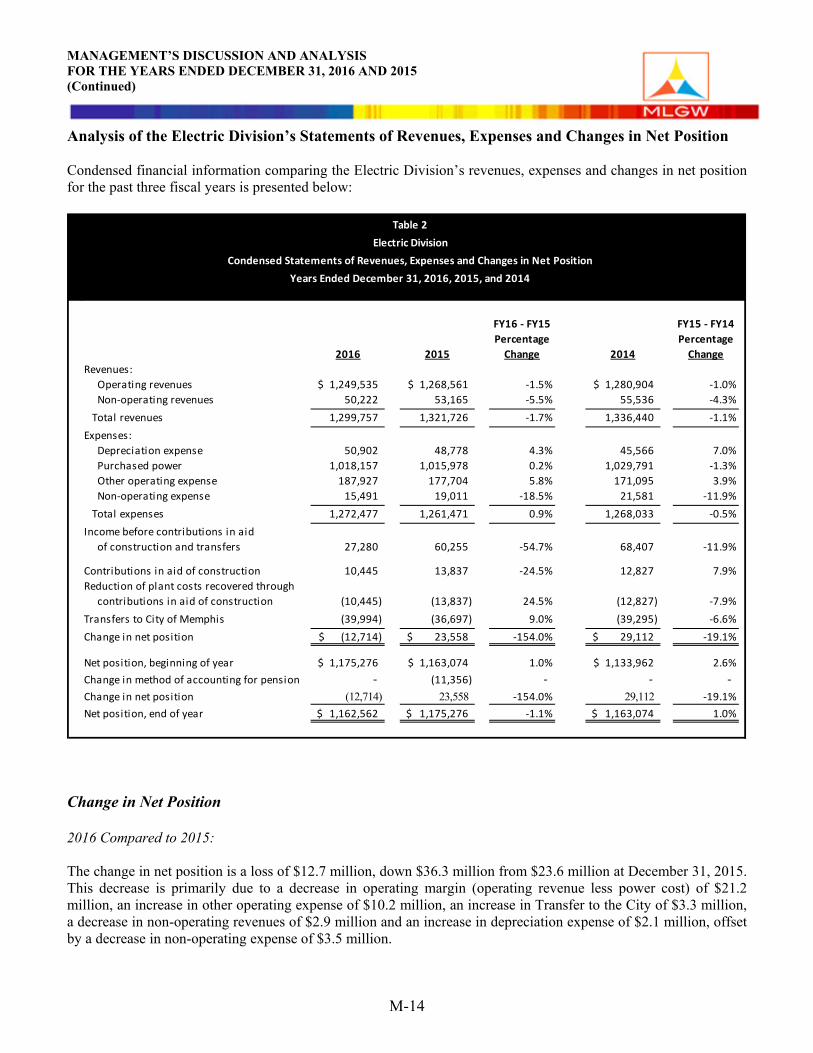
Analysis of the Electric Division’s Statements of Revenues, Expenses and Changes in Net Position Condensed financial information comparing the Electric Division’s revenues, expenses and changes in net position for the past three fiscal years is presented below:
Change in Net Position 2016 Compared to 2015: The change in net position is a loss of $12.7 million, down $36.3 million from $23.6 million at December 31, 2015. This decrease is primarily due to a decrease in operating margin (operating revenue less power cost) of $21.2 million, an increase in other operating expense of $10.2 million, an increase in Transfer to the City of $3.3 million, a decrease in non-operating revenues of $2.9 million and an increase in depreciation expense of $2.1 million, offset by a decrease in non-operating expense of $3.5 million.
FY16 - FY15 FY15 - FY14Percentage Percentage
2016 2015 Change 2014 ChangeRevenues: Operating revenues 1,249,535$ 1,268,561$ -1.5% 1,280,904$ -1.0% Non-operating revenues 50,222 53,165 -5.5% 55,536 -4.3% Total revenues 1,299,757 1,321,726 -1.7% 1,336,440 -1.1%Expenses: Depreciation expense 50,902 48,778 4.3% 45,566 7.0% Purchased power 1,018,157 1,015,978 0.2% 1,029,791 -1.3% Other operating expense 187,927 177,704 5.8% 171,095 3.9% Non-operating expense 15,491 19,011 -18.5% 21,581 -11.9% Total expenses 1,272,477 1,261,471 0.9% 1,268,033 -0.5%Income before contributions in aid of construction and transfers 27,280 60,255 -54.7% 68,407 -11.9%
Contributions in aid of construction 10,445 13,837 -24.5% 12,827 7.9%Reduction of plant costs recovered through contributions in aid of construction (10,445) (13,837) 24.5% (12,827) -7.9%Transfers to City of Memphis (39,994) (36,697) 9.0% (39,295) -6.6%Change in net position (12,714)$ 23,558$ -154.0% 29,112$ -19.1%
Net position, beginning of year 1,175,276$ 1,163,074$ 1.0% 1,133,962$ 2.6%Change in method of accounting for pension - (11,356) - - - Change in net position (12,714) 23,558 -154.0% 29,112 -19.1%Net position, end of year 1,162,562$ 1,175,276$ -1.1% 1,163,074$ 1.0%
Table 2Electric Division
Condensed Statements of Revenues, Expenses and Changes in Net PositionYears Ended December 31, 2016, 2015, and 2014

MANAGEMENT’S DISCUSSION AND ANALYSIS FOR THE YEARS ENDED DECEMBER 31, 2016 AND 2015 (Continued)
2015 Compared to 2014:
The change in net position is $23.6 million, down $5.5 million from $29.1 million at December 31, 2014. This decrease is primarily due to an increase in other operating expense of $6.6 million, an increase in depreciation expense of $3.2 million and a decrease in non-operating revenue of $2.4 million, offset by a decrease in Transfer to the City of $2.6 million, a decrease in non-operating expense of $2.6 million (resulting from lower debt expense), and an increase in operating margin (operating revenue less power cost) of $1.5 million.
Revenues
2016 Compared to 2015:
Total revenues were $1.30 billion for fiscal year 2016, a decrease of $22.0 million, or 1.7%, from fiscal year 2015. Operating revenues were $1.25 billion in 2016, a decrease of $19.0 million from 2015. The decrease in operating revenue is due partially to a rate decrease for residential and small commercial customers implemented in January 2016 and to lower sales volume resulting from temporary transitional issues associated with the mass deployment of smart meters, offset, in part, by the Tennessee Valley Authority (“TVA”) 1.5% rate increase effective in October 2016. There was an increase in purchased power cost of $2.2 million due to higher purchase volumes and the TVA rate increase. Non-operating revenue decreased $2.9 million to $50.2 million in 2016 as a result of a decrease in other income prepay credit, related to the Electric TVA Prepay Bonds of $3.8 million, offset by an increase in other income TVA transmission credit of $0.8 million.
2015 Compared to 2014:
Total revenues were $1.32 billion for fiscal year 2015, a decrease of $14.7 million, or 1.1%, from fiscal year 2014. Operating revenues were $1.27 billion in 2015, a decrease of $12.3 million from 2014. The decrease in operating revenue is due to lower power costs per unit that are passed along to customers through the fuel cost adjustor, lower sales volume and lower accrued/unbilled revenue, offset in part by the fuel cost adjuster (“FCA”) and the TVA 1.50% rate increase effective in October 2015. There was a corresponding decrease in purchased power cost of $13.8 million due to lower power costs per unit, offset in part by the TVA rate increase. Non-operating revenue decreased $2.4 million to $53.2 million in 2015 as a result of a decrease in other income prepay credit, related to the Electric TVA Prepay Bonds of $3.6 million, offset by increases in transmission credits of $1.1 million and allowance for funds used during construction of $0.2 million.
Expenses
2016 Compared to 2015:
For fiscal year 2016, total expenses were $1.27 billion, a 0.9%, or $11.0 million, increase from fiscal year 2015 total expenses of $1.26 billion. This increase was a result of an increase in other operating expense of $10.2 million, purchased power cost of $2.2 million and depreciation expense of $2.1 million, offset by a decrease in non-operating expense of $3.5 million. The decrease in non-operating expense is primarily the result of lower interest expense associated with the Series 2010 Bonds. The increase in other operating expense is due, in part, to increases in operating expenses of $10.5 million and maintenance expense of $0.6 million, offset by a decrease in payment in lieu of taxes (“PILOT”) of $0.9 million.
M-15

MANAGEMENT’S DISCUSSION AND ANALYSIS FOR THE YEARS ENDED DECEMBER 31, 2016 AND 2015 (Continued)
M-16
2015 Compared to 2014: For fiscal year 2015, total expenses were $1.26 billion, a 0.5%, or $6.6 million, decrease from fiscal year 2014 total expenses of $1.27 billion. This decrease was a result of a decrease in purchased power cost of $13.8 million, or 1.3%, and non-operating expense of $2.6 million, offset by increases in other operating expense of $6.6 million and depreciation expense of $3.2 million. The decrease in non-operating expense is primarily the result of lower interest expense associated with the Series 2010 Bonds. The increase in other operating expense is due, in part, to increases in operating expenses of $2.7 million, maintenance expense of $2.3 million and payment in lieu of taxes (“PILOT”) of $1.6 million. Contributions in aid of construction
2016 Compared to 2015: Contributions in aid of construction (“CIAC”) were $10.4 million for fiscal year 2016, a decrease of $3.4 million, or 24.5%, from fiscal year 2015. This decrease was mainly the result of decreases in economic development projects of $2.4 million, cancelled contracts of $1.8 million, and grants of $1.1 million, offset by an increase in damage to a substation of $1.1 million. 2015 Compared to 2014: Contributions in aid of construction (“CIAC”) were $13.8 million for fiscal year 2015, an increase of $1.0 million, or 7.9%, from fiscal year 2014. This increase was mainly the result of increases in economic development projects of $1.6 million and cancelled contracts of $0.9 million, offset by a decrease in construction activity. Transfers to the City of Memphis 2016 Compared to 2015: MLGW’s transfer to the City of Memphis is based on the formula provided by the May 29, 1987 TVA Power Contract Amendment (Supp. No. 8). The formula includes a maximum property tax equivalency calculation plus 4% of operating revenue less power costs (three-year average). Transfers to the city represent the Electric Division’s in lieu of tax payment. The transfer for 2016 increased by $3.3 million due to an increase in net plant investment of $3.1 million and an increase in three-year average revenues of $0.2 million. 2015 Compared to 2014: MLGW’s transfer to the City is based on the formula provided by the May 29, 1987 TVA Power Contract Amendment (Supp. No. 8). The formula includes a maximum property tax equivalency calculation plus 4% of operating revenue less power costs (three-year average). Transfers to the city represent the Electric Division’s in lieu of tax payment. The transfer for 2015 decreased by $2.6 million due to a $1.9 million reduction in the tax equalization rate, a decrease of $1.5 million resulting from higher PILOT to Shelby County and the City requesting $0.5 million less than the maximum allowed by TVA contract. The decreases are partially offset by an increase of $1.4 million due to increased net plant investment and operating revenue less power costs (three-year average).
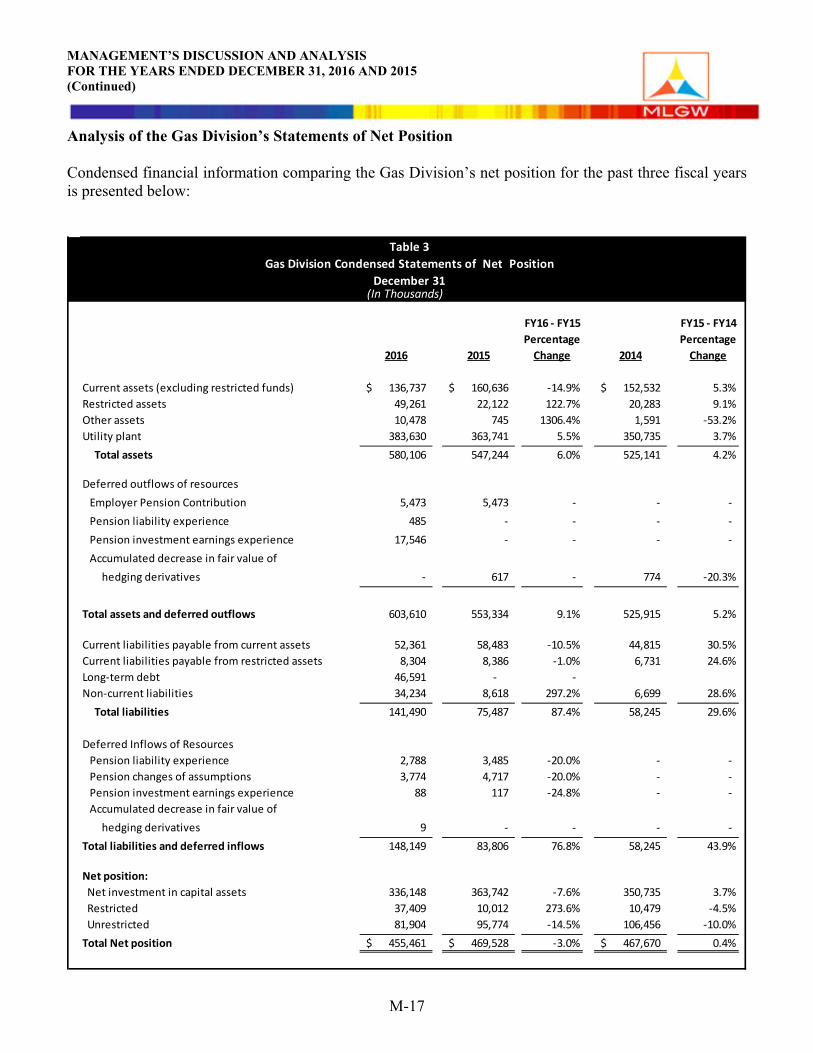
MANAGEMENT’S DISCUSSION AND ANALYSIS FOR THE YEARS ENDED DECEMBER 31, 2016 AND 2015 (Continued)
M-17
Analysis of the Gas Division’s Statements of Net Position Condensed financial information comparing the Gas Division’s net position for the past three fiscal years is presented below:
FY16 - FY15 FY15 - FY14Percentage Percentage
2016 2015 Change 2014 Change
Current assets (excluding restricted funds) 136,737$ 160,636$ -14.9% 152,532$ 5.3%Restricted assets 49,261 22,122 122.7% 20,283 9.1%Other assets 10,478 745 1306.4% 1,591 -53.2%Utility plant 383,630 363,741 5.5% 350,735 3.7% Total assets 580,106 547,244 6.0% 525,141 4.2%
Deferred outflows of resources Employer Pension Contribution 5,473 5,473 - - - Pension liability experience 485 - - - - Pension investment earnings experience 17,546 - - - - Accumulated decrease in fair value of hedging derivatives - 617 - 774 -20.3%
Total assets and deferred outflows 603,610 553,334 9.1% 525,915 5.2%
Current liabilities payable from current assets 52,361 58,483 -10.5% 44,815 30.5%Current liabilities payable from restricted assets 8,304 8,386 -1.0% 6,731 24.6%Long-term debt 46,591 - - Non-current liabilities 34,234 8,618 297.2% 6,699 28.6% Total liabilities 141,490 75,487 87.4% 58,245 29.6%
Deferred Inflows of Resources Pension liability experience 2,788 3,485 -20.0% - - Pension changes of assumptions 3,774 4,717 -20.0% - - Pension investment earnings experience 88 117 -24.8% - - Accumulated decrease in fair value of hedging derivatives 9 - - - - Total liabilities and deferred inflows 148,149 83,806 76.8% 58,245 43.9%
Net position: Net investment in capital assets 336,148 363,742 -7.6% 350,735 3.7% Restricted 37,409 10,012 273.6% 10,479 -4.5% Unrestricted 81,904 95,774 -14.5% 106,456 -10.0%Total Net position 455,461$ 469,528$ -3.0% 467,670$ 0.4%
Table 3Gas Division Condensed Statements of Net Position
December 31(In Thousands)
MANAGEMENT’S DISCUSSION AND ANALYSIS FOR THE YEARS ENDED DECEMBER 31, 2016 AND 2015 (Continued)
M-18
Assets 2016 Compared to 2015: As of December 31, 2016 total assets and deferred outflows were $603.6 million, an increase of $50.3 million, or 9.1%, compared to December 31, 2015. This increase is due, in part, to an increase in restricted assets of $27.1 million due to the issuance of Series 2016 Bonds, net utility plant of $19.9 million, pension investment earnings experience of $17.5 million, and other assets of $9.7 million, offset by a decrease in current assets (excluding restricted funds) of $23.9 million. Current assets decreased due to a decrease in cash and cash equivalents of $25.2 million due, in part, to a decrease in natural gas sales and margin (revenue less gas costs). 2015 Compared to 2014: As of December 31, 2015, total assets and deferred outflows were $553.3 million, an increase of $27.4 million, or 5.2%, compared to December 31, 2014. This increase is due, in part, to increases in net utility plant of $13.0 million, current assets (excluding restricted funds) of $8.1 million, deferred outflow of resources related to employer pension contribution of $5.5 million and restricted assets of $1.8 million. The increase in current assets is primarily due to an increase in cash and equivalents of $19.3 million and an increase in investments of $2.6 million, offset in part by a decrease in accounts receivable (less allowance for doubtful accounts) of $7.1 million and a decrease in unbilled revenue of $5.8 million. Capital Assets and Construction Activities 2016 Compared to 2015: The Gas Division’s utility plant assets, net of accumulated depreciation were $383.6 million as of December 31, 2016, an increase of 5.5% over fiscal 2015. During 2016, the Gas Division expended $42.8 million on construction activities and equipment purchases, an increase of $13.5 million, or 45.8%, compared to fiscal year 2015. Major Gas Division construction activities included the purchase of meters and metering equipment ($20.0 million), the replacement of the MLGW mainframe system ($7.5 million), retrofitting of cast iron and steel taps ($4.7 million), and the purchase of transportation and power operated equipment ($2.9 million). Other significant Gas Division expenditures included pipeline integrity ($1.8 million), extensions to serve new customer ($1.5 million), purchase of right-of-way and property ($0.7 million), alternative fueling infrastructure ($0.7 million), and building upgrades to various MLGW facilities ($0.5 million). 2015 Compared to 2014:
The Gas Division’s utility plant assets, net of accumulated depreciation were $363.7 million as of December 31, 2015, an increase of 3.7% over fiscal 2014. During 2015, the Gas Division expended $29.3 million on construction activities and equipment purchases, an increase of $1.7 million or 6.3% compared to fiscal year 2014. Major Gas Division construction activities included the replacement of the MLGW mainframe system ($8.9 million), purchase of meters and metering equipment ($4.8 million), purchases of transportation and power operated equipment ($4.6 million), buildings and structures ($2.6 million), and the retrofitting of cast iron and steel taps ($2.4 million). Other significant Gas Division expenditures included pipeline integrity ($2.3 million), extensions to serve new customers ($1.6 million), alternative fueling infrastructure ($0.5 million), and purchase of right-of-way and property ($0.5 million).
MANAGEMENT’S DISCUSSION AND ANALYSIS FOR THE YEARS ENDED DECEMBER 31, 2016 AND 2015 (Continued)
M-19
Liabilities 2016 Compared to 2015: At December 31, 2016, total liabilities and deferred inflows were $148.1 million, representing a $64.3 million (76.8%) increase compared to $83.8 million at December 31, 2015. This increase is due, in part, to increases in long-term debt due to the issuance of Series 2016 Bonds of $46.6 million and non-current liabilities of $25.6 million due, in part, to the net pension liability of $21.3 million, offset by a decrease in current liabilities payable from current assets of $6.1 million and a decrease in pension changes of assumptions of $0.9 million. The decrease in current liabilities payable from current assets is due to a decrease in accrued taxes (PILOT and transfers) of $10.9 million and a decrease in other accounts payable and liabilities of $9.2 million, offset by an increase in accounts payable-purchased gas of $13.4 million. 2015 Compared to 2014: At December 31, 2015, total liabilities and deferred inflows were $83.8 million, representing a $25.6 million (43.9%) increase compared to $58.2 million at December 31, 2014. This increase is due, in part, to increases in current liabilities payable from current assets of $13.7 million, non-current liabilities of $1.9 million, and current liabilities payable from restricted assets of $1.7 million, due in part to an increase in medical benefits. The deferred inflows of resources increased due to pension changes of assumptions of $4.7 million and the pension liability experience of $3.5 million as a result of GASB 68 implementation in 2015. The increase in current liabilities payable from current assets is due to other accounts payable and liabilities of $15.1 million and accrued taxes (PILOT and transfers) of $12.3 million, offset in part by a decrease in accounts payables – purchased gas of $13.5 million. Non-current liabilities increased in part due to increases in the net pension liability of $0.9 million and customer deposits of $0.7 million. Net Position
2016 Compared to 2015: As of December 31, 2016, the Gas Division’s total net position (total assets and deferred outflows of resources less total liabilities and deferred inflows of resources) was $455.5 million, a decrease of $14.1 million, or 3.0%, from December 31, 2015. The decrease is due, in part, to a decrease in net investment in capital assets of $27.6 million and a decrease in unrestricted net position (used to finance day-to-day operations) of $13.8 million, offset, in part, by an increase in restricted net position of $27.4 million. Seventy-four percent of the net position was related to net investment in capital assets. 2015 Compared to 2014: As of December 31, 2015, the Gas Division’s total net position (total assets and deferred outflows of resources less total liabilities and deferred inflows of resources) was $469.5 million, an increase of $1.9 million, or 0.4%, from December 31, 2014. Seventy-seven percent of the net position was related to net investment in capital assets, which accounts for $13.0 million of the increase, offset in part by a decrease in unrestricted net position (used to finance day-to-day operations) of $10.7 million, or 10.0%.

MANAGEMENT’S DISCUSSION AND ANALYSIS FOR THE YEARS ENDED DECEMBER 31, 2016 AND 2015 (Continued)
M-20
Figure 3: Gas Division’s Net Position (in thousands):
2016 2015 2014
$81,904 $95,774 $106,456
$37,409 $10,012 $10,479
336,148 363,742 350,735
Net Position By Component
Net investmentin capital assetsRestricted
Unrestricted

MANAGEMENT’S DISCUSSION AND ANALYSIS FOR THE YEARS ENDED DECEMBER 31, 2016 AND 2015 (Continued)
M-21
Analysis of the Gas Division’s Statements of Revenues, Expenses and Changes in Net Position Condensed financial information comparing the Gas Division’s revenues, expenses and changes in net position for the past three fiscal years is presented below:
Change in Net Position 2016 Compared to 2015: The change in net position is a loss of $14.1 million, down $21.0 million from December 31, 2015. This decrease is primarily due to a decrease in operating margin (operating revenue less gas cost) of $13.2 million resulting mainly from lower gas sales volume, an increase in other operating expense of $5.6 million, an increase in transfers to the City of $1.0 million, and an increase in depreciation expense of $0.6 million.
FY16 - FY15 FY15 - FY14Percentage Percentage
2016 2015 Change 2014 Change
Revenues: Sales, service and other operating revenues 198,931$ 243,525$ -18.3% 326,693$ -25.5% Transported gas revenue 6,945 6,380 8.9% 7,119 -10.4% Non-operating revenues 98 326 -69.9% (216) 250.9% Total revenues 205,974 250,231 -17.7% 333,596 -25.0%Expenses: Depreciation expense 15,251 14,660 4.0% 13,365 9.7% Purchased gas 92,183 122,973 -25.0% 201,362 -38.9% Other operating expense 94,703 89,124 6.3% 91,677 -2.8% Non-operating expense 379 - - - - Total expenses 202,516 226,757 -10.7% 306,404 -26.0%Income before contributions in aid of construction and transfers 3,458 23,474 -85.3% 27,192 -13.7%
Contributions in aid of construction 38,118 2,316 1545.9% 1,283 80.6%Reduction of plant costs recovered through contributions in aid of construction (38,118) (2,316) -1545.9% (1,283) -80.6%Transfers to City of Memphis (17,525) (16,551) 5.9% (17,320) -4.4%Change in net position (14,067)$ 6,923$ -303.2% 9,872$ -29.9%
Net position, beginning of year 469,528$ 467,670$ 0.4% 457,798$ 2.2%Change in method of accounting for pension - (5,065) - - - Change in net position (14,067) 6,923 -303.2% 9,872 -29.9%Net position, end of year 455,461$ 469,528$ -3.0% 467,670$ 0.4%
Table 4Gas Division
Condensed Statements of Revenues, Expenses and Changes in Net PositionYears Ended December 31, 2016, 2015, and 2014
(In Thousands)

MANAGEMENT’S DISCUSSION AND ANALYSIS FOR THE YEARS ENDED DECEMBER 31, 2016 AND 2015 (Continued)
M-22
2015 Compared to 2014: The change in net position is $6.9 million, down $2.9 million from December 31, 2014. This decrease is primarily due to a decrease in operating margin (operating revenue less gas cost) of $5.5 million resulting mainly from lower gas sales volume and an increase in depreciation expense of $1.3 million, offset in part by decreases in other operating expense of $2.6 million and transfers to the City of $0.8 million. Revenues 2016 Compared to 2015: Total revenues were $206.0 million for fiscal year 2016, a decrease of 17.7% from fiscal year 2015. Sales, service and other operating revenues were $198.9 million, a decrease of $44.6 million, or 18.3%, from 2015. There was a decrease in gas sales and lower gas costs that are passed along to customers by a purchase gas adjustment (“PGA”). There was a corresponding decrease in purchased gas cost of $30.8 million, or 25.0%, due to lower purchased volumes and lower gas cost per unit. Transported gas revenue increased $0.6 million, or 8.9%, and non-operating revenue decreased $0.2 million, compared to last fiscal year. 2015 Compared to 2014: Total revenues were $250.2 million for fiscal year 2015, a decrease of 25.0% from fiscal year 2014. Sales, service and other operating revenues were $243.5 million, a decrease of $83.2 million, or 25.5%, from 2014. There was a decrease in gas sales and lower gas costs that are passed along to customers by a purchase gas adjustment (“PGA”). There was a corresponding decrease in purchased gas cost of $78.4 million, or 38.9%, due to lower purchased volumes and lower gas cost per unit. Transported gas revenue decreased $0.7 million, or 10.4%, and non-operating revenue increased $0.5 million, compared to last fiscal year. Expenses 2016 Compared to 2015: For fiscal year 2016, total expenses were $202.5 million at December 31, 2016, a 10.7% decrease over fiscal year 2015 expenses of $226.8 million. Purchased gas cost was $92.2 million, down 25.0%, from $123.0 million at December 31, 2015, as a result of a decrease in natural gas purchases and lower gas costs per unit than last year. Other operating expense was $94.7 million at December 31, 2016, up $5.6 million, or 6.3%, from $89.1 million at December 31, 2015, primarily attributable to an increase in operation costs of $6.2 million and an increase in PILOT of $0.7 million, offset by a decrease in maintenance expense of $1.3 million. 2015 Compared to 2014: For fiscal year 2015, total expenses were $226.8 million at December 31, 2015, a 26.0% decrease over fiscal year 2014 expenses of $306.4 million. Purchased gas cost was $123.0 million, down 38.9%, from $201.4 million at December 31, 2014, as a result of a decrease in natural gas purchases and lower gas costs per unit than last year. Other operating expense was $89.1 million at December 31, 2015, down $2.6 million , or 2.8%, from $91.7 million at December 31, 2014, primarily attributable to a reduction in operation costs of $2.6 million and PILOT of $0.2 million, offset in part by an increase in maintenance expenses of $0.2 million.

MANAGEMENT’S DISCUSSION AND ANALYSIS FOR THE YEARS ENDED DECEMBER 31, 2016 AND 2015 (Continued)
M-23
Contributions in aid of construction 2016 Compared to 2015: CIAC were $38.1 million for fiscal year 2016, an increase of $35.8 million (1545.1%) from fiscal year 2015. This increase was mainly the result of the TVA pipeline project of $36.4 million, offset by a decrease in construction activity of $0.6 million. 2015 Compared to 2014: CIAC were $2.3 million for fiscal year 2015, an increase of $1.0 million (80.6%) from fiscal year 2014. This increase was mainly the result of increases in economic development projects of $0.5 million, donated easements of $0.4 million and construction activity of $0.3 million, offset by $0.1 million in cancelled contracts. Transfers to the City of Memphis 2016 Compared to 2015: MLGW’s transfer to the City of Memphis is based on the formula provided by the State of Tennessee Municipal Gas System Tax Equivalent Law of 1987. The formula includes a maximum property tax equivalency calculation plus 4% of operating revenue less power costs (three-year average). Transfers to the City represent the Gas Division’s in lieu of tax payment. The transfer for 2016 increased by $1.0 million, due to an increase of $1.1 million in net plant investment, offset by a decrease of $0.1 million due to a decrease in three-year average revenues. 2015 Compared to 2014: MLGW’s transfer to the City is based on the formula provided by the State of Tennessee Municipal Gas System Tax Equivalent Law of 1987. The formula includes a maximum property tax equivalency calculation plus 4% of operating revenue less power costs (three-year average). Transfers to the City represent the Gas Division’s PILOT. The transfer for 2015 decreased by $0.8 million due to a decrease of $1.0 million resulting from the City requesting less than the maximum allowed by statute and $0.8 million due to a decrease in the tax equalization rate, offset in part by an increase of $0.8 million due to net plant investment and three-year average revenues and an increase of $0.2 million resulting from lower PILOT to Shelby County.
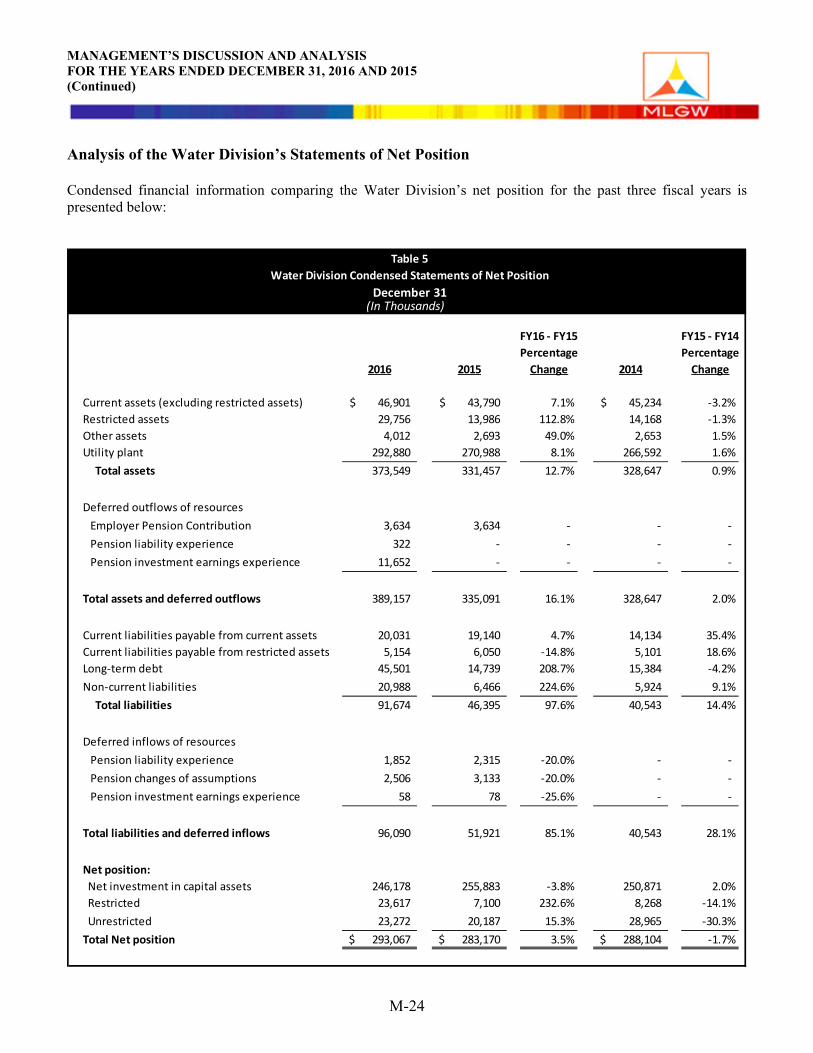
MANAGEMENT’S DISCUSSION AND ANALYSIS FOR THE YEARS ENDED DECEMBER 31, 2016 AND 2015 (Continued)
M-24
Analysis of the Water Division’s Statements of Net Position Condensed financial information comparing the Water Division’s net position for the past three fiscal years is presented below:
FY16 - FY15 FY15 - FY14Percentage Percentage
2016 2015 Change 2014 Change
Current assets (excluding restricted assets) 46,901$ 43,790$ 7.1% 45,234$ -3.2%Restricted assets 29,756 13,986 112.8% 14,168 -1.3%Other assets 4,012 2,693 49.0% 2,653 1.5%Utility plant 292,880 270,988 8.1% 266,592 1.6% Total assets 373,549 331,457 12.7% 328,647 0.9%
Deferred outflows of resources Employer Pension Contribution 3,634 3,634 - - - Pension liability experience 322 - - - - Pension investment earnings experience 11,652 - - - -
Total assets and deferred outflows 389,157 335,091 16.1% 328,647 2.0%
Current liabilities payable from current assets 20,031 19,140 4.7% 14,134 35.4%Current liabilities payable from restricted assets 5,154 6,050 -14.8% 5,101 18.6%Long-term debt 45,501 14,739 208.7% 15,384 -4.2%Non-current liabilities 20,988 6,466 224.6% 5,924 9.1% Total liabilities 91,674 46,395 97.6% 40,543 14.4%
Deferred inflows of resources Pension liability experience 1,852 2,315 -20.0% - - Pension changes of assumptions 2,506 3,133 -20.0% - - Pension investment earnings experience 58 78 -25.6% - -
Total liabilities and deferred inflows 96,090 51,921 85.1% 40,543 28.1%
Net position: Net investment in capital assets 246,178 255,883 -3.8% 250,871 2.0% Restricted 23,617 7,100 232.6% 8,268 -14.1% Unrestricted 23,272 20,187 15.3% 28,965 -30.3%Total Net position 293,067$ 283,170$ 3.5% 288,104$ -1.7%
Table 5Water Division Condensed Statements of Net Position
December 31(In Thousands)
MANAGEMENT’S DISCUSSION AND ANALYSIS FOR THE YEARS ENDED DECEMBER 31, 2016 AND 2015 (Continued)
M-25
Assets 2016 Compared to 2015: As of December 31, 2016, total assets and deferred outflows were $389.2 million, an increase of $54.1 million compared to December 31, 2015. The increase is due, in part, to increases in net utility plant of $21.9 million, restricted assets of $15.8 million due, in part, to the issuance of Series 2016 Bonds, and pension investment earnings experience of $11.7 million. 2015 Compared to 2014: As of December 31, 2015, total assets and deferred outflows were $335.1 million, an increase of $6.4 million compared to December 31, 2014. The increase is due, in part, to an increase in net utility plant of $4.4 million and an increase in deferred outflow of resources related to employer pension contribution of $3.6 million, offset in part by a decrease in current assets (excluding restricted assets) of $1.4 million. The decrease in current assets is attributable to a decrease in investments of $2.5 million, offset in part by an increase in accounts receivable (less allowance for doubtful accounts) of $0.6 million and an increase in unbilled revenue of $0.5 million. Capital Assets and Construction Activities 2016 Compared to 2015: The Water Division’s utility plant assets, net of accumulated depreciation were $292.9 million as of December 31, 2016, an increase of 8.1% as compared to December 31, 2015. During 2016, the Water Division expended $31.0 million on construction activities and equipment purchases, an increase of $19.4 million, or 167.2%, compared to fiscal year 2015. Major Water Division construction activities included the purchase of meters ($13.2 million), building upgrades to various pumping stations and other MLGW buildings ($2.9 million), extension to serve new customers ($2.3 million), upgrades to Mallory Pumping Station ($2.3 million), and upgrades to Davis Pumping Station ($2.0 million). Other significant expenditures include upgrades to Allen Pumping Station ($1.1 million), the purchase of transportation and power operated equipment ($1.0 million), the relocation of facilities to accommodate street improvements ($0.9 million), upgrades to Shaw Pumping Station ($0.7 million), and upgrades to Palmer Pumping Station ($0.5 million). 2015 Compared to 2014:
The Water Division’s utility plant assets, net of accumulated depreciation were $271.0 million as of December 31, 2015, an increase of 1.6% as compared to December 31, 2014. During 2015, the Water Division expended $11.6 million on construction activities and equipment purchases, a decrease of $0.3 million or 2.5% compared to fiscal year 2014. Major Water Division construction activities included the purchase of meters ($2.6 million), extension to serve new customers ($2.0 million), the relocation of facilities to accommodate road improvements ($1.5 million), and building upgrades to various pumping station buildings ($1.0 million). Other significant expenditures include main installation and improvements ($0.8 million), purchase of transportation and power operated equipment ($0.5 million), upgrades to Mallory Pumping Station ($0.5 million), upgrades to Allen Pumping Station ($0.4 million), upgrades to Shaw Pumping Station ($0.2 million), and upgrades to McCord Pumping Station ($0.2 million).
MANAGEMENT’S DISCUSSION AND ANALYSIS FOR THE YEARS ENDED DECEMBER 31, 2016 AND 2015 (Continued)
M-26
Liabilities
2016 Compared to 2015: As of December 31, 2016, total liabilities and deferred inflows were $96.1 million, representing an increase of $44.2 million, or 85.1%, compared to December 31, 2015. The increase is due, in part, to an increase in long-term debt of $30.8 million and an increase in non-current liabilities of $14.5 million. Long-term debt increased $28.9 million due to the issuance of Series 2016 Bonds and $2.5 million due to the unamortized premiums. Non-current liabilities increased $14.2 million due to the pension liability-long term. 2015 Compared to 2014: As of December 31, 2015, total liabilities and deferred inflows were $51.9 million, representing an increase of $11.4 million, or 28.1%, compared to December 31, 2014. The increase is due, in part, to an increase in current liabilities payable from current assets of $5.0 million and an increase in current liabilities payable from restricted assets of $0.9 million due to an increase in medical benefits of $0.8 million. Deferred inflows of resources increased $5.5 million due to the GASB 68 implementation in 2015. Net Position
2016 Compared to 2015: As of December 31, 2016, the Water Division’s total net position (total assets and deferred outflows of resources less total liabilities and deferred inflows of resources) was $293.1 million, an increase of $9.9 million, or 3.5%, from December 31, 2015. The increase is due to an increase in restricted net position of $16.5 million, offset by a decrease in net investment in capital assets of $9.7 million. Eighty-four percent of the net position was related to net investments in capital assets. 2015 Compared to 2014:
As of December 31, 2015, the Water Division’s total net position (total assets and deferred outflows of resources less total liabilities and deferred inflows of resources) was $283.2 million, a decrease of $4.9 million, or 1.7%, from December 31, 2014. The decrease is due to a decrease in unrestricted net position (used to finance day-to-day operations) of $8.8 million, partially offset by an increase in net investment in capital assets of $5.0 million. Ninety percent of the net position was related to net investments in capital assets.

MANAGEMENT’S DISCUSSION AND ANALYSIS FOR THE YEARS ENDED DECEMBER 31, 2016 AND 2015 (Continued)
M-27
Figure 4: Water Division’s Net Position (in thousands):
2016 2015 2014
$23,272 $20,187 $28,965$23,617
$7,100$8,268
246,178255,883 250,871
Net Position By Component
Net investment incapital assetsRestricted
Unrestricted

MANAGEMENT’S DISCUSSION AND ANALYSIS FOR THE YEARS ENDED DECEMBER 31, 2016 AND 2015 (Continued)
M-28
Analysis of the Water Division’s Statements of Revenues, Expenses and Changes in Net Position Condensed financial information comparing the Water Division’s revenues, expenses and changes in net position for the past three fiscal years is presented below:
Change in Net Position 2016 Compared to 2015: As of December 31, 2016, the change in net position is $9.9 million, up $11.5 million from a loss of $1.6 million at December 31, 2015. This increase is due to an increase in operating revenues of $15.4 million, offset by an increase in other operating expense of $3.0 million.
FY16 - FY15 FY15 - FY14Percentage Percentage
2016 2015 Change 2014 ChangeRevenues: Operating revenues 99,847$ 84,491$ 18.2% 86,181$ -2.0% Non-operating revenues 739 678 9.0% 722 -6.1% Total Revenues 100,586 85,169 18.1% 86,903 -2.0%Expenses: Depreciation expense 7,987 7,279 9.7% 7,522 -3.2% Other operating expense 77,611 74,604 4.0% 70,379 6.0% Non-operating expense 691 457 51.2% 264 73.1% Total Expenses 86,289 82,340 4.8% 78,165 5.3%Income before contributions in aid of construction and transfers 14,297 2,829 405.4% 8,738 -67.6%
Contributions in aid of construction 3,533 3,128 13.0% 3,161 -1.0%Reduction of plant costs recovered through contributions in aid of construction (3,533) (3,128) -13.0% (3,161) 1.0%Transfers to City of Memphis (4,400) (4,400) - (4,400) - Change in net position 9,897$ (1,571)$ 730.0% 4,338$ -136.2%
Net position, beginning of year 283,170$ 288,104$ -1.7% 283,766$ 1.5%
Change in method of accounting for pension - (3,363) - - - Change in net position 9,897 (1,571) 730.0% 4,338 -136.2%
Net position, end of year 293,067$ 283,170$ 3.5% 288,104$ -1.7%
(In Thousands)
Table 6Water Division
Condensed Statements of Revenues, Expenses and Changes in Net PositionYears Ended December 31, 2016, 2015, and 2014
MANAGEMENT’S DISCUSSION AND ANALYSIS FOR THE YEARS ENDED DECEMBER 31, 2016 AND 2015 (Continued)
M-29
2015 Compared to 2014: As of December 31, 2015, the change in net position is a loss of $1.6 million, down $5.9 million from a gain of $4.3 million at December 31, 2014. This decrease is due primarily to an increase in other operating expense of $4.2 million and a decrease in operating margin of $1.7 million. Revenues
2016 Compared to 2015: Total revenues were $100.6 million for fiscal year 2016, an increase of $15.4 million compared to fiscal year 2015. Operating revenues increased $15.4 million due, in part, to an increase in sales revenue as a result of a 22% rate increase effective January 2016. 2015 Compared to 2014: Total revenues were $85.2 million for fiscal year 2015, a decrease of $1.7 million compared to fiscal year 2014. Operating revenues decreased $1.7, or 2.0%, due primarily to a decrease in miscellaneous revenue of $1.0 million due to a decrease in interdivisional rents, connect/reconnect fees, and forfeited discounts and a decrease in sales revenue of $0.9 million due to lower sales volume. Expenses 2016 Compared to 2015: As of December 31, 2016, total expenses for the Water Division were $86.3 million, an increase of $3.9 million, or 4.8%, compared to fiscal year 2015. The increase resulted from an increase in other operating expense of $3.0 million due, in part, to an increase in operation expenses of $2.1 million and an increase in depreciation expense of $0.7 million. 2015 Compared to 2014:
As of December 31, 2015, total expenses for the Water Division were $82.3 million, an increase of $4.2 million, or 5.3%, compared to fiscal year 2014. The increase resulted from an increase in other operating expense of $4.2 million and non-operating expense of $0.2 million, offset by a decrease in depreciation expense of $0.2 million. Other operating expenses increased, primarily due to an increase in pollution remediation expenses. Contributions in aid of construction 2016 Compared to 2015: CIAC were $3.5 million for fiscal year 2016, an increase of $0.4 million, or 13.0%, from fiscal year 2015. This increase was mainly the result of $0.4 million increase in donated easements. 2015 Compared to 2014: CIAC were $3.1 million for fiscal year 2015, a decrease of $0.03 million, or 1.0%, from fiscal year 2014. This decrease was mainly the result of a decrease in construction activity of $0.3 million and claims of $0.05 million, offset by an increase in donated easements of $0.3 million.

MANAGEMENT’S DISCUSSION AND ANALYSIS FOR THE YEARS ENDED DECEMBER 31, 2016 AND 2015 (Continued)
M-30
Transfers to the City of Memphis The Water Division, through an agreement with the City, transfers a payment in the amount of $2.5 million per year. The agreement is effective through the year 2028. During 2014, the Water Division was authorized and directed by City Council to make an additional annual $1.9 million transfer payment each year through fiscal year 2017. Additional Financial Information This discussion is designed to provide MLGW’s customers, investors and other interested parties with a general overview of the financial position and results of operations. Questions concerning any of the information provided in this report or requests for additional information should be addressed to the Manager of General Accounting, Memphis Light, Gas and Water Division, P.O. Box 430, Memphis, TN 38101, or call 901-528-4221.

Memphis Light, Gas and Water DivisionYears ended December 31, 2016 and 2015
with Independent Auditor’s Report
Financial Statements
Required and Supplemental Information
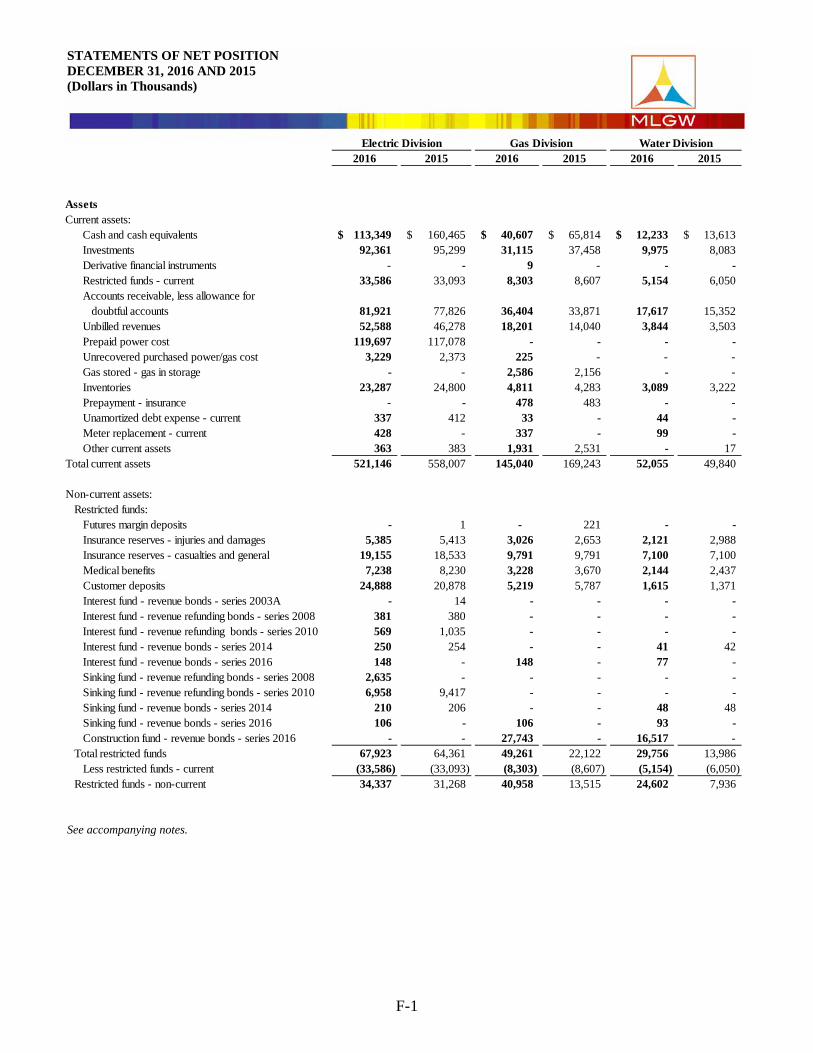
STATEMENTS OF NET POSITION DECEMBER 31, 2016 AND 2015 (Dollars in Thousands)
F-1
2016 2015 2016 2015 2016 2015
AssetsCurrent assets:
Cash and cash equivalents 113,349$ 160,465$ 40,607$ 65,814$ 12,233$ 13,613$ Investments 92,361 95,299 31,115 37,458 9,975 8,083 Derivative financial instruments - - 9 - - - Restricted funds - current 33,586 33,093 8,303 8,607 5,154 6,050 Accounts receivable, less allowance for
doubtful accounts 81,921 77,826 36,404 33,871 17,617 15,352 Unbilled revenues 52,588 46,278 18,201 14,040 3,844 3,503 Prepaid power cost 119,697 117,078 - - - - Unrecovered purchased power/gas cost 3,229 2,373 225 - - - Gas stored - gas in storage - - 2,586 2,156 - - Inventories 23,287 24,800 4,811 4,283 3,089 3,222 Prepayment - insurance - - 478 483 - - Unamortized debt expense - current 337 412 33 - 44 - Meter replacement - current 428 - 337 - 99 - Other current assets 363 383 1,931 2,531 - 17
Total current assets 521,146 558,007 145,040 169,243 52,055 49,840
Non-current assets:Restricted funds:
Futures margin deposits - 1 - 221 - - Insurance reserves - injuries and damages 5,385 5,413 3,026 2,653 2,121 2,988 Insurance reserves - casualties and general 19,155 18,533 9,791 9,791 7,100 7,100 Medical benefits 7,238 8,230 3,228 3,670 2,144 2,437 Customer deposits 24,888 20,878 5,219 5,787 1,615 1,371 Interest fund - revenue bonds - series 2003A - 14 - - - - Interest fund - revenue refunding bonds - series 2008 381 380 - - - - Interest fund - revenue refunding bonds - series 2010 569 1,035 - - - - Interest fund - revenue bonds - series 2014 250 254 - - 41 42 Interest fund - revenue bonds - series 2016 148 - 148 - 77 - Sinking fund - revenue refunding bonds - series 2008 2,635 - - - - - Sinking fund - revenue refunding bonds - series 2010 6,958 9,417 - - - - Sinking fund - revenue bonds - series 2014 210 206 - - 48 48 Sinking fund - revenue bonds - series 2016 106 - 106 - 93 - Construction fund - revenue bonds - series 2016 - - 27,743 - 16,517 -
Total restricted funds 67,923 64,361 49,261 22,122 29,756 13,986 Less restricted funds - current (33,586) (33,093) (8,303) (8,607) (5,154) (6,050)
Restricted funds - non-current 34,337 31,268 40,958 13,515 24,602 7,936
Electric Division Gas Division Water Division
See accompanying notes.

STATEMENTS OF NET POSITION DECEMBER 31, 2016 AND 2015 (Dollars in Thousands) (Continued)
F-2
2016 2015 2016 2015 2016 2015
Assets:Other assets:
Prepaid power cost - long term 112,821 232,517 - - - - Prepayment - in lieu of taxes 1,739 1,797 40 41 - - Unamortized debt expense 974 937 352 - 456 187 Notes receivable - - 3,562 - 1,872 2,038 Meter replacement-long term 6,918 - 5,820 - 1,217 - Other prepayments 1,579 1,591 704 704 467 468
Total other assets 124,031 236,842 10,478 745 4,012 2,693
Utility plantPlant in service 1,815,044 1,738,345 694,303 658,913 491,517 462,612 Plant held for future use - - 212 212 - - Non-utility plant 15,345 15,345 200 200 - -
Total utility plant 1,830,389 1,753,690 694,715 659,325 491,517 462,612 Less accumulated depreciation & amortization (750,926) (711,937) (311,085) (295,584) (198,637) (191,624)
Utility plant, net 1,079,463 1,041,753 383,630 363,741 292,880 270,988 Total non-current assets 1,237,831 1,309,863 435,066 378,001 321,494 281,617
Total assets 1,758,977 1,867,870 580,106 547,244 373,549 331,457
Deferred outflows of resourcesUnamortized balance of refunded debt 1,499 3,509 - - - - Employer pension contribution 12,271 12,271 5,473 5,473 3,634 3,634 Pension liability experience 1,088 - 485 - 322 - Pension investment earnings experience 39,341 - 17,546 - 11,652 - Accumulated decrease in fair value of
hedging derivatives - 40 - 617 - -
Total assets and deferred outflows of resources 1,813,176$ 1,883,690$ 603,610$ 553,334$ 389,157$ 335,091$
Electric Division Gas Division Water Division
See accompanying notes.

STATEMENTS OF NET POSITION DECEMBER 31, 2016 AND 2015 (Dollars in Thousands) (Continued)
F-3
2016 2015 2016 2015 2016 2015
LiabilitiesCurrent liabilities:
Accounts payable - purchased power and gas 115,691$ 103,227$ 25,950$ 12,539$ -$ -$ Other accounts payable and liabilities 42,166 47,881 20,265 29,496 15,840 14,880 Accrued taxes 1,282 36,347 1,320 12,268 - 1,250 Accrued vacation 8,461 8,088 3,657 3,563 2,633 2,488 Derivative financial instruments - 40 - 617 - - Bonds payable 108,860 105,782 1,169 - 1,558 522
Total current liabilities payable from current assets 276,460 301,365 52,361 58,483 20,031 19,140
Current liabilities payable from restricted assets:Insurance reserves - injuries and damages 5,385 5,413 3,026 2,654 2,121 2,988 Medical benefits 7,238 8,230 3,228 3,670 2,144 2,437 Customer deposits 9,707 8,143 1,796 2,062 629 535 Bonds payable - accrued interest 1,347 1,683 148 - 118 42 Bonds payable - principal 9,910 9,623 106 - 142 48
Total current liabilities payable from restricted assets 33,587 33,092 8,304 8,386 5,154 6,050 Total current liabilities 310,047 334,457 60,665 66,869 25,185 25,190
Non-current liabilities:Customer advances for construction 8,584 7,234 626 578 - - Customer deposits 15,182 12,735 3,423 3,724 985 836 LNG deposits - - 125 - - - Reserve for unused sick leave 7,043 6,715 3,198 3,101 2,311 2,200 Revenue bonds - series 2003A - 4,170 - - - - Revenue refunding bonds - series 2008 65,305 96,930 - - - - Revenue refunding bonds - series 2010 55,070 138,420 - - - - Revenue bonds - series 2014 63,585 66,105 - - 13,290 13,870 Revenue bonds - series 2016 38,725 - 38,725 - 28,880 - Unamortized debt premium 21,016 20,122 7,866 - 3,331 869 Net pension liability 49,940 2,072 22,273 924 14,791 614 Other 1,206 800 4,589 291 2,901 2,816
Total non-current liabilities 325,656 355,303 80,825 8,618 66,489 21,205 Total liabilities 635,703 689,760 141,490 75,487 91,674 46,395
Deferred inflows of resourcesPension liability experience 6,252 7,815 2,788 3,485 1,852 2,315 Pension changes of assumptions 8,462 10,577 3,774 4,717 2,506 3,133 Pension investment earnings experience 197 262 88 117 58 78 Accumulated increase in fair value of
hedging derivatives - - 9 - - - Total deferred inflows of resources 14,911 18,654 6,659 8,319 4,416 5,526
Net positionNet investment in capital assets 958,213 964,812 336,148 363,742 246,178 255,883 Restricted 19,155 18,534 37,409 10,012 23,617 7,100 Unrestricted 185,194 191,930 81,904 95,774 23,272 20,187 Total net position 1,162,562 1,175,276 455,461 469,528 293,067 283,170
Total liabilities, deferred inflows of resources andnet position 1,813,176$ 1,883,690$ 603,610$ 553,334$ 389,157$ 335,091$
Electric Division Gas Division Water Division
See accompanying notes.

STATEMENTS OF REVENUES, EXPENSES AND CHANGES IN NET POSITION FOR THE YEARS ENDED DECEMBER 31, 2016 AND 2015 (Dollars in Thousands)
F-4
2016 2015 2016 2015 2016 2015
Operating revenues:Sales and service revenues 1,219,587$ 1,238,095$ 184,874$ 225,388$ 96,236$ 80,748$ Transported gas revenues - - 6,945 6,380 - - Other revenues 29,948 30,466 14,057 18,137 3,611 3,743
Total operating revenues 1,249,535 1,268,561 205,876 249,905 99,847 84,491
Operating expenses:Purchased power and gas for resale 1,018,157 1,015,978 92,183 122,973 - - Production - - - - 15,759 15,586 Operation 136,756 126,227 81,399 75,175 51,744 49,629 Maintenance 44,273 43,650 11,671 12,988 10,108 9,389 Depreciation & amortization 50,902 48,778 15,251 14,660 7,987 7,279 Payment in lieu of taxes 6,898 7,827 1,633 961 - -
1,256,986 1,242,460 202,137 226,757 85,598 81,883 Operating income (loss) (7,451) 26,101 3,739 23,148 14,249 2,608
Non-operating revenues (expenses):Contributions in aid of construction 10,445 13,837 38,118 2,316 3,533 3,128 Reduction of plant costs recovered through
contributions in aid of construction (10,445) (13,837) (38,118) (2,316) (3,533) (3,128) Transmission credits 33,344 32,565 - - - - Investment and other income 3,713 3,730 98 326 691 674 Allowance for funds used during construction 279 226 - - 48 4 Prepay credit 12,886 16,644 - - - - Interest expense (15,491) (19,011) (379) - (691) (457)
Total non-operating revenues (expenses) 34,731 34,154 (281) 326 48 221 Income before transfers 27,280 60,255 3,458 23,474 14,297 2,829 Transfers out - City of Memphis (39,994) (36,697) (17,525) (16,551) (4,400) (4,400) Change in net position (12,714)$ 23,558$ (14,067)$ 6,923$ 9,897$ (1,571)$
Net position, beginning of year 1,175,276$ 1,163,074$ 469,528$ 467,670$ 283,170$ 288,104$ Change in method of accounting for pension - (11,356) - (5,065) - (3,363) Change in net position (12,714) 23,558 (14,067) 6,923 9,897 (1,571) Net position, end of year 1,162,562$ 1,175,276$ 455,461$ 469,528$ 293,067$ 283,170$
Electric Division Gas Division Water Division
See accompanying notes.

STATEMENTS OF CASH FLOWS FOR THE YEARS ENDED DECEMBER 31, 2016 AND 2015 (Dollars in Thousands)
F-5
2016 2015 2016 2015 2016 2015
Cash flows from operating activities: Receipts from customers and users 1,246,585$ 1,277,795$ 197,166$ 263,877$ 98,045$ 83,157$ Payments to suppliers (899,800) (897,702) (101,881) (156,105) (26,296) (25,745) Payments to/on behalf of employees (120,997) (121,267) (63,049) (60,143) (46,493) (42,064) Payments from (to) other Division funds (2,831) 2,146 (2,371) (2,569) (3,162) (2,606) Payments for taxes (14,131) (62) (2,306) (25) - - Net cash provided by operating activities 208,826 260,910 27,559 45,035 22,094 12,742
Cash flows from noncapital financing activities: Transfers to City of Memphis (67,416) (7,993) (27,580) (5,175) (5,650) (3,150) Principal payments on long-term debt (117,091) (107,336) - - - - Interest expense on bonds (17,113) (22,855) - - - - Net cash used in noncapital financing activities (201,620) (138,184) (27,580) (5,175) (5,650) (3,150)
Cash flows from capital and related financing activities: Purchase and construction of utility plant (107,573) (86,429) (80,949) (31,467) (35,028) (15,086) Contributions in aid of construction 10,445 13,837 38,118 2,316 3,533 3,128 Advance contributions in aid of construction (TVA) - - (10,218) 11,487 - - Proceeds from issuance of long-term debt 47,698 - 47,694 - 32,287 - Principal payments on long-term debt (2,470) (2,421) - - (569) (559) Interest payments on debt (3,205) (2,869) (443) - (687) (513) Net cash provided by (used in) capital
and related financing activities (55,105) (77,882) (5,798) (17,664) (464) (13,030)
Cash flows from investing activities: Sales and maturities of investments 74,240 74,844 24,836 34,970 3,232 13,412 Purchases of investments (73,397) (91,055) (42,252) (36,776) (21,078) (10,345) Payments received on notes receivable - - 913 1,200 165 (13) Issuance of notes receivable - - - - - - Investment income (loss) earned on investments 1,408 503 495 307 137 529 Net cash provided by (used in) investing activities 2,251 (15,708) (16,008) (299) (17,544) 3,583
Increase (decrease) in cash and cash equivalents (45,648) 29,136 (21,827) 21,897 (1,564) 145 Cash and cash equivalents, beginning of year 215,904 186,768 83,300 61,403 23,841 23,696 Cash and cash equivalents, end of year 170,256$ 215,904$ 61,473$ 83,300$ 22,277$ 23,841$
Electric Division Gas Division Water Division
See accompanying notes.

STATEMENTS OF CASH FLOWS FOR THE YEARS ENDED DECEMBER 31, 2016 AND 2015 (Dollars in Thousands) (Continued)
F-6
2016 2015 2016 2015 2016 2015
Reconciliation of operating income to net cash provided by operating activities: Operating income (loss) (7,451)$ 26,101$ 3,739$ 23,148$ 14,249$ 2,608$ Adjustments to reconcile net operating income (loss) to net cash provided by operating activities: Depreciation of utility plant 52,071 49,766 16,784 16,138 8,286 7,564 Transmission credits 33,344 32,565 - - - - Prepay power credits 12,886 16,644 - - - - Other income (loss) 2,305 3,227 (403) 19 555 145 (Increase) decrease in assets: Accounts receivable (4,095) 7,372 (2,534) 7,126 (2,265) (552) Unbilled revenues (6,309) 3,360 (4,161) 5,847 (341) (545) Prepaid power cost 117,078 113,538 - - - - Prepayments - in lieu of taxes 58 75 1 1 - - Unrecovered purchased power and gas costs (856) - (225) - - Inventories 1,513 (2,050) (529) 131 134 (199) Other assets 3,767 (11,982) 2,276 (5,009) 1,094 (3,679) Increase (decrease) in liabilities: Accounts payable - purchased power and gas 12,464 (5,166) 13,412 (13,552) - - Other accounts payable and accrued expenses (5,714) 8,896 988 3,573 959 3,714 Accrued payment in lieu of taxes (7,642) 7,643 (893) 893 - - Customer deposits 4,010 1,101 (394) 1,196 243 61 Insurance reserves (28) (1,022) 372 14 (866) 152 Medical benefit accrual (992) 2,609 (443) 1,163 (294) 773 Other liabilities 2,417 19,589 (431) 9,412 340 6,063 Accounting adjustment for GASB 68 - - (11,356) - (5,065) - (3,363) change in beginning net position Total adjustments 216,277 234,809 23,820 21,887 7,845 10,134 Net cash provided by operating activities 208,826$ 260,910$ 27,559$ 45,035$ 22,094$ 12,742$
Reconciliation of cash and cash equivalents per statements of cash flows to the statements of net position: Restricted funds 67,923$ 64,361$ 49,261$ 22,122$ 29,756$ 13,986$ Less investments included in restricted funds (11,016) (8,922) (28,395) (4,636) (19,712) (3,758) Cash and cash equivalents included in restricted funds 56,907 55,439 20,866 17,486 10,044 10,228
Current assets - cash and cash equivalents 113,349 160,465 40,607 65,814 12,233 13,613 Total cash and cash equivalents 170,256$ 215,904$ 61,473$ 83,300$ 22,277$ 23,841$
Electric Division Gas Division Water Division
See accompanying notes.
NOTES TO FINANCIAL STATEMENTS DECEMBER 31, 2016 AND 2015 (Dollars in Thousands)
N-1
1. Summary of Significant Accounting Policies Organization Memphis Light, Gas and Water Division (“MLGW”), a division of the City of Memphis, Tennessee (the “City”), was created by an amendment to the City Charter by Chapter 381 of the Private Acts of the General Assembly of Tennessee (the “Charter”), adopted March 9, 1939, as amended. MLGW is managed by its President and a five member Board of Commissioners that are nominated by the City Mayor and approved by the Memphis City Council (the “Council”). MLGW, through its three divisions, provides electricity, gas and water to customers in Shelby County, Tennessee, which includes the City. MLGW’s annual budget and electric, gas and water rates require the approval of the Council. MLGW must also obtain the approval of the Council before incurring certain obligations. Basis of Presentation The financial statements present only the Electric, Gas and Water Divisions of MLGW in conformity with accounting principles generally accepted in the United States of America that are applicable to a proprietary fund of a government unit. The accompanying financial statements present the separate financial positions, results of operations, and cash flows of each of the three divisions--Electric, Gas and Water--(the “Divisions”) of MLGW, but do not present the financial position, results of operations, or cash flows of MLGW, a division of the City of Memphis. Accordingly, the accompanying disclosures relate separately to the Divisions, as applicable, and not collectively to MLGW. Unless expressly stated, each disclosure, including references to “MLGW” herein, applies solely to each of the separate divisions on an individual basis. These statements are not intended to present the financial position of the City, the results of the City’s operations or the cash flows of the City’s funds, nor do they represent the financial position, results of operations, or cash flows of MLGW’s Retirement and Pension System discussed in Note 7 or the Other Postemployment Benefits (“OPEB”) Trust discussed in Note 8. Basis of Accounting MLGW is required by state statute and the Charter to maintain separate accounting for each division and to allocate among the Divisions, on an equitable basis, joint expenses, including those related to common facilities. MLGW utilizes direct cost methods where applicable. For expenses not directly charged to a specific division, internally developed cost allocation methods are used based on the function performed. Each division is separately financed, and its indebtedness is repayable from its net revenues. Where applicable, the Federal Energy Regulatory Commission’s (“FERC”) (Electric and Gas Divisions) and the National Association of Regulatory Utility Commissioners’ (“NARUC”) (Water Division) Uniform Systems of Accounts are used. MLGW is not subject to the jurisdiction of federal or state regulatory commissions.
NOTES TO FINANCIAL STATEMENTS DECEMBER 31, 2016 AND 2015 (Dollars in Thousands) (Continued)
N-2
1. Summary of Significant Accounting Policies (continued) Basis of Accounting (continued) MLGW prepares its financial statements in accordance with the provisions of GASB Statement No. 62, Codification of Accounting and Financial Reporting Guidance Contained in Pre-November 30, 1989 FASB and AICPA Pronouncements, paragraphs 476-500, for regulated operations. These paragraphs recognize that accounting for rate regulated enterprises should reflect the relationship of costs and revenues introduced by rate regulation. Regulatory Accounting Regulatory accounting allows a regulated utility to defer a cost (a regulatory asset) or recognize an obligation (a regulatory liability) if it is probable that through the rate making process, there will be a corresponding increase or decrease in future revenues. Accordingly, MLGW has recognized certain regulatory assets and regulatory liabilities in the accompanying Statements of Net Position. In the event MLGW no longer meets the criteria for regulated operations under GASB 62, MLGW would be required to recognize the effects of any regulatory change in assets or liabilities in its Statements of Revenues, Expenses and Changes in Net Position. The following are the regulatory assets and liabilities included in the Statements of Net Position:

NOTES TO FINANCIAL STATEMENTS DECEMBER 31, 2016 AND 2015 (Dollars in Thousands) (Continued)
N-3
1. Summary of Significant Accounting Policies (continued) Regulatory Accounting (continued)
2016 2015 2016 2015 2016 2015Regulatory Assets: Current:
Unrecovered purchased power/gas cost 3,229$ 2,373$ 225$ -$ -$ -$ Meter replacement 428 - 337 - 99 - Unamortized debt expense 337 412 33 - 44 17 Total current 3,994 2,785 595 - 143 17
Non-Current: Meter replacement 6,918 - 5,820 - 1,217 - Unamortized debt expense 974 937 352 - 456 187 Total non-current 7,892 937 6,172 - 1,673 187
Total Regulatory Assets 11,886$ 3,722$ 6,767$ -$ 1,816$ 204$
Regulatory Liabilities: Current: Purchased gas adjustment -$ -$ 2,665$ 2,455$ -$ -$
Total Regulatory Liabilities -$ -$ 2,665$ 2,455$ -$ -$
Electric Division Gas Division Water Division
Fair Value of Financial Instruments Fair value is the price that would be received to sell an asset or paid to transfer a liability in an orderly transaction between market participants at the measurement date. The carrying amounts of cash and cash equivalents, investments, restricted fund investments, accounts receivable and accounts payable are a reasonable estimate of their fair values. The estimated fair values of MLGW’s other financial instruments have been determined by MLGW using available market information. All investments are carried at fair value and changes in the fair values of investments are included in investment income in the accompanying Statements of Revenues, Expenses and Changes in Net Position. MLGW categorizes its fair value measurements within the fair value hierarchy established by generally accepted accounting principles. The hierarchy is based on the valuation inputs used to measure the fair value of the asset. Level 1 inputs are quoted prices in active markets for identical assets; Level 2 inputs are significant other observable inputs; and Level 3 inputs are significant unobservable inputs.

NOTES TO FINANCIAL STATEMENTS DECEMBER 31, 2016 AND 2015 (Dollars in Thousands) (Continued)
N-4
1. Summary of Significant Accounting Policies (continued) Fair Value of Financial Instruments (continued) MLGW has the following recurring fair value measurements as of December 31, 2016:
• U.S. Treasury securities of $132,189 (Level 1 inputs) • Negotiable certificates of deposit of $5,006; commercial paper of $134,191; corporate bonds of
$1,161; government mortgage-backed securities of $20,235; and U.S. Government agencies of $41,140 (Level 2 inputs)
• Government mortgage-backed securities of $4,251 (Level 3 inputs) 2015 comparative data is not available. Cash and cash equivalents MLGW considers all highly liquid investments with maturities of three months or less when purchased to be cash equivalents. Accounts Receivable Accounts receivables result from charges for both utilities and other ancillary services provided by MLGW, and include wholesale, residential, commercial, industrial and government customers in the Shelby County, Tennessee, geographic area. Accounts receivable are potentially exposed to concentrations of credit risk. As a general policy, customer deposits are required for receivables unless or until the customer has established a good credit history. Accounts receivable are stated at the amount management expects to collect from outstanding balances. As of December 31, 2016 and 2015, accounts receivable and allowances for doubtful accounts were as follows:
2016 2015 2016 2015 2016 2015Accounts Receivable 103,356$ 95,787$ 37,024$ 34,503$ 18,099$ 15,746$ Allowance for doubtful accounts (21,435) (17,961) (620) (632) (482) (394) Total A/R, net of allowance 81,921$ 77,826$ 36,404$ 33,871$ 17,617$ 15,352$
Electric Division Gas Division Water Division
MLGW performs a monthly analysis of outstanding trade receivables to assess the likelihood of collection. For aged receivable balances, MLGW records an allowance to adjust the trade receivable to MLGW’s best estimate of the amount it will ultimately collect. Such allowances are netted against operating revenues.

NOTES TO FINANCIAL STATEMENTS DECEMBER 31, 2016 AND 2015 (Dollars in Thousands) (Continued)
N-5
1. Summary of Significant Accounting Policies (continued) Accounts Receivable (continued) MLGW’s policy is to write off trade receivables after 150 days of non-payment. The bad debt amounts netted against operating revenues are as follows:
2016 2015Electric 6,828$ 6,565$ Gas 1,405 1,308 Water 1,096 676 Unbilled Revenues MLGW customers are spread across twenty-one different billing cycles. Each cycle can range from twenty-five to thirty-five days. The summation of these twenty-one cycles represents a revenue month. Billing cycles do not correspond to a calendar month and, thus, have days that fall into two or more calendar months. Revenue is reported on a calendar month basis. Unbilled revenue represents management’s estimate of the revenue earned for days of service that have not been billed as of year-end. Prepaid Power Cost Electric Division prepaid power cost represents the unamortized amount of prepaid power under the prepaid electricity agreement signed with Tennessee Valley Authority (“TVA”) on November 19, 2003. Under the prepay agreement, MLGW issued revenue bonds with a face value of $1,392,170 and a premium of $121,247 to make an upfront payment of $1,500,000 to TVA. Under the terms of the agreement, MLGW receives a fixed discount on the monthly power purchased for the fifteen year term of the agreement. The total fixed discount under the agreement is sufficient to meet the debt service requirements and yield approximately $13,000 in annual power cost savings. The monthly fixed discount is allocated to prepaid power cost and other income under the interest method based on the debt service requirements of the associated debt. Total prepaid power cost at December 31, 2016 and 2015 was $232,518 and $349,595, respectively. As it relates to debt issued to finance the cost of this transaction, the amount of interest cost incurred and charged to electric expense in 2016 and 2015 totaled $12,782 and $16,644, respectively. See Note 11 (Bonds) and Note 12 (Rates and Energy Supplies) for further disclosure of the revenue bonds and subsequent refinancing. Inventories and Stored Natural Gas Inventories, consisting primarily of materials and supplies inventory, and stored natural gas are valued at cost using the average cost method.

NOTES TO FINANCIAL STATEMENTS DECEMBER 31, 2016 AND 2015 (Dollars in Thousands) (Continued)
N-6
1. Summary of Significant Accounting Policies (continued) Restricted Funds and Related Reserves Certain MLGW assets are restricted for specific purposes. Legal and contractual agreements restrict amounts for debt service, refund of customer deposits, futures margin requirements, and capital improvements while Board of Commissioners enacted provisions restrict funds for self-insurance and additional capital improvements. Restricted funds are first used for expenses when available, with the exception of the insurance reserve fund for casualties, which is used at the discretion of management depending on the severity of the catastrophe and the availability of funds. The Electric and Gas Divisions maintain a cash margin account with its futures clearing member. The clearing member requires that a minimum cash margin be maintained based on the value of the Division’s outstanding derivative positions. The minimum cash margin requirements are considered restricted and are reflected in restricted assets in the accompanying Statements of Net Position. The amounts of cash in excess of the minimum cash margin requirement are included in cash and cash equivalents. Construction funds are generally maintained for the purpose of paying for certain repairs and capital additions and improvements. The respective bond resolutions of the Electric, Gas and Water Divisions allow for funding for future construction. The insurance reserves for injuries and damages are maintained for estimated liabilities incurred and risks assumed on claims for injuries and damages. The insurance reserves for casualties are maintained at discretionary amounts to partially cover losses of a catastrophic nature which are not ordinarily insurable or which are not insurable on an economical basis. Medical benefit reserves are maintained for MLGW’s medical insurance program, which serves employees and retirees. The medical benefit reserves represent the estimated costs incurred but not yet paid in providing medical benefits to employees and retirees which are not insured by third party providers. Since MLGW is self-insured for insurance and medical benefit costs, the Board of Commissioners has authorized the restriction of assets equal to the computed reserves. Customer deposit funds are maintained for the future repayment of deposits collected from customers without adequate credit history, in accordance with MLGW’s policy and the respective customer service agreement. Bond reserve and debt service funds are restricted under the terms of the respective bond indentures to pay current bond principal and interest as these obligations become due. Customer Deposits Customers that do not have adequate credit history are required to make utility deposits before services are provided. Deposits are refunded or applied toward a customer’s bill after a 24-month good pay status.

NOTES TO FINANCIAL STATEMENTS DECEMBER 31, 2016 AND 2015 (Dollars in Thousands) (Continued)
N-7
1. Summary of Significant Accounting Policies (continued) Customer Deposits (continued) Deposits are allocated to the Electric, Gas and Water Divisions based upon each division’s percentage of total sales revenue of the previous year-end. Utility Plant The costs of additions and replacements of units of property are capitalized. Costs include contracted work, direct labor and materials, allocable overhead and where applicable, allowances for borrowed funds used during construction. Donated assets are valued at fair market value at the time of donation. Costs are reduced by contributions in aid of construction. Upon retirement of property units, the original cost, plus removal cost, minus salvage is charged to either accumulated depreciation or accumulated amortization. The units of property adopted are related to those suggested by FERC for the Electric and Gas Divisions and NARUC for the Water Division, which allow for the reduction of plant cost recovered through contributions in aid of construction as opposed to recovery of costs through future regulatory rates.
An allowance for borrowed funds used during construction is computed at actual interest rates to the extent that major projects are financed by long-term debt. In 2016, interest of $279 was capitalized for the Electric Division and $48 for the Water Division. In 2015, interest of $226 was capitalized for the Electric Division and $4 for the Water Division. Interest on other debt is not capitalized, as it is recovered through current revenues. The amount of interest cost incurred and charged to electric expense in 2016 and 2015 totaled $2,709 and $2,367, respectively. The amount of interest cost incurred and charged to gas expense in 2016 and 2015 totaled $379 and $-0-, respectively. The amount of interest cost incurred and charged to water expense in 2016 and 2015 totaled $691 and $457, respectively. Depreciation and amortization are computed using the straight-line method based on estimated service lives of various classes of property at rates equivalent to annual composite rates of approximately 2.9% for the electric division, 2.4% for the gas division and 2.0% for the water division. Computations of the estimated service lives are the result of various depreciation studies and comparisons with industry standards. For assets owned by one division, but jointly used by more than one division, the other divisions share the costs by paying rent to the owning division to cover depreciation, interest, in lieu of taxes, and transfers. Futures, Options and Swap Contracts The Gas Division enters into futures contracts, swaps, and options on futures contracts as cash flow hedges to manage the risk of volatility in the market price of natural gas on anticipated purchase transactions. The Electric Division enters into futures contracts, swaps, and options on futures contracts as cash flow hedges to manage the risk of volatility in the market price of unleaded gasoline and diesel fuel on anticipated purchase transactions. The market values of the open derivative positions are reported on the Statement of Net Position as derivative financial instruments. The changes in fair market value are

NOTES TO FINANCIAL STATEMENTS DECEMBER 31, 2016 AND 2015 (Dollars in Thousands) (Continued)
N-8
1. Summary of Significant Accounting Policies (continued) Futures, Options and Swap Contracts (continued) recognized as deferred inflows (gains) or deferred outflows (losses) until the related gas purchases are recognized in the Statement of Revenues, Expenses and Changes in Net Position. Bond Premiums, Discounts and Issuance Costs Bond premiums and discounts, as well as issuance costs, are deferred and amortized using the interest method over the lives of the applicable bond issues. Long-term debt is reported net of the applicable bond premium or discount. Unamortized bond issuance costs are accounted for as a regulatory asset. As such, bond issue costs are capitalized and amortized over the term of the related debt. Net Position Net position is classified into three components – net investment in capital assets, restricted, and unrestricted. These classifications are defined as follows:
• Net investment in capital assets – This component of net position consists of capital assets, net of accumulated depreciation, reduced by the outstanding balances of bonds, mortgages, notes, or other borrowings that are attributable to the acquisition, construction, or improvement of those assets. If there are significant unspent related debt proceeds at year-end, the portion of the debt attributable to the unspent proceeds is not included in the calculation of net investment in capital assets. Rather, that portion of the debt is included in the same net position component as the unspent proceeds.
• Restricted net position – This component of net position consists of restricted assets reduced by liabilities and deferred inflows of resources related to those assets.
• Unrestricted net position – This component of net position is the net amount of the assets, deferred outflows of resources, liabilities, and deferred inflows of resources that are not included in the determination of net investment in capital assets or the restricted component of net position.
Revenues and Expenses Revenues are recognized when earned which generally occurs when electricity, gas, or water is delivered to the customer. Customer meters are read and bills are rendered monthly. MLGW records an estimate for unbilled revenues earned from the dates its customers were last billed to the end of each month. MLGW distinguishes between operating and non-operating revenues and expenses. Operating revenues and expenses generally result from providing services and producing and delivering goods in connection with an enterprise fund’s principal operations. The principal operating revenues of MLGW consist of electric, gas and water sales and related activities. Non-operating revenues consist of transmission credits, the non-power cost portion of the prepaid electricity discount, investment income and other ancillary activities. Transmission credits are fees paid by the Tennessee Valley Authority for its use of the Electric Division’s transmission facilities in supplying power to MLGW.

NOTES TO FINANCIAL STATEMENTS DECEMBER 31, 2016 AND 2015 (Dollars in Thousands) (Continued)
N-9
1. Summary of Significant Accounting Policies (continued) Revenues and Expenses (continued) Operating expenses include the cost of purchased power and gas, water production costs, operation and maintenance expenses, depreciation on capital assets and payments in lieu of taxes. Expenses not meeting this definition are reported as non-operating expenses. Pensions For purposes of measuring the net pension liability, deferred outflows of resources and deferred inflows of resources related to pensions, and pension expense, information about the fiduciary net position of the Memphis Light, Gas and Water Retirement and Pension System (the “MLGW Pension Plan”) and additions to and deductions from the MLGW Pension Plan’s fiduciary net position have been determined on the same basis as they are reported by the MLGW Pension Plan. For this purpose, benefit payments (including refunds of employee contributions) are recognized when due and payable in accordance with the benefit terms. Investments are reported at fair value. Related Parties MLGW conducts business with related parties as “arm’s length” transactions. Generally, MLGW provides utility and related services to and receives payments from these parties in the same manner as other non-related customers. Major related party entities include the City of Memphis government. For the years ending 2016 and 2015, receivables from related parties for utility construction, pole rentals and utility related services excluding utility bills were $2,219 and $2,040, respectively. As of December 31, 2016, the only free service provided to the City is water for fire fighting. Free water service provided to the City for public purposes is estimated to be $48 for 2016 and $46 for 2015. The Electric, Gas and Water Divisions make transfers to the City. See Note 14 (Transfers to City). Use of Estimates The preparation of financial statements in conformity with accounting principles generally accepted in the United States of America requires management to make estimates and assumptions that affect the reported amounts of assets and liabilities, the disclosure of contingent assets and liabilities at the date of the financial statements, and the reported amounts of revenues and expenses during the reporting period. Actual results could differ from those estimates.

NOTES TO FINANCIAL STATEMENTS DECEMBER 31, 2016 AND 2015 (Dollars in Thousands) (Continued)
N-10
1. Summary of Significant Accounting Policies (continued) Events occurring after reporting date Management has evaluated events and transactions that have occurred between December 31, 2016 and June 7, 2017, which is the date that the financial statements were available to be issued, for possible recognition or disclosure in the financial statements. Reclassifications Certain amounts in the 2015 financial statements have been reclassified to conform to the 2016 presentation. Recent Accounting Standards Effective for fiscal year 2016, MLGW adopted the provisions of GASB Statement No. 72, Fair Value Measurement and Application. The objective of this statement is to clarify the definition of fair value for financial reporting purposes, establish principles for measuring fair value, providing additional fair value application guidance for certain investments and enhancing disclosures about fair value measurements. Effective for fiscal year 2016, MLGW adopted the provisions of GASB Statement No. 73, Accounting and Financial Reporting for Pensions and Related Assets that are not Within the Scope of GASB Statement 68, and Amendments to Certain Provisions of GASB Statements 67 and 68. The objective of this statement is to improve the decision-useful information about pensions and related assets in the accounting and financial reporting by state and local governments by establishing requirements for the defined benefit and defined contribution pensions that are not within the scope of Statement No. 68, Accounting and Financial Reporting for Pensions. This standard also clarifies note disclosures and required supplementary information. In June 2015, GASB issued Statement No. 74, Financial Reporting for Postemployment Benefit Plans Other than Pension Plans. The objective of this statement replaces Statement No. 43, Financial Reporting for Postemployment Benefit Plans Other Than Pension Plans and Statement No. 50, Pension Disclosures that established uniform financial reporting standards for OPEB plans. This statement establishes new accounting and financial reporting requirements for state and local governments with OPEB plans. The provisions of this statement are effective for OPEB plan financial statements for periods beginning after June 15, 2016. MLGW has not elected early implementation of this standard and has not completed the process of evaluating the impact of this statement on its financial statements. In June 2015, GASB issued Statement No. 75, Accounting and Financial Reporting For Postemployment Benefits Other Than Pensions. This statement replaces Statement No. 45, Accounting and Financial Reporting by Employers for Postemployment Benefits Other Than Pensions that compared the cost of OPEB with the period in which service was rendered. This statement establishes more extensive note disclosures and required supplementary information for accounting and financial reporting requirements

NOTES TO FINANCIAL STATEMENTS DECEMBER 31, 2016 AND 2015 (Dollars in Thousands) (Continued)
N-11
1. Summary of Significant Accounting Policies (continued) Recent Accounting Standards (continued) for state and local governments with OPEB plans. The provisions of this statement are effective for financial statements for periods beginning after June 15, 2017. MLGW has not elected early implementation of this standard and has not completed the process of evaluating the impact of this statement on its financial statements. Effective for fiscal year 2016, MLGW adopted the provisions of GASB Statement No. 76, The Hierarchy of Generally Accepted Accounting Principles For State And Local Governments. This statement supersedes Statement No. 55, The Hierarchy of Generally Accepted Accounting Principles for State and Local Governments. GAAP hierarchy is reduced to two categories of authoritative GAAP and addresses the use of authoritative and non-authoritative literature for transactions. The adoption of this standard had no effect on MLGW. In March 2016, GASB issued Statement No. 82, Pension Issues-An Amendment of GASB Statements No. 67, No. 68, and No. 73. This Statement addresses issues regarding (1) the presentation of payroll-related measures in required supplementary information, (2) the selection of assumptions and the treatment of deviations from the guidance in an Actuarial Standard of Practice for financial reporting purposes, and (3) the classification of payments made by employers to satisfy employee (plan member) contribution requirements. The provisions of the statement are effective for financial statements for periods beginning after June 15, 2016, except for the requirements of this Statement for the selection of assumptions in a circumstance in which an employer’s pension liability is measured as of a date other than the employer’s most recent fiscal year-end. In that circumstance, the provisions of the statement are effective for financial statements for periods beginning after June 15, 2017. MLGW elected to implement this standard effective for fiscal year 2016. In November 2016, GASB issued Statement No. 83, Certain Asset Retirement Obligations. This Statement defines asset retirement obligations (AROs) as a legally enforceable liability associated with the retirement of a tangible capital asset and requires a government that has legal obligations to perform future asset retirement activities related to its tangible capital assets should recognize a liability based on the guidance in this Statement. The provisions of the statement are effective for financial statements for periods beginning after June 15, 2018. MLGW has not elected early implementation of this standard and has not completed the process of evaluating the impact of this statement on its financial statements. 2. Deposits and Investments The MLGW Statement of Investment Policy has been adopted and approved by the MLGW Board of Commissioners. This policy sets forth the investment and operational policies for the management of the public funds of MLGW. The Board of Commissioners has the power to invest MLGW funds in accordance with the prudent investor rule. The Board members exercise authority and control over MLGW’s investment portfolio by setting policies which MLGW’s investment staff executes either internally, or through the use of external prudent experts.
NOTES TO FINANCIAL STATEMENTS DECEMBER 31, 2016 AND 2015 (Dollars in Thousands) (Continued)
N-12
2. Deposits and Investments (continued) Custodial Credit Risk Deposits Custodial credit risk for deposits is the risk that, in the event of the failure of a depository financial institution, MLGW will not be able to recover its deposits or will not be able to recover collateral securities that are in possession of an outside party. Deposits are exposed to custodial credit risk if they are not covered by depository insurance and are uncollateralized, collateralized with securities held by the pledging financial institution, or collateralized with securities held by the pledging financial institution’s trust department or agent but not in the depository-government’s name. MLGW deposits consist of bank deposits. The bank deposits are insured up to $250 by the Federal Deposit Insurance Corporation (“FDIC”) and the remainder is covered by the State of Tennessee Collateral Pool; certificates of deposit must be placed directly with depository institutions. The depository bank shall provide collateral for MLGW deposits in accordance with requirements for public funds deposits in Tennessee. The market value of the pledged securities in the collateral pool must equal at least 105% of the value of the deposit secured, less the amount protected by federal deposit insurance. As of December 31, 2016, MLGW deposits with financial institutions were $104,320. All bank deposits were maintained in collateralized accounts or covered by federal depository insurance and were not exposed to custodial credit risk Investments The investment policy governs the overall administration and investment management of the funds held in the MLGW investment portfolio. MLGW is authorized by the Board of Commissioners to invest in the following investments as authorized by state law and as it deems proper: U.S. Treasuries; U.S. government obligations; repurchase agreements; commercial paper with specified ratings; bankers’ acceptances with specified ratings; bank deposits; certificates of deposit; state pool; and proceeds of bonds, notes and other obligations issued by MLGW. MLGW is prohibited from investing in the following securities: purchases on margin or short sales; investments in reverse repurchase agreements; collateralized mortgage obligations; and “exotic” derivatives such as range notes, dual index notes, inverse floating rate notes and deleveraged notes, or notes linked to lagging indices or to long-term indices.

NOTES TO FINANCIAL STATEMENTS DECEMBER 31, 2016 AND 2015 (Dollars in Thousands) (Continued)
N-13
2. Deposits and Investments (continued) Investments (continued) The following table presents the investments and maturities of MLGW’s investment portfolio as of December 31, 2016:
Fair Maturities Maturities MaturitiesInvestment Type Value < 1 year 1 to 4 years > 4 yearsU.S. Treasuries 132,189$ 60,799$ 71,390$ -$ Federal Agency (Fixed Rate) 63,540 23,530 40,010 - Federal Agency (Callable) 3,247 ¹ - 3,247 2 - Certificates of Deposit 5,006 5,006 - - Commercial Paper (Rated AA or higher) 134,191 134,191 - - Total Investments 338,173$ 223,526$ 114,647$ -$
1 $2,086 of the Federal Agency is guaranteed by the Federal Home Loan Bank $1,161 of these bonds are guaranteed by the Export-Import Bank of the United States2 $2,086 of the Federal Agency matures in 2018; Callable quarterly until maturity $ 747 of these bonds mature in 2019; Callable semi-annually until maturity $ 414 of these bonds mature in 2018; Callable quarterly until maturity
Remaining Maturities (in Years)
Custodial credit risk for investments is the risk that, in the event of failure of the counterparty to a transaction, MLGW will not be able to recover the value of its investment or collateral securities that are in the possession of another party. Investment securities are exposed to custodial credit risk if the securities are uninsured, are not registered in the name of the government, and are held by either the counterparty, or the counterparty’s trust department or agent but not in the name of MLGW. Investments in external investment pools and in money market funds are not exposed to custodial credit risks because their existence is not evidenced by securities that exist in physical or book entry form. To limit its exposure, MLGW’s investment policy requires that all securities purchased by MLGW shall be held in safekeeping by a third-party custodial bank or financial institution. None of MLGW’s investments at December 31, 2016 were exposed to custodial credit risk. Interest Rate Risk Interest rate risk is the risk that changes in interest rates will adversely affect the fair value of an investment in debt securities. Generally, the longer the maturity of an investment the greater the sensitivity of its fair value to changes in market interest rates. MLGW’s investment policy does not limit investment maturities as a means of managing its exposure to fair value losses arising from increasing interest rates. However, the investment policy states no investment will have a maturity of greater than four years from date of purchase. As of December 31, 2016, MLGW had purchased no investments in

NOTES TO FINANCIAL STATEMENTS DECEMBER 31, 2016 AND 2015 (Dollars in Thousands) (Continued)
N-14
2. Deposits and Investments (continued) Interest Rate Risk (continued) debt securities that were outside of the policy. MLGW uses the segmented time distribution method of disclosure, as shown above, to identify this risk. Some investments can be highly sensitive to changes in interest rates due to their terms or characteristics. In MLGW’s investment portfolio, asset-backed and government mortgage-backed securities are most sensitive to changes in interest rates as their repayments can vary significantly with interest rate changes. These securities represent 7.2% of the total investment portfolio with a fair market value of $24,486 at year-end 2016. Credit Risk Credit risk is the risk that an issuer of a debt security will not fulfill its obligation. This credit risk is measured by the credit quality of investments in debt securities as described by nationally recognized statistical rating organizations. Investments in obligations of the U.S. Government or obligations explicitly guaranteed by the U.S. Government are not considered to have credit risk. MLGW debt securities that were subject to credit risk were $139,197, or 41.2% of total investments. The debt securities mentioned above have a remaining maturity of one year or less.

NOTES TO FINANCIAL STATEMENTS DECEMBER 31, 2016 AND 2015 (Dollars in Thousands) (Continued)
N-15
2. Deposits and Investments (continued) Credit Risk (continued) MLGW’s ratings and policy limits as of December 31, 2016 are as follows:
Investment Type Fair Value S&P Rating Moody's RatingCommercial Paper 27,979$ AAA AaaCommercial Paper 36,277 AA+ AaaCommercial Paper 4,496 AA+ Aa1Commercial Paper 3,498 AA+ Aa2Commercial Paper 21,086 AA Aa2Commercial Paper 34,549 AA- Aa3Commercial Paper 6,306 AA- Aa2Certificates of Deposit 5,006 NR NR
Total credit riskdebt securities 139,197
U.S. Treasuries 132,189 AA+u AaaFederal Agency (Fixed Rate) 25,464 AA+u AaaFederal Agency (Fixed Rate) 38,076 AA+ AaaFederal Agency (Callable) 2,086 1 AA+ AaaFederal Agency (Callable) 1,161 2 AA+u Aaa
U.S. Government and Agencies 198,976
Total debt securitiesinvestments 338,173$
NR Not Rated
Non-Rating Description
1 Government/Agency Money Market Fund primarily consists of U.S. government/agencies securities.2 These bonds are guaranteed by the Export-Import Bank of the United States

NOTES TO FINANCIAL STATEMENTS DECEMBER 31, 2016 AND 2015 (Dollars in Thousands) (Continued)
N-16
2. Deposits and Investments (continued) Concentration of Credit Risk Concentration of credit risk is the risk of loss attributed to the magnitude of a government’s investment in a single issuer. Investments in any one issuer that represent five percent or more of total investments must be disclosed by amount and issuer. Investments issued or explicitly guaranteed by the U.S. government and investments in bank deposits, external investment pools, and other pooled investments are excluded from this requirement. In accordance with the investment policy, no more than 10% of MLGW’s portfolio will be invested in the securities of any single issuer with the following exceptions: U.S. Government Obligations up to 100% of the portfolio book value for any single issuer at the date of acquisition. In addition, MLGW’s investment policy seeks to diversify its portfolio by limiting the percentage of the portfolio that may be invested in any one type of instrument as follows:
U.S. Treasuries 100% maximumFederal Agency (Fixed Rate) 100% maximumFederal Agency (Callable) 50% maximumRepurchase Agreements 50% maximumCommercial Paper (Rated AA or higher) 90% maximumBanker's Acceptance (Rated AA or higher) 60% maximumCertificates of Deposit 20% maximumMunicipal Obligations 20% maximumTennessee LGIP 40% maximum
In accordance with GASB Statement No. 40, governments should provide information about investments in any one issuer that represents 5 percent or more of total investments. As of December 31, 2016, the investments in any one issuer of commercial paper that represents 5% or more of MLGW’s investments are as follows:
Reported PercentageIssuer Amount of Portfolio
Microsoft Corporation 17,984$ 5.32%National Securities Clearing Corporation 21,288 6.29%Toyota Motor Credit Corporation 26,553 7.85%Total 65,825$

NOTES TO FINANCIAL STATEMENTS DECEMBER 31, 2016 AND 2015 (Dollars in Thousands) (Continued)
N-17
2. Deposits and Investments (continued) Restricted and Unrestricted Funds Restricted funds, cash and cash equivalents, and investments consisted of the following as of December 31, 2016 and 2015:
2016 2015 2016 2015 2016 2015Restricted fund:
Cash and cash equivalents 56,907$ 55,439$ 20,866$ 17,486$ 10,044$ 10,228$ Investments 11,016 8,922 28,395 4,636 19,712 3,758
Total restricted funds 67,923$ 64,361$ 49,261$ 22,122$ 29,756$ 13,986$
2016 2015 2016 2015 2016 2015Unrestricted fund:
Cash and cash equivalents 113,349$ 160,465$ 40,607$ 65,814$ 12,233$ 13,613$ Investments 92,361 95,299 31,115 37,458 9,975 8,083
Total unrestricted funds 205,710$ 255,764$ 71,722$ 103,272$ 22,208$ 21,696$
Electric Division Gas Division Water Division
Electric Division Gas Division Water Division
3. Notes Receivables In 2002, MLGW and the Valero Refining Group (“Valero”) entered into an agreement, whereby MLGW provided for the construction of two pipelines (14” and 20”) and leased them to Valero for the purpose of transporting crude oil and refinery products. The lease provided for monthly payments of principal and interest and had an initial term of 15 years, which ended October 31, 2016 and July 31, 2016, for the 14” Pipeline and the 20” Pipeline, respectively. In November 2016, MLGW and the Valero Refining Group (‘Valero”) executed the secondary agreement of the expired 15 year initial term lease agreement, whereby Valero will continue to provide monthly payments under a secondary term of 30 years, ending October 31, 2046 for the 14” Pipeline and July 31, 2046 for the 20” Pipeline, subject to any early termination pursuant to the terms of the Pipeline Agreements. Scheduled lease payments for January – June 2017 total $375. Effective July 1, 2017 and each July 1 thereafter throughout the Secondary Term, the monthly fee applicable for the previous year for the 20” Pipeline and 14” Pipeline, respectively, shall be adjusted based on the Producer Price Index for Finished Goods (“PPI-FG”) formula per the contract.

NOTES TO FINANCIAL STATEMENTS DECEMBER 31, 2016 AND 2015 (Dollars in Thousands) (Continued)
N-18
3. Notes Receivables (continued) The Valero lease receivable is included in Notes Receivables in the accompanying 2016 Gas Division’s Statements of Net Position, except for the current portion of $750, which is included in other current assets. 4. Utility Plant Utility plant activity for the years ended December 31, 2016 and 2015 is as follows:
Beginning Ending Balance Increases Decreases Balance
Year ended December 31, 2016Electric DivisionCapital assets not being depreciated: Land 38,390$ 13$ -$ 38,403$ Land - Non-utility 15,345 - - 15,345 Construction in progress 91,430 94,226 (83,211) 102,445 Total capital assets not being depreciated 145,165 94,239 (83,211) 156,193
Capital assets being depreciated or amortized: Structures and improvements 62,206 744 (10) 62,940 Transmission and distribution plant equipment 1,377,852 58,222 (16,767) 1,419,307 General plant equipment 159,677 20,990 (750) 179,917 Intangibles: Software 8,790 3,242 - 12,032 Total capital assets being depreciated or amortized 1,608,525 83,198 (17,527) 1,674,196 Less accumulated depreciation and amortization (711,937) (60,623) 21,634 (750,926) Total capital assets being depreciated or amortized, net 896,588 22,575 4,107 923,270 Total capital assets, net 1,041,753$ 116,814$ (79,104)$ 1,079,463$

NOTES TO FINANCIAL STATEMENTS DECEMBER 31, 2016 AND 2015 (Dollars in Thousands) (Continued)
N-19
4. Utility Plant (continued)
Beginning Ending Year ended December 31, 2016 Balance Increases Decreases BalanceGas DivisionCapital assets not being depreciated: Land 7,533$ -$ (220)$ 7,313$ Land - Non-utility - - - - Construction in progress 61,184 43,032 (33,013) 71,203 Plant held for future use 212 - - 212 Total capital assets not being depreciated 68,929 43,032 (33,233) 78,728 Capital assets being depreciated or amortized: Structures and improvements 65,175 3,078 (126) 68,127 Processing and distribution plant equipment 452,195 26,286 (7,039) 471,442 General plant equipment 72,826 3,649 (257) 76,218 Intangibles: Software - - - - Non-utility plant equipment 200 - - 200 Total capital assets being depreciated or amortized 590,396 33,013 (7,422) 615,987 Less accumulated depreciation and amortization (295,584) (23,040) 7,539 (311,085) Total capital assets being depreciated or amortized, net 294,812 9,973 117 304,902 Total capital assets, net 363,741$ 53,005$ (33,116)$ 383,630$
Beginning Ending Balance Increases Decreases Balance
Year ended December 31, 2016Water DivisionCapital assets not being depreciated: Land 2,339$ 33$ -$ 2,372$ Construction in progress 14,289 31,045 (23,032) 22,302 Total capital assets not being depreciated 16,628 31,078 (23,032) 24,674
Capital assets being depreciated or amortized: Structures and improvements 50,325 494 - 50,819 Pumping, transmission and distribution plant equipment 357,979 21,685 (3,092) 376,572 General plant equipment 38,871 820 (12) 39,679 Intangibles: Software 2,177 - - 2,177 Total capital assets being depreciated or amortized 449,352 22,999 (3,104) 469,247 Less accumulated depreciation and amortization (191,624) (10,786) 3,773 (198,637) Less acquisition adjustment (3,368) 964 - (2,404) Total capital assets being depreciated or amortized, net 254,360 13,177 669 268,206 Total capital assets, net 270,988$ 44,255$ (22,363)$ 292,880$

NOTES TO FINANCIAL STATEMENTS DECEMBER 31, 2016 AND 2015 (Dollars in Thousands) (Continued)
N-20
4. Utility Plant (continued)
Beginning Ending Year ended December 31, 2015 Balance Increases Decreases BalanceElectric DivisionCapital assets not being depreciated: Land 38,392$ (2)$ -$ 38,390$ Land - Non-utility 15,345 - - 15,345 Construction in progress 73,423 70,702 (52,695) 91,430 Total capital assets not being depreciated 127,160 70,700 (52,695) 145,165
Capital assets being depreciated or amortized: Structures and improvements 61,534 903 (231) 62,206 Transmission and distribution plant equipment 1,346,750 38,928 (7,826) 1,377,852 General plant equipment 162,089 12,605 (15,017) 159,677 Intangibles: Software - 8,790 - 8,790 Total capital assets being depreciated or amortized 1,570,373 61,226 (23,074) 1,608,525 Less accumulated depreciation and amortization (678,605) (52,432) 19,100 (711,937) Total capital assets being depreciated or amortized, net 891,768 8,794 (3,974) 896,588 Total capital assets, net 1,018,928$ 79,494$ (56,669)$ 1,041,753$
Beginning Ending Year ended December 31, 2015 Balance Increases Decreases BalanceGas DivisionCapital assets not being depreciated: Land 7,545$ (12)$ -$ 7,533$ Land - Non-utility 66 - (66) - Construction in progress 49,964 29,347 (18,127) 61,184 Plant held for future use 212 - - 212 Total capital assets not being depreciated 57,787 29,335 (18,193) 68,929 Capital assets being depreciated or amortized: Structures and improvements 61,472 4,749 (1,046) 65,175 Processing and distribution plant equipment 445,177 7,571 (553) 452,195 General plant equipment 72,451 6,865 (6,490) 72,826 Intangibles: Software - - - - Non-utility plant equipment 200 - - 200 Total capital assets being depreciated or amortized 579,300 19,185 (8,089) 590,396 Less accumulated depreciation and amortization (286,352) (16,723) 7,491 (295,584) Total capital assets being depreciated or amortized, net 292,948 2,462 (598) 294,812 Total capital assets, net 350,735$ 31,797$ (18,791)$ 363,741$

NOTES TO FINANCIAL STATEMENTS DECEMBER 31, 2016 AND 2015 (Dollars in Thousands) (Continued)
N-21
4. Utility Plant (continued)
Beginning Ending Year ended December 31, 2015 Balance Increases Decreases BalanceWater DivisionCapital assets not being depreciated: Land 2,332$ 7$ -$ 2,339$ Construction in progress 10,333 11,618 (7,662) 14,289 Total capital assets not being depreciated 12,665 11,625 (7,662) 16,628
Capital assets being depreciated or amortized: Structures and improvements 49,836 489 - 50,325 Pumping, transmission and distribution plant equipment 352,030 6,524 (575) 357,979 General plant equipment 42,397 642 (4,168) 38,871 Intangibles: Software - 2,177 - 2,177 Total capital assets being depreciated or amortized 444,263 9,832 (4,743) 449,352 Less accumulated depreciation and amortization (186,004) (8,765) 3,145 (191,624) Less acquisition adjustment (4,332) 964 - (3,368) Total capital assets being depreciated or amortized, net 253,927 2,031 (1,598) 254,360 Total capital assets, net 266,592$ 13,656$ (9,260)$ 270,988$
Total net capital asset changes include additions to construction in progress, transfers to or from other accounts, depreciation and amortization and the effects of sales, retirements, and contribution in aid of construction. MLGW's planned construction program expenditures for 2017 are estimated as follows (unaudited): Electric Division $ 125,555 Gas Division 52,821 Water Division 48,754 In June 1999, the Water Division purchased the Shelby County Water Distribution System and related assets from Shelby County, Tennessee. The difference between the purchase price and the net book value of the assets acquired (the "acquisition adjustment") is being amortized over twenty years by the Water Division. 5. Futures, Options and Swap Contracts MLGW uses a range of derivative instruments to hedge commodity risk including futures, options, and swap contracts. The purchase and sale of futures contracts and swap contracts involve highly leveraged and rapidly fluctuating markets that can lead to significant losses for market participants. As such, market participants are required to maintain margin deposits with a Futures Commission Merchant (FCM) in order to trade in the commodity futures market. These margin deposits are required by the FCM as a

NOTES TO FINANCIAL STATEMENTS DECEMBER 31, 2016 AND 2015 (Dollars in Thousands) (Continued)
N-22
5. Futures, Options and Swap Contracts (continued) condition of its contract to provide execution, clearing and bookkeeping services relative to the purchase and sale of commodity futures. The FCM is not subject to state laws which govern financial institutions serving as depositories for municipal funds, but instead is governed by rules and regulations promulgated by the Federal Commodity Futures Trading Commission. The Commodity Exchange Act requires the FCM to segregate all customer transactions and assets from the FCM’s proprietary activities. Futures contracts and swap contracts are marked-to-market daily and valued at closing market prices on the valuation date. The fluctuations in the value of the futures contracts are recorded for financial statement purposes as deferred gains or losses. MLGW’s derivative instruments could be potentially exposed to concentrations of counterparty credit. MLGW’s derivatives transactions are conducted directly or indirectly with the New York Mercantile Exchange (“NYMEX”). By clearing all trades through NYMEX, MLGW’s exposure to counterparty credit risk for such transactions are largely minimized. Gas Division: The Gas Division enters into futures contracts, swaps, and options on futures contracts as cash flow hedges to manage the risk of volatility in the market price of natural gas on anticipated purchase transactions. The market values of the open derivative positions are reported on the Statements of Net Position as derivative financial instruments. MLGW maintained a margin deposit balance of $2,423 and $2,948 with its FCM at December 31, 2016 and 2015, respectively. The schedule below shows the market values and notional amounts of the open futures, swaps, and options on futures contracts as of December 31, 2016 and 2015.
Type Market Notional Market NotionalValue Amount Value Amount
Futures $ - $ - (617)$ 2,989$ Swaps - - - -Options 9 29,280 - -
Total 9$ 29,280$ (617)$ 2,989$
December 31, 2016 December 31, 2015
NOTES TO FINANCIAL STATEMENTSDECEMBER 31, 2016 AND 2015(Dollars in Thousands)(Continued)
N-23
5. Futures, Options and Swap Contracts (continued)
The schedule below reflects the deferred gains (losses) at year end associated with recording open derivative positions.
December 31, 2016 December 31, 2015Type Deferred Gains (Losses) Deferred Gains (Losses)
Futures $ - ($617)Swaps - -Options 9 -
Total $ 9 ($617)
Deferred costs at year end associated with gains (losses) on closed derivative positions are shown below.
December 31, 2016 December 31, 2015Type Deferred Gains (Losses) Deferred Gains (Losses)
Futures $ - ($983)Swaps - -Options (539) -
Total ($539) ($983)
The deferred gains (losses) at year end for the open derivative positions are reported on the Statement of Net Position as deferred inflows of resources and deferred outflows of resources, respectively. The deferred gains and losses derived from closed derivative positions are reported as other current assets and liabilities, respectively.
Electric Division:
The Electric Division enters into swap contracts to manage the risk of volatility in the market price of unleaded and diesel fuel on anticipated purchase transactions. The balance in MLGW’s FCM fuel margin at December 31, 2016 and 2015 was ($278) and ($236), respectively.
Swap contracts as of December 31, 2016 and 2015 are reported at market values of $0 and ($40), respectively. The market values of these derivative positions are reported on the Statement of Net Position as derivative financial instruments. The notional amounts of the open swaps at December 31, 2016 and 2015 were $0 and $90, respectively.
NOTES TO FINANCIAL STATEMENTS DECEMBER 31, 2016 AND 2015 (Dollars in Thousands) (Continued)
N-24
6. Deferred Compensation Plan MLGW offers its employees a deferred compensation plan under Internal Revenue Code Section 457. The plan, available to all full-time MLGW employees, permits them to defer a portion of their salaries until future years. The deferred compensation is not available to employees until termination, retirement, death, or unforeseeable emergency. The plan provides that assets or income of the plan shall be used for the exclusive purpose of providing benefits for participants and their beneficiaries or defraying reasonable expenses of administration of the plan. Since the assets of the amended plan are held in custodial and annuity accounts for the exclusive benefit of plan participants, the related assets of the plan are not reflected in MLGW’s Statements of Net Position. 7. Employee Retirement System Plan Description Memphis Light, Gas and Water Retirement and Pension System (the “MLGW Pension Plan”) is a single-employer defined benefit pension plan administered by the MLGW Pension Board. The plan covers permanent, full-time employees and appointed commissioners who opt to participate. MLGW issues a separate audited financial report for the MLGW Pension Plan that includes financial statements and required supplementary information. That report may be obtained by writing to Manager, Risk Management, P. O. Box 430, Memphis, TN 38101. Benefits Provided The MLGW Pension Plan provides death and disability benefits as well as retirement benefits. MLGW Pension Plan members hired prior to January 1, 2014 who attain the age of fifty-five and retire on or after ten years of creditable service, or attain the age of seventy and retire on or after five years of creditable service, or attain twenty-five years of creditable service regardless of age are entitled to an annual retirement allowance computed by multiplying the applicable percentage for the age of retirement times the number of years of creditable service, which equals the benefit percentage, times the final average compensation. MLGW Pension Plan members hired on or after January 1, 2014 who attain the age of sixty and retire on or after ten years of creditable service, or attain the age of seventy and retire on or after five years of creditable service, or attain the age of 55 with twenty-five years of creditable service are entitled to an annual retirement allowance computed by multiplying the applicable percentage for the age of retirement times the number of years of creditable service, which equals the benefit percentage, times the final average compensation.

NOTES TO FINANCIAL STATEMENTS DECEMBER 31, 2016 AND 2015 (Dollars in Thousands) (Continued)
N-25
7. Employee Retirement System (continued) Effective January 1, 2001, the following table is the applicable benefit percentage for each year of creditable service at the applicable retirement age under the MLGW Pension Plan:
59 1/2 and less606162 and older
Benefit PercentageFor Each Year of Creditable ServiceRetirement Age
2.25%2.30%2.40%2.50%
Final average compensation is the member’s basic earnings (which includes member contributions pursuant to Section 414(h) and Section 457 of the Internal Revenue Code (the “Code”) for the three consecutive years of creditable service if less than 30 years, two consecutive years if more than 30 years and one year if 35 or more years of creditable service during which the compensation was the highest) plus work out of classification pay, shift differential pay, and automobile allowance for such employees designated by Resolution of the Board of Commissioners. The annual retirement allowance shall not exceed 85.0% of the member’s final average compensation. The 2016 minimum monthly retirement benefit for all members is the greater of $50 per month per year of service or $500. Cost of Living Adjustments As of July 1 of each plan year, each retired participant who (1) has attained age 56 on such date and (2) has been terminated from the employment of the Division for at least one year, shall be entitled to an increase in the amount of his monthly benefit under the MLGW Pension Plan equal to the cost of living adjustment. A surviving spouse receiving death benefits shall be entitled to a cost of living adjustment if the surviving spouse has attained age 56 and the deceased participant has separated from service at least one year prior to July 1. The cost of living adjustment shall be equal to the product of the monthly benefit payable to the participant or the surviving spouse under the MLGW Pension Plan for the immediately preceding plan year multiplied by the applicable percentage increase in the Consumer Price Index (CPI) for the immediately preceding calendar year.

NOTES TO FINANCIAL STATEMENTS DECEMBER 31, 2016 AND 2015 (Dollars in Thousands) (Continued)
N-26
7. Employee Retirement System (continued) The applicable percentage increase shall be determined based on the age of the participant or surviving spouse as of the first day of July of the plan year in which the adjustment is made as follows:
56-58
59-61
62 and older, and allDisabled Participants
75%
Percentage ofAge CPI Increase
30%
60%
The cost of living adjustment for any retired participant or surviving spouse in any plan year shall not exceed 5% of the retired participant’s or surviving spouse’s benefit under the MLGW Pension Plan for the immediately preceding plan year. Under no circumstances shall the cost of living adjustment result in a decrease in the benefit of a retired participant or surviving spouse. Employees Covered Plan membership consisted of the following participants as of December 31, 2015 and 2014:
2015 2014Retirees and beneficiaries receiving benefits 2,617 2,597
Participants inactive during year ended December 31 with vested rights 44 45
Active members fully vested 1,116 1,112
Active members not vested 1,427 1,414 Total 5,204 5,168
Contributions The contribution requirements of pension plan members and MLGW are established and may be amended and approved by the MLGW Pension Board, the MLGW Board of Commissioners and the Memphis City Council. Pension plan members are required to contribute 8% of their annual covered salary. Under Article III, Section 3.2 of the pension plan, MLGW shall contribute to the pension fund such amounts as from time to time are estimated by the actuary. MLGW also funds the 8% pension plan member’s

NOTES TO FINANCIAL STATEMENTS DECEMBER 31, 2016 AND 2015 (Dollars in Thousands) (Continued)
N-27
7. Employee Retirement System (continued) Contributions (continued) contributions on behalf of the president and vice presidents. For 2015, MLGW contributed 13.32% of the annual covered payroll. Employer contributions recognized by the MLGW Pension Plan during 2016 totaled $21,390. Net Pension Liability MLGW’s net pension liability was measured as of December 31, 2015 and the total pension liability used to calculate the net pension liability was determined by an actuarial valuation as of January 1, 2016. Actuarial Assumptions The actuarial assumptions used in the valuation as of December 31, 2015 are based on the results of an experience study for the period January 1, 2009 to December 31, 2013.
Inflation 2.75%
Salary increases Inflation plus merit increases that vary by age and service, rangingfrom 0.00% to 6.75%
Investment rate of return 7.50% including inflation, net of investment expenses
Cost-of-living 0.83% for ages 56-58adjustments 1.65% for ages 59-61
2.06% for ages 62 and older, and all disabled participants Pre-retirement mortality rates are based on the RP-2014 Employee Mortality Table with sex-distinct rates. Healthy annuitant mortality rates are based on the RP-2014 Healthy Annuitant Mortality Table with sex-distinct rates, adjusted by a factor of 138%. Disabled annuitant mortality rates are based on the RP-2014 Disabled Retiree Mortality Table with sex-distinct rates, also adjusted by a factor of 138%. All mortality tables above are projected generationally with a modified RPEC2014 projection table using a 15-year convergence period for cohort effects and 10-year convergence period for age/period effects. The long-term expected rate of return on pension plan investments was determined using a building-block method in which best-estimate ranges of expected future real rates of return (expected returns, net of pension plan investment expense and inflation) are developed for each major asset class. These returns are combined to produce the long-term expected rate of return by weighting the expected future real rates of return by the target asset allocation percentage and by adding expected inflation and deducting expected investment expenses.

NOTES TO FINANCIAL STATEMENTS DECEMBER 31, 2016 AND 2015 (Dollars in Thousands) (Continued)
N-28
7. Employee Retirement System (continued) Actuarial Assumptions (continued) The target allocation and projected arithmetic real rates of return for each major asset class, after deducting inflation, but before investment expenses, used in the derivation of the long-term expected investment rate of return assumption are summarized in the following table:
TargetAsset Class AllocationDomestic Equity 39%International Equity 12%Fixed Income 29%Alternatives 8%Real Estate 10%Short Term Investments 2%Total 100%
3.84%4.64%1.24%
Long-Term ExpectedReal Rate of Return
6.84%8.14%2.45%
Discount Rate The discount rate used to measure the total pension liability is 7.50% as of December 31, 2015. The projection of cash flows used to determine the discount rate assumed that employee contributions will be made at the current 8.00% of pay contribution rate and that MLGW contributions will equal the actuarially determined contribution. For this purpose, only employee and employer contributions that are intended to fund benefits of current plan members and their beneficiaries are included. Based on those assumptions, the MLGW Pension Plan's fiduciary net position was projected to be available to make all projected future benefit payments of current active and inactive employees. Therefore, the long-term expected rate of return on pension plan investments was applied to all periods of projected benefit payments to determine the total pension liability as of December 31, 2015. Sensitivity of the Net Pension Liability to Changes in the Discount Rate The following presents the net pension liability of MLGW as of December 31, 2015, calculated using the discount rate of 7.50%, as well as what MLGW’s net pension liability would be if it were calculated using a discount rate that is one percentage-point lower (6.50%) or one percentage-point higher (8.50%) than the current rate:
Net pension liability (asset) as of December 31, 2015(6.50%) (7.50%) (8.50%)
245,831$ 87,004$ (43,569)$
Current1% Decrease Discount 1% Increase

NOTES TO FINANCIAL STATEMENTS DECEMBER 31, 2016 AND 2015 (Dollars in Thousands) (Continued)
N-29
7. Employee Retirement System (continued) Pension Plan’s Fiduciary Net Position Detailed information about the MLGW Pension Plan’s fiduciary net position is available in the separately issued plan financial statements. For purposes of measuring the net pension liability, all information about the pension plan’s assets, deferred outflows of resources, liabilities, deferred inflows of resources, and fiduciary net position have been determined on the same basis as they are reported by the MLGW Pension Plan. The MLGW Pension Plan’s financial statements are prepared using the accrual basis of accounting in accordance with generally accepted accounting principles promulgated by the Governmental Accounting Standards Board. Investments are stated at fair value. Benefit payments (including refunds of employee contributions) are recognized when due and payable in accordance with the terms on the plan. Implementation of GASB 68 In fiscal year 2015, MLGW adopted GASB Statement No. 68, Accounting and Financial Reporting for Pensions – an Amendment of GASB Statement No. 27 (“GASB 68”). This statement provides guidance for the measurement and recognition of a net pension liability and pension expense, and includes instruction for balances to be recognized as deferred outflows of resources and deferred inflows of resources. Due to time constraints associated with producing the financial statements and the need to ensure timely filing of such statements with appropriate authorities, MLGW deemed it impractical to restate all prior periods. As such, the cumulative effect of applying this statement is shown in 2015. The impact for MLGW is as follows: Net pension liability – The net pension liability reported under GASB 68 is the difference between the actuarial present value of projected pension benefit payments attributable to employees’ past service and the Plan’s fiduciary net position. Previous to this new guidance, a liability was recognized only to the extent that contributions made to the plan were exceeded by the actuarially calculated contributions. Deferred outflows of resources and deferred inflows of resources – GASB 68 requires recognition of deferred outflows and inflows of resources associated with the difference between projected and actual earnings on Plan investments, to be amortized to pension expense over a closed five-year period. Also to be recognized as deferred outflows and inflows of resources are differences between expected and actual experience with regard to economic or demographic factors in the measurement of total pension liability, to be amortized to pension expense over a closed period equal to the average of the expected remaining service lives of all employees receiving pension benefits. Employer contributions to the pension trust made between the net pension liability measurement date and the employer’s fiscal year end are recognized as deferred outflows of resources related to pensions. The cumulative effect of applying this statement in 2015 resulted in a reduction in the beginning net position of all three divisions. Beginning net position in 2015 in the Electric, Gas, and Water Divisions declined by $11,356, $5,065, and $3,363, respectively.

NOTES TO FINANCIAL STATEMENTS DECEMBER 31, 2016 AND 2015 (Dollars in Thousands) (Continued)
N-30
7. Employee Retirement System (continued)
Schedule of Changes in Net Pension Liability
Total Pension Plan Fiduciary Net PensionLiability Net Position Liability
(a) (b) (a)-(b)Balance at December 31, 2014 $ 1,382,794 $ 1,379,184 3,610$
Changes for the Year: Service Costs 30,139 30,139
Interest 99,940 99,940
Differences Between Expected and Actual Experience 2,275 2,275
Changes of Assumptions - -
Contributions – Employer 21,390 (21,390)
Contributions – Employee 12,310 (12,310)
Net Investment Income 15,231 (15,231)
Benefit Payments / Refunds (100,528) (100,528) -
Administrative Expenses (759) 759
Net Change 31,826 (52,356) 84,182
Other Adjustments 788 (788)
Balance at December 31, 2015 $ 1,414,620 $ 1,327,616 $ 87,004
Increase (Decrease)
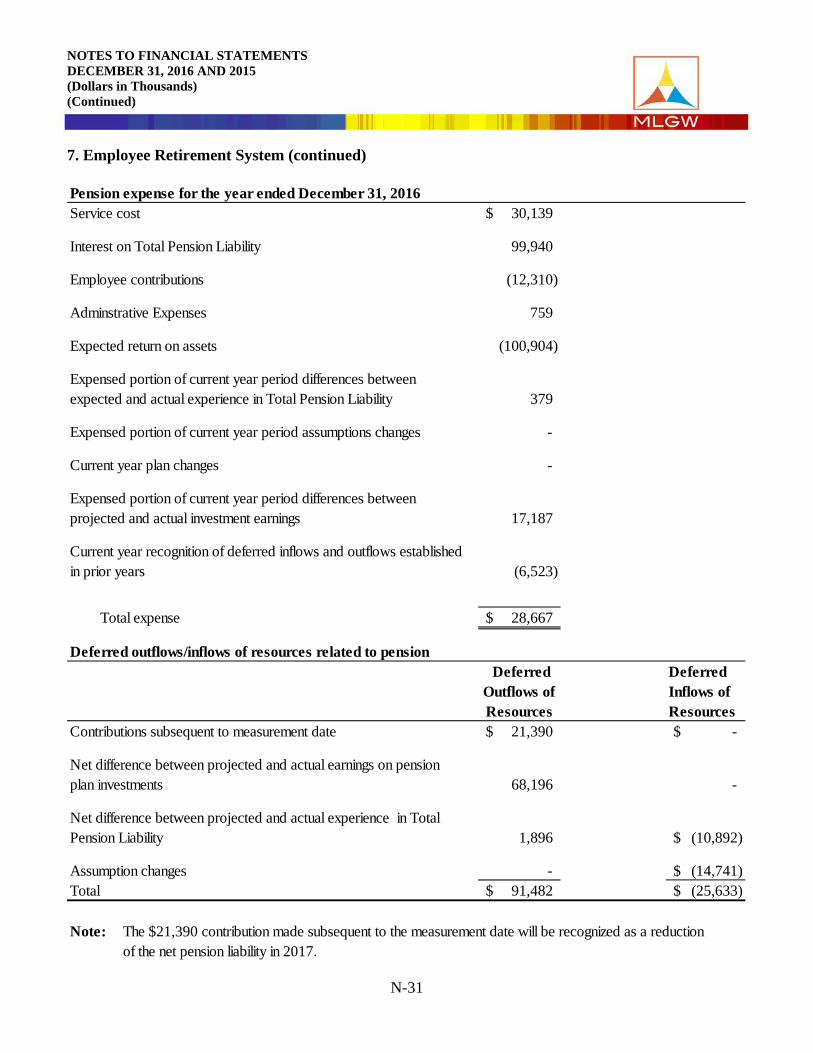
NOTES TO FINANCIAL STATEMENTS DECEMBER 31, 2016 AND 2015 (Dollars in Thousands) (Continued)
N-31
7. Employee Retirement System (continued) Pension expense for the year ended December 31, 2016Service cost 30,139$
Interest on Total Pension Liability 99,940
Employee contributions (12,310)
Adminstrative Expenses 759
Expected return on assets (100,904)
Expensed portion of current year period differences between expected and actual experience in Total Pension Liability 379
Expensed portion of current year period assumptions changes -
Current year plan changes -
Expensed portion of current year period differences between projected and actual investment earnings 17,187
Current year recognition of deferred inflows and outflows established in prior years (6,523)
Total expense 28,667$
Deferred outflows/inflows of resources related to pension Deferred
Outflows of Resources
Deferred Inflows of Resources
Contributions subsequent to measurement date 21,390$ -$
Net difference between projected and actual earnings on pension plan investments 68,196 -
Net difference between projected and actual experience in Total Pension Liability 1,896 (10,892)$
Assumption changes - (14,741)$ Total 91,482$ (25,633)$
Note: The $21,390 contribution made subsequent to the measurement date will be recognized as a reduction of the net pension liability in 2017.

NOTES TO FINANCIAL STATEMENTS DECEMBER 31, 2016 AND 2015 (Dollars in Thousands) (Continued)
N-32
7. Employee Retirement System (continued) Projected recognition of deferred outflows/(inflows)
Original Balance
Original Amortization
Period (Years)
Amount Recognized During FYE December 31, 2016 2017 2018 2019 2020
2021 and Thereafter
Fiscal year OutflowsInvestment 2016 $ 85,673 5.00 - $ 17,134 $ 68,539 $ 17,134 $ 17,134 $ 17,134 $ 17,134 -
Demographic 2016 2,275 6.00 - 379 1,896 379 379 379 379 379Total Outflows $ 17,513 $ 70,435 $ 17,513 $ 17,513 $ 17,513 $ 17,513 $ 379
Fiscal year Inflows
Investment 2015 (571) 5.00 (457) (114) (343) (114) (114) (114) - - Demographic 2015 (16,338) 6.00 (13,615) $ (2,723) $ (10,892) $ (2,723) $ (2,723) $ (2,723) $ (2,723) - Assumption 2015 (21,112) 6.00 $ (18,427) $ (3,685) $ (14,741) $ (3,685) $ (3,685) $ (3,685) $ (3,685)
Total Inflows $ (6,522) $ (25,976) $ (6,522) $ (6,522) $ (6,522) $ (6,408) $ - Total $10,991 $44,459 $10,991 $10,991 $10,991 $11,105 $ 379
Note: In accordance with Paragraph 71 of GASB Statement 68, the difference between projected and actual earnings on investments is recognized over a closed five-year period. The difference between expected and actual total pension liability experience (noted as “Demographic” in the chart above) and the assumption changes (noted as “Assumption” in the chart above) are each recognized over a closed period equal to the average of the expected remaining service lives of all employees who are provided with pensions through the pension plan (active employees and inactive employees) determined as of the beginning of the measurement period. For 2015, the period is six years.
Outstanding Balance at December 31, 2016
Deferred Outflows/(Inflows) Recognized in Future Years
Year Established
Outstanding Balance at
December 31, 2015
8. Other Postemployment Benefits The Memphis Light, Gas and Water Division OPEB Trust (“OPEB Trust”) was established for the exclusive benefit of MLGW’s retired employees and their dependents (who meet the eligibility requirements) to fund the postemployment benefits provided through the health and welfare benefit plan. Amounts contributed to the OPEB Trust by MLGW are held in trust and are irrevocable and are for the sole and exclusive purpose of funding health and welfare benefits of the eligible participants, and the cost of operating and administering the OPEB Trust. The OPEB Trust is administered by the MLGW OPEB Committee. Plan Description Memphis Light, Gas and Water Division, by resolution of its Board of Commissioners, has established, adopted, and maintains a medical benefits (health and welfare) plan (the “Plan”) for its retired employees and their eligible dependents. The Plan is a single-employer defined benefit healthcare plan administered by MLGW. MLGW issues a separate audited financial report for the OPEB Trust that includes financial statements and required supplementary information. That report may be obtained by writing to: Manager, General Accounting, P.O. Box 430, Memphis, Tennessee 38101-0430.

NOTES TO FINANCIAL STATEMENTS DECEMBER 31, 2016 AND 2015 (Dollars in Thousands) (Continued)
N-33
8. Other Postemployment Benefits (continued) Plan Description (continued) The Plan provides postemployment coverage for health care, life insurance, accident/death and dismemberment (AD&D), medical, and prescription drugs to eligible retirees and their dependents. Benefits are payable to retirees and their spouses for their lifetime. Qualified dependents will continue to receive benefits as long as they are qualified under the Plan. Dental, dependent life insurance, cancer, accident, and long-term care benefits are available, but are 100% paid by the retiree. Employees retired under the MLGW Pension Plan, or disabled with five years of service at any age, or disabled in the line of duty at any age with no years of service restriction, are eligible for OPEB benefits. Health care benefits are also offered to qualifying survivors of active employees who are eligible to retire at the time of death. Funding Policy The contribution requirements of plan members and MLGW are established and may be amended by the MLGW Board of Commissioners. Retiree and spouse contribution rates are periodically reset and are currently at 25% of costs for medical and drug benefits. For life insurance and AD&D, retirees contribute 40% of the cost. The Board of Commissioners has set the employer contribution rate based on the annual required contribution (“ARC”), an amount actuarially determined in accordance with the parameters of GASB Codification Section P50: Postemployment Benefits Other Than Pension Benefits – Employer Reporting. The ARC represents a level of funding that, if paid on an ongoing basis, is projected to cover normal costs each year and amortize any unfunded actuarial liabilities of the plan over a period not to exceed thirty years. For fiscal years 2016 and 2015, employer contributions were $41,343 and $38,438 to the Plan, respectively. In 2016, plan members receiving benefits contributed $6,811 through their required contribution of $79.70 to $521.42 (dollars) per month depending on the coverage (employee only, employee and spouse, or family) and the health plan selected. In 2015, plan members receiving benefits contributed $6,848 through their required contribution of $79.70 to $521.42 (dollars) per month. Annual OPEB Cost and Net OPEB Obligation An actuarial valuation of MLGW’s postemployment welfare benefit program was performed for the Plan as of December 31, 2015. MLGW’s annual other postemployment benefit (OPEB) cost (expense) is calculated based on the annual required contribution (ARC).

NOTES TO FINANCIAL STATEMENTS DECEMBER 31, 2016 AND 2015 (Dollars in Thousands) (Continued)
N-34
8. Other Postemployment Benefits (continued) Annual OPEB Cost and Net OPEB Obligation (continued) The following table presents the OPEB cost for the year, the amount contributed to the plan, and changes in the net OPEB obligation as of December 31, 2016 and 2015:
2016 2015
Annual required contribution 45,289$ 38,187$ Interest on net OPEB obligation (206) (186) Adjustment to annual required
contribution 164 175 Annual OPEB cost 45,247 38,176
Contributions made (41,343) (38,438)Change in net OPEB (asset) obligation 3,904 (262)
Net OPEB (asset) obligation at beginningof fiscal year (2,750) (2,488)
Net OPEB (asset) obligation at endof fiscal year 1,154$ (2,750)$
MLGW’s annual OPEB cost, the percentage of annual OPEB cost contributed to the Plan, and the net OPEB (asset) obligation for fiscal year 2016 and the two preceding years were as follows:
Fiscal Percentage of Net OPEBYear Annual Annual OPEB Cost Obligation
Ended OPEB Cost Contributed (Asset)
December 31, 2016 45,247$ 91.4% 1,154$ December 31, 2015 38,176 100.7% (2,750)December 31, 2014 38,386 109.7% (2,488)
Funded Status and Funding Progress As of December 31, 2015, the most recent actuarial valuation date, the plan was 41.93% funded. The actuarial accrued liability (“AAL”) for benefits was $794,310 and the actuarial value of assets was $333,017, resulting in an unfunded actuarial accrued liability (“UAAL”) of $461,293. The covered payroll (annual payroll of active employees covered by the Plan) was $160,641, and the ratio of the UAAL to the covered payroll was 287.16%.

NOTES TO FINANCIAL STATEMENTS DECEMBER 31, 2016 AND 2015 (Dollars in Thousands) (Continued)
N-35
8. Other Postemployment Benefits (continued) Funded Status and Funding Progress (continued) Actuarial valuations of an ongoing plan involve estimates of the value of reported amounts and assumptions about the probability of occurrence of events far into the future. Examples include assumptions about future employment, mortality, and the healthcare cost trend. Amounts determined regarding the funded status of the plan and the annual required contributions of the employer are subject to continual revision as actual results are compared with past expectations and new estimates are made about the future. The schedule of funding progress, presented as required supplementary information following the notes to the financial statements, presents multiyear trend information indicating whether the actuarial value of plan assets is increasing or decreasing over time relative to the actuarial accrued liabilities for benefits. Actuarial Methods and Assumptions Projections of benefits for financial reporting purposes are based on the substantive plan (the plan as understood by the employer and the plan members) and include the types of benefits provided at the time of each valuation and the historical pattern of sharing of benefit costs between the employer and plan members to that point. The actuarial methods and assumptions include techniques that are designed to reduce the effects of short-term volatility in actuarial accrued liabilities and the actuarial value of assets, consistent with the long-term perspective of calculations. Actuarial methods and significant assumptions were as follows:

NOTES TO FINANCIAL STATEMENTS DECEMBER 31, 2016 AND 2015 (Dollars in Thousands) (Continued)
N-36
8. Other Postemployment Benefits (continued) Actuarial Methods and Assumptions (continued) Valuation Date December 31, 2015
Actuarial Cost Method Entry Age Normal
Amortization Method Level percent of pay, closed, 30 years
Remaining Amortization Period 29 years as of December 31, 2016
Asset Valuation Method Market value of assets less unrecognized returns in each of the last five years (applied prospectively beginning with 2014). Unrecognized return is equal to the difference between the actual market return and the expected return, and is recognized over a five-year period, further adjusted, if necessary, to be within 20% of the market value.
Actuarial Assumptions:Investment Rate of Return 7.50%
Inflation Rate 2.75%
Projected Salary Increases Inflation plus merit increases that vary by age and service
Medical Cost Trend Rate 7.25% graded to 5.00% over 9 years
Drug Cost Trend Rate 9.50% for the first 4 years, then grading down to 5.00% over the next 7 years 9. Pollution Remediation Obligation MLGW has a contract with a state licensed environmental remediation company. The liabilities or projected costs to remove asbestos, mold and lead from various substations and equipment because of imminent danger were derived from the environmental remediation contractor’s estimate. These estimates assume no expected change orders. MLGW annually evaluates current conditions, remediation plan updates and changes in legal or regulatory requirements to revise MLGW’s estimated liability. Regulatory accounts are used to capture the net effect of the changes in estimates for each Division. See Note 1 (Regulatory Accounting).
NOTES TO FINANCIAL STATEMENTS DECEMBER 31, 2016 AND 2015 (Dollars in Thousands) (Continued)
N-37
9. Pollution Remediation Obligation (continued) The schedule below shows the balances as of December 31, 2016 and 2015 for the lead pollution liability from various substations and equipment by Division:
12/31/2016 12/31/2015
ElectricLead 721$ 968$
Total Electric 721 968
GasLead 276 291
Total Gas 276 291
WaterLead 3,201 4,371
Total Water 3,201 4,371
Total Liability 4,198$ 5,630$
10. Risk Management MLGW is exposed to various risks of loss related to active and retiree medical claims; injuries to workers; torts; theft of, damage to, and destruction of assets; errors and omissions; environmental damages; and natural disasters. MLGW is self-insured for health and medical benefits and for injuries and damages including workers compensation and general liability claims. The Tennessee Governmental Tort Liability Act, TCA 29-20-101, et al, (the “Act”) applies to all tort actions against MLGW arising in the state of Tennessee. The Act establishes statutory limits of liability and MLGW is immune from any award or judgment for death, bodily injury or property damage in excess of the limits as set forth in the Act. Pursuant to the Act, the current limits of liability for personal injuries are $300 per person and $700 for two or more persons per accident. The liability for property damage is limited to $100 per accident. MLGW purchases insurance to address the risks of loss associated with the following: property damage; employee travel; out-of-state automobile travel; employee dishonesty; forgery; computer fraud; counterfeiting; damage to leased or rented equipment; and worker injuries exceeding MLGW’s retained risk of loss.

NOTES TO FINANCIAL STATEMENTS DECEMBER 31, 2016 AND 2015 (Dollars in Thousands) (Continued)
N-38
10. Risk Management (continued) MLGW has established insurance reserves for the estimated liabilities, including an accrual for incurred but not reported claims, resulting from medical benefits and injuries and damages claims as established by a third party administrator and MLGW’s Legal Department. The medical benefits reserve and the costs and charges to the reserve are allocated to each division based on a standard administrative and general cost allocation. MLGW is party to various lawsuits filed against it in the normal course of business (see Note 15). The changes in the self-insurance reserves for medical benefits and injuries and damages for the years ended December 31, 2016 and 2015 are as follows:
Electric Gas Water Electric Gas WaterDivision Division Division Division Division Division
Balance -- December 31, 2014 5,621$ 2,507$ 1,665$ 6,435$ 2,639$ 2,835$ Payments (40,471) (18,050) (11,986) (2,246) (1,011) (771) Incurred claims expense 43,080 19,213 12,758 1,224 1,025 924
Balance -- December 31, 2015 8,230 3,670 2,437 5,413 2,653 2,988 Payments (43,299) (19,311) (12,823) (1,973) (635) (566) Incurred claims expense 42,307 18,869 12,530 1,945 1,008 (301)
Balance -- December 31, 2016 7,238$ 3,228$ 2,144$ 5,385$ 3,026$ 2,121$
Medical Benefits Injuries and Damages

NOTES TO FINANCIAL STATEMENTS DECEMBER 31, 2016 AND 2015 (Dollars in Thousands) (Continued)
N-39
11. Bonds Bonds as of December 31, 2016 and 2015 consist of the following:
Electric Division: Electric System Revenue Bonds: Series 2003A, due serially 2015-2018 3.80 - 5.00% $ - $ 4,170 Series 2008, due serially 2017-2018 4.00 - 5.00% 96,930 96,930 Series 2010, due serially 2015-2018 3.00 - 5.00% 138,420 251,355 Series 2014, due serially 2015-2034 2.00 - 5.00% 66,105 68,575 Series 2016, due serially 2017-2036 3.00 - 5.00% 40,000 - Premium on revenue bonds 21,016 20,122 Total 362,471 441,152 Less: current portion of bonds payable (118,770) (115,405)
$ 243,701 $ 325,747
Gas Division: Gas System Revenue Bonds: Series 2016, due serially 2017-2036 3.00 - 5.00% $ 40,000 $ - Premium on revenue bonds 7,866 - Total 47,866 - Less: current portion of bonds payable (1,275) -
$ 46,591 $ -
Water Division: Water System Revenue Bonds: Series 2014, due serially 2015-2034 2.00 - 5.00% $ 13,870 $ 14,440 Series 2016, due serially 2017-2036 2.00 - 4.00% 30,000 - Premium on revenue bonds 3,331 869 Total 47,201 15,309 Less: current portion of bonds payable (1,700) (570)
$ 45,501 $ 14,739
Interest Rates 20152016

NOTES TO FINANCIAL STATEMENTS DECEMBER 31, 2016 AND 2015 (Dollars in Thousands) (Continued)
N-40
11. Bonds (continued) Principal payments on bonds are due annually on December 1. Debt service requirements as of December 31, 2016 are as follows:
Principal Interest
2017 $ 118,770 $ 16,150 2018 124,310 10,322 2019 4,095 4,470
2020 - 2024 23,050 19,774 2025 - 2029 29,075 13,750 2030 - 2034 36,400 6,414 2035 - 2036 5,755 347
Total $ 341,455 $ 71,227
Principal Interest
2017 $ 1,275 $ 1,773 2018 1,315 1,735 2019 1,370 1,683
2020 - 2024 7,805 7,453 2025 - 2029 9,945 5,313 2030 - 2034 12,535 2,720 2035 - 2036 5,755 347
Total $ 40,000 $ 21,024
Electric Division
Gas Division

NOTES TO FINANCIAL STATEMENTS DECEMBER 31, 2016 AND 2015 (Dollars in Thousands) (Continued)
N-41
11. Bonds (continued)
Principal Interest
2017 $ 1,700 $ 1,416 2018 1,750 1,371 2019 1,785 1,336
2020 - 2024 9,715 5,888 2025 - 2029 11,375 4,233 2030 - 2034 13,630 1,975 2035 - 2036 3,915 177
Total $ 43,870 $ 16,396
Water Division
MLGW, at its option, may redeem bonds prior to maturity at premiums and prices specified in the indentures. The Series 2008 and Series 2010 bonds are subject to mandatory redemption upon early termination of the Supplement to the Power Contract (“Supplement”) with TVA as discussed in Note 12. Bonds are secured by the pledge of the respective division’s revenues, by funds established by the bond resolutions and, in certain circumstances, proceeds from the sale of certain division assets. The estimated fair value of long-term debt for the Electric, Gas, and Water Divisions based on quoted market prices (including accrued interest) are as follows as of December 31, 2016 and 2015:
2016 2015Electric Division 367,243$ 459,430$
2016 2015Gas Division 45,078$ -$
2016 2015Water Division 45,159$ 15,694$
During 2016, the Electric Division issued $40,000 of Series 2016 revenue bonds to finance the costs of acquiring, expanding and/or improving the Electric Division and to pay certain costs of issuance with respect to the Series 2016 Electric Division Bonds. The first principal payment will be made December 1, 2017, and thereafter will be made annually with a final maturity date of December 1, 2036. The Series 2016 revenue bonds bear interest at annual fixed rates ranging from 3.00% to 5.00%. In addition, the Electric Division redeemed early the remaining principal balance of the Series 2003A bonds totaling $4,170.
NOTES TO FINANCIAL STATEMENTS DECEMBER 31, 2016 AND 2015 (Dollars in Thousands) (Continued)
N-42
11. Bonds (continued) During 2016, the Gas Division issued $40,000 of Series 2016 revenue bonds to finance the costs of acquiring, expanding and/or improving the Gas Division and to pay certain costs of issuance with respect to the Series 2016 Gas Division Bonds. The first principal payment will be made December 1, 2017, and thereafter will be made annually with a final maturity date of December 1, 2036. The Series 2016 revenue bonds bear interest at annual fixed rates ranging from 3.00% to 5.00%. During 2016, the Water Division issued $30,000 of Series 2016 revenue bonds to finance the costs of acquiring, expanding and/or improving the Water Division and to pay certain costs of issuance with respect to the Series 2016 Water Division Bonds. The first principal payment will be made December 1, 2017, and thereafter will be made annually with a final maturity date of December 1, 2036. The Series 2016 revenue bonds bear interest at annual fixed rates ranging from 2.00% to 4.00%. During 2014, the Electric Division issued $71,000 of Series 2014 revenue bonds to finance the costs of acquiring, expanding and/or improving the Electric Division and to pay certain costs of issuance with respect to the Series 2014 Electric Division Bonds. The first principal payment was made December 1, 2015, and thereafter will be made annually with a final maturity date of December 1, 2034. The Series 2014 revenue bonds bear interest at annual fixed rates ranging from 2.00% to 5.00%. During 2014, the Water Division issued $15,000 of Series 2014 revenue bonds to finance the costs of acquiring, expanding and/or improving the Water Division and to pay certain costs of issuance with respect to the Series 2014 Water Division Bonds. The first principal payment was made December 1, 2015, and thereafter will be made annually with a final maturity date of December 1, 2034. The Series 2014 revenue bonds bear interest at annual fixed rates ranging from 2.00% to 5.00%. During 2010, the Electric Division issued $460,050 of Series 2010 bonds to advance refund a portion of the outstanding Electric System Subordinate Revenue Bonds, Series 2003A, and to pay certain costs of issuance of the Series 2010 Bonds. The refunding was undertaken to reduce total future debt service payments. The 2010 Series Bonds have a net present value benefit of $16,541, with a cash savings of $18,809 over the life of the bonds. The first principal payment was made December 1, 2014, and thereafter will be made annually with a final maturity date of December 1, 2018. The Series 2010 Bonds bear interest at annual fixed rates ranging from 3.00% to 5.00%. The Series 2010 Bonds are not subject to optional redemption, but will be subject to extraordinary redemption prior to maturity. During 2008, the Electric Division issued $96,930 in revenue bonds to refund $100,000 of Series 2003B revenue bonds. The refunding was undertaken to convert the 2003B auction rate securities into fixed rate securities of the same maturity. The Series 2008 revenue bonds bear interest at annual fixed rates ranging from 4.00% to 5.00%. During 2003, the Electric Division issued $1,292,170 of Series 2003A and $100,000 of Series 2003B revenue bonds to prepay future power purchases from TVA under the Supplement. See Note 12. The Series 2003B revenue bonds were auction rate securities that bore interest for 35-day auction periods. The Series 2003B revenue bonds were refunded in 2008, as discussed above.

NOTES TO FINANCIAL STATEMENTS DECEMBER 31, 2016 AND 2015 (Dollars in Thousands) (Continued)
N-43
11. Bonds (continued) MLGW’s Electric Division bond covenants require that for Series 2008 and 2010 Bonds the ratio of net revenues to principal and interest for any fiscal year will equal at least 100%. The 2014 and 2016 Bonds require that the ratio of net revenues to principal and interest for any fiscal year will equal at least 120%. The composite electric bonds debt service coverage as of December 31, 2016 was 1.60. MLGW’s Gas Division bond covenants require that for Series 2016 Bonds the ratio of net revenues to principal and interest for any fiscal year will equal at least 120%. The composite gas bonds debt service coverage as of December 31, 2016 was 29.71. MLGW’s Water Division bond covenants require that for Series 2014 and 2016 Bonds the ratio of net revenues to principal and interest for any fiscal year will equal at least 120%. The composite water bonds debt service coverage as of December 31, 2016 was 15.54. Long-term debt activity for the years ended December 31, 2016 and 2015 was as follows:
Beginning Balance Increases Decreases
Ending Balance
Year ended December 31, 2016:Electric DivisionBonds payable:Revenue bonds 421,030$ 40,000$ (119,575)$ 341,455$ Premium on revenue bonds 20,122 8,089 (7,195) 21,016 Total bonds payable 441,152$ 48,089$ (126,770)$ 362,471$
Gas DivisionBonds payable:Revenue bonds -$ 40,000$ -$ 40,000$ Premium on revenue bonds - 8,089 (223) 7,866 Total bonds payable -$ 48,089$ (223)$ 47,866$
Water DivisionBonds payable:Revenue bonds 14,440$ 30,000$ (570)$ 43,870$ Premium on revenue bonds 869 2,608 (146) 3,331 Total bonds payable 15,309$ 32,608$ (716)$ 47,201$

NOTES TO FINANCIAL STATEMENTS DECEMBER 31, 2016 AND 2015 (Dollars in Thousands) (Continued)
N-44
11. Bonds (continued) Year ended December 31, 2015:Electric DivisionBonds payable:Revenue bonds 531,230$ -$ (110,200)$ 421,030$ Premium on revenue bonds 29,573 - (9,451) 20,122 Total bonds payable 560,803$ -$ (119,651)$ 441,152$
Water DivisionBonds payable:Revenue bonds 15,000$ -$ (560)$ 14,440$ Premium on revenue bonds 944 - (75) 869 Total bonds payable 15,944$ -$ (635)$ 15,309$
12. Rates and Energy Supplies Rates Electric, gas and water rates are established by MLGW and rate changes are subject to approval by the Council. The Council has approved mechanisms for pass-through of wholesale electric rate changes from TVA and natural gas price changes from suppliers without requiring additional specific approval. TVA implemented a rate adjustment effective with the October 2016 revenue month, increasing the cost of wholesale power (excluding fuel and purchased power) purchased by MLGW by approximately 2.48%. MLGW implemented changes to its retail rate schedules effective with meters read on or after September 30, 2016, to recover the increased cost of wholesale power from its retail customers. The retail effect across all customer classes was approximately 1.50%. An electric rate decrease was effective with meters read on or after January 4, 2016, and was applicable to Residential Schedules RS, RS-TOU and Small General Service Schedule GSA Part 1. This rate decrease was approved on December 1, 2015 by the City Council as part of the 2016 MLGW Budget. The retail effect is approximately a 2.91% annual decrease for these customers. TVA implemented a rate adjustment effective with the October 2015 revenue month, increasing the cost of wholesale power (excluding fuel and purchased power) purchased by MLGW by approximately 2.50%. MLGW implemented changes to its retail rate schedules effective with meters read on or after October 1, 2015, to recover the increased cost of wholesale power from its retail customers. The retail effect across all customer classes was approximately 1.50%.

NOTES TO FINANCIAL STATEMENTS DECEMBER 31, 2016 AND 2015 (Dollars in Thousands) (Continued)
N-45
12. Rates and Energy Supplies (continued) Rates (continued) MLGW retail electric rates are adjusted for TVA’s Fuel Cost Adjustor (“FCA”). The FCA is a variable wholesale energy rate that can fluctuate each month with TVA’s cost of fuel for electricity generation and purchased power costs. The FCA affects energy (per kilowatt-hour) charges for all retail customers. MLGW retail electric rates are also adjusted by a Power Cost Adjustment (“PCA”). The PCA is a component added to the monthly FCA and recovers the shortfall in power cost due to changes in load factor. The PCA is a quarterly fixed rate adjustment applied to energy charges for retail customers with demands less than 5,000 kilowatts. The PCA was approved on November 19, 2013 by the City Council as part of the 2014 MLGW Budget. MLGW implemented the PCA for meters read on or after January 2, 2014. MLGW gas rate schedules are developed using a projected price of natural gas and related gas storage and transportation charges. Retail natural gas rates are adjusted monthly for the Purchased Gas Adjustment ("PGA") rider. A PGA is applied to customer bills to reflect the difference between the actual cost of gas, storage and transportation in a given month and the projected levels built into the base rate schedule. A gas rate restructure was effective with meters read on or after January 4, 2016 and was applicable to all Service Schedules. This restructure was required due to customer migration among rate classes and was approved on December 1, 2015 by the City Council as part of the 2016 MLGW Budget. The retail impact across all customer classes is intended to be revenue neutral. A water rate increase was approved on December 1, 2015 by the City Council as part of the 2016 MLGW Budget. This rate increase was required due to increased general operating expenses, capital expenditures associated with system improvements and reductions in funds available to pay items. MLGW implemented new water rate schedules for meters read on or after January 4, 2016. The retail impact was a 22.0% increase for all customer classes. Energy Supplies TVA currently supplies all of MLGW’s electric power requirements pursuant to a power contract. On November 19, 2003, MLGW entered into a Supplement to the Power Contract with TVA under which MLGW made a prepayment of $1,500,000 to TVA for capacity and related energy. In exchange for the prepayment and a commitment by MLGW to purchase a minimum amount of electric power from TVA over the term of the Supplement (15 years), TVA will supply a specified amount of electricity and provide a fixed credit to its wholesale power rates otherwise in effect. To finance the prepayment, MLGW issued the Series 2003A and Series 2003B Bonds. Subsequently, MLGW has refinanced portions of the bonds originally issued for the prepayment. In 2008, the Series 2003B bonds were refunded by the Series 2008 bonds. In 2010, the callable portion of the 2003A Series bonds was refunded by the Series 2010 bonds. See also Note 1 (Prepaid Power Cost) and Note 11 (Bonds).

NOTES TO FINANCIAL STATEMENTS DECEMBER 31, 2016 AND 2015 (Dollars in Thousands) (Continued)
N-46
12. Rates and Energy Supplies (continued) Energy Supplies (continued) Under the terms of the TVA power contract, MLGW may terminate its supply arrangement with TVA upon five years’ prior written notice. TVA may terminate on not less than ten years’ prior written notice. MLGW purchases natural gas from multiple suppliers on multiple pipelines in order to minimize operational and performance risk. MLGW has short-term purchase commitments which are normally for one year or less. MLGW and the Tennessee Energy Acquisition Corporation (“TEAC”) entered into a 20 year gas purchase contract beginning January 1, 2007 with volume commitments for the term. TEAC is paid monthly after the gas is received by MLGW for its customers, and therefore presents no increased cash flow risk compared to normal physical gas purchases. 13. Federal Grant Contributions In December 2011, FEMA announced approval of the April 4, 2011 Storm Restoration project, contract Edison #E 34101-0000008735, under the Public Assistance Grant Award for costs incurred during the FEMA-1978-DR-TN program. In December 2014, all work on the last restoration project was completed; and MLGW increased the receivable by $44 in order to realize the entire amount contracted with FEMA in 2011 of $2,733. In 2015 however, MLGW decreased the receivable by $55 representing project under runs that are currently being processed and pending de-obligation by FEMA. There was no activity on this grant in 2016. The schedule below summarizes the grant activity:
Electric 2016 2015 2014 2013 2012 2011Electric Total Expenditures $ - (74)$ 59$ 209$ 87$ 3,289$ Eligible Reimbursement - (55) 44 157 65 2,467 Reimbursement Received - - - - 1,850 -Receivable Balance (828)$ (828)$ (883)$ (839)$ (682)$ (2,467)$
In September 2011, MLGW applied for a disaster assistance grant for the restoration work done after the April 26th storm. In March 2012, FEMA subsequently awarded grant contract Edison #E 34101-0000009498 for the April 26, 2011 Storm Restoration project under the Public Assistance Grant Award program for costs incurred during FEMA-1974-DR-TN. The award was originally for $1,959, all of which is being federally funded; $1,706 to the Electric Division, $236 to the Gas Division and $17 to the Water Division. FEMA granted MLGW an additional $19 due to a project overrun in the Gas Division., therefore, the Gas receivable was increased by $19, in anticipation of the additional fund obligation. In

NOTES TO FINANCIAL STATEMENTS DECEMBER 31, 2016 AND 2015 (Dollars in Thousands) (Continued)
N-47
13. Federal Grant Contributions (continued) May 2016, FEMA made a final payment to MLGW of $509, thereby closing out this disaster. The schedule below summarizes the grant activity:
Electric 2016 2015 2014 2013 2012 2011Electric Total Expenditures $ - $ - $ - - $ - $ - - 2,274$ Eligible Reimbursement - - - - - 1,706 Reimbursement Received 403 - - - 1,303 -Receivable Balance $ - (403)$ (403)$ (403)$ (403)$ (1,706)$
Gas 2016 2015 2014 2013 2012 2011Electric Total Expenditures $ - 25$ $ - $ - $ - - 315$ Eligible Reimbursement - 19 - - - 236 Reimbursement Received 100 - - - 155 -Receivable Balance $ - (100)$ (81)$ (81)$ (81)$ (236)$
Water 2016 2015 2014 2013 2012 2011Electric Total Expenditures $ - $ - $ - $ - $ - - 23$ Eligible Reimbursement - - - - - 17 Reimbursement Received 6 - - - 11 -Receivable Balance $ - (6)$ (6)$ (6)$ (6)$ (17)$
In June 2014, MLGW applied for a disaster assistance grant for the restoration work done after the March 2, 2014 storm. In April 2015, FEMA awarded grant contract Edison #E 41782-0000017870 for the March 2, 2014 Storm Restoration project under the Public Assistance Grant Award program for costs incurred during FEMA-4171-DR-TN. The award was $2,328, all of which is being federally funded to the Electric Division. Total cost of restoration work for this disaster as submitted to FEMA field officer in July, 2015 was $3,111, an increase of $7 from the $3,104 initial estimate. This increased the eligible reimbursements by $5 providing for the grant to total $2,333. In May 2016, FEMA made a final payment to MLGW of $238, thereby closing out this disaster. The schedule below summarizes the grant activity:
Electric 2016 2015 2014Total Expenditures $ - 7$ 3,104$ Eligible Reimbursement - 5 2,328 Reimbursement Received 238 2,095 -Receivable Balance $ - (238)$ (2,328)$
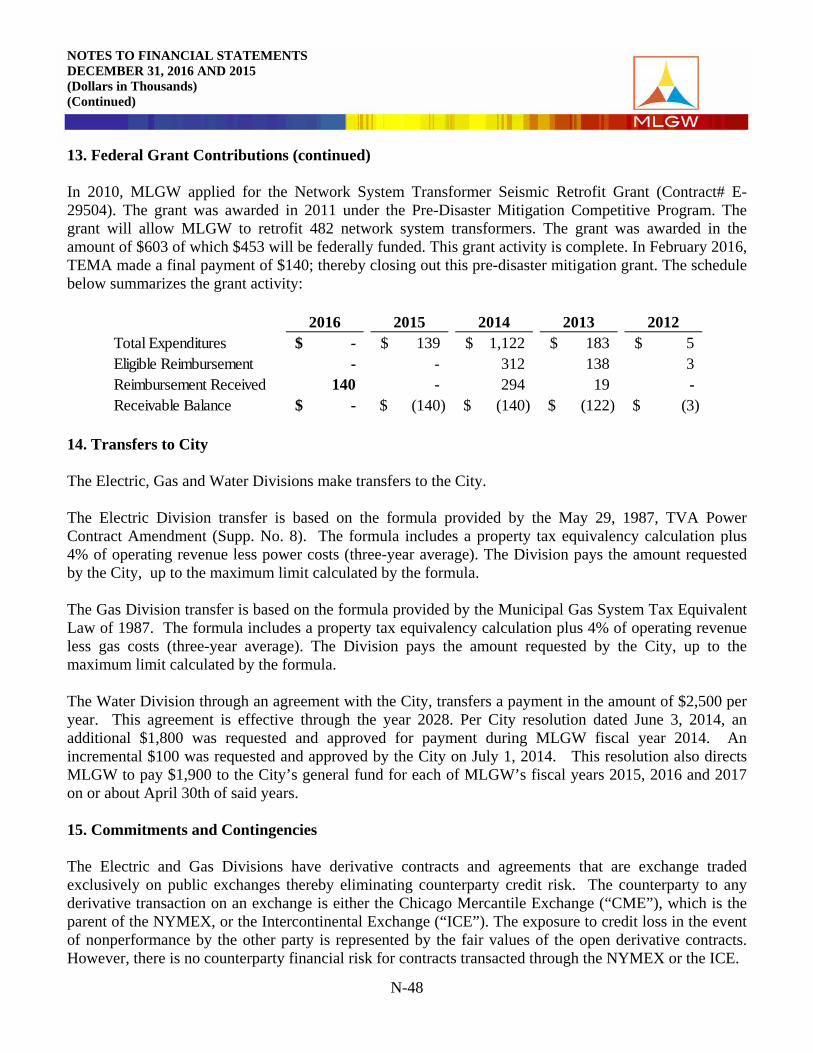
NOTES TO FINANCIAL STATEMENTS DECEMBER 31, 2016 AND 2015 (Dollars in Thousands) (Continued)
N-48
13. Federal Grant Contributions (continued)
In 2010, MLGW applied for the Network System Transformer Seismic Retrofit Grant (Contract# E-29504). The grant was awarded in 2011 under the Pre-Disaster Mitigation Competitive Program. The grant will allow MLGW to retrofit 482 network system transformers. The grant was awarded in the amount of $603 of which $453 will be federally funded. This grant activity is complete. In February 2016, TEMA made a final payment of $140; thereby closing out this pre-disaster mitigation grant. The schedule below summarizes the grant activity:
2016 2015 2014 2013 2012Total Expenditures $ - 139$ 1,122$ 183$ 5$ Eligible Reimbursement - - 312 138 3 Reimbursement Received 140 - 294 19 -Receivable Balance $ - (140)$ (140)$ (122)$ (3)$
14. Transfers to City The Electric, Gas and Water Divisions make transfers to the City. The Electric Division transfer is based on the formula provided by the May 29, 1987, TVA Power Contract Amendment (Supp. No. 8). The formula includes a property tax equivalency calculation plus 4% of operating revenue less power costs (three-year average). The Division pays the amount requested by the City, up to the maximum limit calculated by the formula. The Gas Division transfer is based on the formula provided by the Municipal Gas System Tax Equivalent Law of 1987. The formula includes a property tax equivalency calculation plus 4% of operating revenue less gas costs (three-year average). The Division pays the amount requested by the City, up to the maximum limit calculated by the formula. The Water Division through an agreement with the City, transfers a payment in the amount of $2,500 per year. This agreement is effective through the year 2028. Per City resolution dated June 3, 2014, an additional $1,800 was requested and approved for payment during MLGW fiscal year 2014. An incremental $100 was requested and approved by the City on July 1, 2014. This resolution also directs MLGW to pay $1,900 to the City’s general fund for each of MLGW’s fiscal years 2015, 2016 and 2017 on or about April 30th of said years. 15. Commitments and Contingencies The Electric and Gas Divisions have derivative contracts and agreements that are exchange traded exclusively on public exchanges thereby eliminating counterparty credit risk. The counterparty to any derivative transaction on an exchange is either the Chicago Mercantile Exchange (“CME”), which is the parent of the NYMEX, or the Intercontinental Exchange (“ICE”). The exposure to credit loss in the event of nonperformance by the other party is represented by the fair values of the open derivative contracts. However, there is no counterparty financial risk for contracts transacted through the NYMEX or the ICE.
NOTES TO FINANCIAL STATEMENTS DECEMBER 31, 2016 AND 2015 (Dollars in Thousands) (Continued)
N-49
15. Commitments and Contingencies (continued) MLGW pays a Transfer to the City and in lieu of taxes to Shelby County Government and the incorporated towns of Shelby County for the Electric and Gas Divisions based on the Tennessee Municipal Electric and Gas System Tax Equivalent Laws of 1987. MLGW pays a Transfer to the City for the Water Division based upon an agreement with the City, which calls for a payment of $2,500 for each of the fiscal years through 2028. An additional $1,900 incremental payment to the city has been approved for fiscal years through 2017; bringing the total water payment to the city to $4,400. MLGW is party to various legal proceedings incidental to its business. In the opinion of management, MLGW’s liability, if any, in all pending litigation or other proceedings, taken as a whole after consideration of amounts accrued, insurance coverage, or other indemnification arrangements, will not have a material adverse effect on its financial position or results of operations. See Note 12 for discussions of MLGW’s power contract with TVA and gas purchase commitments. 16. Subsequent Event On May 27, 2017, a severe straight line wind storm moved through the Memphis and Shelby County service territory, causing damage to MLGW’s electric distribution system. The total estimated cost for the storm is $16,100. During previous weather events of this magnitude, the President of the United States has subsequently issued a major disaster declaration for the State of Tennessee and granted public assistance to utilities. If a disaster declaration is declared, FEMA reimbursement is estimated to be 75% of the eligible costs.

REQUIRED SCHEDULE OF CHANGES IN NET PENSION LIABILITY DECEMBER 31, 2016 (Dollars in Thousands)
R-1
2015 2014 2013Total pension liabilityService cost 30,139$ 31,786$ 33,122$ Interest 99,940 100,436 98,818 Change of benefit terms - - - Differences between expected and actual experience 2,275 (16,338) (14,280) Changes in assumptions - (22,112) - Benefit payments, including refunds of employee contributions (100,528) (100,249) (91,931) Net change in total pension liability 31,825 (6,477) 25,730
Total pension liability – beginning 1,382,794 1,389,271 1,363,542 Total pension liability – ending (a) 1,414,620$ 1,382,794$ 1,389,271$
Plan fiduciary net positionContributions – employer 21,390$ 26,804$ 30,706$ Contributions – employee 12,310 11,729 12,000 Net investment income 15,231 98,931 185,707 Benefit payments including refunds of employee contributions (100,528) (100,249) (91,931) Administrative expense (759) (714) (657) Other - - - Net change in plan fiduciary net position (52,356)$ 36,501$ 135,825$ Other Adjustments 788 - -
Plan fiduciary net position – beginning 1,379,184 1,342,683 1,206,858 Plan fiduciary net position – ending (b) 1,327,616$ 1,379,184$ 1,342,683$
System’s net pension liability – ending (a) – (b) 87,004$ 3,610$ 46,588$
Plan fiduciary net position as a percentage of the total pension liability
93.85% 99.74% 96.65%
Covered employee payroll 160,641$ 152,368$ 154,759$ System’s net pension liability as a percentage of covered employee payroll
54.16% 2.37% 30.10%
Notes to schedule:Benefit changes : There have been no changes in benefit provisions since GASB 68 implementation.Change of assumptions : The assumptions were updated between December 31, 2013 and December 31, 2014 based on a five-year experience study for the period ending December 31, 2013.Historical data: This schedule will be expanded in future years to include up to ten years of historical data as the required information becomes available.

REQUIRED SCHEDULE OF EMPLOYER CONTRIBUTIONS - PENSION DECEMBER 31, 2016
R-2
Year Ended December 31
Actuarially Determined Contribution
(ADC)
Actual Contribution
in Relation to ADC
Contribution Deficiency (Excess)
Covered-Employee Payroll
Contributions as a Percentage of Covered-
Employee Payroll2007 17,217 17,230 (13) 146,830 11.73%2008 10,541 18,467 (7,926) 150,253 12.29%2009 22,401 21,388 1,013 154,057 13.88%2010 27,381 27,385 (4) 153,509 17.84%2011 26,208 26,213 (5) 154,036 17.02%2012 30,067 30,063 4 154,347 19.48%2013 30,705 30,706 (1) 154,759 19.84%2014 26,812 26,804 8 152,368 17.59%2015 21,390 21,390 - 160,641 13.32%2016 21,390 21,390 - 160,641 13.32%
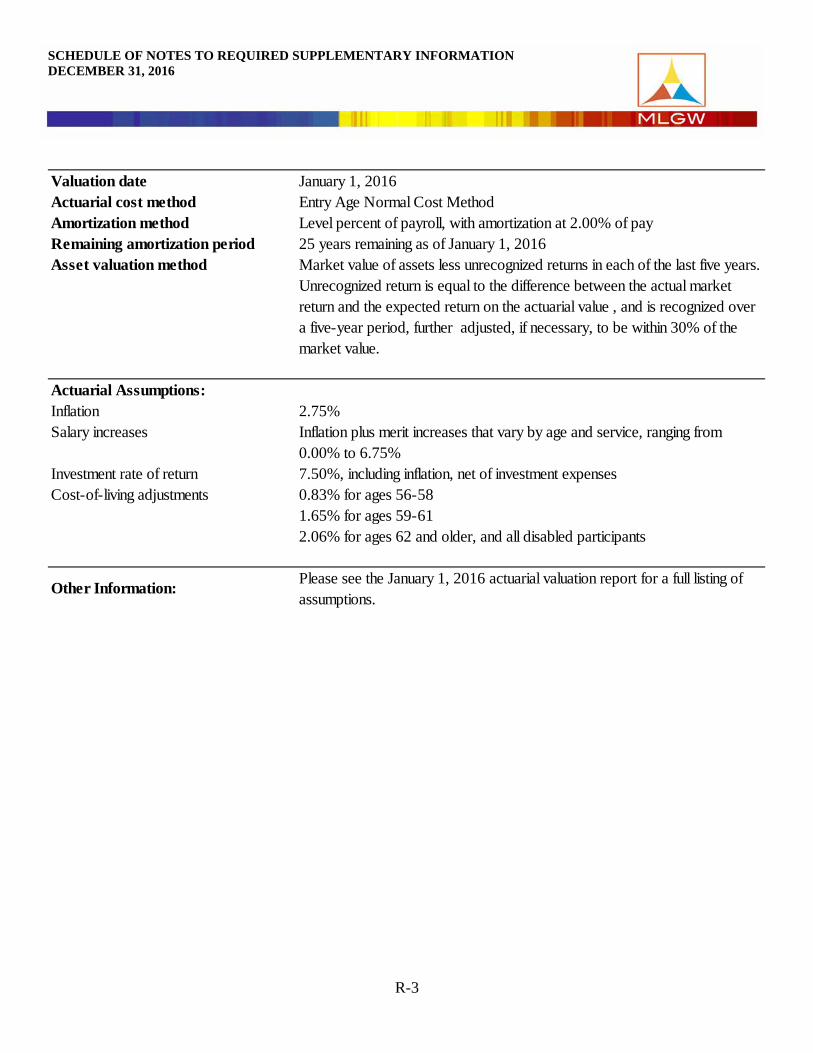
SCHEDULE OF NOTES TO REQUIRED SUPPLEMENTARY INFORMATION DECEMBER 31, 2016
R-3
Valuation date January 1, 2016Actuarial cost method Entry Age Normal Cost MethodAmortization method Level percent of payroll, with amortization at 2.00% of payRemaining amortization period 25 years remaining as of January 1, 2016Asset valuation method Market value of assets less unrecognized returns in each of the last five years.
Unrecognized return is equal to the difference between the actual market return and the expected return on the actuarial value , and is recognized over a five-year period, further adjusted, if necessary, to be within 30% of the market value.
Actuarial Assumptions:Inflation 2.75%Salary increases Inflation plus merit increases that vary by age and service, ranging from
0.00% to 6.75%Investment rate of return 7.50%, including inflation, net of investment expensesCost-of-living adjustments 0.83% for ages 56-58
1.65% for ages 59-612.06% for ages 62 and older, and all disabled participants
Other Information: Please see the January 1, 2016 actuarial valuation report for a full listing of assumptions.

REQUIRED SCHEDULE OF FUNDING PROGRESS FOR OPEB DECEMBER 31, 2016 (Dollars in Thousands)
R-4
Actuarial UAAL as a
Actuarial Accrued Unfunded Percentage of
Actuarial Value of Liability AAL Funded Covered Covered
Valuation Assets (AAL) (UAAL) Ratio Payroll Payroll
Date ( a ) ( b ) ( b - a ) ( a / b ) ( c ) ( ( b - a ) / c )
December 31, 2015 333,017$ 794,310$ 461,293$ 41.9% 160,641$ 287.2%
December 31, 2013 272,150 660,524 388,374 41.2% 154,759 251.0%
December 31, 2011 181,211 602,175 420,964 30.1% 154,036 273.3%

REQUIRED SCHEDULE OF EMPLOYER CONTRIBUTIONS - OPEB DECEMBER 31, 2016 (Dollars in Thousands)
R-5
Fiscal Percentage ofYear Annual Employer Annual OPEB Cost
Ended OPEB Cost Contributions Contributed
December 31, 2016 45,247$ 41,343$ 91.4%December 31, 2015 38,176 38,438 100.7%December 31, 2014 38,386 42,100 109.7%

SCHEDULE OF BONDS, PRINCIPAL AND INTEREST REQUIREMENTS DECEMBER 31, 2016 (Dollars in Thousands)
S-1
Principal Interest Principal Interest Principal Interest Principal Interest
ElectricDivision:
2017 $ 31,625 $ 4,564 $ 83,350 $ 6,821 $ 2,520 $ 2,992 $ 1,275 $ 1,773 2018 65,305 3,043 55,070 2,653 2,620 2,891 1,315 1,7352019 - - - - 2,725 2,786 1,370 1,6832020 - - - - 2,810 2,704 1,425 1,6282021 - - - - 2,920 2,592 1,480 1,5712022 - - - - 3,040 2,475 1,555 1,4972023 - - - - 3,160 2,354 1,630 1,4192024 - - - - 3,315 2,196 1,715 1,3382025 - - - - 3,485 2,030 1,800 1,2522026 - - - - 3,655 1,856 1,890 1,1622027 - - - - 3,840 1,673 1,985 1,0672028 - - - - 3,995 1,519 2,085 9682029 - - - - 4,155 1,359 2,185 8642030 - - - - 4,320 1,193 2,295 7552031 - - - - 4,535 977 2,410 6402032 - - - - 4,760 751 2,510 5432033 - - - - 5,000 513 2,610 4432034 - - - - 5,250 261 2,710 3392035 - - - - - - 2,820 2302036 - - - - - - 2,935 117
Total 96,930$ 7,607$ 138,420$ 9,474$ 66,105$ 33,122$ 40,000$ 21,024$
Series 2008 Series 2010 Series 2014 Series 2016

SCHEDULE OF BONDS, PRINCIPAL AND INTEREST REQUIREMENTS DECEMBER 31, 2016 (Dollars in Thousands)
S-2
Principal Interest
GasDivision:
2017 1,275$ 1,773$ 2018 1,315 1,7352019 1,370 1,6822020 1,425 1,6282021 1,480 1,5712022 1,555 1,4972023 1,630 1,4192024 1,715 1,3382025 1,800 1,2522026 1,890 1,1622027 1,985 1,0672028 2,085 9682029 2,185 8642030 2,295 7552031 2,410 6402032 2,510 5432033 2,610 4432034 2,710 3392035 2,820 2302036 2,935 117
Total 40,000$ 21,023$
Series 2016
Principal Interest Principal Interest
WaterDivision:
2017 580$ 492$ 1,120$ 924$ 2018 595 481 1,155 8902019 605 469 1,180 8672020 620 457 1,215 8322021 635 438 1,250 7952022 655 419 1,275 7702023 680 393 1,315 7322024 715 359 1,355 6932025 740 338 1,395 6522026 765 308 1,435 6102027 790 285 1,465 5812028 820 253 1,525 5232029 855 221 1,585 4622030 890 186 1,645 3982031 925 151 1,715 3332032 960 114 1,765 2812033 1,000 75 1,820 2282034 1,040 35 1,870 1742035 - - 1,930 1172036 - - 1,985 60
Total 13,870$ 5,474$ 30,000$ 10,921$
Series 2014 Series 2016

SCHEDULE OF CURRENT UTILITY RATES DECEMBER 31, 2016
S-3
Residential – Schedule RS
Time-Of-Use Residential Rate
General Service – Schedule GSA
Additional kWh per month: $0.03882 $0.03598 $0.03491
First 15,000 kWh per month: $0.08946 $0.08646 $0.08464
Excess over 50 kW of billing demand per $13.46 $12.55 $12.55
Energy Charge:
Demand Charge: Summer Winter TransitionFirst 50 kW of billing demand per month: $0.00000 $0.00000 $0.00000
$0.08044 $0.07744 $0.07562If (a) the higher of (i) the customer’s currently effective contract demand or
Customer Charge: $53.42 per delivery point per month
Customer Charge: $15.52 per delivery point per monthEnergy Charge: Summer Winter Transition
Effective meters read on or after September 30, 2016. 42,568
If (a) the higher of (i) the customer’s currently effective contract demand, if
Off-Peak kWh per month: $0.05537 $0.05537 $0.05537
The above rates are subject to adjustment under the provisions of the TVA
Energy Charge: Summer Winter TransitionOn-Peak kWh per month: $0.12061 $0.08163 $0.05537
The above rates are subject to adjustment under the provisions of the TVA
Effective October 1, 2016. 83
Customer Charge: $12.20 per month, less Hydro Allocation Credit: $1.60
First 500 kWh per month: $0.06804 $0.06498 $0.06318Additional kWh per month: $0.06945 $0.06479 $0.06201
Electric Division Rate Class Base Charge Customers
All Electric Rate Schedules Are Subject To Adjustment Under The Provisions of the TVA Fuel Cost and
Effective meters read on or after September 30, 2016. 353,447
Customer Charge: $12.20 per month, less Hydro Allocation Credit: $1.60Energy Charge: Summer Winter Transition

SCHEDULE OF CURRENT UTILITY RATES DECEMBER 31, 2016 (Continued)
S-4
General Service – Schedule GSA(cont.)
Manufacturing Power Rate - Part A
(Schedule MSA)
1
$1.57
$0.03853Off-peak per kWh energy charge:
$10.15
$198.95 Non-Summer
Excess over 1,000 kW of billing demand permonth:
TransitionDemand Charge: SummerCustomer Charge:
$0.04005All kWh per month: $0.04396 $0.04112
$12.31
$11.56
If the higher of the customer’s currently effective contract demand or itshighest billing demand during the latest 12 month period is greater than1,000 kW:
Excess of billing demand over the higher of2,500 kW or the customer’s contract demandper month:
$12.31 $11.40
Energy Charge:
$11.40
$11.40
$0.05437
0
First 1,000 kW of billing demand per month: $12.47 $11.56
Effective October 1, 2016.
$12.80 On-peak per kW of billing demand charges per month:Customer Charge:
Per kW charge per month for each kW, if any, by which offpeakbilling demand exceeds onpeak billing demand:
Time-of-Day General Power Rate - Part A (Schedule TGSA)
On-peak per kWh energy charge: $0.04737$0.03977
$12.19
$1.66 $1.66
Per kW charge per month for each kW, if any, of the amount bywhich (1) the customer’s onpeak billing demand exceeds thehigher of 2,500 kW or its onpeak contract demand or (2) thecustomer’s offpeak billing demand exceeds the higher of 2,500kW or its offpeak contract demand, whichever is higher
$12.80
Summer
$12.19
$198.95
$10.15
Transition
Customer Charge: $198.95 per delivery point per month
Effective October 1, 2016.
Per kW coincident billing demand charge permonth:
$11.07
Summer Winter
Per kW maximum billing demand charge permonth:
$1.57 $1.57
$191.84 per delivery point per month
$11.40
Winter
Electric Division Rate Class Base Charge Customers

SCHEDULE OF CURRENT UTILITY RATES DECEMBER 31, 2016 (Continued)
S-5
Manufacturing Power Rate - Part A(Schedule MSA) (cont.)
Excess Demand:
Rates applicable for delivery at:Summer SGSB SGSC SGSD SGSB SGSC SGSDBilling demand per kW: $19.81 $19.28 $19.03 $20.36 $19.83 $16.58Excess demand per kW: $19.81 $19.28 $19.03 $20.36 $19.83 $16.58Energy charge per kWh: $0.03057 $0.02999 $0.02678 $0.03145 $0.03085 $0.02757WinterBilling demand per kW: $16.75 $16.22 $15.97 $17.21 $16.68 $16.43Excess demand per kW: $16.75 $16.22 $15.97 $17.21 $16.68 $16.43Energy charge per kWh: $0.02617 $0.02550 $0.02287 $0.02692 $0.02623 $0.02355TransitionBilling demand per kW: $13.70 $13.17 $12.92 $14.07 $13.54 $13.29Excess demand per kW: $13.70 $13.17 $12.92 $14.07 $13.54 $13.29Energy charge per kWh: $0.02518 $0.02454 $0.02200 $0.02590 $0.02524 $0.02265
Excess Demand:
$1,500.00 per delivery point per month
$350.00 per delivery point per month
4
$11.72
Customers
Summer Winter TransitionExcess per kW charge per month by whichbilling demand exceeds contract demand:
$0.06116 $0.05067
$12.64 $11.72
On-peak per kWh energy charge:
Electric Division Rate Class (cont.) Base Charge
$0.04110
Off-peak per kWh energy charge:
$0.03850 $0.04037
$0.04110
TVA Administrative Charge:
General Service - (Schedule SGS)
Manufacturing Service - (Schedule SMS)
Service Charge:
Service Charge:
Transmission Voltage: 115 kV and up Distribution Voltage: < 115 kV
Seasonal Demand And Energy
Seasonal Demand And Energy
Demand amount that exceeds the effective contract demand.
Effective October 1, 2016.
Demand amount that exceeds the effective contract demand.
Effective October 1, 2016.
TVA Administrative Charge:
2
$1,500.00 per delivery point per month
$350.00 per delivery point per month

SCHEDULE OF CURRENT UTILITY RATES DECEMBER 31, 2016 (Continued)
S-6
Rates applicable for delivery at:Summer SMSB SMSC SMSD SMSB SMSC SMSDBilling demand per kW: $16.59 $16.06 $18.91 $17.05 $16.52 $19.46Excess demand per kW: $16.59 $16.06 $18.91 $17.05 $16.52 $19.46Energy charge per kWh: $0.02145 $0.02061 $0.01236 $0.02207 $0.02120 $0.01272WinterBilling demand per kW: $13.54 $13.01 $15.85 $13.91 $13.38 $16.31Excess demand per kW: $13.54 $13.01 $15.85 $13.91 $13.38 $16.31Energy charge per kWh: $0.01648 $0.01595 $0.00863 $0.01695 $0.01640 $0.00888TransitionBilling demand per kW: $10.48 $9.95 $12.80 $10.75 $10.22 $13.17Excess demand per kW: $10.48 $9.95 $12.80 $10.75 $10.22 $13.17Energy charge per kWh: $0.01532 $0.01483 $0.00772 $0.01575 $0.01525 $0.00794
Time Of Use General Service(Schedule TGS)
Service Charge:
TVA Administrative Charge:
Excess Demand:
Off-Peak Block 1:
Off-Peak Block 2:
Off-Peak Block 3:
Distribution Voltage: < 115 kV
7
Demand amount that exceeds the effective contract demand.
Next 200 hours use of on-peak metered demand multiplied by the ratio of metered off-peak energy to metered total energy.
Last 400 hours use of on-peak metered demand multiplied by the ratio of metered off-peak energy to metered total energy.
Transmission Voltage: 115 kV and up
Effective October 1, 2016.
$1,500.00 per delivery point per month
$350.00 per delivery point per month
First 200 hours use of on-peak metered demand multiplied by the ratio of metered off-peak energy to metered total energy.
Electric Division Rate Class (cont.) Base Charge Customers
Seasonal Demand And EnergyManufacturing Service - (Schedule SMS)

SCHEDULE OF CURRENT UTILITY RATES DECEMBER 31, 2016 (Continued)
S-7
Rates applicable for delivery at:Summer TDGSA TGSB TGSC TGSD TDGSA TGSB TGSC TGSDOn-peak billing demand per kW: $10.11 $10.06 $10.06 $10.06 $10.41 $10.36 $10.36 $10.36Maximum billing demand per kW: $5.33 $5.33 $4.80 $4.55 $5.45 $5.45 $4.92 $4.67Excess demand per kW: $10.11 $10.06 $10.06 $10.06 $10.41 $10.36 $10.36 $10.36On-peak energy per kWh: $0.07556 $0.07244 $0.07244 $0.07152 $0.07779 $0.07458 $0.07458 $0.07366Off-peak block 1 per kWh: $0.04462 $0.04935 $0.04935 $0.04843 $0.04592 $0.05079 $0.05079 $0.04987Off-peak block 2 per kWh: $0.00538 $0.00643 $0.00643 $0.00445 $0.00550 $0.00658 $0.00658 $0.00457Off-peak block 3 per kWh: $0.00258 $0.00327 $0.00327 $0.00235 $0.00262 $0.00333 $0.00333 $0.00241WinterOn-peak billing demand per kW: $9.22 $9.17 $9.17 $9.17 $9.50 $9.45 $9.45 $9.45Maximum billing demand per kW: $5.33 $5.33 $4.80 $4.55 $5.45 $5.45 $4.92 $4.67Excess demand per kW: $9.22 $9.17 $9.17 $9.17 $9.50 $9.45 $9.45 $9.45On-peak energy per kWh: $0.03614 $0.06190 $0.06190 $0.06098 $0.06323 $0.06372 $0.06372 $0.06280Off-peak block 1 per kWh: $0.04736 $0.05140 $0.05140 $0.05048 $0.04874 $0.05290 $0.05290 $0.05198Off-peak block 2 per kWh: $0.00538 $0.00643 $0.00643 $0.00445 $0.00550 $0.00658 $0.00658 $0.00457Off-peak block 3 per kWh: $0.00258 $0.00327 $0.00327 $0.00235 $0.00262 $0.00333 $0.00333 $0.00241Transition:On-peak billing demand per kW: $9.22 $9.17 $9.17 $9.17 $9.50 $9.45 $9.45 $9.45Maximum billing demand per kW: $5.33 $5.33 $4.80 $4.55 $5.45 $5.45 $4.92 $4.67Excess demand per kW: $9.22 $9.17 $9.17 $9.17 $9.50 $9.45 $9.45 $9.45On-peak energy per kWh: $0.04846 $0.04906 $0.04906 $0.04814 $0.04988 $0.05049 $0.05049 $0.04957Off-peak block 1 per kWh: $0.04846 $0.04906 $0.04906 $0.04814 $0.04988 $0.05049 $0.05049 $0.04957Off-peak block 2 per kWh: $0.00538 $0.00643 $0.00643 $0.00445 $0.00550 $0.00658 $0.00658 $0.00457Off-peak block 3 per kWh: $0.00258 $0.00327 $0.00327 $0.00235 $0.00262 $0.00333 $0.00333 $0.00241
Time Of Use Manufacturing Service(Schedule TMS)
Service Charge:
TVA Administrative Charge:
Excess Demand:
Off-Peak Block 1:
Off-Peak Block 2:
Off-Peak Block 3:
Transmission Voltage: 115 kV and up Distribution Voltage: < 115 kV
(Schedule TGS) (cont.)
Electric Division Rate Class (cont.) Base Charge Customers
Time Of Use General Service
Effective October 1, 2016. 20
$1,500.00 per delivery point per month
$350.00 per delivery point per month
Demand amount that exceeds the effective contract demand.
First 200 hours use of on-peak metered demand multiplied by the ratio of metered off-peak energy to metered total energy.
Next 200 hours use of on-peak metered demand multiplied by the ratio of metered off-peak energy to metered total energy.
Last 400 hours use of on-peak metered demand multiplied by the ratio of metered off-peak energy to metered total energy.

SCHEDULE OF CURRENT UTILITY RATES DECEMBER 31, 2016 (Continued)
S-8
Time Of Use Manufacturing Service(Schedule TMS) (cont.)
Rates applicable for delivery at:Summer TDMSA TMSB TMSC TMSD TDMSA TMSB TMSC TMSDOn-peak billing demand per kW: $9.46 $9.46 $9.46 $9.46 $9.74 $9.74 $9.74 $9.74Maximum billing demand per kW: $3.68 $2.47 $1.94 $1.68 $0.38 $2.50 $1.97 $1.71Excess demand per kW: $9.46 $9.46 $9.46 $9.46 $9.74 $9.74 $9.74 $9.74On-peak energy per kWh: $0.05212 $0.05422 $0.05318 $0.05047 $0.05366 $0.05582 $0.05475 $0.05198Off-peak block 1 per kWh: $0.02903 $0.03113 $0.03008 $0.02737 $0.02987 $0.03204 $0.03096 $0.02818Off-peak block 2 per kWh: $0.00369 $0.00369 $0.00500 $0.00283 $0.00377 $0.00377 $0.00512 $0.00291Off-peak block 3 per kWh: $0.00134 $0.00134 $0.00500 $0.00229 $0.00135 $0.00135 $0.00512 $0.00235WinterOn-peak billing demand per kW: $8.57 $8.57 $8.57 $8.57 $8.83 $8.83 $8.83 $8.83Maximum billing demand per kW: $3.68 $2.47 $1.94 $1.68 $3.75 $2.50 $1.97 $1.71Excess demand per kW: $8.57 $8.57 $8.57 $8.57 $8.83 $8.83 $8.83 $8.83On-peak energy per kWh: $0.41580 $0.04368 $0.04264 $0.03993 $0.04280 $0.04496 $0.04389 $0.04112Off-peak block 1 per kWh: $0.03109 $0.03319 $0.03214 $0.02943 $0.03200 $0.03416 $0.03308 $0.03030Off-peak block 2 per kWh: $0.00369 $0.00369 $0.00500 $0.00283 $0.00377 $0.00377 $0.00512 $0.00291Off-peak block 3 per kWh: $0.00134 $0.00134 $0.00500 $0.00229 $0.00135 $0.00135 $0.00512 $0.00235Transition:On-peak billing demand per kW: $8.57 $8.57 $8.57 $8.57 $8.83 $8.83 $8.83 $8.83Maximum billing demand per kW: $3.68 $2.47 $1.94 $1.68 $3.75 $2.50 $1.97 $1.71Excess demand per kW: $8.57 $8.57 $8.57 $8.57 $8.83 $8.83 $8.83 $8.83On-peak energy per kWh: $0.03190 $0.03399 $0.03295 $0.03024 $0.03283 $0.03498 $0.03391 $0.03114Off-peak block 1 per kWh: $0.03190 $0.03399 $0.03295 $0.03024 $0.03283 $0.03498 $0.03391 $0.03114Off-peak block 2 per kWh: $0.00369 $0.00369 $0.00500 $0.00283 $0.00377 $0.00377 $0.00512 $0.00291Off-peak block 3 per kWh: $0.00134 $0.00134 $0.00500 $0.00229 $0.00135 $0.00135 $0.00512 $0.00235
Drainage Pumping Station Rate Effective September 30, 2016.(Schedule DPS)
Outdoor Lighting Rate (Schedule LS)
Customer Charge:
Transition
Part A – Charges for street and park lighting systems, traffic signal systems,and athletic field lighting installations.
Effective September 30, 2016. 16,488
Summer Winter$0.03664 $0.03364
All kWh per month:
$15.52 per delivery point per month
$0.03182Energy Charge:
Energy Charge: Summer Winter$0.04717 $0.04413
Transition
7
$0.04232All kWh per month:
Electric Division Rate Class (cont.) Base Charge Customers
Transmission Voltage: 115 kV and up Distribution Voltage: < 115 kV

SCHEDULE OF CURRENT UTILITY RATES DECEMBER 31, 2016 (Continued)
S-9
Outdoor Lighting Rate (Schedule LS)(cont.)
Traffic signal systems and athletic field lighting installations shall be provided,owned, and maintained by and at the expense of the customer, except asDivision may agree otherwise in accordance with the provisions of theparagraph next following in this section. The facilities necessary to provideservice to such systems and installations shall be provided by and at theexpense of Division’s electric system, and the annual facility chargeprovided for first above in this section shall apply to the installed cost ofsuch facilities.
The annual facility charge shall be 10.41% of the installed cost to theDivision’s electric system of the facility devoted to street and park lightingservice specified in this Part A. Such installed cost shall be recomputed onJuly 1 of each year, or more often if substantial changes in the facilities aremade. Each month, one-twelfth of the then total annual facility charge shallbe billed to the customer. If any part of the facilities has not been providedat the electric system’s expense or if the installed cost of any portion thereofis reflected on the books of another municipality or agency or department,the annual facility charge shall be adjusted to reflect properly the remainingcost to be borne by the electric system.
Part B – Charges for outdoor lighting for individual customers – charges perfixture per month:
When so authorized by policy duly adopted by Division’s governing board,traffic signal systems and athletic field lighting installations may be provided,owned and maintained by Division’s electric system for the customer’sbenefit. In such cases Division may require reimbursement from thecustomer for a portion of the initial installed cost of any such system orinstallation and shall require payment by the customer of facility chargessufficient to cover all of Division’s costs (except reimbursed costs), including appropriate overheads, of providing, owning, and maintaining such systemor installation; provided that, for athletic field lighting installations, suchfacility charge shall in no case be less than 12% per year of such costs.Said facility charge shall be in addition to the annual facility charge on thefacilities necessary to provide service to such system or installation asprovided for in the preceding paragraphs.
Outdoor Lighting Facilities Charge:
Electric Division Rate Class (cont.) Base Charge Customers

SCHEDULE OF CURRENT UTILITY RATES DECEMBER 31, 2016 (Continued)
S-10
Outdoor Lighting Rate (Schedule LS)(cont.)
Charge$2.95 3.494.425.967.59
$2.95 3.494.427.59
$4.19 4.484.615.015.306.29
10.05
LED $5.18 5.395.82
Lamp Size Rated(Watts) (Lumens) (kWh)
Winter TransitionFor each lamp size under (a) above per rated kWh per month:
Summer
1,000 47,500 378
1,000 88,000
100 8,550
385
250 23,000
All rated kWh per month: $0.04717
1,000 126,000
42 150 14,400 63
200 13,400 45
(b) Energy Charge:
(a) Type of fixture
Mercury Vapor or Incandescent 175 7,650 70 250 10,400 98
400 22,600
Metal Halide 175 8,300 70
155
700 33,600 266
250 14,000 98
378
400 19,100 155
$0.04232
105 400 45,000 165
200 18,900 82
High Pressure Sodium
Electric Division Rate Class (cont.) Base Charge Customers
100 7,000 24 150 9,300 31
50 3,285 22
$0.04413

SCHEDULE OF CURRENT UTILITY RATES DECEMBER 31, 2016 (Continued)
S-11
431
This rate schedule is available for gas service to all customers contracting for not less than 100 Ccf of maximum daily demand.
279,115Effective meters read on or after January 4, 2016Residential G-1 & G-3
$10.00 per meter per month
Excess over 100 ccf per month @ $0.496 per ccf, plus the above rates aresubject to adjustment under the provisions of the Purchased GasAdjustment Rider.
Service charge:
Service charge:
First 100 ccf per month @ $0.586 per ccf Commodity charge:
20,800
Minimum bill:
The minimum monthly bill shall be $0.654 for each Ccf of the higher of:
Effective meters read on or after January 4, 2016Small General Service G-7
For 0 to 250 cf meter, $30.00
The above rates are subject to adjustment under the provisions of thePurchased Gas Adjustment Rider.
Commodity charge:
This rate schedule is available for gas service to all gas customers exceptresidential.
(2) The daily contract demand, but in no case less than the Service chargelisted above.
(1) The maximum daily demand during the preceding eleven months, or
Effective meters on or after January 4, 2016Large General Service Firm on-peak G-8 and G-9
All gas consumed: $0.531 per Ccf per month, plus
Over 250 to 1,000 cf meter, $55.00Over 1,000 cf meter, $100.00 per month plus,
$0.251 Ccf per month of contract demand or maximum daily demandduring the twelve (12) months ending with the billing month, whichever ishigher, plus
Demand charge:
Minimum bill:
CustomersBase ChargeGas Division Rate Class
Schedule G-1 is available for domestic use to residential customers inindividual private residences or other individual dwelling units situated withinthe corporate limits of the City of Memphis, Tennessee. Schedule G-3 isavailable for domestic use to residential customers in individual privateresidences or other individual dwelling units situated outside the corporatelimits of the City of Memphis, Tennessee.
$ 10.00 per month, plus

SCHEDULE OF CURRENT UTILITY RATES DECEMBER 31, 2016 (Continued)
S-12
(cont.)
First 200,000 Ccf per month @ $0.488 per ccf
18
Minimum bill:
The above rates are subject to adjustment under the provisions of thePurchased Gas Adjustment Rider.
This rate schedule is available for gas service to all customers contracting for not less than 1,500 Ccf of maximum daily demand and providing oil or other alternate fuel facilities approved by the Division as being adequate in designand capacity.
Service charge:
Excess over 200,000 Ccf per month @ $0.389 per Ccf, plus
The minimum bill shall be $0.904 for Ccf of the higher of: (1) the maximumDaily Demand during the twelve (12) months ending with the billing month,or (2) the Daily Contract Demand.
$500.00 per month, plus
Commodity Charge:
The minimum monthly bill shall be $0.350 for each Ccf of the higher of (1)the maximum daily demand during the twelve months ending with the billingmonth, or (2) the daily contract demand, but in no event less than $500.00.
First 200,000 Ccf per month @ $0.458 per Ccf
Excess over 200,000 Ccf per month @ $0.394 per ccf, plus
Effective January 4, 2016
The above rates are subject to adjustment under the provisions of thePurchased Gas Adjustment Rider.
Commodity Charge:
Minimum bill:
Large General Service Interruptible Off-peak G-10 and G-12
Gas Division Rate Class Base Charge Customers
Large General Service Firm on-peak G-8 and G-9

SCHEDULE OF CURRENT UTILITY RATES DECEMBER 31, 2016 (Continued)
S-13
$7.76 11.2019.8744.7179.48
$10.81 15.5427.6662.20
110.57
All water consumed: $2.858 per Ccf per monthCommodity charge:
Customers
177,989
2" meter
1" meter1-1/2" meter
The minimum monthly bill shall be determined by the size of the meterinstalled, as follows:
3/4" meter
Minimum bill:
5/8" meter
All water consumed: $1.836 per Ccf per month
For water furnished to premises entirely within the corporate limits of theCity of Memphis
Effective meters read on or after January 4, 2016
Excess over 6,000 Ccf
18,181Effective meters read on or after January 4, 2016
$0.981 per CcfNext 400 Ccf
Water consumed per month:
$1.514 per Ccf
First 30 Ccf
Residential – Outside City Rate
5/8" meter
The minimum monthly bill shall be determined by the size of the meterinstalled, as follows:
Minimum bill:
Commodity charge:
1" meter1-1/2" meter
Effective meters read on or after January 4, 2016
Next 70 CcfNext 100 Ccf
$2.341 per Ccf
Commodity charge:
Next 5,400 Ccf$1.261 per Ccf
General Service – Inside City Rate
For water service to all customers within the corporate limits of the City ofMemphis, except residential customers
$1.022 per Ccf
Water Division Rate Class Base Charge
Residential – Inside City Rate
3/4" meter
For water furnished to premises outside the corporate limits of the City ofMemphis
2" meter
$1.990 per Ccf
22,339

SCHEDULE OF CURRENT UTILITY RATES DECEMBER 31, 2016 (Continued)
S-14
(cont.)
$14.87 17.3429.7259.46
123.93247.78370.53468.74566.96
1,174.451,638.732,253.28
247.78370.53
$22.73 26.5245.4790.00
189.42378.87566.19716.27866.35
1,794.662,504.143,440.84
378.87566.19
5/8" meter3/4" meter1" meter
The minimum monthly bill shall be determined by the size of the meterinstalled, as follows:
3/4" meter
$2.257 per Ccf$1.892 per Ccf
First 30 Ccf
$1.485 per Ccf
The minimum monthly bill shall be determined by the size of the meterinstalled, as follows:
1-1/2" meter
Battery of 2-2" meters
10" meter12" meter14" meter
4" meter
2" meter3" meter
Commodity charge: Water consumed per month:
For water service to all customers outside the corporate limits of the City ofMemphis, except residential customers
Effective meters read on or after January 4, 2016
Battery of 2-2" metersBattery of 3-2" meters
General Service – Outside City Rate
Minimum bill:
Battery of 3-2" meters
12" meter
8" meter6" meter
793
14" meter
Next 100 CcfNext 400 Ccf
3" meter4" meter6" meter8" meter10" meter
$3.517 per Ccf$2.957 per CcfNext 70 Ccf
5/8" meter
1" meter1-1/2" meter2" meter
$1.541 per CcfNext 5,400 CcfExcess over 6,000 Ccf
Water Division Rate Class (cont.) Base Charge Customers
General Service – Inside City Rate
Minimum bill:

SCHEDULE OF CURRENT UTILITY RATES DECEMBER 31, 2016 (Continued)
S-15
$10.81 $15.54 $27.66 $62.20
$110.57
Customers
All water consumed $2.858 per Ccf per month
Residential – Shelby County Water Distribution System
For water service within the area served by the Shelby County WaterDistribution System at the time of its acquisition on June 30, 1999, fordomestic uses to residential customers in individual private residences orother individual dwelling places.
For water service within the area served by the Shelby County WaterDistribution System at the time of its acquisition on June 30, 1999, for allcustomers except residential customers using service exclusive for domesticuse.
Effective meters read on or after January 4, 2016
Next 400 CcfNext 5,400 Ccf
$3.517 per Ccf
$1.541 per Ccf
Monthly rate:
Minimum bill:
1" meter3/4" meter
The minimum monthly bill shall be determined by the size of the meterinstalled, as follows:
609Commercial - Industrial – Shelby County Water Distribution System
Water consumed per month:Monthly rate:First 30 CcfNext 70 CcfNext 100 Ccf $2.257 per Ccf
Excess over 6000 Ccf
$1.892 per Ccf$1.485 per Ccf
Residential customers shall be served through a single meter not larger than2" in size.
5/8" meter
2" meter1-1/2" meter
Water Division Rate Class (cont.) Base Charge
Effective meters read on or after January 4, 2016
$2.957 per Ccf
17,652

SCHEDULE OF CURRENT UTILITY RATES DECEMBER 31, 2016 (Continued)
S-16
$22.73
26.5245.4790.90
189.42378.87566.19716.27866.35
1,794.662,504.143,440.84
5/8" meter
3/4" meter
Commercial - Industrial – Shelby County Water Distribution System
10" meter
Minimum bill:
12" meter14" meter
2" meter3" meter4" meter6" meter
Water Division Rate Class (cont.) Base Charge Customers
8" meter
1" meter1-1/2" meter
The minimum monthly bill shall be determined by the size of the meterinstalled, as follows:
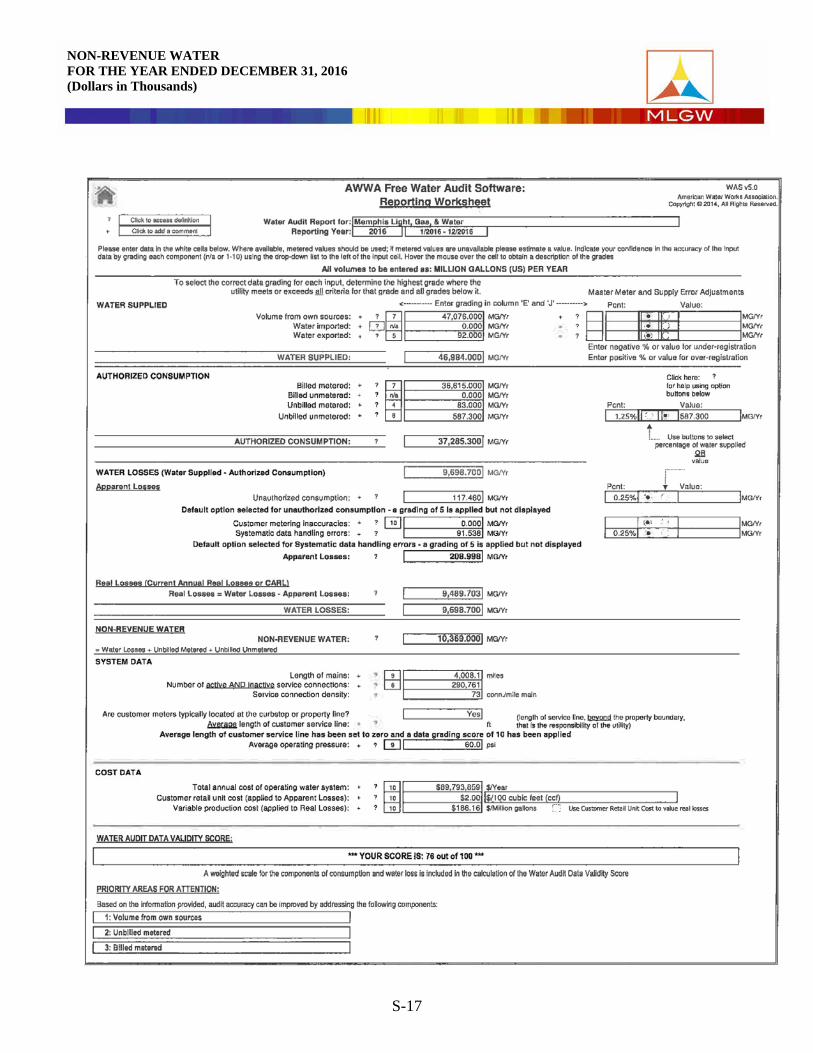
NON-REVENUE WATER FOR THE YEAR ENDED DECEMBER 31, 2016 (Dollars in Thousands)
S-17

NON-REVENUE WATER DECEMBER 31, 2016 (Dollars in Thousands)
S-18

SCHEDULE OF INSURANCE FOR THE YEAR ENDED DECEMBER 31, 2016 (Dollars in Thousands)
S-19
Amount ofCoverage
Property 600,000$
Crime 2,500
Excess Insurance for Workers Compensation 2,000 and Employers Liability
Out of State Automobile Travel 1,000
Travel Accident 1,000
Commercial Automobile 1,000
Leased Rental Equipement 300 per item1,000 coverage limit
Type of Coverage

SCHEDULE OF ADDITIONS AND RETIREMENTS TO UTILITY PLANT DECEMBER 31, 2016 (Dollars in Thousands)
S-20
Electric Gas WaterDivision Division Division
Utility plant in service, December 31, 2015 1,646,915$ 597,729$ 448,323$ Additions- Construction 83,211 33,013 23,032 Additions- Acquisition Adjustment - - 964 Retirements (17,527) (7,643) (3,104) Utility plant in service, December 31, 2016 1,712,599$ 623,099$ 469,215$
Note: Utility plant in service balances exclude amounts for construction work in process; non-utility land and plant equipment; and plant held for future use.

5100 Poplar Ave., 30th Floor ■ Memphis, TN 38137 Main: 901.685.5575 ■ Fax: 901.685.5583 ■ www.mhmcpa.com
Member of Kreston International — a global network of independent accounting firms
Report on Internal Control Over Financial Reporting and on Compliance and OtherMatters Based on Audits of Financial Statements Performed in Accordance with
Government Auditing Standards
Independent Auditor's Report
To the Board of Commissioners and ManagementMemphis Light, Gas and Water DivisionMemphis, Tennessee
We have audited, in accordance with the auditing standards generally accepted in the United Statesof America and the standards applicable to financial audits contained in Government AuditingStandards issued by the Comptroller General of the United States, the financial statements of theElectric, Gas and Water Divisions (the "Divisions") of Memphis Light, Gas and Water Division,enterprise funds of the City of Memphis, Tennessee, as of and for the year ended December 31,2016, and the related notes to the financial statements, which collectively comprise the Divisions'basic financial statements, and have issued our report thereon dated June 7, 2017.
Internal Control Over Financial Reporting
In planning and performing our audits of the financial statements, we considered the Divisions'internal control over financial reporting (internal control) to determine the audit procedures that areappropriate in the circumstances for the purpose of expressing our opinions on the financialstatements, but not for the purpose of expressing an opinion on the effectiveness of the Divisions'internal control. Accordingly, we do not express an opinion on the effectiveness of the Divisions'internal control.
A deficiency in internal control exists when the design or operation of a control does not allowmanagement or employees, in the normal course of performing their assigned functions, to prevent,or detect and correct, misstatements on a timely basis. A material weakness is a deficiency, orcombination of deficiencies, in internal control, such that there is a reasonable possibility that amaterial misstatement of the Divisions' financial statements will not be prevented, or detected andcorrected on a timely basis. A significant deficiency is a deficiency, or a combination of deficiencies,in internal control that is less severe than a material weakness, yet important enough to meritattention by those charged with governance.
Our consideration of internal control was for the limited purpose described in the first paragraph ofthis section and was not designed to identify all deficiencies in internal control that might be materialweaknesses or significant deficiencies. Given these limitations, during our audit we did not identifyany deficiencies in internal control that we consider to be material weaknesses. However, materialweaknesses may exist that have not been identified. There were no prior findings reported.
Z-1

Compliance and Other Matters
As part of obtaining reasonable assurance about whether the Divisions' financial statements are freefrom material misstatement, we performed tests of the Divisions' compliance with certain provisionsof laws, regulations, contracts, and grant agreements, noncompliance with which could have a directand material effect on the determination of financial statement amounts. However, providing anopinion on compliance with those provisions was not an objective of our audit, and accordingly, wedo not express such an opinion. The results of our tests disclosed no instances of noncomplianceor other matters that are required to be reported under Government Auditing Standards. There wereno prior findings reported.
Purpose of this Report
The purpose of this report is solely to describe the scope of our testing of internal control andcompliance and the results of that testing, and not to provide an opinion on the effectiveness of theDivisions' internal control or on compliance. This report is an integral part of an audit performed inaccordance with Government Auditing Standards in considering the Divisions' internal control andcompliance. Accordingly, this communication is not suitable for any other purpose.
Memphis, TennesseeJune 7, 2017
Z-2


mlgw .org


