33
MME 2010 M ETALLURGICAL THERMODYNAMİCS II Reacting Systems with Variable Composition

MME 2010
METALLURGICAL
THERMODYNAMİCS II
Reacting Systems with Variable Composition
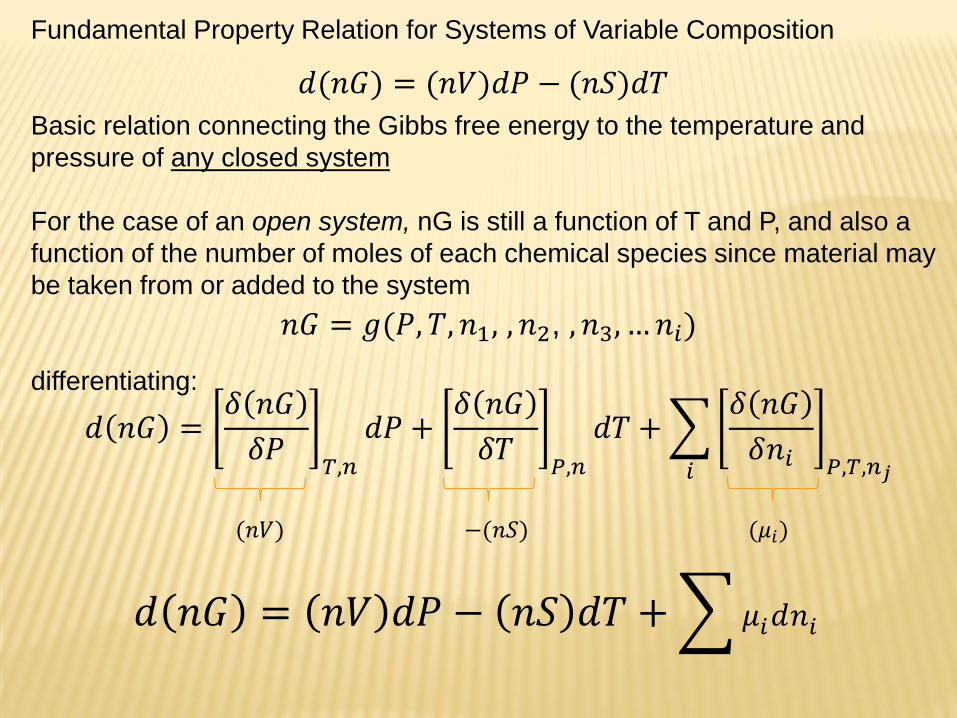
Fundamental Property Relation for Systems of Variable Composition
Basic relation connecting the Gibbs free energy to the temperature and
pressure of any closed system
For the case of an open system, nG is still a function of T and P, and also a
function of the number of moles of each chemical species since material may
be taken from or added to the system
differentiating:
𝑑(𝑛𝐺) = (𝑛𝑉)𝑑𝑃 − (𝑛𝑆)𝑑𝑇
𝑛𝐺 = 𝑔(𝑃, 𝑇, 𝑛1, , 𝑛2, , 𝑛3, … 𝑛𝑖)
𝑑 𝑛𝐺 =𝛿 𝑛𝐺
𝛿𝑃𝑇,𝑛
𝑑𝑃 +𝛿 𝑛𝐺
𝛿𝑇𝑃,𝑛
𝑑𝑇 +
𝑖
𝛿 𝑛𝐺
𝛿𝑛𝑖 𝑃,𝑇,𝑛𝑗
(𝑛𝑉) −(𝑛𝑆) (𝜇𝑖)
𝑑 𝑛𝐺 = 𝑛𝑉 𝑑𝑃 − 𝑛𝑆 𝑑𝑇 + 𝜇𝑖𝑑𝑛𝑖
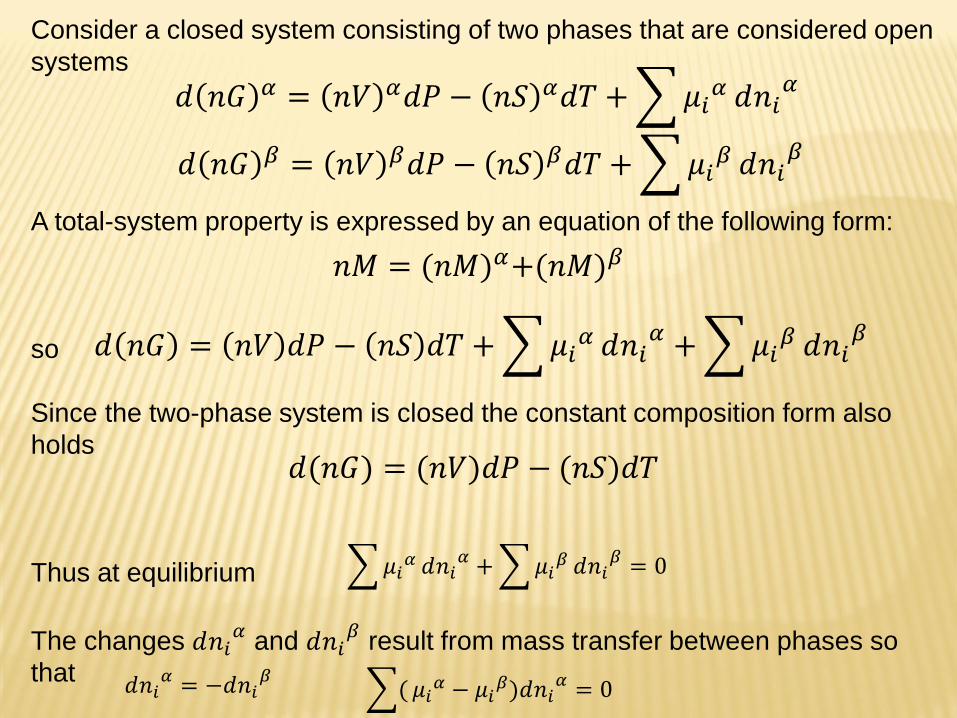
Consider a closed system consisting of two phases that are considered open
systems
A total-system property is expressed by an equation of the following form:
so
Since the two-phase system is closed the constant composition form also
holds
Thus at equilibrium
The changes 𝑑𝑛𝑖𝛼
and 𝑑𝑛𝑖𝛽
result from mass transfer between phases so
that
𝑑 𝑛𝐺 𝛼 = 𝑛𝑉 𝛼𝑑𝑃 − 𝑛𝑆 𝛼𝑑𝑇 + 𝜇𝑖𝛼 𝑑𝑛𝑖
𝛼
𝑑 𝑛𝐺 𝛽 = 𝑛𝑉 𝛽𝑑𝑃 − 𝑛𝑆 𝛽𝑑𝑇 + 𝜇𝑖𝛽 𝑑𝑛𝑖
𝛽
𝑛𝑀 = (𝑛𝑀)𝛼+(𝑛𝑀)𝛽
𝑑 𝑛𝐺 = 𝑛𝑉 𝑑𝑃 − 𝑛𝑆 𝑑𝑇 + 𝜇𝑖𝛼 𝑑𝑛𝑖
𝛼 + 𝜇𝑖𝛽 𝑑𝑛𝑖
𝛽
𝑑(𝑛𝐺) = (𝑛𝑉)𝑑𝑃 − (𝑛𝑆)𝑑𝑇
𝜇𝑖𝛼 𝑑𝑛𝑖
𝛼 + 𝜇𝑖𝛽 𝑑𝑛𝑖
𝛽 = 0
𝑑𝑛𝑖𝛼 = −𝑑𝑛𝑖
𝛽 (𝜇𝑖
𝛼 − 𝜇𝑖𝛽)𝑑𝑛𝑖
𝛼 = 0
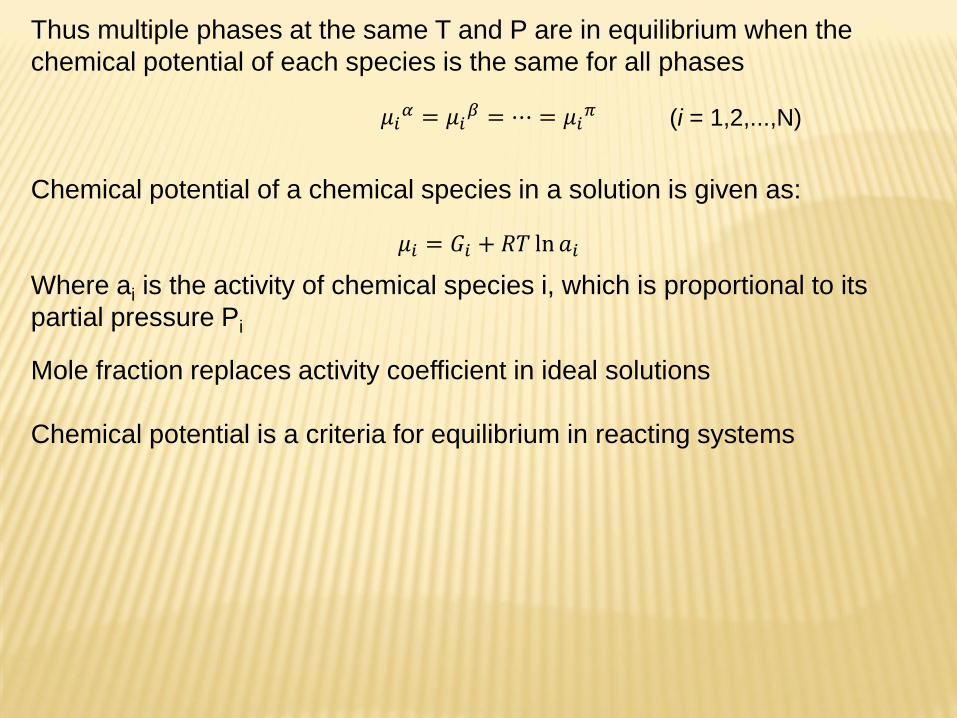
Thus multiple phases at the same T and P are in equilibrium when the
chemical potential of each species is the same for all phases
Chemical potential of a chemical species in a solution is given as:
Where ai is the activity of chemical species i, which is proportional to its
partial pressure Pi
Mole fraction replaces activity coefficient in ideal solutions
Chemical potential is a criteria for equilibrium in reacting systems
𝜇𝑖𝛼 = 𝜇𝑖
𝛽 = ⋯ = 𝜇𝑖𝜋 (i = 1,2,...,N)
𝜇𝑖 = 𝐺𝑖 + 𝑅𝑇 ln 𝑎𝑖
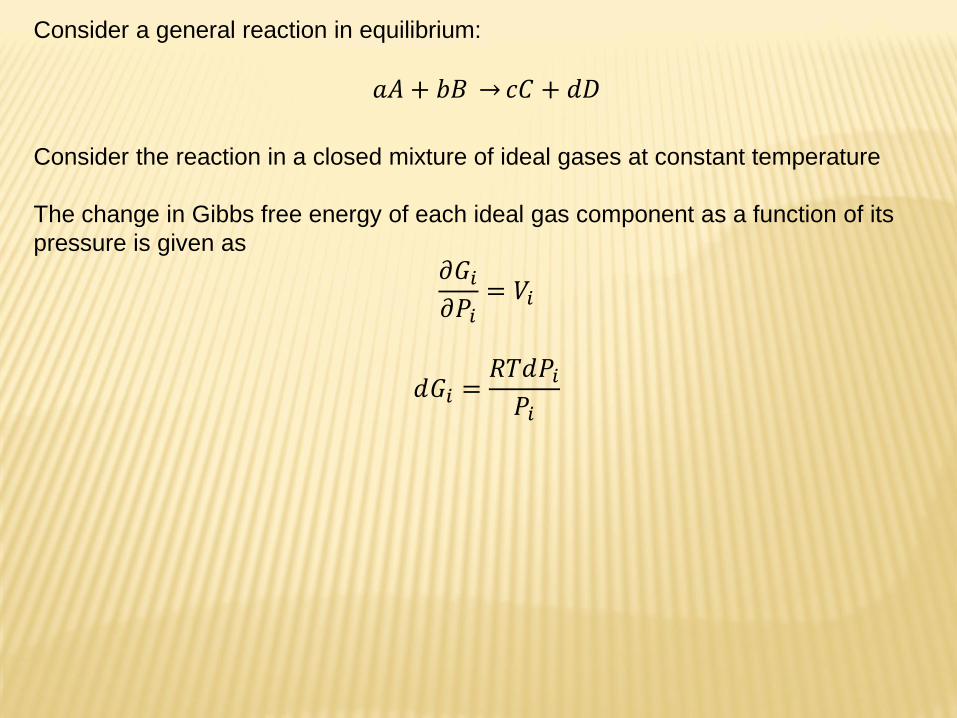
Consider a general reaction in equilibrium:
𝑎𝐴 + 𝑏𝐵 𝑐𝐶 + 𝑑𝐷
Consider the reaction in a closed mixture of ideal gases at constant temperature
The change in Gibbs free energy of each ideal gas component as a function of its
pressure is given as
𝜕𝐺𝑖
𝜕𝑃𝑖= 𝑉𝑖
𝑑𝐺𝑖 =𝑅𝑇𝑑𝑃𝑖
𝑃𝑖
𝑑𝐺𝑖 = 𝑅𝑇𝑑𝑃𝑖
𝑃𝑖
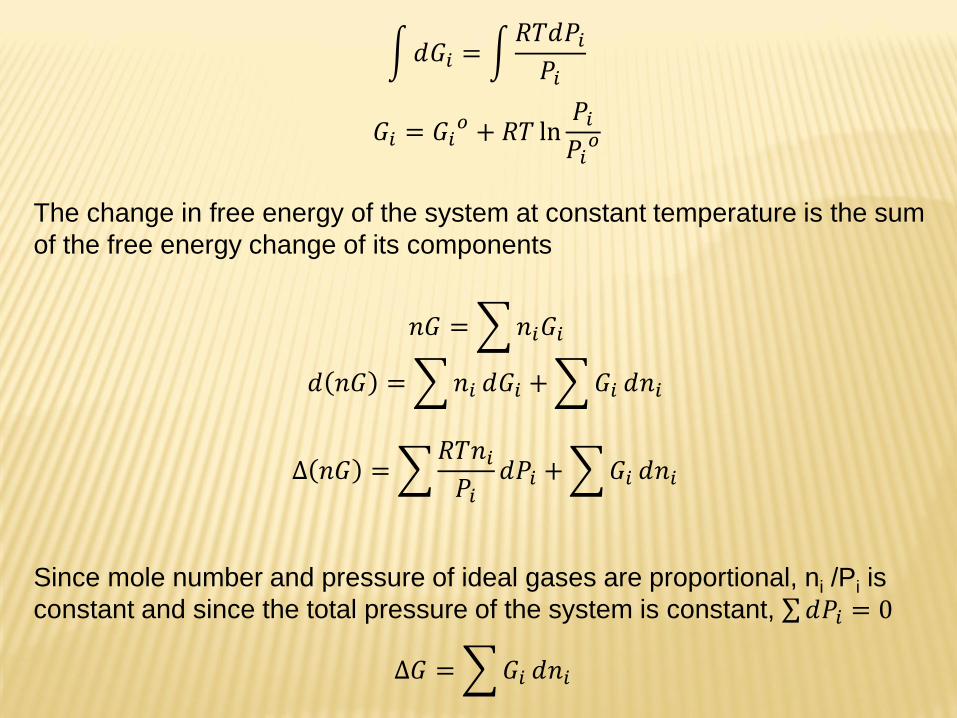
𝐺𝑖 = 𝐺𝑖𝑜 + 𝑅𝑇 ln
𝑃𝑖
𝑃𝑖𝑜
The change in free energy of the system at constant temperature is the sum
of the free energy change of its components
𝑛𝐺 = 𝑛𝑖𝐺𝑖
Since mole number and pressure of ideal gases are proportional, ni /Pi is
constant and since the total pressure of the system is constant, 𝑑𝑃𝑖 = 0
𝑑 𝑛𝐺 = 𝑛𝑖 𝑑𝐺𝑖 + 𝐺𝑖 𝑑𝑛𝑖
∆ 𝑛𝐺 = 𝑅𝑇𝑛𝑖
𝑃𝑖𝑑𝑃𝑖 + 𝐺𝑖 𝑑𝑛𝑖
∆𝐺 = 𝐺𝑖 𝑑𝑛𝑖
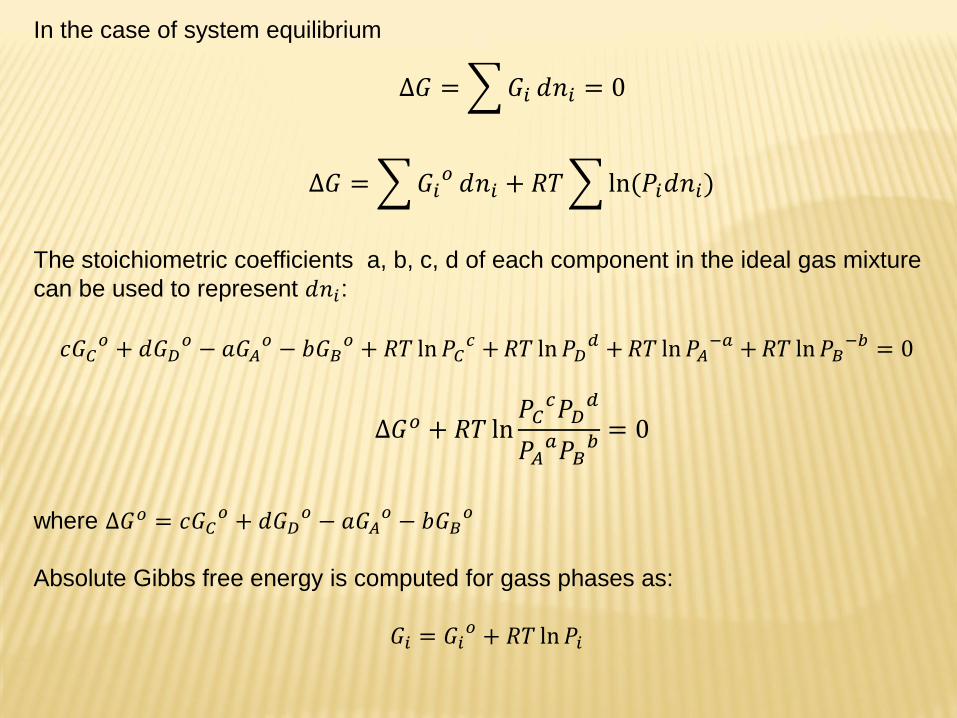
In the case of system equilibrium
The stoichiometric coefficients a, b, c, d of each component in the ideal gas mixture
can be used to represent 𝑑𝑛𝑖:
𝑐𝐺𝐶𝑜 + 𝑑𝐺𝐷
𝑜 − 𝑎𝐺𝐴𝑜 − 𝑏𝐺𝐵
𝑜 + 𝑅𝑇 ln𝑃𝐶𝑐 +𝑅𝑇 ln𝑃𝐷
𝑑 +𝑅𝑇 ln𝑃𝐴−𝑎 +𝑅𝑇 ln𝑃𝐵
−𝑏 = 0
where ∆𝐺𝑜 = 𝑐𝐺𝐶𝑜 + 𝑑𝐺𝐷
𝑜 − 𝑎𝐺𝐴𝑜 − 𝑏𝐺𝐵
𝑜
Absolute Gibbs free energy is computed for gass phases as:
𝐺𝑖 = 𝐺𝑖𝑜 + 𝑅𝑇 ln𝑃𝑖
∆𝐺 = 𝐺𝑖𝑜 𝑑𝑛𝑖 + 𝑅𝑇 ln(𝑃𝑖𝑑𝑛𝑖)
∆𝐺 = 𝐺𝑖 𝑑𝑛𝑖 = 0
∆𝐺𝑜 + 𝑅𝑇 ln𝑃𝐶
𝑐𝑃𝐷𝑑
𝑃𝐴𝑎𝑃𝐵
𝑏 = 0
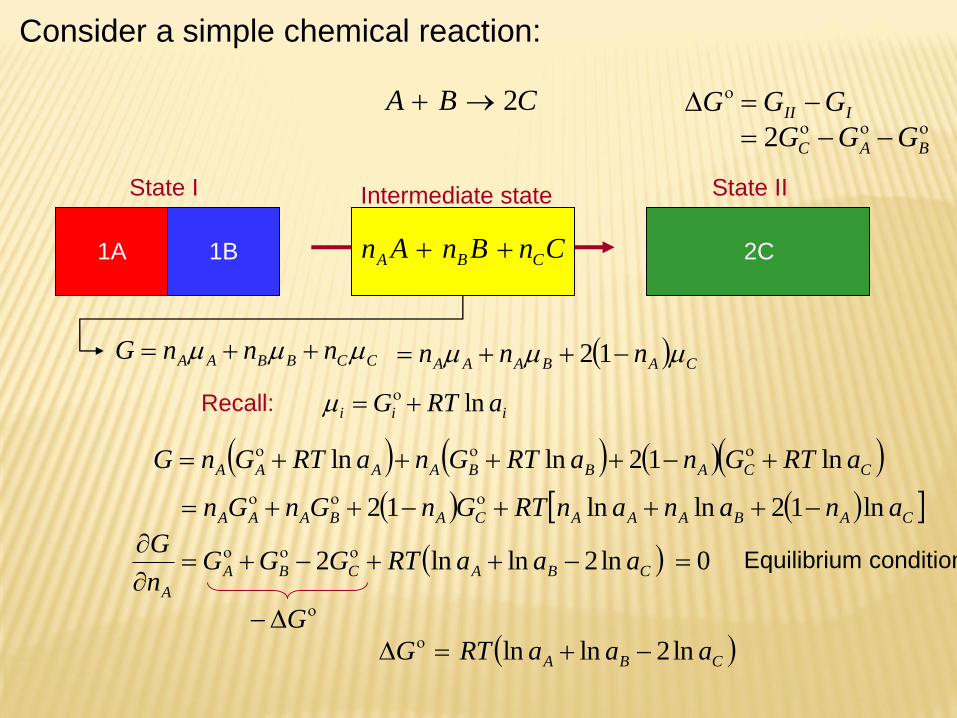
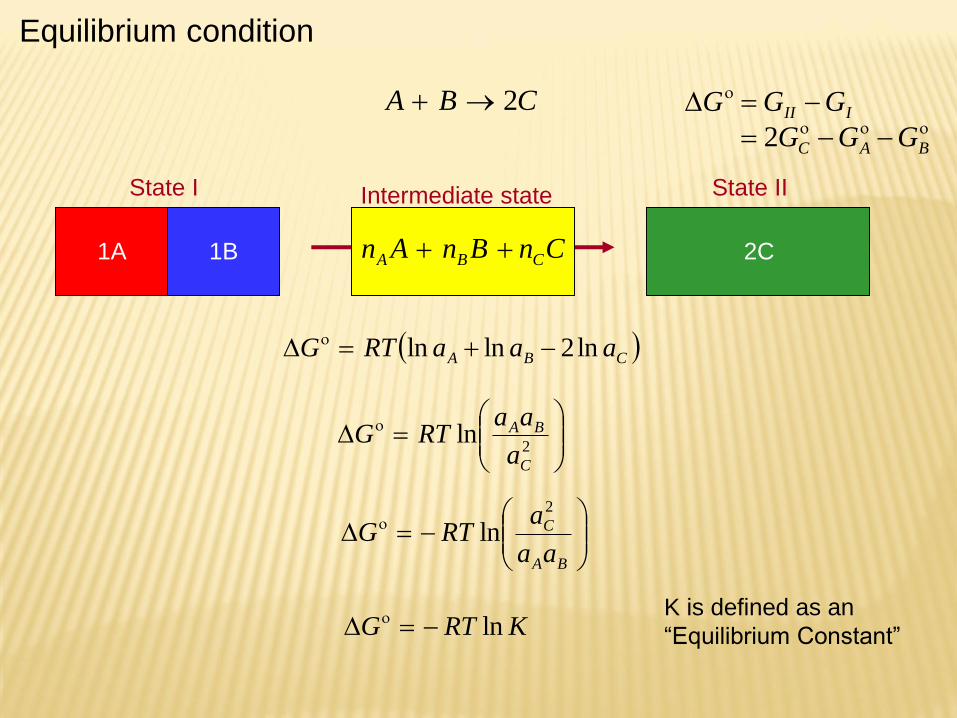
State I State II
CBA 2
1A 1B 2CCnBnAn CBA
Intermediate state
III GGG
BAC GGG 2
CABAAA nnn 12CCBBAA nnnG
Recall: iii aRTG ln
CCABBAAAA aRTGnaRTGnaRTGnG ln12lnln
CABAAACABAAA anananRTGnGnGn ln12lnln12
0ln2lnln2
CBACBA
A
aaaRTGGGn
G
G
CBA aaaRTG ln2lnln
Equilibrium condition
Consider a simple chemical reaction:
State I State II
CBA 2
1A 1B 2CCnBnAn CBA
Intermediate state
III GGG
BAC GGG 2
CBA aaaRTG ln2lnln
2ln
C
BA
a
aaRTG
BA
C
aa
aRTG
2
ln
KRTG ln K is defined as an
“Equilibrium Constant”
Equilibrium condition
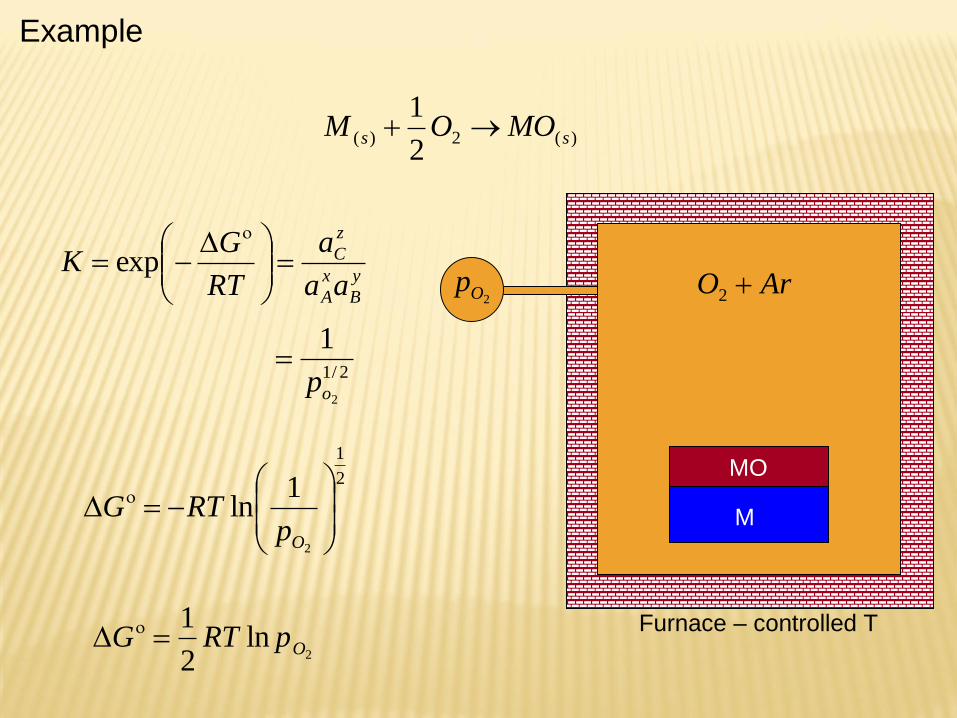
)(2)(2
1ss MOOM
ArO 2
MO
M
Furnace – controlled T
2Opy
B
x
A
z
C
aa
a
RT
GK
exp
2/1
2
1
op
2
1
2
1ln
OpRTG
2ln
2
1OpRTG
Example
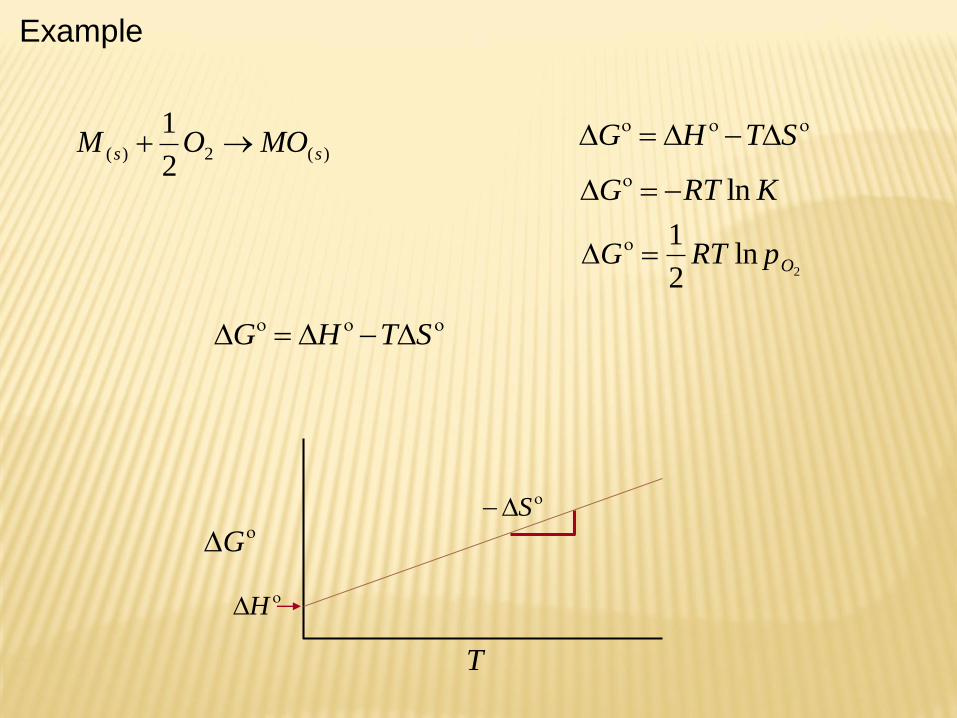
)(2)(2
1ss MOOM
STHG
2ln
2
1OpRTG
KRTG ln
STHG
G
T
H
S
Example

)(2)(2
1ss FeOOFe TG 35.64263700
HS
G
T
0 Gat this
temperature
2ln
2
1OpRTG
atmpO 12
0 G0
Example 2

FeOOFe 22 2 )(7.128400,527 JTG )(76.30052,126 calTG
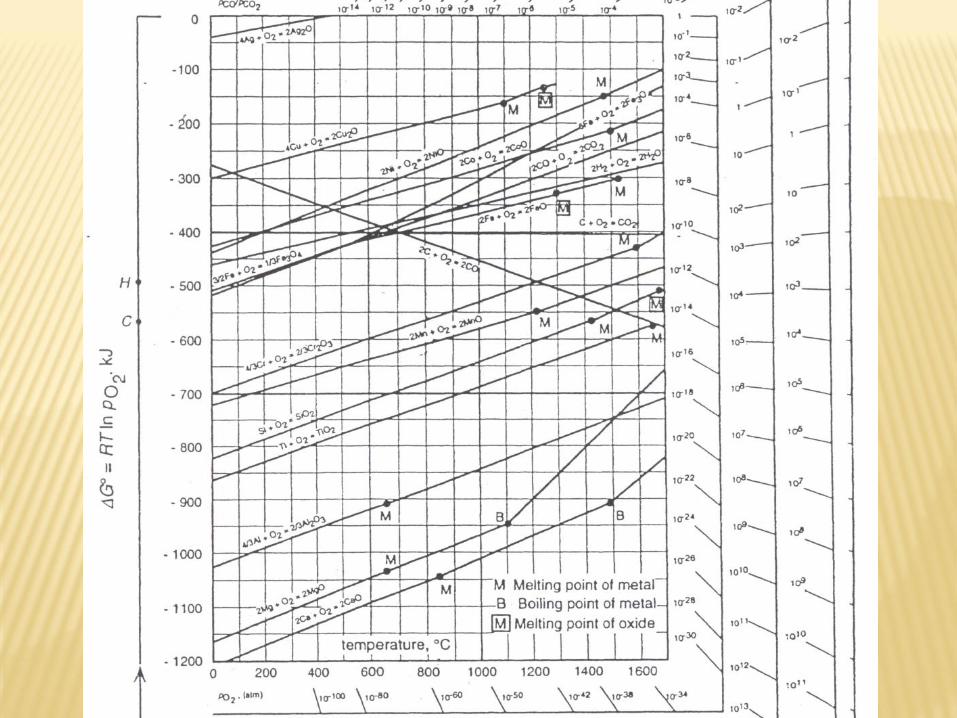
Using The Ellingham Diagram
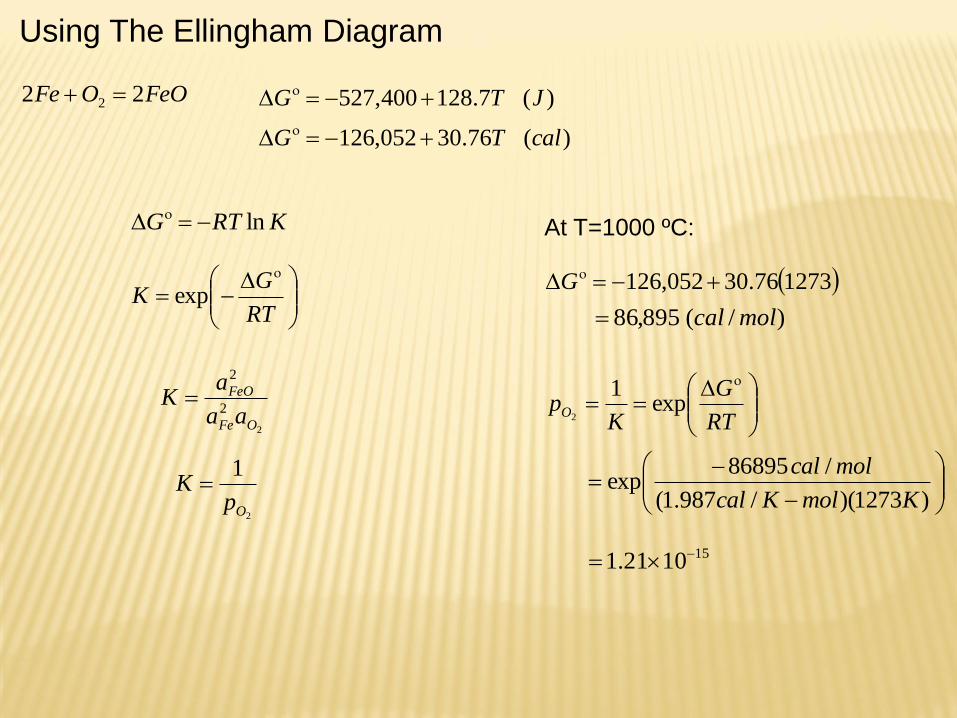
FeOOFe 22 2 )(7.128400,527 JTG
)(76.30052,126 calTG
KRTG ln
RT
GK
exp
At T=1000 ºC:
127376.30052,126 G
)/(895,86 molcal
RT
G
KpO
exp1
2
)1273)(/987.1(
/86895exp
KmolKcal
molcal
151021.1
2
2
2
OFe
FeO
aa
aK
2
1
OpK
Using The Ellingham Diagram

FeOOFe 22 2 )(7.128400,527 JTG )(76.30052,126 calTG
15102
Op
Using The Ellingham Diagram

Basis of the Ellingham Diagram∆𝐺𝑜 for any system can be calculated for any temperature since ∆𝐺𝑜 = ∆𝐻𝑜 − 𝑇∆𝑆𝑜,
∆𝐺𝑜 = ∆𝐻𝑜298 +
298
𝑇
∆𝐶𝑃𝑑𝑇 − 𝑇 ∆𝑆𝑜298 +
298
𝑇 ∆𝐶𝑃𝑑𝑇
𝑇
where 𝐶𝑃 = 𝑎 + 𝑏𝑇 +𝑐
𝑇2
and ∆𝐶𝑃= ∆𝑎 + ∆𝑏𝑇 +𝑐
𝑇2 where ∆𝑎, 𝑏, 𝑐 = ∆𝑎, 𝑏, 𝑐𝑝𝑟𝑜𝑑𝑢𝑐𝑡𝑠 − ∆𝑎, 𝑏, 𝑐𝑟𝑒𝑎𝑐𝑡𝑎𝑛𝑡𝑠
∆𝐺𝑜 = ∆𝐻𝑜298 +
298
𝑇
∆𝑎 + ∆𝑏𝑇 + ∆𝑐𝑇2 𝑑𝑇 − 𝑇 ∆𝑆𝑜
298 + 298
𝑇 ∆𝑎 + ∆𝑏𝑇 + ∆𝑐𝑇2 𝑑𝑇
𝑇
∆𝐺𝑜 = ∆𝐻𝑜298 + ∆𝑎𝑇 +
∆𝑏𝑇2
2− ∆𝑐
𝑇 − 𝑇 ∆𝑆𝑜298 + ∆𝑎 ln𝑇 + ∆𝑏𝑇 − ∆𝑐
2𝑇2
Replacement of the upper and the lower limits yields
∆𝐺𝑜 = 𝐼𝑜 + 𝐼1𝑇 − ∆𝑎𝑇 ln𝑇 −∆𝑏
2𝑇2 −
∆𝑐
2𝑇
where 𝐼𝑜 = ∆𝐻𝑜298 − ∆𝑎298 +
∆𝑏2982
2− ∆𝑐
298
𝐼1 = ∆𝑎 − ∆𝑆𝑜298 + ∆𝑎 ln 298 + ∆𝑏298 − ∆𝑐
2∗2982
T
298
T
298

Example - One important equilibrium between condensed phases such as metals and
oxides and a gaseous phase such as oxygen is oxidation of metals
Consider the oxidation of copper
4Cu 𝑠 + O2 𝑔 = 2Cu2O(𝑠)
∆𝐻𝑜298 = −334400 J
∆𝑆𝑜298 = −152.07 J/K
∆𝐶𝑃 = 4.18 + 0.01839𝑇 +1.67 ∗ 105
𝑇2 J/K
𝐼𝑜 = −334400 − 1500𝐼1 = 4.18 + 152.07 + 28.35
Using the above thermochemical data
∆𝐺𝑜 = −335900 + 184.59𝑇 − 4.18𝑇 ln𝑇 − 0.0092𝑇2 −0.84 ∗ 105
𝑇J
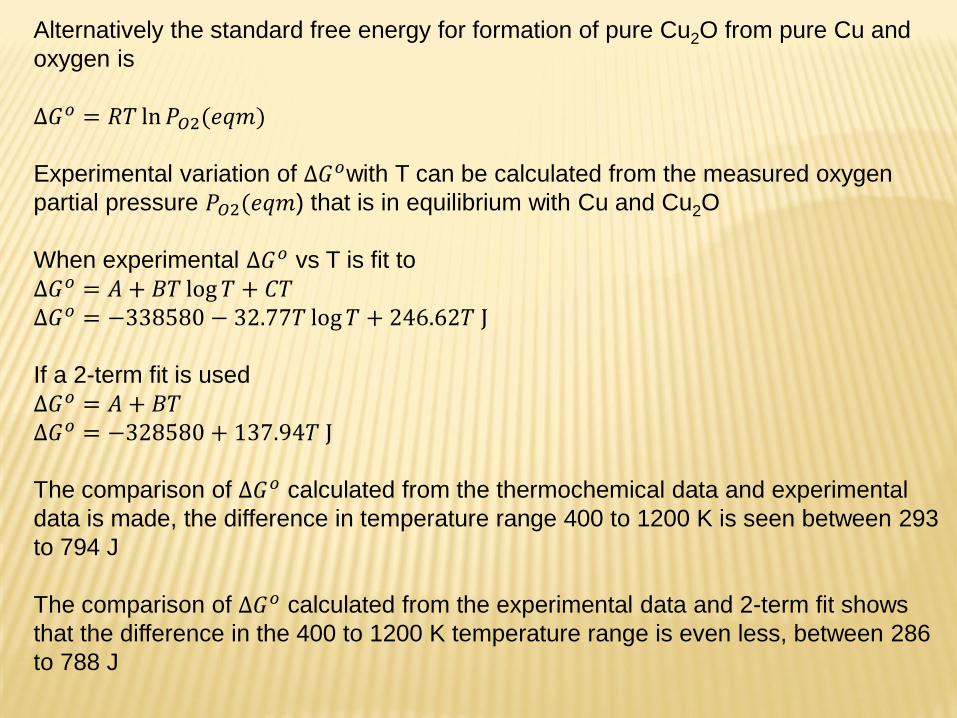
Alternatively the standard free energy for formation of pure Cu2O from pure Cu and
oxygen is
∆𝐺𝑜 = 𝑅𝑇 ln𝑃𝑂2(𝑒𝑞𝑚)
Experimental variation of ∆𝐺𝑜with T can be calculated from the measured oxygen
partial pressure 𝑃𝑂2(𝑒𝑞𝑚) that is in equilibrium with Cu and Cu2O
When experimental ∆𝐺𝑜 vs T is fit to
∆𝐺𝑜 = 𝐴 + 𝐵𝑇 log𝑇 + 𝐶𝑇∆𝐺𝑜 = −338580 − 32.77𝑇 log𝑇 + 246.62𝑇 J
If a 2-term fit is used
∆𝐺𝑜 = 𝐴 + 𝐵𝑇∆𝐺𝑜 = −328580 + 137.94𝑇 J
The comparison of ∆𝐺𝑜 calculated from the thermochemical data and experimental
data is made, the difference in temperature range 400 to 1200 K is seen between 293
to 794 J
The comparison of ∆𝐺𝑜 calculated from the experimental data and 2-term fit shows
that the difference in the 400 to 1200 K temperature range is even less, between 286
to 788 J
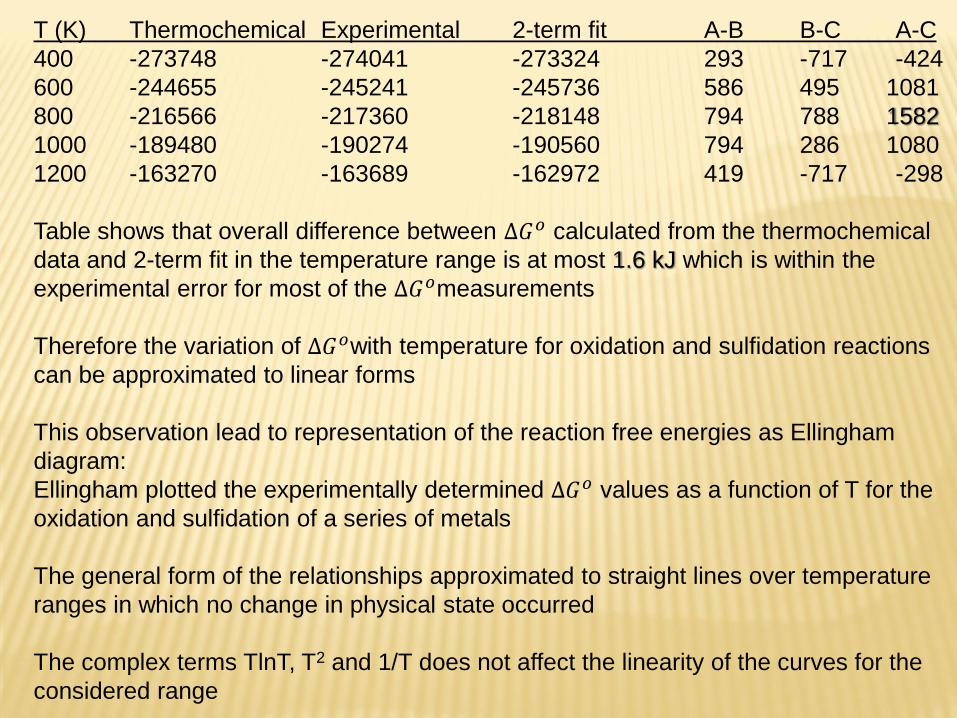
T (K) Thermochemical Experimental 2-term fit A-B B-C A-C
400 -273748 -274041 -273324 293 -717 -424
600 -244655 -245241 -245736 586 495 1081
800 -216566 -217360 -218148 794 788 1582
1000 -189480 -190274 -190560 794 286 1080
1200 -163270 -163689 -162972 419 -717 -298
Table shows that overall difference between ∆𝐺𝑜 calculated from the thermochemical
data and 2-term fit in the temperature range is at most 1.6 kJ which is within the
experimental error for most of the ∆𝐺𝑜measurements
Therefore the variation of ∆𝐺𝑜with temperature for oxidation and sulfidation reactions
can be approximated to linear forms
This observation lead to representation of the reaction free energies as Ellingham
diagram:
Ellingham plotted the experimentally determined ∆𝐺𝑜 values as a function of T for the
oxidation and sulfidation of a series of metals
The general form of the relationships approximated to straight lines over temperature
ranges in which no change in physical state occurred
The complex terms TlnT, T2 and 1/T does not affect the linearity of the curves for the
considered range
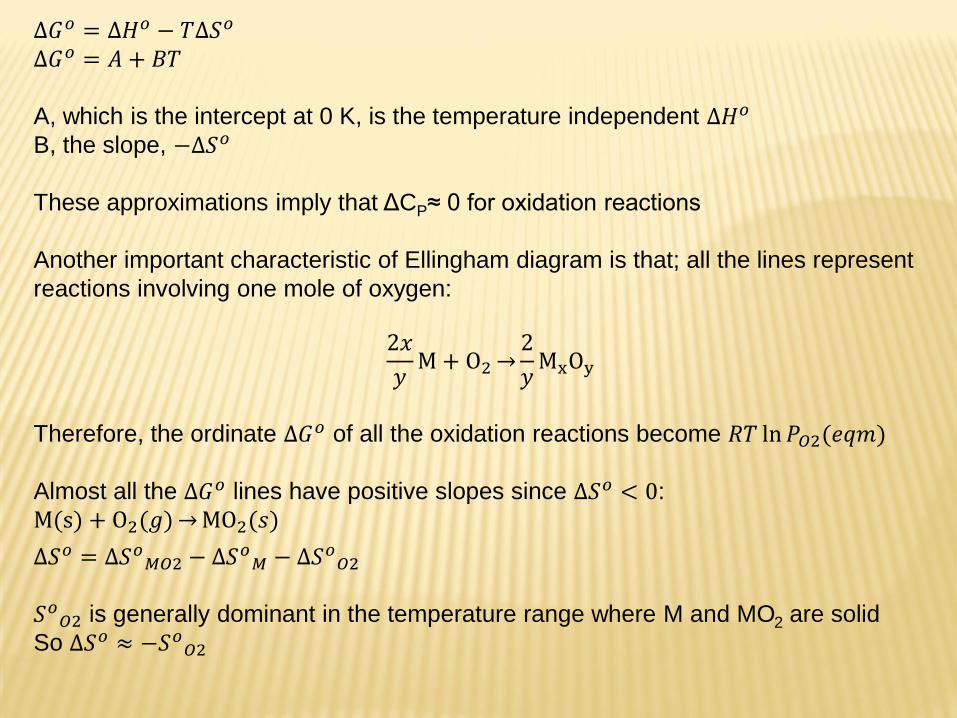
∆𝐺𝑜 = ∆𝐻𝑜 − 𝑇∆𝑆𝑜
∆𝐺𝑜 = 𝐴 + 𝐵𝑇
A, which is the intercept at 0 K, is the temperature independent ∆𝐻𝑜
B, the slope, −∆𝑆𝑜
These approximations imply that ΔCP≈ 0 for oxidation reactions
Another important characteristic of Ellingham diagram is that; all the lines represent
reactions involving one mole of oxygen:
2𝑥
𝑦M + O2
2
𝑦MxOy
Therefore, the ordinate ∆𝐺𝑜 of all the oxidation reactions become 𝑅𝑇 ln𝑃𝑂2(𝑒𝑞𝑚)
Almost all the ∆𝐺𝑜 lines have positive slopes since ∆𝑆𝑜 < 0:
M(s) + O2(𝑔) MO2(𝑠)
∆𝑆𝑜 = ∆𝑆𝑜𝑀𝑂2 − ∆𝑆𝑜
𝑀 − ∆𝑆𝑜𝑂2
𝑆𝑜𝑂2 is generally dominant in the temperature range where M and MO2 are solid
So ∆𝑆𝑜 ≈ −𝑆𝑜𝑂2
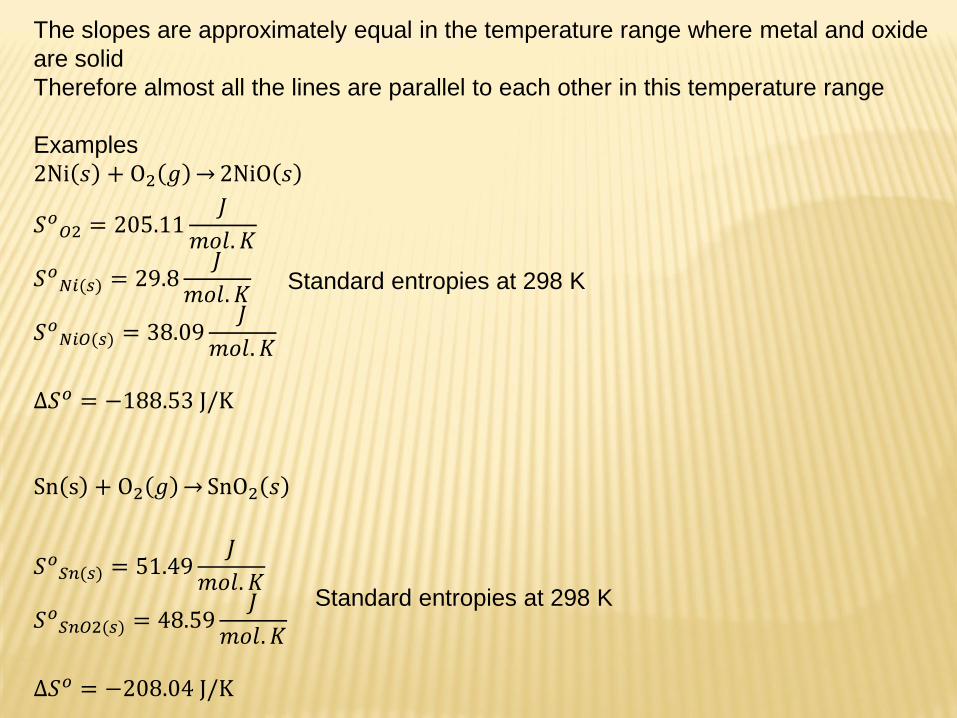
The slopes are approximately equal in the temperature range where metal and oxide
are solid
Therefore almost all the lines are parallel to each other in this temperature range
Examples
2Ni 𝑠 + O2 𝑔 2NiO 𝑠
𝑆𝑜𝑂2 = 205.11
𝐽
𝑚𝑜𝑙. 𝐾
𝑆𝑜𝑁𝑖(𝑠) = 29.8
𝐽
𝑚𝑜𝑙. 𝐾
𝑆𝑜𝑁𝑖𝑂(𝑠) = 38.09
𝐽
𝑚𝑜𝑙. 𝐾
∆𝑆𝑜 = −188.53 J/K
Sn s + O2 𝑔 SnO2 𝑠
𝑆𝑜𝑆𝑛(𝑠) = 51.49
𝐽
𝑚𝑜𝑙. 𝐾
𝑆𝑜𝑆𝑛𝑂2(𝑠) = 48.59
𝐽
𝑚𝑜𝑙. 𝐾
∆𝑆𝑜 = −208.04 J/K
Standard entropies at 298 K
Standard entropies at 298 K

The exceptions to the general trends in oxidation lines are
C 𝑠 + O2 𝑔 CO2 𝑔 ∆𝑆𝑜 ≈ 0
and
2C 𝑠 + O2 𝑔 2CO 𝑔 ∆𝑆𝑜 > 0

Lines on Ellingham diagrams often have sharp breaks in them which are caused by
phase transformations
The straight line representation of ∆𝐺𝑜 vs T relationships are valid if there is no
physical change taking place for any one of the components taking part in the reaction
equilibrium
Consider the transformation of M(s) to M(l) at Tm
M 𝑠 + O2 𝑔 MO2 𝑔
M 𝑙 + O2 𝑔 MO2 𝑔
1
2
T
∆𝐻𝑜
Tm
T
∆𝑆𝑜
Tm
∆𝐻𝑜1> ∆𝐻𝑜
2
∆𝑆𝑜1> ∆𝑆𝑜
2

The net effect of phase transformation of a reactant from a low temperature to a high
temperature phase is an increase in slope
T
−𝑇∆𝑆𝑜
Tm
M(s)
M(l)
T
∆𝐺𝑜
Tm
M(s)
M(l)
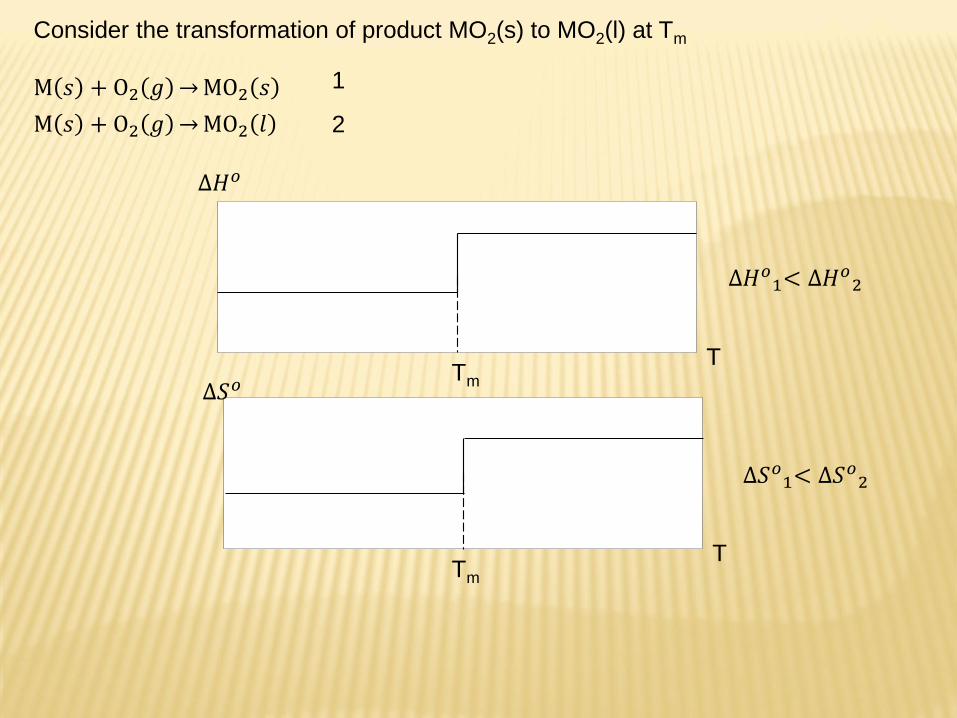
Consider the transformation of product MO2(s) to MO2(l) at Tm
M 𝑠 + O2 𝑔 MO2 𝑠
M 𝑠 + O2 𝑔 MO2 𝑙
1
2
TTm
T
∆𝑆𝑜
∆𝐻𝑜1< ∆𝐻𝑜
2
∆𝑆𝑜1< ∆𝑆𝑜
2
∆𝐻𝑜
Tm
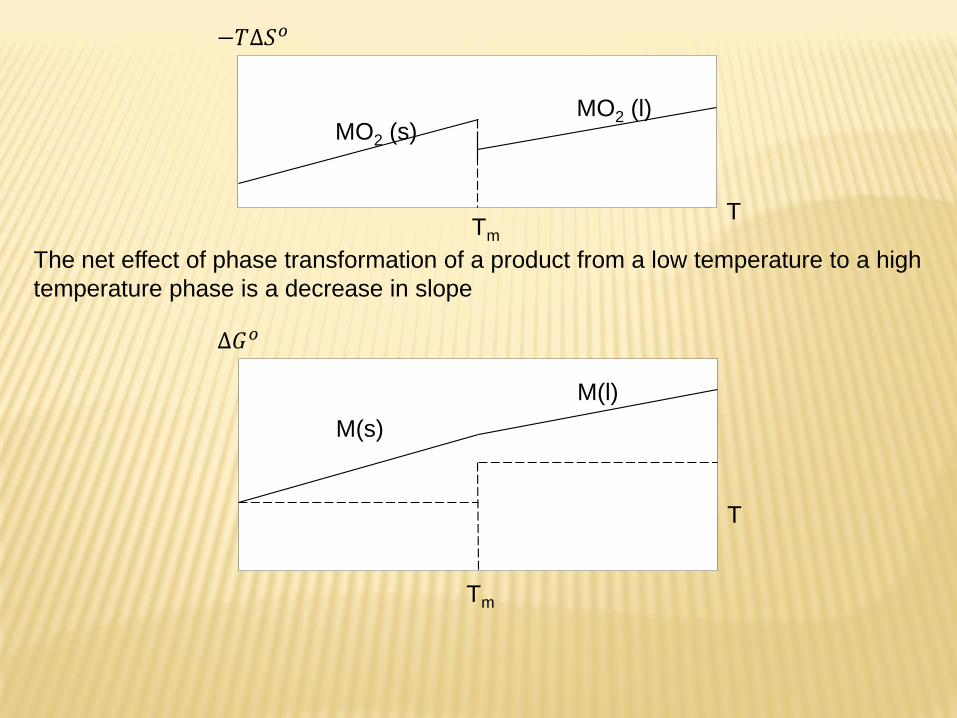
The net effect of phase transformation of a product from a low temperature to a high
temperature phase is a decrease in slope
T
−𝑇∆𝑆𝑜
Tm
MO2 (s)MO2 (l)
T
∆𝐺𝑜
Tm
M(s)
M(l)

Effect of evaporation on ∆𝐺𝑜 vs T plots is similar to melting, but more pronounced
since ∆𝐻𝑜𝑣 is about 10 times greater than ∆𝐻𝑜
𝑚
Slope changes for allotropic transformations will be less than that for melting
T
∆𝐺𝑜
Tm
M(s)
M(l)
M(g)
Tb
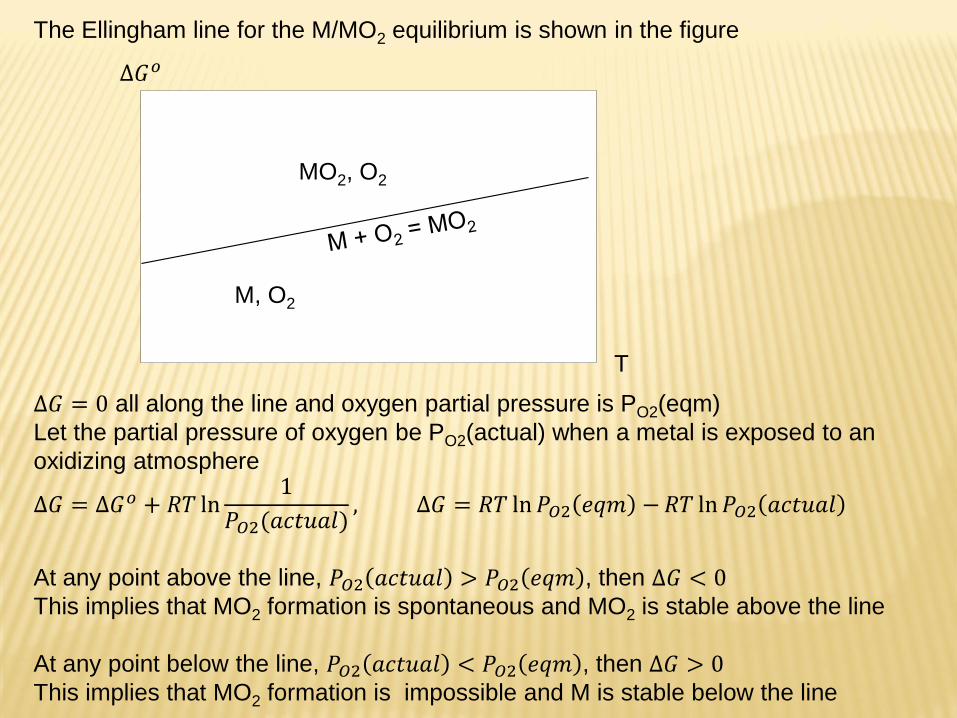
The Ellingham line for the M/MO2 equilibrium is shown in the figure
∆𝐺 = 0 all along the line and oxygen partial pressure is PO2(eqm)
Let the partial pressure of oxygen be PO2(actual) when a metal is exposed to an
oxidizing atmosphere
∆𝐺 = ∆𝐺𝑜 + 𝑅𝑇 ln1
𝑃𝑂2(𝑎𝑐𝑡𝑢𝑎𝑙), ∆𝐺 = 𝑅𝑇 ln𝑃𝑂2 𝑒𝑞𝑚 −𝑅𝑇 ln𝑃𝑂2 𝑎𝑐𝑡𝑢𝑎𝑙
At any point above the line, 𝑃𝑂2 𝑎𝑐𝑡𝑢𝑎𝑙 > 𝑃𝑂2 𝑒𝑞𝑚 , then ∆𝐺 < 0This implies that MO2 formation is spontaneous and MO2 is stable above the line
At any point below the line, 𝑃𝑂2 𝑎𝑐𝑡𝑢𝑎𝑙 < 𝑃𝑂2 𝑒𝑞𝑚 , then ∆𝐺 > 0This implies that MO2 formation is impossible and M is stable below the line
T
∆𝐺𝑜
M, O2
MO2, O2
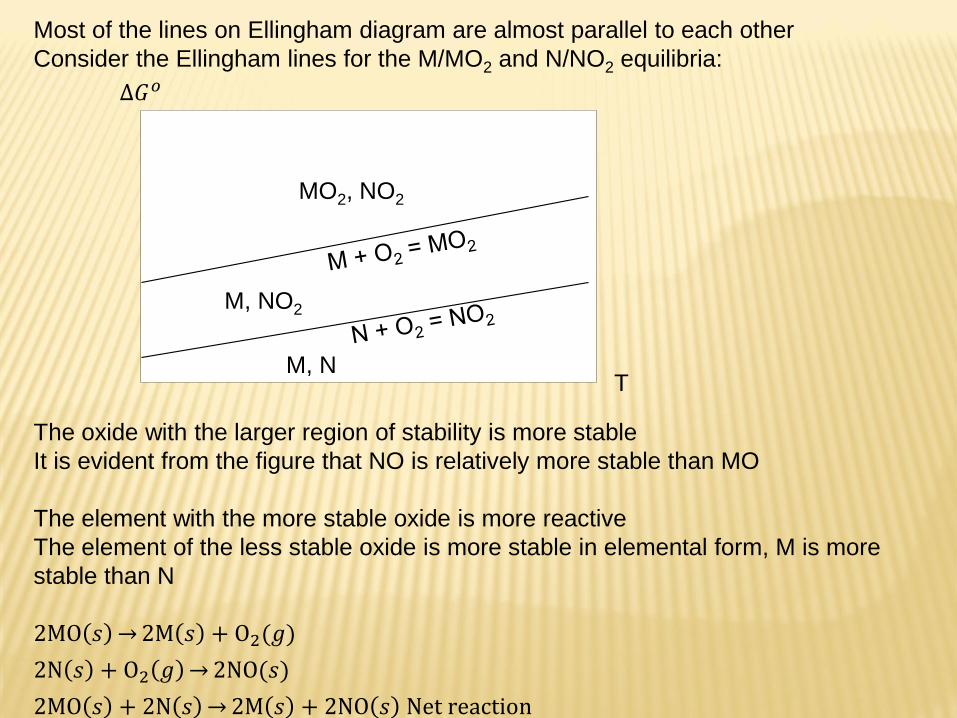
Most of the lines on Ellingham diagram are almost parallel to each other
Consider the Ellingham lines for the M/MO2 and N/NO2 equilibria:
The oxide with the larger region of stability is more stable
It is evident from the figure that NO is relatively more stable than MO
The element with the more stable oxide is more reactive
The element of the less stable oxide is more stable in elemental form, M is more
stable than N
2MO 𝑠 2M 𝑠 + O2(𝑔)
2N 𝑠 + O2 𝑔 2NO(𝑠)
2MO 𝑠 + 2N 𝑠 2M 𝑠 + 2NO 𝑠 Net reaction
T
∆𝐺𝑜
M, NO2
MO2, NO2
M, N
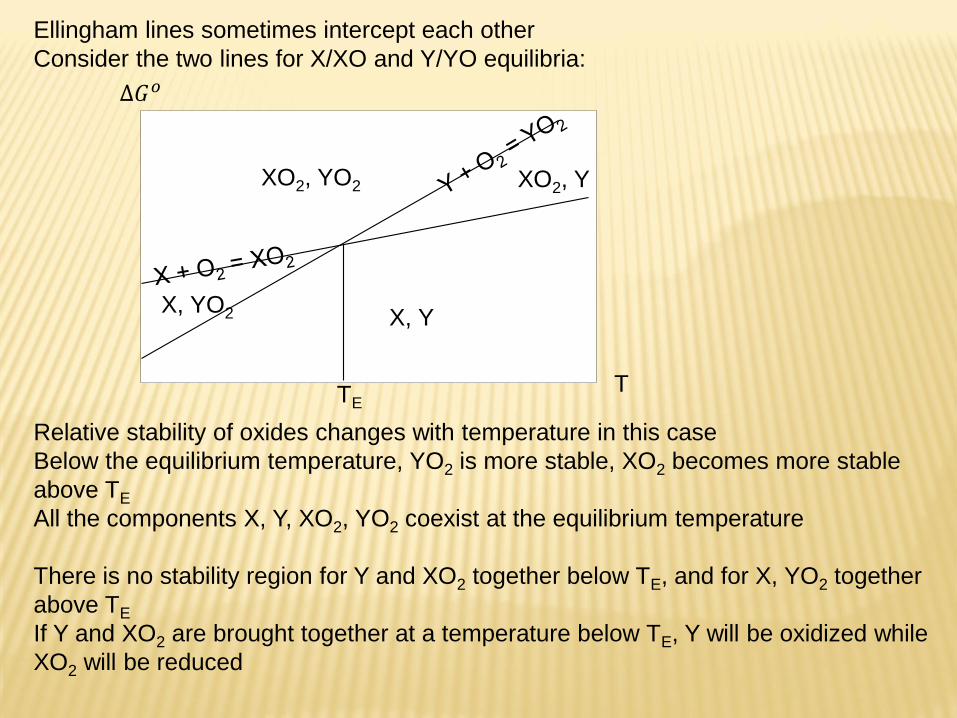
Ellingham lines sometimes intercept each other
Consider the two lines for X/XO and Y/YO equilibria:
Relative stability of oxides changes with temperature in this case
Below the equilibrium temperature, YO2 is more stable, XO2 becomes more stable
above TE
All the components X, Y, XO2, YO2 coexist at the equilibrium temperature
There is no stability region for Y and XO2 together below TE, and for X, YO2 together
above TE
If Y and XO2 are brought together at a temperature below TE, Y will be oxidized while
XO2 will be reduced
T
∆𝐺𝑜
X, YO2
XO2, YO2
X, Y
XO2, Y
TE

Partial pressure grid lines
Ellingham diagram offers a simple and useful way to estimate equilibrium oxygen
pressures as a function of temperature
For constant 𝑃𝑂2 values, ∆𝐺𝑜 vs T is represented by straight lines with R ln𝑃𝑂2slope
and ∆𝐺𝑜 = 0 intercept
Constant oxygen partial pressures can be read from the oxygen partial pressure scale
when these lines are superimposed
The intersections of the constant oxygen partial pressure lines and the X-
XO2equilibirum line give the equilibrium oxygen partial pressures for this reaction at
various temperatures
Oxygen partial pressure at 700 °C, in equilibrium with X and XO2 is 10-11atm
Oxide is stable if the oxide lines are under the partial pressure line at a temperature
T
∆𝐺𝑜
XO2, O2
X, O2
700 °C
0PO2
1 atm
10-11 atm
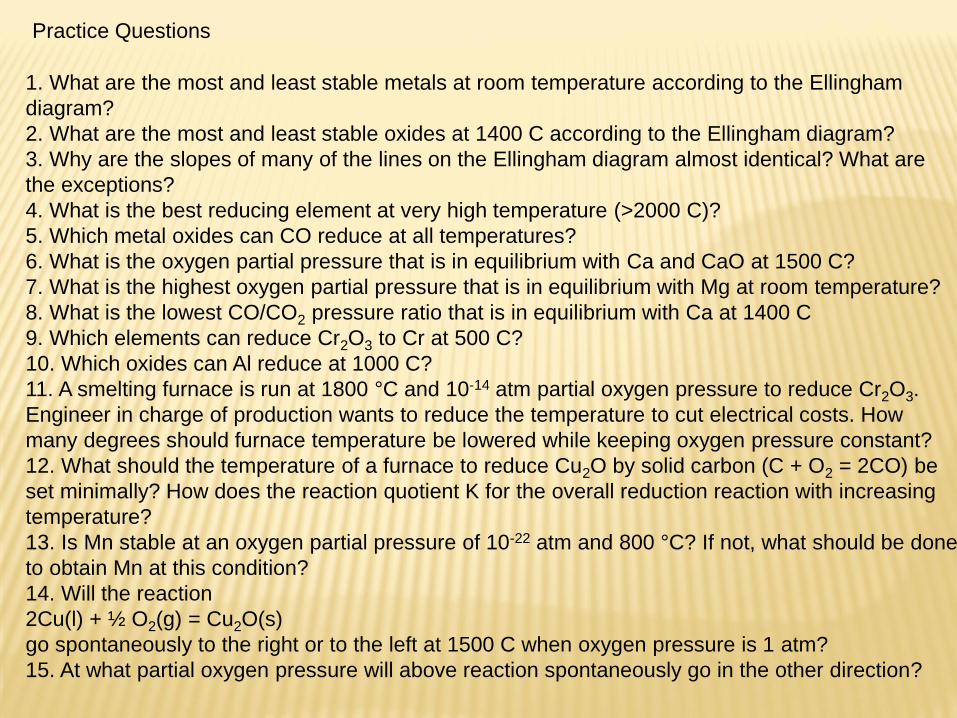
Practice Questions
1. What are the most and least stable metals at room temperature according to the Ellingham
diagram?
2. What are the most and least stable oxides at 1400 C according to the Ellingham diagram?
3. Why are the slopes of many of the lines on the Ellingham diagram almost identical? What are
the exceptions?
4. What is the best reducing element at very high temperature (>2000 C)?
5. Which metal oxides can CO reduce at all temperatures?
6. What is the oxygen partial pressure that is in equilibrium with Ca and CaO at 1500 C?
7. What is the highest oxygen partial pressure that is in equilibrium with Mg at room temperature?
8. What is the lowest CO/CO2 pressure ratio that is in equilibrium with Ca at 1400 C
9. Which elements can reduce Cr2O3 to Cr at 500 C?
10. Which oxides can Al reduce at 1000 C?
11. A smelting furnace is run at 1800 °C and 10-14 atm partial oxygen pressure to reduce Cr2O3.
Engineer in charge of production wants to reduce the temperature to cut electrical costs. How
many degrees should furnace temperature be lowered while keeping oxygen pressure constant?
12. What should the temperature of a furnace to reduce Cu2O by solid carbon (C + O2 = 2CO) be
set minimally? How does the reaction quotient K for the overall reduction reaction with increasing
temperature?
13. Is Mn stable at an oxygen partial pressure of 10-22 atm and 800 °C? If not, what should be done
to obtain Mn at this condition?
14. Will the reaction
2Cu(l) + ½ O2(g) = Cu2O(s)
go spontaneously to the right or to the left at 1500 C when oxygen pressure is 1 atm?
15. At what partial oxygen pressure will above reaction spontaneously go in the other direction?