14
EXECUTIVE SUMMARY PAGE i Executive Summary

EXECUTIVE SUMMARY PAGE i
Executive Summary
MINNESOTA GO MNDOT TRANSPORTATION ASSET MANAGEMENT PLANPAGE ii
This page intentionally left blank.
EXECUTIVE SUMMARY PAGE iii
EXECUTIVE SUMMARY
Overview
In accordance with the Moving Ahead for Progress in the 21st Century Act (“MAP-21” – the federal transportation authorization signed into law on July 6, 2012), the Minnesota Department of Transportation (MnDOT) has developed its first ever Transportation Asset Management Plan (TAMP). It was a collaborative effort, guided by a TAMP Steering Committee with representation from a wide range of MnDOT offices and districts, as well as from the agency senior leadership. MnDOT also worked closely with the Federal Highway Administration (FHWA), the FHWA Minnesota Division, and regional partners (e.g. Metropolitan Planning Organizations, Regional Development Commissions) to create this plan. As a national pilot project, MnDOT’s TAMP, along with those produced by Louisiana Department of Transportation and Development and New York State Department of Transportation will serve as an example and guide for other states as they develop TAMPs of their own.
The TAMP will continue to, and in fact already has improved infrastructure management at the agency. Using the TAMP as a guide, MnDOT will more thoroughly analyze life-cycle costs, evaluate risks and develop mitigation strategies, establish asset condition performance measures and targets, and develop investment strategies. The TAMP will also serve as an accountability and communication tool and will inform established capital and operations planning efforts.
This TAMP document is accompanied by a TAMP Technical Guide, which provides further detail about the process, methodology analyses, and procedures used during its development. The TAMP Technical Guide has been designed to roughly parallel the main TAMP with nine sections, each of which corresponds to a specific TAMP chapter. Specific elements in the guide are referenced and hyperlinked throughout the TAMP.
MINNESOTA GO MNDOT TRANSPORTATION ASSET MANAGEMENT PLANPAGE iv
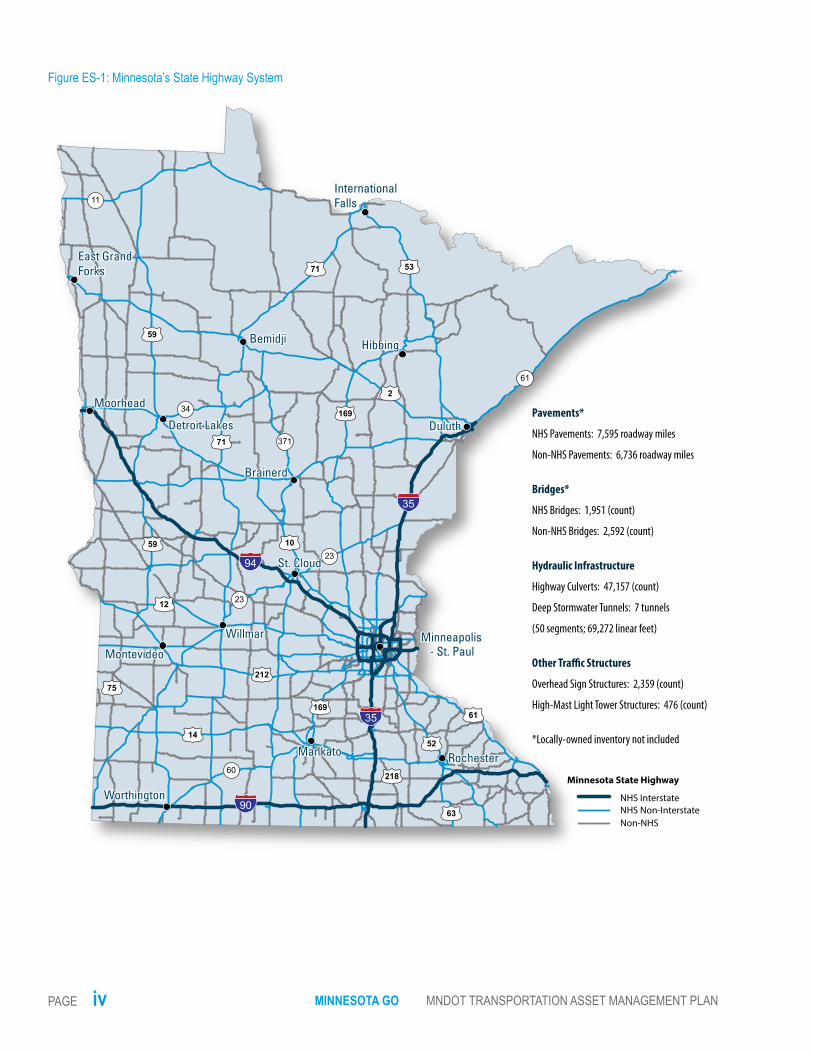
Figure ES-1: Minnesota’s State Highway System
Pavements*
NHS Pavements: 7,595 roadway miles
Non-NHS Pavements: 6,736 roadway miles
Bridges*
NHS Bridges: 1,951 (count)
Non-NHS Bridges: 2,592 (count)
Hydraulic Infrastructure
Highway Culverts: 47,157 (count)
Deep Stormwater Tunnels: 7 tunnels
(50 segments; 69,272 linear feet)
Other Tra�c Structures
Overhead Sign Structures: 2,359 (count)
High-Mast Light Tower Structures: 476 (count)
*Locally-owned inventory not included
NHS InterstateNHS Non-InterstateNon-NHS
Minnesota State Highway
EXECUTIVE SUMMARY PAGE v
Background
Minnesota’s 14,000-mile state highway system – constructed, operated, managed, and maintained by MnDOT – is critical to the state’s economic competitiveness and quality of life. Successful administration of such an extensive and complex system relies on sound investment strategies and management practices. To this end, MnDOT has used performance measures to inform management and investment decisions since the mid-1990s; these were made a formal part of MnDOT’s statewide planning processes in 2003.
With the passage of MAP-21 each state transportation department is required to develop a risk-based TAMP for all pavements and bridges on the National Highway System (NHS). Because MnDOT had already begun to implement asset management principles prior to the MAP-21 legislation, it was in a good position to expand beyond MAP-21 requirements. This TAMP includes pavements and bridges on the entire state highway system as well as several smaller asset categories: highway culverts, deep stormwater tunnels, overhead sign structures, and high-mast light tower structures (see Figure ES-1). Additional asset categories will be included in future MnDOT asset management planning initiatives.
Performance Measures and Targets
MnDOT’s performance-based approach to asset management relies on measures to assess system performance, identify needs, and develop investment priorities. Historically, these measures have included pavement ride quality and bridge condition and are used, along with targets for each measure, to develop the 20-year State Highway Investment Plan (MnSHIP). Additional performance measures, tracking things like culvert and stormwater tunnel condition, have been monitored and used internally for managing asset-specific programs, but not for establishing investment priorities.
As part of the TAMP process, MnDOT experts further developed performance measures and targets for several of these ancillary asset categories and recommended them for formal inclusion in future iterations of MnSHIP. Figure ES-2 explains the performance measures for each asset category included in the TAMP, along with MnSHIP targets where they exist.
MnDOT expanded beyond the MAP-21 required assets.
ASSETS MnDOTTAMP
MAP-21REQUIRED
Pavement
Bridges
Highway Culverts
Deep Storm Tunnels
Overhead Signs
High-mast Lights

MINNESOTA GO MNDOT TRANSPORTATION ASSET MANAGEMENT PLANPAGE vi
Asset Inventory and Condition
A considerable amount of information is needed to develop a robust TAMP. For the pavements and bridges, this information was, for the most part, readily available in MnDOT’s pavement and bridge management systems. For other asset categories, data were less complete or accessible. Condition inspections are performed less consistently on deep stormwater tunnels, overhead sign structures, and high-mast light tower structures, resulting in limited maintenance histories and asset condition deterioration rates for these asset categories.
MnDOT is using the TAMP process to assess the maturity level of the maintenance and management of many of its assets, to identify process improvements that will help manage them more effectively, and to apply these principles to other MnDOT asset groups. Folios were created for each asset category to summarize inventory, estimate replacement value, and report on data collection, management technique, reporting practices, current condition, recommended targets, and planned investment levels over the next 10 years. Figure ES-3 summarizes the system-wide replacement values for the asset categories included in the TAMP.
Figure ES-2: Performance Measures By Asset Type
ASSET TYPE PERFORMANCE MEASURE MNSHIP (2013)TARGET
Pavements Share of system with lane miles with Poor ride quality≤ 2% (NHS)≤ 3% (Non-NHS)
Bridges NHS bridges in Poor condition as a percent of total NHS bridge deck area≤ 2% (NHS)≤ 8% (Non-NHS)
Highway Culverts Share of culverts in Poor or Very Poor condition NA
Deep Stormwater TunnelsTunnels in Poor and Very Poor condition, measured as a percent of total tunnel system length
NA
Overhead Sign Structures Share of overhead sign structures in Poor or Very Poor condition NA
High-Mast Light Tower Structures Share of High-Mast Light Tower Structures in Poor or Very Poor condition NA
Notes: MnDOT uses multiple measures to evaluate the effectiveness of its pavement and bridge management activities. The measures listed here are those used to calculate MnDOT’s performance-based investment needs. For a more comprehensive listing of MnDOT’s pavement performance measures, see the 2013 Pavement Condition Annual Report. Additional bridge measures can be found in MnDOT’s Annual Transportation Performance Report.
EXECUTIVE SUMMARY PAGE vii
Figure ES-3: Replacement Cost by Asset Category
ASSET CLASS REPLACEMENT COST
Pavements $29.5 billionBridges (includes large bridges and culverts greater than 10 feet) $6.6 billionHydraulic Infrastructure: Highway Culverts $1.7 billionHydraulic Infrastructure: Deep Stormwater Tunnels $300 millionOther Traffic Structures: Overhead Sign Structures $200 millionOther Traffic Structures: High-Mast Light Tower Structures $19 million
Risk Management
Risk – or the effect of uncertainty on objectives – can help a transportation agency more successfully plan for possible system and program disruptions and complications, mitigate potential consequences, and improve agency and infrastructure resiliency.
Even before MAP-21, risk management had been a focus area for MnDOT, implemented throughout the agency from high level investment, management, and operations plans to individual asset management programming processes. MnDOT began developing the risk section of the TAMP with an exercise designed to focus on “global” risks (e.g. natural events, operational hazards) and their effects on the assets, the public, and the agency. Discussions were held with in-house technical experts to assess the major risks related to each asset category.
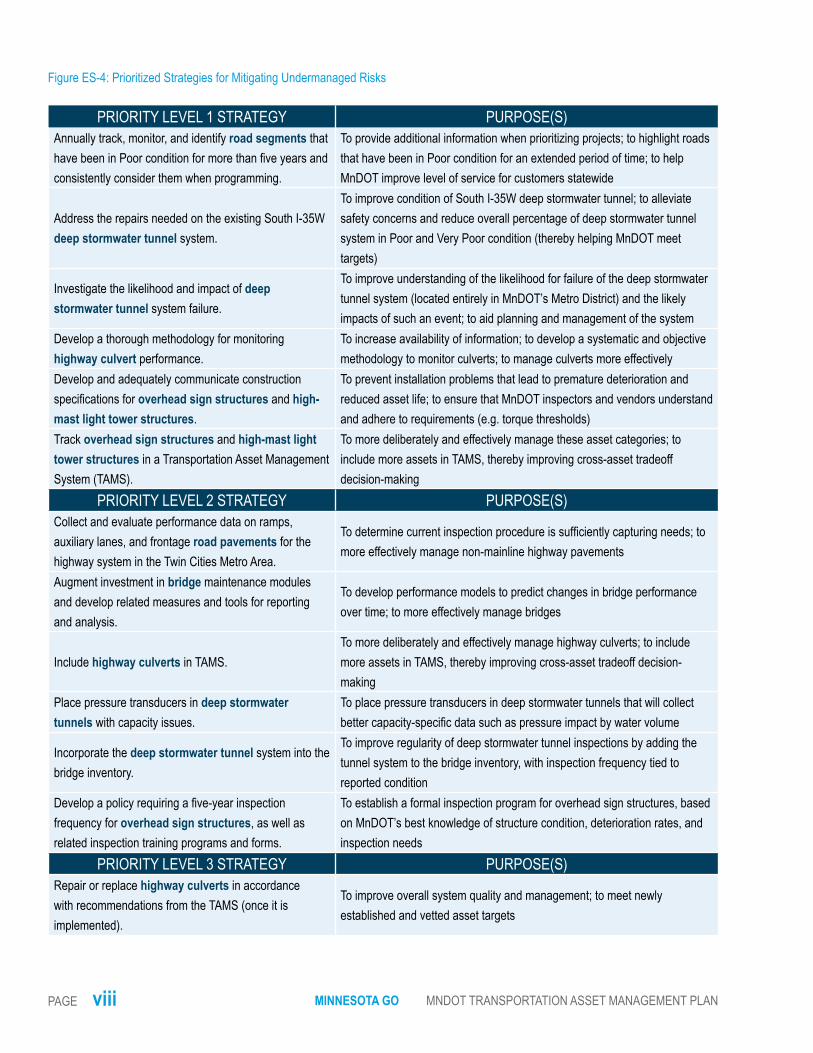
Upon further deliberation, the technical experts and the project management team concluded that MnDOT’s current practices were already mindful of many global risks and that the agency (and the public it serves) would benefit more if the TAMP emphasized “undermanaged risks” – areas in which there were clear opportunities for improvement at MnDOT. After pivoting to this concept and removing from the list those risks that were already well-managed by the agency, a final list of undermanaged risks and associated risk mitigation strategies was presented to the TAMP Steering Committee for prioritization. Figure ES-4 displays the prioritized mitigation strategies, which were used to establish investment priorities and to amend existing business processes to improve the management of assets at MnDOT. Chapter 9 of the TAMP includes a similar table (Figure 9-2) which also includes estimated costs, expected implementation timeframes, and individual MnDOT office responsibilities for each strategy.
MINNESOTA GO MNDOT TRANSPORTATION ASSET MANAGEMENT PLANPAGE viii
Figure ES-4: Prioritized Strategies for Mitigating Undermanaged Risks
PRIORITY LEVEL 1 STRATEGY PURPOSE(S)Annually track, monitor, and identify road segments that have been in Poor condition for more than five years and consistently consider them when programming.
To provide additional information when prioritizing projects; to highlight roads that have been in Poor condition for an extended period of time; to help MnDOT improve level of service for customers statewide
Address the repairs needed on the existing South I-35W deep stormwater tunnel system.
To improve condition of South I-35W deep stormwater tunnel; to alleviate safety concerns and reduce overall percentage of deep stormwater tunnel system in Poor and Very Poor condition (thereby helping MnDOT meet targets)
Investigate the likelihood and impact of deep stormwater tunnel system failure.
To improve understanding of the likelihood for failure of the deep stormwater tunnel system (located entirely in MnDOT’s Metro District) and the likely impacts of such an event; to aid planning and management of the system
Develop a thorough methodology for monitoring highway culvert performance.
To increase availability of information; to develop a systematic and objective methodology to monitor culverts; to manage culverts more effectively
Develop and adequately communicate construction specifications for overhead sign structures and high-mast light tower structures.
To prevent installation problems that lead to premature deterioration and reduced asset life; to ensure that MnDOT inspectors and vendors understand and adhere to requirements (e.g. torque thresholds)
Track overhead sign structures and high-mast light tower structures in a Transportation Asset Management System (TAMS).
To more deliberately and effectively manage these asset categories; to include more assets in TAMS, thereby improving cross-asset tradeoff decision-making
PRIORITY LEVEL 2 STRATEGY PURPOSE(S)Collect and evaluate performance data on ramps, auxiliary lanes, and frontage road pavements for the highway system in the Twin Cities Metro Area.
To determine current inspection procedure is sufficiently capturing needs; to more effectively manage non-mainline highway pavements
Augment investment in bridge maintenance modules and develop related measures and tools for reporting and analysis.
To develop performance models to predict changes in bridge performance over time; to more effectively manage bridges
Include highway culverts in TAMS.To more deliberately and effectively manage highway culverts; to include more assets in TAMS, thereby improving cross-asset tradeoff decision-making
Place pressure transducers in deep stormwater tunnels with capacity issues.
To place pressure transducers in deep stormwater tunnels that will collect better capacity-specific data such as pressure impact by water volume
Incorporate the deep stormwater tunnel system into the bridge inventory.
To improve regularity of deep stormwater tunnel inspections by adding the tunnel system to the bridge inventory, with inspection frequency tied to reported condition
Develop a policy requiring a five-year inspection frequency for overhead sign structures, as well as related inspection training programs and forms.
To establish a formal inspection program for overhead sign structures, based on MnDOT’s best knowledge of structure condition, deterioration rates, and inspection needs
PRIORITY LEVEL 3 STRATEGY PURPOSE(S)Repair or replace highway culverts in accordance with recommendations from the TAMS (once it is implemented).
To improve overall system quality and management; to meet newly established and vetted asset targets

EXECUTIVE SUMMARY PAGE ix
Life-Cycle Cost Analysis
Asset management helps to minimize the total cost of managing transportation assets in part by focusing on all phases of an asset’s life-cycle (see in Figure ES-5). When a new road is built, the state is committing not only to the initial construction costs, but also to the future costs of maintaining and operating that road. Over a long time period, future costs can be much greater than the initial cost. Therefore, it is important to manage facilities as cost-effectively as possible over their entire lives, and to be mindful of life-cycle costs when making decisions about an asset.
Figure ES-5: Phases in a Typical Asset Life-Cycle
The life-cycle analyses conducted as part of this TAMP involved comparing several different improvement strategies for each asset type in order to determine which of the strategies was most cost-effective over an extended period. Analysis periods of various lengths were used for different asset categories based on the desire to include one full reconstruct (replacement) cycle for each asset.
At least two improvement strategies were analyzed for each asset – a “typical” strategy, which considered the types of treatments normally performed by MnDOT, and a “worst-first” strategy, which assumed limited improvements and that each asset would be allowed to deteriorate to the point that it needed to be replaced. A third strategy, referred to as the “desired” strategy, was considered for pavements only (due to a lack of data for other assets) and followed the treatment intervals suggested as ideal in MnDOT’s Pavement Design Manual.

MINNESOTA GO MNDOT TRANSPORTATION ASSET MANAGEMENT PLANPAGE x
The results of the analyses are presented in Chapter 6 of this document; Figure ES-6 displays the results for the pavement asset category. The first chart represents the total costs of each investment strategy over the analysis period (excluding the initial capital investment). As illustrated, the worst-first strategy is significantly more expensive than the typical or desired strategy, indicating that MnDOT’s typical improvement strategies are relatively cost-effective. The second chart shows future MnDOT capital and maintenance commitments for each new asset constructed (again, excluding the initial investment). Thus, for every $1.00 initially invested in a new lane-mile of pavement, MnDOT will need to plan for between $1.11 and $2.87 in additional capital and maintenance costs over the remainder of the analysis period. The total life-cycle costs vary by the investment strategy (typical, desired, worst-first).
Figure ES-6: Pavement Life-Cycle Cost Results
$410 $390
$980
$0
$200
$400
$600
$800
$1,000
$1,200
Net Present Value (NPV)
Thou
sand
s ($
/lane
-mile
)
142%111%
287%
0%
50%
100%
150%
200%
250%
300%
350%
% of Initial CostLife-Cycle Cost (In Today’s Dollars, Excludes Initial Investment)
Life-Cycle Cost as a Percent of Initial Investment (Excludes Initial Investment)

EXECUTIVE SUMMARY PAGE xi
Figure ES-7 summarizes the annualized life-cycle costs for each of the asset categories included in the TAMP.
Financial Plan and Investment Strategies
When developing investment priorities, MnDOT accounts for various factors, including revenue trends, federal and state law, level-of-service provided by the system, and public input. Over the next 10 years, MnDOT’s priorities – as described in it’s 20-year State Highway Investment Plan (MnSHIP) and illustrated in Figure ES-8 – will aim to balance investments that preserve existing infrastructure with investments in safety, multimodal transportation, and other projects that improve economic competitiveness and quality of life in Minnesota.
Figure ES-7: Asset Annualized Life-Cycle Costs
ASSET CLASS ANNUALIZED COSTPavements $12,000 per lane-mileBridges: Large Bridges $16,000 per bridgeBridges: Culverts 10 feet or greater $1,300 per large culvertHydraulic Infrastructure: Highway Culverts $150 per small culvertHydraulic Infrastructure: Deep Stormwater Tunnels $30,000 per mile of tunnelOther Traffic Structures: Overhead Sign Structures $900 per structureOther Traffic Structures: High-Mast Light Tower Structures $400 per structure
Figure ES-8: Capital Investments
PC$2.89B (38.1%)
BC$1.53B (20.2%)
RI$670M(8.8%)
TS$320M(4.2%)
TC$520M (6.9%)
PS$870M(11.5%)RC
$570M(7.5%)BI
$100M(1.4%)
AP$120M (1.6%)
IR$0 (0%)
PC Pavement Condition
BC Bridge Condition
RI Roadside Infrastructure
TS Traveler Safety
TC Twin Cities Mobility
IR Interregional Corridor Mobility
BI Bicycle Infrastructure
AP Accessible Pedestrian Infrastructure
RC Regional + Community Investment Priorities
PS Project Support
MINNESOTA GO MNDOT TRANSPORTATION ASSET MANAGEMENT PLANPAGE xii
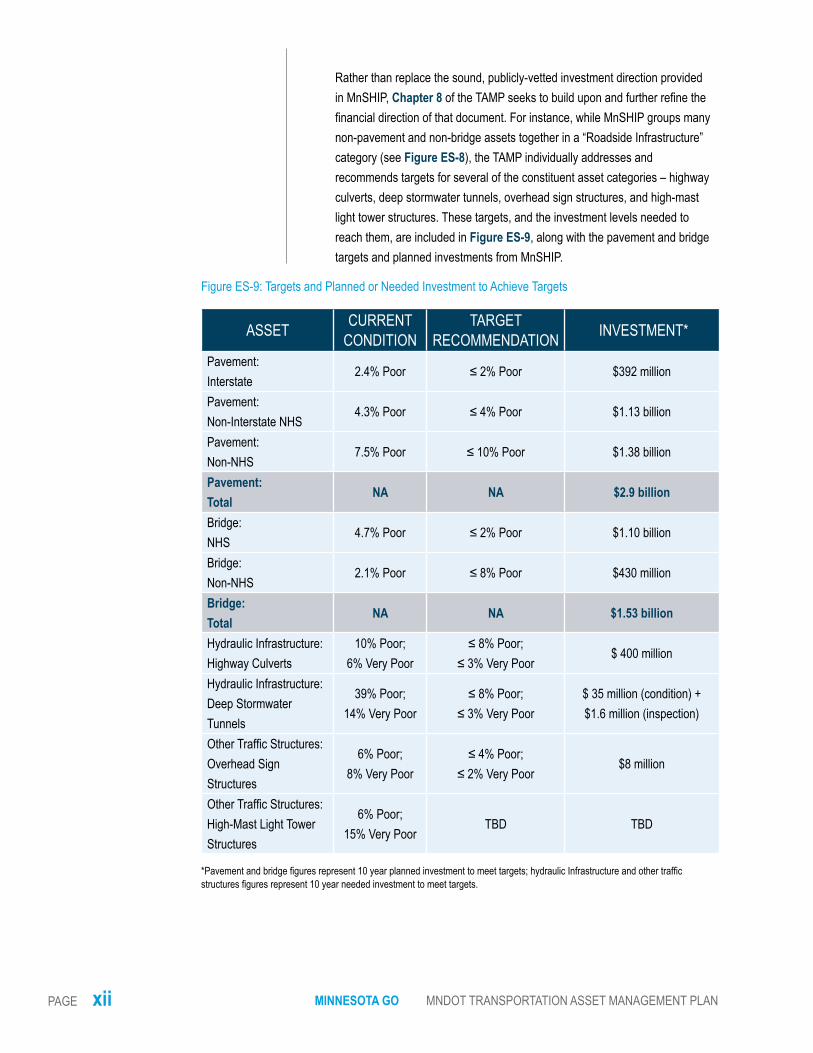
Figure ES-9: Targets and Planned or Needed Investment to Achieve Targets
ASSET CURRENT CONDITION
TARGETRECOMMENDATION INVESTMENT*
Pavement:Interstate
2.4% Poor ≤ 2% Poor $392 million
Pavement: Non-Interstate NHS
4.3% Poor ≤ 4% Poor $1.13 billion
Pavement:Non-NHS
7.5% Poor ≤ 10% Poor $1.38 billion
Pavement:Total
NA NA $2.9 billion
Bridge:NHS
4.7% Poor ≤ 2% Poor $1.10 billion
Bridge: Non-NHS
2.1% Poor ≤ 8% Poor $430 million
Bridge: Total
NA NA $1.53 billion
Hydraulic Infrastructure: Highway Culverts
10% Poor;6% Very Poor
≤ 8% Poor;≤ 3% Very Poor
$ 400 million
Hydraulic Infrastructure: Deep Stormwater Tunnels
39% Poor;14% Very Poor
≤ 8% Poor;≤ 3% Very Poor
$ 35 million (condition) + $1.6 million (inspection)
Other Traffic Structures: Overhead Sign Structures
6% Poor;8% Very Poor
≤ 4% Poor;≤ 2% Very Poor
$8 million
Other Traffic Structures: High-Mast Light Tower Structures
6% Poor;15% Very Poor
TBD TBD
*Pavement and bridge figures represent 10 year planned investment to meet targets; hydraulic Infrastructure and other traffic structures figures represent 10 year needed investment to meet targets.
Rather than replace the sound, publicly-vetted investment direction provided in MnSHIP, Chapter 8 of the TAMP seeks to build upon and further refine the financial direction of that document. For instance, while MnSHIP groups many non-pavement and non-bridge assets together in a “Roadside Infrastructure” category (see Figure ES-8), the TAMP individually addresses and recommends targets for several of the constituent asset categories – highway culverts, deep stormwater tunnels, overhead sign structures, and high-mast light tower structures. These targets, and the investment levels needed to reach them, are included in Figure ES-9, along with the pavement and bridge targets and planned investments from MnSHIP.

EXECUTIVE SUMMARY PAGE xiii
Implementation and Future Developments
While meeting federal requirements is an important objective, MnDOT’s primary reason for developing this TAMP is to improve the management of Minnesota’s transportation assets, with special focus on risk and life-cycle costs. Success will be largely determined by the extent to which the principles and initiatives outlined in this document are incorporated, along with existing plans, into MnDOT’s business practices.
To support this, MnDOT has established an Asset Management (governance) Steering Committee that is responsible for developing, updating, and monitoring the enhancements described in Chapter 9 of the TAMP as well as other asset management planning initiatives. As a result of the TAMP process and other parallel asset management initiatives, several enhancements are currently underway. This includes collection of better maintenance data to improve life-cycle costs for assets included in this TAMP, initiation of a Transportation Asset Management System, programming of funds for rehabilitation of the I-35 south deep stormwater tunnel, and development of an Overhead Sign Structure inspection policy.

MINNESOTA GO MNDOT TRANSPORTATION ASSET MANAGEMENT PLANPAGE xiv
This page intentionally left blank.


