40
MNI India Business Report December 2015 Insight and data for better decisions

MNI India Business Report December 2015
Insight and data for better decisions

MNI India Business Report - December 20152
Written and researched byPhilip Uglow, Chief EconomistShaily Mittal, EconomistNelson Aston, EconomistGeorge Brown, Economist
Release TimeEmbargoed until 9:45 a.m. Mumbai timeDecember 22, 2015
MNI Indicators | Deutsche Börse Group Westferry House11 Westferry CircusLondon E14 4HETel: +44 (0)20 7862 7400Email: [email protected]
www.mni-indicators.com@MNIIndicators MNI Indicators
MNI India Business ReportMethodology
MNI India Business Sentiment is a monthly poll of Indian business executives at companies listed on the BSE (formerly known as the Bombay Stock Exchange) which has been available since November 2012. More than 400 companies are surveyed each month and are a mix of manufacturing, service, construction and agricultural firms.
The survey provides the first monthly snapshot of economic and business conditions, ahead of official data and other business confidence data in India.
Respondents are asked their opinion on whether a particular business activity has increased, decreased or remained the same compared with the previous month as well as their expectations for three months ahead, e.g. Is Production Higher/Same/Lower compared with a month ago?
A diffusion indicator is then calculated by adding the percentage share of positive responses to half the percentage of those respondents reporting no change. An indicator reading above 50 shows expansion, below 50 indicates contraction and a result of 50 means no change.
The survey looks at key business metrics including orders, production, pricing, inventories, credit availability and exchange rate impact. Sentiment on both current and future expectations allows users to comprehensively monitor business and economic trends.
Whether you are forecasting the Indian economy, analysing where to invest in India or want to know how other companies in your sector are performing, our monthly intelligence offers an unrivalled insight into exactly what India's largest companies are thinking.
Copyright © 2015 MNI Indicators | Deutsche Börse Group. Reproduction or retransmission in whole or in part is prohibited except by permission. All rights reserved.

MNI India Business Report - December 2015 3
MNI India Business Report - December 2015Contents
4 Executive Summary
8 Economic Landscape
16 Correlation Charts
19 Indicators
20 MNI India Business Indicator
22 Orders
24 Output and Employment
26 Prices
28 Money and Credit
30 Logistics
32 What the Panel Said
34 Data Tables

Spitzzeile Titel4
The MNI India Business Sentiment Indicator, a gauge of current sentiment among BSE-listed companies, fell slightly to 60.7 in December from 60.9 in November.
Executive Summary
MNI India Business Report - December 2015 5
Indian business sentiment eased for the second consecutive month in December as orders weakened and disinflationary pressures intensified.
The MNI India Business Sentiment Indicator, a gauge of current sentiment among BSE-listed companies, fell slightly to 60.7 in December from 60.9 in November. The fall in sentiment was observed across both manufacturing and service companies, while sentiment among construction sector companies rose, offsetting the previous month’s sharp fall.
Confidence has gradually declined throughout this year, with the Business Sentiment Indicator averaging 61.3 in the three months to December, the weakest period in 2015 and the lowest outturn since Q4 2013.
Confidence has increased only four times this year, each time following a rate cut by the RBI. Although monetary easing has provided a short-term boost to business confidence, it has failed to provide a sustained increase. And while the last time sentiment rose was in October following the late September rate cut, the increase was only small with respondents more concerned about the general malaise in the economy and subdued demand.
Weak domestic demand continues to bear down on business confidence. Production and New Orders were down 9.7% and 8.6% on the year respectively in December, with the latter now 12.5% below last year’s average. More positively, there was an increase in foreign demand for India’s goods and services for the second consecutive month with the Export Orders Indicator rising 6.1% in December.
Companies faced lower costs for raw materials and other inputs owing to the fall in crude oil and other commodity prices. Some companies reported that they had passed on these cost savings to their customers, while several reported that they had cut their prices even more sharply owing to high competition and low demand. This may well explain the fall in the Financial Position Indicator to the lowest since October 2013.
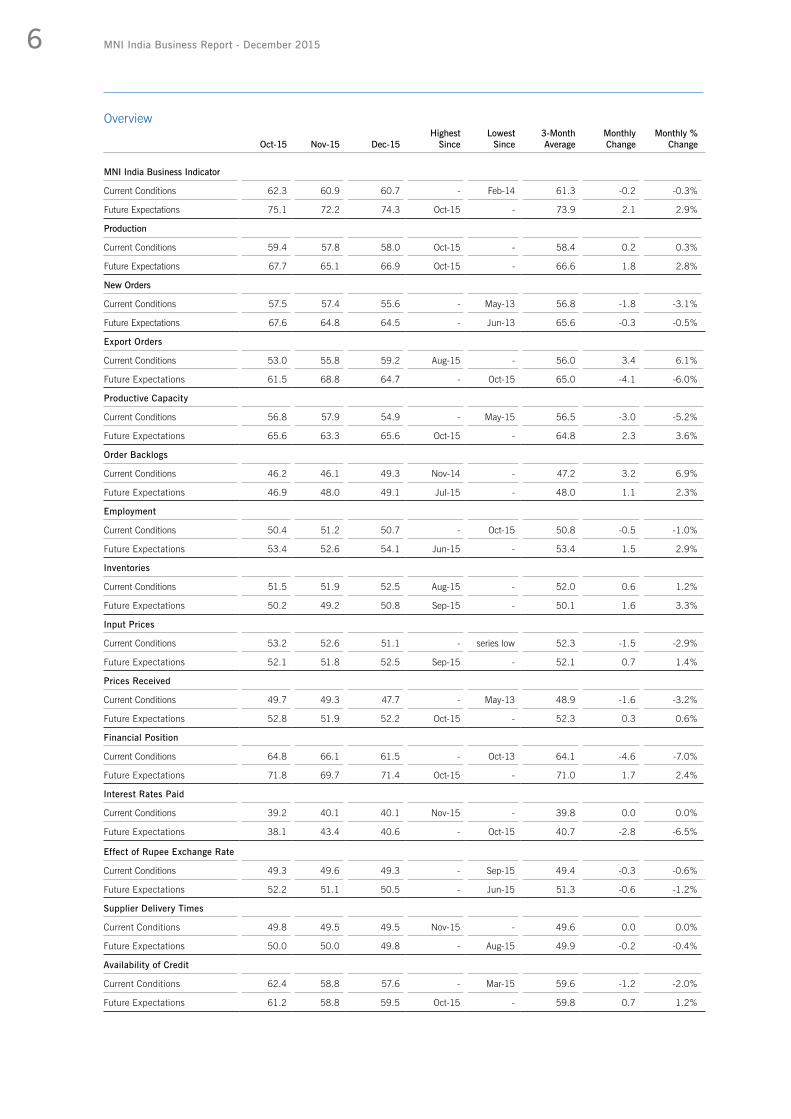
In December, nine out of the 15 current conditions indicators included in the survey fell and five were below the 50 level that separates expansion from contraction. 10 future expectations indicators rose and three were in contraction.
MNI India Business Report - December 20156
Overview
Oct-15 Nov-15 Dec-15Highest
SinceLowest
Since3-Month Average
Monthly Change
Monthly % Change
MNI India Business Indicator
Current Conditions 62.3 60.9 60.7 - Feb-14 61.3 -0.2 -0.3%
Future Expectations 75.1 72.2 74.3 Oct-15 - 73.9 2.1 2.9%
Production
Current Conditions 59.4 57.8 58.0 Oct-15 - 58.4 0.2 0.3%
Future Expectations 67.7 65.1 66.9 Oct-15 - 66.6 1.8 2.8%
New Orders
Current Conditions 57.5 57.4 55.6 - May-13 56.8 -1.8 -3.1%
Future Expectations 67.6 64.8 64.5 - Jun-13 65.6 -0.3 -0.5%
Export Orders
Current Conditions 53.0 55.8 59.2 Aug-15 - 56.0 3.4 6.1%
Future Expectations 61.5 68.8 64.7 - Oct-15 65.0 -4.1 -6.0%
Productive Capacity
Current Conditions 56.8 57.9 54.9 - May-15 56.5 -3.0 -5.2%
Future Expectations 65.6 63.3 65.6 Oct-15 - 64.8 2.3 3.6%
Order Backlogs
Current Conditions 46.2 46.1 49.3 Nov-14 - 47.2 3.2 6.9%
Future Expectations 46.9 48.0 49.1 Jul-15 - 48.0 1.1 2.3%
Employment
Current Conditions 50.4 51.2 50.7 - Oct-15 50.8 -0.5 -1.0%
Future Expectations 53.4 52.6 54.1 Jun-15 - 53.4 1.5 2.9%
Inventories
Current Conditions 51.5 51.9 52.5 Aug-15 - 52.0 0.6 1.2%
Future Expectations 50.2 49.2 50.8 Sep-15 - 50.1 1.6 3.3%
Input Prices
Current Conditions 53.2 52.6 51.1 - series low 52.3 -1.5 -2.9%
Future Expectations 52.1 51.8 52.5 Sep-15 - 52.1 0.7 1.4%
Prices Received
Current Conditions 49.7 49.3 47.7 - May-13 48.9 -1.6 -3.2%
Future Expectations 52.8 51.9 52.2 Oct-15 - 52.3 0.3 0.6%
Financial Position
Current Conditions 64.8 66.1 61.5 - Oct-13 64.1 -4.6 -7.0%
Future Expectations 71.8 69.7 71.4 Oct-15 - 71.0 1.7 2.4%
Interest Rates Paid
Current Conditions 39.2 40.1 40.1 Nov-15 - 39.8 0.0 0.0%
Future Expectations 38.1 43.4 40.6 - Oct-15 40.7 -2.8 -6.5%
Effect of Rupee Exchange Rate
Current Conditions 49.3 49.6 49.3 - Sep-15 49.4 -0.3 -0.6%
Future Expectations 52.2 51.1 50.5 - Jun-15 51.3 -0.6 -1.2%
Supplier Delivery Times
Current Conditions 49.8 49.5 49.5 Nov-15 - 49.6 0.0 0.0%
Future Expectations 50.0 50.0 49.8 - Aug-15 49.9 -0.2 -0.4%
Availability of Credit
Current Conditions 62.4 58.8 57.6 - Mar-15 59.6 -1.2 -2.0%
Future Expectations 61.2 58.8 59.5 Oct-15 - 59.8 0.7 1.2%

w
India's economic growth rose to 7.4% on the year in the July-September quarter......from 7% in the previous quarter, although down from the 8.4% growth recorded in the July-September quarter last year.

Spitzzeile Titel8
Growth picked up pace in the first half of the year, on the back of higher investment and government spending, while private consumption growth moderated.
Economic Landscape

MNI India Business Report - December 2015 9
Latest economic data has been mixed. Growth picked up pace in the first half of the year, on the back of higher investment and government spending, while private consumption growth moderated. The economy grew by 7.4% in the second quarter of the fiscal year, higher than the 7% recorded in the previous quarter. Net exports continued to provide a drag on growth, although the decline in both exports and imports slowed. Industrial production growth jumped to 9.8% in October from 3.8% in September although this was due to base effects, with underlying growth far weaker, although on a rising trend. Looking ahead, moderate inflation and easier monetary conditions should help to support growth in 2016.
At the December monetary policy meeting, the repo rate was left unchanged at 6.75% as expected. The RBI softened slightly its position on the inflation outlook although noted that the recent uptick in core inflation warranted vigilance. It also left the door open to further rate cuts noting that it would “use space when available” to cut rates so long as inflation was on track to hit 5% by March 2017. In November, consumer price inflation climbed to 5.41%, the highest since September 2014 on the back of rising food prices. The rise in inflation was expected with base effects turning unfavourable since September, something which will continue in December.
Growth in GDP accelerates in Q2Latest GDP data showed that India’s economy grew by 7.4% on the year in the July-September quarter, up from 7% in the previous quarter, although lower than the 8.4% growth recorded in the July-September quarter last year. Growth has picked up pace in the first half of FY16, on the back of green shoots in manufacturing, investment spending and support from government spending.
Growth of GVA at basic prices improved for the second consecutive quarter to 7.4% on the year in Q2FY16 from 7.1% in Q1 and 6.1% in Q4FY15. The improvement in GVA growth was primarily led by an uptick in industrial expansion to 6.8% in Q2 from 6.5% in Q1. The data indicates an unexpected pickup in growth of agriculture, forestry & fishing to 2.2% in Q2 from 1.9% in Q1, allaying concerns regarding the extent of the impact of the unfavourable monsoon on agricultural output. However, growth of the services sector eased mildly to
8.8% in Q2 from 8.9% in the previous quarter. This was due to lower growth in trade, hotels, transport, communication and services related to broadcasting. That said, service sector performance remained buoyant in Q2 with financial, real estate and professional services growing at 9.7% and public administration, defence and other services rising by 4.7% versus 2.7% in Q1.
On an expenditure basis, GDP growth in the July-September quarter was led by a 6.8% year-on-year increase in both private final consumption expenditure (PFCE) and gross fixed capital formation (GFCF). Growth of PFCE has slipped from 7.4% in Q1, with an unfavourable monsoon and the expectation of subdued rural incomes dampening sentiments and weighing upon rural consumption growth. Personal consumption added 3.8 percentage points to growth, having contributed 4.3 percentage points in the previous quarter and 4 percentage points in the same quarter a year ago. Boosted by robust growth in government capital spending, the growth of GFCF improved to a five-quarter high from 4.9% in Q1, contributing 2.1 percentage points, up from 1.5 percentage points in the previous quarter and 1.2 percentage points in the same quarter a year ago. Net exports continued to be a drag on growth, however the pace of contraction of both imports and exports eased in Q2 (-2.8% and -4.7%, respectively)
-10%
-5%
0%
5%
10%
15%
Q22013-14
Q42013-14
Q22014-15
Q42014-15
Q22015-16
Contribution to GDP Growth
Source: Central Statistics Office
PFCE
GFCE
GFCF
Change in Stocks
Net Exports
Discrepencies
Valuables
GDP Y/Y %, FY
MNI India Business Report - December 201510
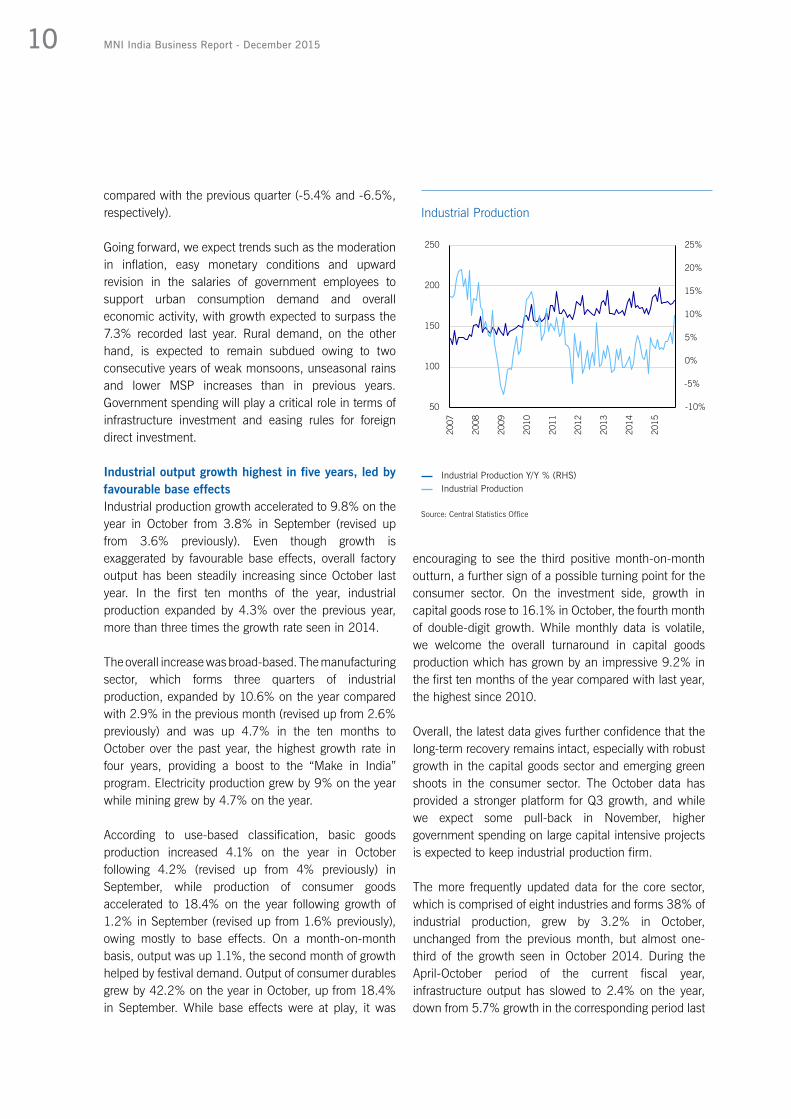
encouraging to see the third positive month-on-month outturn, a further sign of a possible turning point for the consumer sector. On the investment side, growth in capital goods rose to 16.1% in October, the fourth month of double-digit growth. While monthly data is volatile, we welcome the overall turnaround in capital goods production which has grown by an impressive 9.2% in the first ten months of the year compared with last year, the highest since 2010.
Overall, the latest data gives further confidence that the long-term recovery remains intact, especially with robust growth in the capital goods sector and emerging green shoots in the consumer sector. The October data has provided a stronger platform for Q3 growth, and while we expect some pull-back in November, higher government spending on large capital intensive projects is expected to keep industrial production firm.
The more frequently updated data for the core sector, which is comprised of eight industries and forms 38% of industrial production, grew by 3.2% in October, unchanged from the previous month, but almost one-third of the growth seen in October 2014. During the April-October period of the current fiscal year, infrastructure output has slowed to 2.4% on the year, down from 5.7% growth in the corresponding period last
compared with the previous quarter (-5.4% and -6.5%, respectively).
Going forward, we expect trends such as the moderation in inflation, easy monetary conditions and upward revision in the salaries of government employees to support urban consumption demand and overall economic activity, with growth expected to surpass the 7.3% recorded last year. Rural demand, on the other hand, is expected to remain subdued owing to two consecutive years of weak monsoons, unseasonal rains and lower MSP increases than in previous years. Government spending will play a critical role in terms of infrastructure investment and easing rules for foreign direct investment.
Industrial output growth highest in five years, led by favourable base effectsIndustrial production growth accelerated to 9.8% on the year in October from 3.8% in September (revised up from 3.6% previously). Even though growth is exaggerated by favourable base effects, overall factory output has been steadily increasing since October last year. In the first ten months of the year, industrial production expanded by 4.3% over the previous year, more than three times the growth rate seen in 2014. The overall increase was broad-based. The manufacturing sector, which forms three quarters of industrial production, expanded by 10.6% on the year compared with 2.9% in the previous month (revised up from 2.6% previously) and was up 4.7% in the ten months to October over the past year, the highest growth rate in four years, providing a boost to the “Make in India” program. Electricity production grew by 9% on the year while mining grew by 4.7% on the year.
According to use-based classification, basic goods production increased 4.1% on the year in October following 4.2% (revised up from 4% previously) in September, while production of consumer goods accelerated to 18.4% on the year following growth of 1.2% in September (revised up from 1.6% previously), owing mostly to base effects. On a month-on-month basis, output was up 1.1%, the second month of growth helped by festival demand. Output of consumer durables grew by 42.2% on the year in October, up from 18.4% in September. While base effects were at play, it was
-10%
-5%
0%
5%
10%
15%
20%
25%
50
100
150
200
250
2007
2008
2009
2010
2011
2012
2013
2014
2015
Industrial Production Y/Y % (RHS)Industrial Production
Source: Central Statistics Office
Industrial Production

MNI India Business Report - December 2015 11
year. This month again, production of fertiliser was the front-runner, growing by 16.2% on the year, although slower than in the previous month. More positively, cement production grew by 11.7% on the year and coal production by 6.3% providing early signs of recovery in the construction sector.
RBI Consumer Confidence fell in SeptemberThe RBI’s Consumer Confidence survey showed that the Current Situation Index (CSI), an assessment of consumer sentiment, fell in the quarter ending September to 102.9 from 107.7 in the quarter ending June. This was the second consecutive decline in confidence pushing the index to the lowest level since June last year. Current economic conditions compared with one year ago plummeted, wiping out the gains of the previous two quarters. Positive perceptions of future economic conditions also fell to the lowest since March 2014.
Respondents were increasingly worried about employment conditions with the proportion of respondents whose employment conditions worsened compared with a year ago outnumbering those who showed an improved situation. Fewer respondents expected an improvement in the employment situation one year ahead as well. Sentiment towards current income fell to the lowest level in the survey’s history and fewer respondents expected it to improve one year ahead.
Respondents’ expectations about future economic conditions also declined as the Future Expectations Index, which measures the year-ahead outlook, fell to 119.2 in September from 124.2 in June.
More up-to-date monthly data from the MNI India Consumer Sentiment Survey has shown confidence falling to a record low level among households. The MNI India Consumer Sentiment Indicator fell to 113.7 in November from 114.1 in October. Consumers reported that they were less confident about their future household finances than ever before and had lower expectations for business conditions both in the short-and long-term.
RBI Industrial Outlook remains stable in DecemberThe RBI’s Industrial Outlook Survey showed that the Business Expectation Index (BEI), a gauge of manufacturing business sentiment, remained broadly stable at 113.4 in the quarter ending December compared with 113.1 in the quarter ending September and was below the outturn of 117.7 recorded in the December quarter a year earlier. Companies expected fewer export and import orders, with nearly stable order books and production. There was also reduced pessimism towards the cost of finance and the cost of raw materials.
Manufacturing companies witnessed a decline in demand during the July-September quarter, with sentiment easing to 102.4 from 104.8 in the previous quarter. The decline in sentiment for the assessment quarter was mainly due to lower optimism in production, order books, exports, capacity utilisation, employment, financial situation and availability of finance, coupled with increased pessimism in selling prices and profit margin.
More up-to-date monthly data from the MNI India Business Sentiment Survey shows that business confidence has eased this year. In the quarter ending December, the MNI India Business Sentiment Indicator fell to the lowest since quarter ending December 2013,
80
90
100
110
120
130
Q12012
Q42012
Q32013
Q22013
Q12014
Q42014
Q32015
RBI Business and Consumer Sentiment
Industrial Outlook: Business Expectation Index, fiscal yearConsumer Confidence: Current Situation Index, fiscal year
Source: Reserve Bank of India

MNI India Business Report - December 201512
The previously targeted measure of inflation, based on the Wholesale Price Index, contracted for the 13th consecutive month in November, falling an annual 2% from a 3.8% decline in October. The slightly slower fall came on the back of an increase in prices for food and power. Food inflation was up 5.2% on the year, the highest in seven months and was also 2.3% up on the month. Fuel and power prices, though down on the year, rose for the second consecutive months. Manufacturing pricing power continued to remain weak, with prices down for the ninth consecutive month on the year.
Repo rate unchanged at 6.75% in December The Reserve Bank of India kept the policy repo rate unchanged at 6.75% in December, in line with expectations after a 50 basis point cut at the previous meeting in September.
The RBI noted that CPI inflation is expected to broadly follow the path indicated in the September 2015 policy review but softened its view slightly by noting that the risks were now skewed slightly to the downside. Against this, it warned that the recent pick-up in core inflation warranted vigilance. Once again, the RBI highlighted the need for supply side reforms with astute food management by both the central and state governments
averaging 61.3. In December, business sentiment fell to 60.7, the lowest since February 2014. Companies were more optimistic about the next three months with the Expectations Indicator rising to 60.7 in December as companies were more bullish about Production, Employment and their Financial Position over the coming quarter.
Retail Inflation Highest Since September 2014Consumer price inflation rose to 5.41% in November from 5% in October, the highest since September 2014.
Food price inflation, which makes up 47.25% of the CPI basket, increased to 6.07% in November from 5.25% in October, the highest in eight months. While prices of vegetables were up 4%, prices of pulses accelerated at a bumper rate of 46.1%, although both eased on a month-on-month basis. The government has resorted to imports for managing the supply of pulses, which should help ease pressure in the coming months and has increased the minimum support price (MSP) for rabi pulses-gram and masoor by Rs.250 per quintal each. The higher MSPs are expected to lead to increased investment and production through assured remunerative prices to farmers – although this is necessarily a long-term goal. Fuel inflation stood unchanged at 5.3% on the year, for the third consecutive month. On a three month on three month basis, it picked up slightly to 0.3%, and with global commodity prices declining further, we expect fuel price inflation to remain muted. After stripping out the more volatile components (food and beverages and fuel and light), core inflation rose to 4.59% in November from 4.39% in October.
Rural CPI inflation quickened to 5.9% in November from 5.5% in October, led by a pick-up in food inflation to 5.8% from 5.2% in October. Urban CPI inflation also rose to 4.7% from 4.3% in October, with food inflation accelerating to 6.5% from 5.5% in October.
The RBI sees inflation remaining capped on the assumption of moderate increases in minimum support prices and subdued international food and crude prices, although without favourable base effects, we have already witnessed a quick pick-up, especially in services inflation.
Source: Reserve Bank of India
Consumer Price Inflation
0%
2%
4%
6%
8%
10%
12%
Jan-
14
Mar
-14
May
-14
Jul-1
4
Sep-
14
Nov
-14
Jan-
15
Mar
-15
May
-15
Jul-1
5
Sep-
15
Nov
-15
Consumer Price Index: Food Y/Y %
Source: Central Statistics Office
Consumer Price Index Y/Y %Core Consumer Price Index Y/Y %

MNI India Business Report - December 2015 13
necessary to minimize shortfalls in food production due to monsoon vagaries.
On growth the RBI’s projection for output growth for 2015-16 remained unchanged at 7.4%, with mild risks to downside. This follows the downward revision from the 7.6% stated in the September policy statement. The outlook for manufacturing and service sector output was robust, while agricultural output was expected to be weak. The RBI was hopeful that a rise in government expenditure and the easing in the monetary policy would help revive private investment demand.
The RBI once again lamented the fact that lending rates have fallen by far less than the repo rate. In order to improve the transmission mechanism it noted that the government was looking as linking small savings interest rates to market rates. On December 17, the RBI announced new rules for calculating base rate to come into effect from 1 April 2016. Under the new rules, banks must set their lending rates under the marginal cost of funding every month, which is based on the cost of new deposits instead of the current system of the average rate of outstanding deposits, to allow quicker transmission of monetary policy.
While the RBI is clearly watching the impact on inflation from commodity prices as well as the implementation of the Pay Commission proposals it still appears to remain on an easing bias. The RBI emphasised that it would “use the space for accommodation, when available, while keeping the economy anchored to the projected disinflation path that should take inflation down to 5% by March 2017.
Exports decline for the twelfth month in a rowIndia’s trade deficit remained broadly stable in November at $9.78 billion compared with $9.77 billion in October and was almost 40% below the $16.2 billion shortfall recorded in November last year as both exports and imports fell significantly.
Exports contracted 24.4% on the year, the 12th consecutive fall, to $20 billion in November. Looking at the three-month year-on-year measure for exports, the slowdown in exports has become more pronounced. Imports declined 30.3% on the year to $29.8 billion in November owing mostly to a decline in oil imports which
dropped 45% on the year to $6.5 billion. Gold imports also fell 36.5% on the year to $3.53 billion. Disappointingly, non-oil, non-gold imports, which reflect domestic demand, fell by a hefty 27% in November.
As per the provisional aggregate monthly data on India’s international trade in services released by the RBI, receipts from India’s service exports remained broadly stable at $13.34 billion compared with $13.32 billion in September. Payments for India’s service imports fell 6% on the month to $7 billion in October, the lowest level of services payments recorded in the past five months.
Overall, the trade data suggests weakness in both external and domestic demand. While export weakness has been ongoing for some time, softness in non-oil imports is disappointing. Prime Minister Narendra Modi has been pitching India as a global manufacturing destination with the “Make in India” initiative, but demand for goods made in India has been falling. India aims to increase exports of goods and services to $900 billion by 2020 and raise the country’s share in world exports to 3.5% from 2% now. A lack of competitiveness and weak demand, though, makes this an exceedingly ambitious target.
Government raises planned expenditure The fiscal deficit in the first seven months of 2015-16, was Rs. 4.11 trillion or 47% of the estimated budget of
Source: Ministry of Commerce and Industry
Trade Balance
-600
-400
-200
0
200
400
Jan-
13
Apr-
13
Jul-1
3
Oct
-13
Jan-
14
Apr-
14
Jul-1
4
Oct
-14
Jan-
15
Apr-
15
Jul-1
5
Oct
-15
Trade Balance (Billion US $)Exports (Billion US $)Imports (Billion US $)

MNI India Business Report - December 201514
12.36% earlier, making services like eating out, travelling, phone calls etc more expensive for the end user.
Growth in car sales for the 13th month in a rowCar sales in India rose by 10.4% on the year in November, down from 21.8% in October, helped by new model launches and festival discounts. Unlike 2014, when all festivals were bunched in October, the main Hindu festivals starting with Navratra in October, followed by Dussehra and Diwali in November were spread over two months this year and hence we saw robust sales. Car manufacturers also left no stone unturned this festival season and offered steep discounts to attract customers including gold coins, cash-back offers, free accessories, gift cheques and free insurance.
On a month-on-month basis, sales fell by 10.8%, following three months of growth. Car sales have grown by 9.3% on the year in the first 11 months of 2015, a hefty improvement from growth of 1.7% and contraction of 10.3% in the same period of 2014 and 2013.
Sales of commercial vehicles grew by 8.6% on the year in November, slower from 12.7% seen in the previous month. On a month-on-month basis, sales contracted
Rs. 5.6 trillion for the whole financial year. This is lower than the deficit of 89.6% during the same period a year ago.
The total expenditure of the government in the first seven months was Rs. 10.2 trillion or 57.5% of the entire year estimate, higher than last year’s expenditure of 53.6%. Of the total outflows in the seven months, planned expenditure was 58.2% of the budget estimate given the government’s emphasis on infrastructure development. Planned spending was around 46.4% of the budget estimate during the last fiscal year. Total spending, which is set at Rs 17.7 trillion for the entire year, is expected to go up after the government received Parliament’s approval in July to spend more on recapitalisation of public sector banks and expected hike in the central government employees’ salaries in accordance to recommendations of the Pay Commission. The government, however, has managed to keep non-plan spending in check. Non-Plan expenditure in April-October 2015 stood almost at the same levels as last financial year at 57.2% of the budget estimate. Total receipts were Rs. 6.1 trillion, 50% of the estimate.
For 2015-16, the government aims to contain the fiscal deficit at 3.9% of GDP and is targeting 3% a year later than earlier announced, unlocking funds for investment into infrastructure development and social welfare programmes. The government had budgeted raising Rs.695 billion through disinvestment in the current fiscal year. Of this, Rs.410 billion was to come from a minority stake sale in public sector undertakings and another Rs.285 billion from the sale of strategic stakes. So far, the government has been able to sell stakes in just four companies—Power Finance Corp. Ltd, Rural Electrification Corp. Ltd, Dredging Corp. of India Ltd and Indian Oil Corp. Ltd, worth Rs.126 billion, which makes the achievement of disinvestment target challenging.
The government recently announced the levy of a 0.5% Swachh Bharat Cess on all taxable services for funding of the cleanliness drive, a pet project of Prime Minister Narendra Modi. This levy was proposed in the Budget early in the year but no date was determined then. This has led to a further increase in the service tax rate from 14% to 14.5% and is expected to yield around Rs.100 billion each fiscal. In June, the government had increased the service tax rate to 14% (inclusive of all cess) from
Car Sales
-30%
-20%
-10%
0%
10%
20%
30%
Jan-
13
May
-13
Sep-
13
Jan-
14
May
-14
Sep-
14
Jan-
15
May
-15
Sep-
15
Domestic Car Sales Growth Y/Y %
Source: Society of Indian Automobile Manufacturers

MNI India Business Report - December 2015 15
Key Monthly Economic Data
Jun-15 Jul-15 Aug-15 Sep-15 Oct-15 Nov-15 Dec-15
Consumer Price Index (Y/Y %) 5.4 3.7 3.7 4.4 5.0 5.4 -
Wholesale Price Index (Y/Y %) -2.1 -4.0 -5.1 -4.6 -3.8 -2.0 -
Industrial Production (Y/Y %) 4.2 4.3 6.3 3.8 9.8 - -
Car Sales (Y/Y %) 1.5 17.5 6.1 9.5 21.8 10.4 -
Trade Balance (Billion US $) -10.5 -12.7 -12.4 -10.5 -9.8 -9.8 -
Exports (Billion US $) 22.5 23.1 21.3 21.7 21.4 20.0 -
Imports (Billion US $) 33.0 35.8 33.7 32.2 31.1 29.8 -
MNI India Business Sentiment Indicator 67.1 65.3 62.3 61.4 62.3 60.9 60.7
MNI India Consumer Sentiment Indicator 119.5 118.6 119.1 115.3 114.1 113.7 -
by 11.7% and looking at the three month trend, sales slowed from 4.1% in October to contraction in November.
Following double-digit growth in October, sales of two-wheelers eased to 1.5% on the year in November in spite of a favourable base effect and were down 20.3% on the month. Sales of scooters grew by 2.5% on the year following a hefty 36.8% growth in October. Sales of motorcycles, which form the majority of two-wheelers sales, grew by 1.6% on the year, down from 5.7% growth in October. India is the world’s largest market for motorcycles and much of the slowdown comes from smaller cities.
Railway freight traffic contracts in NovemberIn November, freight traffic (millions of tonnes) contracted for the first time in two years by 4.2% on the year and there was also a slowdown in freight traffic on a month-on-month basis. Items related to the construction sector such as cement contracted after growing in the previous month. However, steel movement boosted confidence with double-digit growth in the three month year-on-year measure.
Coal, iron ore and cement account for around 70% of the total freight traffic in railways. A strong pipeline of
infrastructure projects and a steep cut in tariffs on iron ore meant for export is expected to spur the movement of iron ore while a pick-up in infrastructure construction post-monsoon may lead to higher freight loading of cement in the coming months.

MNI India Business Report - December 201516
Correlation ChartsOur Indicators Closely Track Official Data
4%
6%
8%
10%
12%
14%
30
40
50
60
70
80
Feb-
13
May
-13
Aug-
13
Nov
-13
Feb-
14
May
-14
Aug-
14
Nov
-14
Feb-
15
May
-15
Aug-
15
Nov
-15
MNI India Interest Rates PaidTreasury Bills Yield 91 days (RHS)*
Interest Rates
-15%
-5%
5%
15%
25%
35
40
45
50
55
60
65
70
Nov
-12
Mar
-13
Jul-1
3
Nov
-13
Mar
-14
Jul-1
4
Nov
-14
Mar
-15
Jul-1
5
Nov
-15
MNI India New OrdersDomestic Cargo Handled Y/Y% (RHS)*
New Orders
40
45
50
55
60
40
50
60
70
80
Nov
-12
Apr-
13
Sep-
13
Feb-
14
Jul-1
4
Dec
-14
May
-15
Oct
-15
MNI India Business SentimentNikkei India Composite PMI (RHS)*
Business Sentiment and PMI
Source: *Airports Authority of India Source: *Reserve Bank of India
Source: *Datastream
150
200
250
300
350
30
40
50
60
70
80
Mar
-13
Aug-
13
Jan-
14
Jun-
14
Nov
- 14
Apr-
15
Sep-
15
MNI India Export Orders (RHS)Exports (FOB, Billion US $)*
Export Orders
Source: *Ministry of Commerce and Industry

MNI India Business Report - December 2015 17
92
96
100
104
108
45
55
65
75
Q42012
Q22013
Q42013
Q22014
Q42014
Q22015
MNI India Business Sentiment: Current ConditionsAssessment of Overall Business Situation, FY (RHS)*
Business Sentiment (Current Conditions)
Source: *Reserve Bank of India Industrial Outlook Survey
104
108
112
116
120
45
55
65
75
85
Q22013
Q42013
Q22014
Q42014
Q22015
Q42015
MNI India Business Sentiment: Future Expectations Business Expectation Index: Expectation for Next Quarter, FY (RHS)*
Business Sentiment (Future Expectations)
0
20
40
60
80
45
55
65
75
Q12013
Q32013
Q12014
Q32014
Q12015
Q32015
MNI India Input PricesCost of Raw Materials: Assessment for Current Quarter, FY (RHS)*
Input Prices
0
4
8
12
16
20
45
50
55
60
65
Q12013
Q32013
Q12014
Q32014
Q12015
Q32015
MNI India Export OrdersExports: Assessment for Current Quarter, FY (RHS)*
Export Orders
Source: *Reserve Bank of India Industrial Outlook Survey
Source: *Reserve Bank of India Industrial Outlook Survey Source: *Reserve Bank of India Industrial Outlook Survey
Our Indicators Closely Track the RBI'sIndustrial Outlook Survey

w
The fall in sentiment was observed across both manufacturing and service companies......while sentiment among construction sector companies rose, offsetting the previous month’s sharp fall.

Spitzzeile Titel 19
Indian business sentiment eased for the second consecutive month in December as orders weakened and disinflationary pressures intensified.
Indicators
MNI India Business Report - December 201520
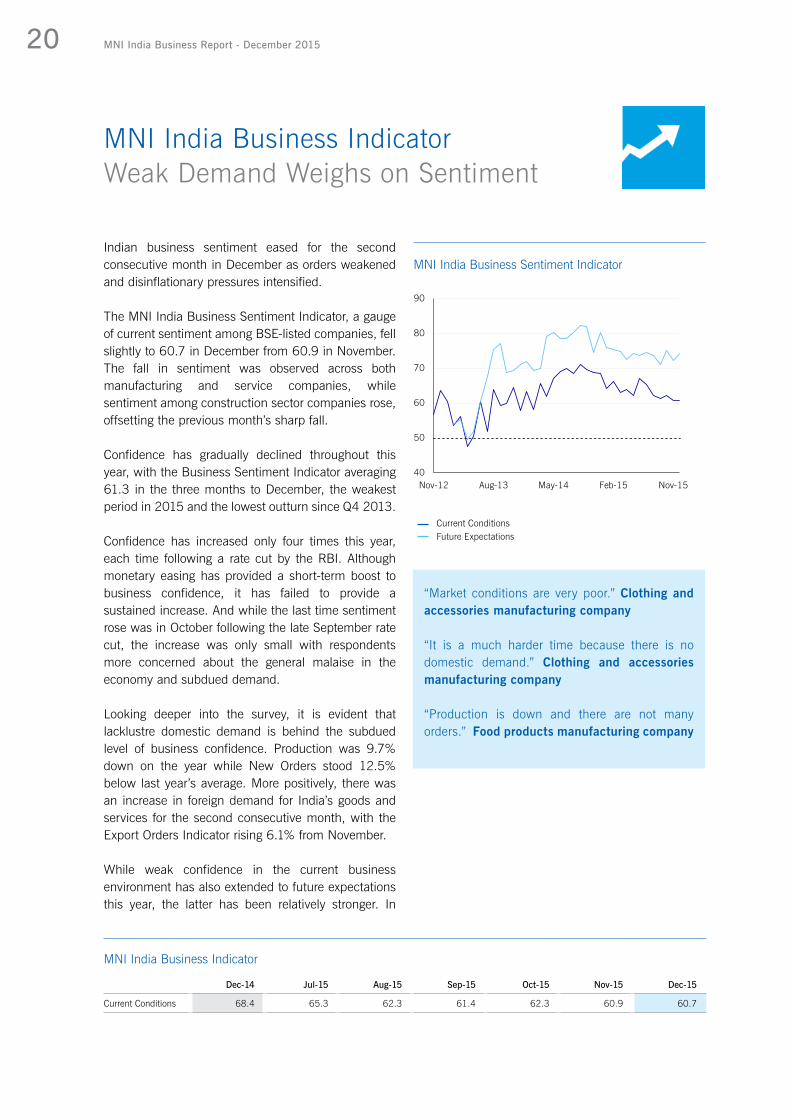
Indian business sentiment eased for the second consecutive month in December as orders weakened and disinflationary pressures intensified.
The MNI India Business Sentiment Indicator, a gauge of current sentiment among BSE-listed companies, fell slightly to 60.7 in December from 60.9 in November. The fall in sentiment was observed across both manufacturing and service companies, while sentiment among construction sector companies rose, offsetting the previous month’s sharp fall.
Confidence has gradually declined throughout this year, with the Business Sentiment Indicator averaging 61.3 in the three months to December, the weakest period in 2015 and the lowest outturn since Q4 2013.
Confidence has increased only four times this year, each time following a rate cut by the RBI. Although monetary easing has provided a short-term boost to business confidence, it has failed to provide a sustained increase. And while the last time sentiment rose was in October following the late September rate cut, the increase was only small with respondents more concerned about the general malaise in the economy and subdued demand.
Looking deeper into the survey, it is evident that lacklustre domestic demand is behind the subdued level of business confidence. Production was 9.7% down on the year while New Orders stood 12.5% below last year’s average. More positively, there was an increase in foreign demand for India’s goods and services for the second consecutive month, with the Export Orders Indicator rising 6.1% from November.
While weak confidence in the current business environment has also extended to future expectations this year, the latter has been relatively stronger. In
MNI India Business IndicatorWeak Demand Weighs on Sentiment
MNI India Business Indicator
Dec-14 Jul-15 Aug-15 Sep-15 Oct-15 Nov-15 Dec-15
Current Conditions 68.4 65.3 62.3 61.4 62.3 60.9 60.7
40
50
60
70
80
90
Nov-12 Aug-13 May-14 Feb-15 Nov-15
Current ConditionsFuture Expectations
MNI India Business Sentiment Indicator
“Market conditions are very poor.” Clothing and accessories manufacturing company
“It is a much harder time because there is no domestic demand.” Clothing and accessories manufacturing company
“Production is down and there are not many orders.” Food products manufacturing company

MNI India Business Report - December 2015 21
December, companies were more optimistic about the next three months with the Expectations Indicator increasing to 74.3 from 72.2 in November, 3.3% above the series average. Firms were also more bullish about Production, Employment and their Financial Position over the coming quarter. This could be a (very) tentative sign that the prolonged deterioration in current conditions may be coming to an end.
Companies faced lower prices for raw materials and other inputs thanks to the fall in crude oil and other commodity prices. Some companies reported that they had passed on these cost savings to their customers, while several reported that they had cut their prices even more sharply owing to high competition and weak demand. This may well explain the fall in the Financial Position Indicator to the lowest since October 2013. High debt and low sales have also hurt firms’ balance sheets this year as evidenced by the decline in the indicator to 64.1 in Q4, the lowest level since Q2 2013.
In December, nine out of the 15 current conditions indicators included in the survey fell and five were below the 50 level that separates expansion from contraction. 10 future expectations indicators rose and three were in contraction.
“Poor bookings or demand in this season.” A Hotel Group
“The automobile market is improving.” Auto parts manufacturing company
“Not much growth due to cheap Chinese imports.” Iron and steel manufacturing company
MNI India Business Indicator
Dec-14 Jul-15 Aug-15 Sep-15 Oct-15 Nov-15 Dec-15
Future Expectations 80.2 74.5 73.7 71.1 75.1 72.2 74.3
Sectors - Overall Business Conditions
Manufacturing Services Construction
Current Conditions
i> 50 i> 50 h> 50
Future Expectations
h> 50 i> 50 h> 50

MNI India Business Report - December 201522
Companies continued to face declining demand pressures, as evidenced by the fall in the New Orders Indicator for the sixth consecutive month in December. The only respite came from an improvement in foreign demand, although the rise in export orders was not enough to compensate for the decline in domestic orders.
The New Orders Indicator fell to 55.6 in December from 57.4 in the previous month, the lowest level since May 2013 when the indicator was in the contraction zone. Although the business environment and the economy in general are in a better place than in 2013, there has been a trend decline in demand this year with the festival period proving to be a non-event for businesses even in a low inflation and interest rate backdrop.
Companies don’t expect much improvement in the next three months either, with the Expectations Indicator easing further to 64.5 in December, making it the third consecutive fall.
The New Orders Indicator, which was down 8.6% on the year in December, has a good correlation with the official data on domestic cargo handled at Indian airports which serves as a proxy for demand for goods. Latest data showed that cargo handled rose 3.7% in the three months to October compared with a year earlier. Since domestic cargo handled at airports has consistently grown at an average of 15% over the past year, our data reaffirms that business activity is going through a lull.
Positively, foreign demand for Indian goods and services grew in December for the second consecutive month. The Export Orders Indicator rose by 6.1% to 59.2 in December from 55.8 in November. Some companies cited penetration in different countries while others
Orders Foreign Demand Improves
Orders - Current Conditions
Dec-14 Jul-15 Aug-15 Sep-15 Oct-15 Nov-15 Dec-15
New Orders 60.8 60.9 60.8 59.7 57.5 57.4 55.6
Export Orders 56.8 56.9 59.7 57.1 53.0 55.8 59.2
Order Backlogs 49.0 48.5 49.0 46.9 46.2 46.1 49.3
30
40
50
60
70
80
90
Nov-12 Aug-13 May-14 Feb-15 Nov-15
Current ConditionsFuture Expectations
30
40
50
60
70
80
Jan-13 Aug-13 Mar-14 Oct-14 May-15 Dec-15
Current ConditionsFuture Expectations
New Orders
Export Orders

MNI India Business Report - December 2015 23
Current ConditionsFuture Expectations
20
30
40
50
60
70
Apr-13 Dec-13 Aug-14 Apr-15 Dec-15
Order Backlogs
Orders - Future Expectations
Dec-14 Jul-15 Aug-15 Sep-15 Oct-15 Nov-15 Dec-15
New Orders 72.6 66.7 67.6 68.9 67.6 64.8 64.5
Export Orders 71.6 63.5 65.5 62.2 61.5 68.8 64.7
Order Backlogs 52.8 49.4 46.3 46.6 46.9 48.0 49.1
24.4% on the year, the 12th monthly fall, to $20.1 billion in November.
Companies were less optimistic about export demand over the coming months, with the Expectations Indicator falling 6% to 64.7 from 68.8 in November.
Weak orders have meant that pressure on companies’ order books has been limited this year. In December, however, the situation changed probably due to higher orders from abroad. Order Backlogs rose to 49.3 from 46.1 in November, the highest in more than a year. The last time companies reported expansion in backlogs, represented by an indicator value above 50, was in November 2014. The ability to fulfil orders quickly reflects both subdued demand and excess capacity among firms.
“We have added new varieties to our products.” Iron and steel manufacturing company
“We are getting more enquires for our products from overseas.” Pharmaceuticals manufacturing company
Sectors - Future ExpectationsNew
OrdersExportOrders
OrderBacklogs
Manufacturing i> 50 i> 50 h< 50
Services i> 50 i> 50 i< 50
Construction h> 50 h> 50 h> 50
Sectors - Current ConditionsNew
OrdersExportOrders
OrderBacklogs
Manufacturing i> 50 h> 50 h< 50
Services i> 50 h> 50 i< 50
Construction h> 50 h> 50 h> 50
said global demand conditions have started improving, especially in the Middle-East, one of India’s most significant trade regions.
In spite of two successive increases, the indicator averaged 56.0 in Q4, the lowest level since Q2 2013. This is in line with official data that suggests external demand for Indian goods and services remains very weak. The latest data showed that exports contracted

MNI India Business Report - December 201524
With no improvement in new orders, firms scaled back both their productive capacity and size of their workforce while output growth remained stable. The Production Indicator stood at 58.0 in December compared with 57.8 in November. It has gradually declined over the past year, with the indicator now 8.9% below last year’s average. Sector data indicates that the rate of growth of business activity among service sector companies eased to the lowest since February 2014 and both construction and manufacturing sector companies were more bullish about their production this month after scaling back in November.
Companies were, however, more optimistic about production in the next three months, with the Expectations Indicator rising to 66.9 in December from 65.1 in the previous month.
Since May, more companies have gradually stepped up their capacity in an effort to meet potential higher demand. However with the conclusion of major festivals in November and non-realisation of orders during the festival period, firms have started to scale back their productive capacity in an effort to cut costs. The Productive Capacity Indicator fell to 54.9 in December from 57.9 in November. Nevertheless, companies in general were more optimistic about the next three months, with the Expectations Indicator rising to 65.6 in December from 63.3 in November.
As employees return to work after holidays during the festival period, fewer companies felt the need to add to their workforce. The Employment Indicator fell to 50.7 in December from 51.2 in November,
Output and Employment Expectations Improve
Output and Employment - Current Conditions
Dec-14 Jul-15 Aug-15 Sep-15 Oct-15 Nov-15 Dec-15
Production 64.2 58.1 59.1 59.7 59.4 57.8 58.0
Productive Capacity 57.7 56.7 56.5 58.1 56.8 57.9 54.9
Employment 50.0 50.8 51.1 50.9 50.4 51.2 50.7
30
40
50
60
70
80
Nov-12 Aug-13 May-14 Feb-15 Nov-15
Current ConditionsFuture Expectations
30
40
50
60
70
80
Nov-12 Aug-13 May-14 Feb-15 Nov-15
Current ConditionsFuture Expectations
Production
Productive Capacity

MNI India Business Report - December 2015 25
Current ConditionsFuture Expectations
46
48
50
52
54
56
58
60
Apr-13 Dec-13 Aug-14 Apr-15 Dec-15
Employment
Output and Employment - Future Expectations
Dec-14 Jul-15 Aug-15 Sep-15 Oct-15 Nov-15 Dec-15
Production 75.1 64.5 68.7 66.8 67.7 65.1 66.9
Productive Capacity 67.6 61.8 63.6 67.0 65.6 63.3 65.6
Employment 52.4 51.9 53.4 51.5 53.4 52.6 54.1
with the vast majority of companies indicating no change in employment levels.
In general, companies have been more optimistic towards future hiring than current conditions. The indicator, although a bit lumpy, rose to 54.1 from 52.6 in November. Companies across sectors were more confident about hiring in the next three months, with service sector firms at the forefront.
“We are working with more number of people as per requirement.” Heavy Construction company
“There are very few projects and the expected orders did not happen on time so we have reduced our workforce.” Industrial machinery manufacturing company
“We are flushed with orders till December so have raised production.” Electrical components and equipment manufacturing company
“To introduce more products in the market, we have increased production.” Heavy Construction Company
Sectors - Current Conditions
ProductionProductiveCapacity Employment
Manufacturing h> 50 i> 50 i> 50
Services i> 50 i> 50 i> 50
Construction h> 50 h> 50 h< 50
Sectors - Future Expectations
ProductionProductiveCapacity Employment
Manufacturing h> 50 h> 50 h> 50
Services i> 50 i> 50 h> 50
Construction i> 50 h> 50 h> 50

MNI India Business Report - December 201526
Raw material costs eased for the sixth consecutive month in December, bringing some relief to companies who have been facing subdued demand in a competitive environment.
The Input Prices Indicator eased to 51.1 in December from 52.6 in November, the lowest level in the history of the survey. The decline in global commodity prices once again has resulted in lower input prices for firms, wiping away the pressure seen in the first half of the year. The indicator was 18.2% below the average of last year and 17.7% below the series average.
More companies anticipated that input prices would rise in the coming three months, evidenced by the slight increase in the Future Expectations Indicator to 52.5 in December from 51.8 in November. Still, the Expectations Indicator averaged 52.1 in Q4, the lowest level in the history of the survey. The gradual deceleration in price expectations bodes well for the RBI’s inflation target of 5% in 2017.
While official data shows that retail inflation is on the rise, with CPI increasing to 5.41% on the year in November from 5% in October, it is mostly driven by higher food prices. Fuel inflation, on the other hand has remained muted in recent months. After stripping out the volatile food and fuel measures, core inflation rose to 4.59% in November from 4.39% in October.
As companies benefit from lower oil and other commodity prices in general, they have been charging lower final prices for their goods and services, with the indicator below the 50 mark for five months in a row in December. While a few companies raised their selling prices to increase their margins in October, they have restrained themselves thereafter, citing tough
Prices Input Prices at Record Low
Prices - Current Conditions
Dec-14 Jul-15 Aug-15 Sep-15 Oct-15 Nov-15 Dec-15
Input Prices 51.5 59.2 55.6 54.9 53.2 52.6 51.1
Prices Received 51.3 51.1 49.3 48.3 49.7 49.3 47.7
Exchange Rate 50.8 52.4 51.1 49.0 49.3 49.6 49.3
40
50
60
70
80
90
Apr-13 Dec-13 Aug-14 Apr-15 Dec-15
Current ConditionsFuture Expectations
30
40
50
60
70
80
Nov-12 Aug-13 May-14 Feb-15 Nov-15
Current ConditionsFuture Expectations
Input Prices
Prices Received
MNI India Business Report - December 2015 27
Current ConditionsFuture Expectations
20
30
40
50
60
70
80
90
Nov-12 Aug-13 May-14 Feb-15 Nov-15
Effect of Rupee Exchange Rate
Prices - Future Expectations
Dec-14 Jul-15 Aug-15 Sep-15 Oct-15 Nov-15 Dec-15
Input Prices 51.1 55.7 53.2 56.1 52.1 51.8 52.5
Prices Received 54.4 52.0 50.5 51.1 52.8 51.9 52.2
Exchange Rate 52.8 55.0 51.3 50.5 52.2 51.1 50.5
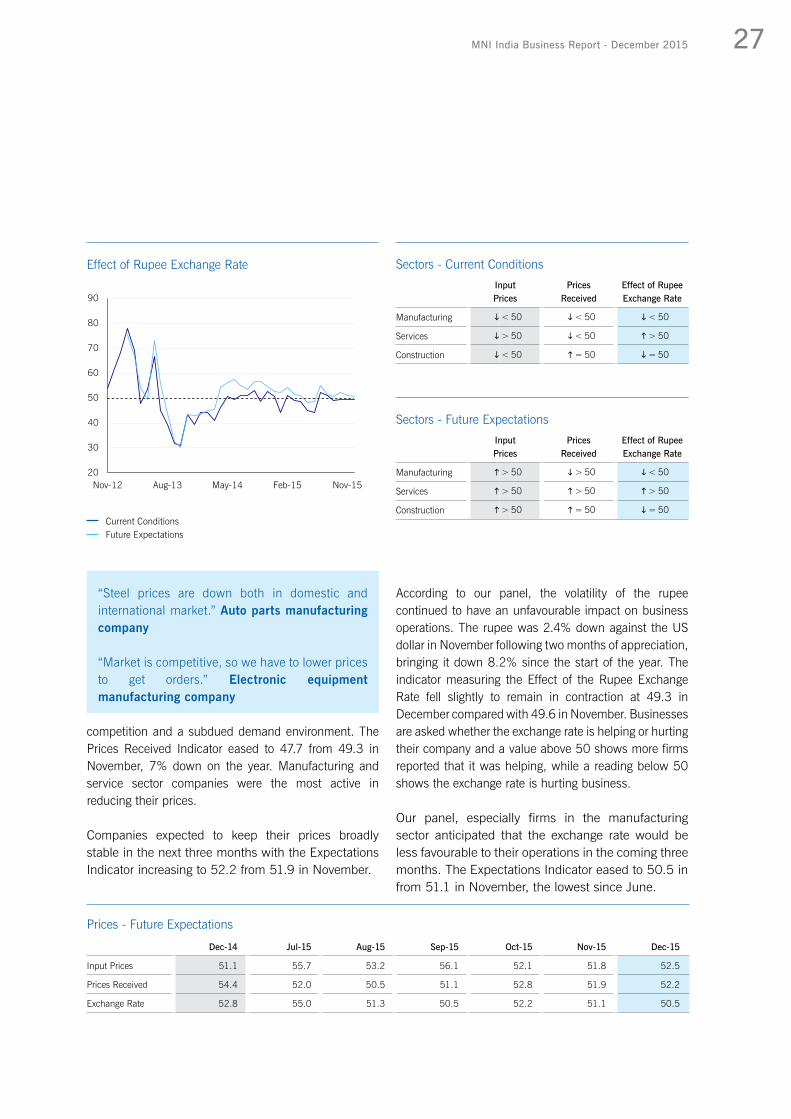
According to our panel, the volatility of the rupee continued to have an unfavourable impact on business operations. The rupee was 2.4% down against the US dollar in November following two months of appreciation, bringing it down 8.2% since the start of the year. The indicator measuring the Effect of the Rupee Exchange Rate fell slightly to remain in contraction at 49.3 in December compared with 49.6 in November. Businesses are asked whether the exchange rate is helping or hurting their company and a value above 50 shows more firms reported that it was helping, while a reading below 50 shows the exchange rate is hurting business.
Our panel, especially firms in the manufacturing sector anticipated that the exchange rate would be less favourable to their operations in the coming three months. The Expectations Indicator eased to 50.5 in from 51.1 in November, the lowest since June.
Sectors - Future ExpectationsInputPrices
PricesReceived
Effect of Rupee Exchange Rate
Manufacturing h> 50 i> 50 i< 50
Services h> 50 h> 50 h> 50
Construction h> 50 h= 50 i= 50
Sectors - Current ConditionsInputPrices
PricesReceived
Effect of Rupee Exchange Rate
Manufacturing i< 50 i< 50 i< 50
Services i> 50 i< 50 h> 50
Construction i< 50 h= 50 i= 50
“Steel prices are down both in domestic and international market.” Auto parts manufacturing company
“Market is competitive, so we have to lower prices to get orders.” Electronic equipment manufacturing company
competition and a subdued demand environment. The Prices Received Indicator eased to 47.7 from 49.3 in November, 7% down on the year. Manufacturing and service sector companies were the most active in reducing their prices.
Companies expected to keep their prices broadly stable in the next three months with the Expectations Indicator increasing to 52.2 from 51.9 in November.

MNI India Business Report - December 201528
More companies, albeit still a small proportion of the panel, reported deterioration in their financial position at the end of the year likely due to reduced orders for their goods and services and weak pricing power.
The Financial Position Indicator fell 7% to 61.5 in December from 66.1 in November. Fewer companies in the manufacturing and services sector reported an improvement in their financial situation, while construction companies were more optimistic following a significant fall in November. Weak confidence resulted in a decline of the Q4 average to 64.1, the lowest level since Q2 2013. In general weak domestic and global demand this year has resulted in a downward trending financial position.
Companies’ expectations for their future finances have followed a trend similar to that of their current financial position but have remained higher in level terms. In December however, the Expectations Indicator rose to 71.4 from 69.7 in the previous month.
Between November and December, the Interest Rates Paid indicator remained unchanged at 40.1. Since the start of the year, the key policy rate has been cut by a total of 125 basis points, and over that period an increasing number of firms on our panel have reported lower interest rate costs. The 17.5% fall in the indicator since the start of the year is testament to better transmission of rate cuts by commercial banks. The indicator averaged 39.8 in the three months to December, the lowest level in the history of the survey.
With the RBI shifting its focus to containing inflation within 5% by 2017, it is expected to keep rates on hold in the short-term. Our panel, however,
Money and Credit Lowest Cost of Debt Service in Q4
Money and Credit - Current Conditions
Dec-14 Jul-15 Aug-15 Sep-15 Oct-15 Nov-15 Dec-15
Availability of Credit 58.1 58.0 58.4 60.3 62.4 58.8 57.6
Interest Rates Paid 51.1 45.5 44.4 44.7 39.2 40.1 40.1
Financial Position 68.3 66.4 65.2 61.7 64.8 66.1 61.5
Current ConditionsFuture Expectations
30
40
50
60
70
80
Jan-13 Aug-13 Mar-14 Oct-14 May-15 Dec-15
40
50
60
70
80
90
Nov-12 Aug-13 May-14 Feb-15 Nov-15
Current ConditionsFuture Expectations
Financial Position
Interest Rates Paid

MNI India Business Report - December 2015 29
30
40
50
60
70
80
Nov-12 Aug-13 May-14 Feb-15 Nov-15
Current ConditionsFuture Expectations
Sectors - Current ConditionsAvailabilityof Credit
Interest Rates Paid
Financial Position
Manufacturing i> 50 h< 50 i> 50
Services i> 50 h< 50 i> 50
Construction h> 50 i< 50 h> 50
Availability of Credit
Money and Credit - Future Expectations
Dec-14 Jul-15 Aug-15 Sep-15 Oct-15 Nov-15 Dec-15
Availability of Credit 61.0 57.6 57.8 59.4 61.2 58.8 59.5
Interest Rates Paid 43.0 40.8 43.8 40.5 38.1 43.4 40.6
Financial Position 76.5 70.9 70.1 71.3 71.8 69.7 71.4
Sectors - Future ExpectationsAvailabilityof Credit
Interest Rates Paid
Financial Position
Manufacturing h> 50 i< 50 h> 50
Services i> 50 i< 50 h> 50
Construction h> 50 i< 50 h> 50
expected interest rates to fall further in the coming three months. The Expectations Indicator fell by 2.8 points to 40.6 in December.
Companies reported credit was less available with the indicator falling to 57.6 in December from 58.8 in November. In spite of the decline, the indicator averaged 59.6 in Q4, the highest since Q3 2014. Companies remained optimistic in their outlook for credit availability in general, with the Expectations Indicator increasing to 59.5 from 58.8 in November.
“Non productive assets are increasing, so financial position is weaker.” Iron and steel manufacturing company
“Banks will pass down the reduction in interest rates by the RBI in the coming three months.” Textile manufacturing company
“Our rating with banks has increased, liquidity is improving and financials are strong.” Containers and packaging manufacturing company
“There are liquidity issues in the market.” Speciality Chemicals manufacturing company

MNI India Business Report - December 201530
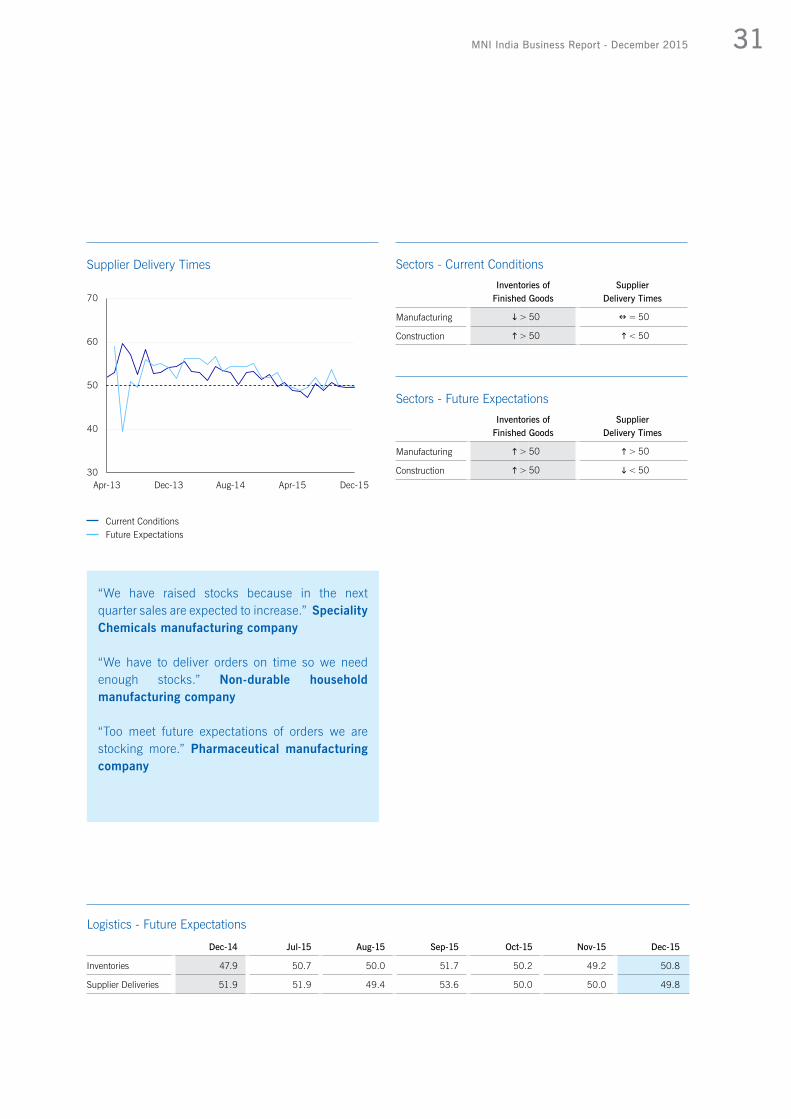
With less demand pressure, the time taken for suppliers to deliver key inputs continued to contract, and firms were left with unsold stocks of goods.
The Inventories Indicator rose for the second consecutive month to 52.5 in December from 51.9 in November. While inventory holdings have been broadly stable in the three months to December, leaving the Q4 average at 52.0, it was 3% above the level recorded in the same period a year earlier.
Companies expected to add to their inventory holdings in the coming three months, a sign that businesses don’t expect a quick revival in demand. Expectations for Inventories in three months' time rose to 50.8 in December, after falling below the 50 mark in November for the first time in six months.
Suppliers of key inputs took less time to deliver orders as there was less pressure amid weak demand. The Supplier Delivery Times Indicator was unchanged at 49.5 in December. Our panel of companies also anticipated that delivery times would shorten in the coming three months after expecting it to remain steady in the last two months. The Expectations Indicator fell below the 50 level for the first time in four months to 49.8 in December.
Logistics Inventories Highest in Four Months
Logistics - Current Conditions
Dec-14 Jul-15 Aug-15 Sep-15 Oct-15 Nov-15 Dec-15
Inventories 51.3 52.4 53.1 51.9 51.5 51.9 52.5
Supplier Deliveries 51.4 50.4 48.8 50.7 49.8 49.5 49.5
20
30
40
50
60
70
Apr-13 Dec-13 Aug-14 Apr-15 Dec-15
Current ConditionsFuture Expectations
Inventories
“Inventories are higher because of low orders.” Iron and steel manufacturing company
“Supplier delivery times are shorter because of low order rate.” Industrial machinery manufacturing company
“Poor sales have resulted in higher inventories.” Paper manufacturing company
“Raw material is available with the supplier at a fair price so delivery time is shorter.” Industrial machinery manufacturing company
MNI India Business Report - December 2015 31
Current ConditionsFuture Expectations
30
40
50
60
70
Apr-13 Dec-13 Aug-14 Apr-15 Dec-15
Supplier Delivery Times
Logistics - Future Expectations
Dec-14 Jul-15 Aug-15 Sep-15 Oct-15 Nov-15 Dec-15
Inventories 47.9 50.7 50.0 51.7 50.2 49.2 50.8
Supplier Deliveries 51.9 51.9 49.4 53.6 50.0 50.0 49.8
“We have raised stocks because in the next quarter sales are expected to increase.” Speciality Chemicals manufacturing company
“We have to deliver orders on time so we need enough stocks.” Non-durable household manufacturing company
“Too meet future expectations of orders we are stocking more.” Pharmaceutical manufacturing company
Sectors - Future ExpectationsInventories of
Finished GoodsSupplier
Delivery Times
Manufacturing h> 50 h> 50
Construction h> 50 i< 50
Sectors - Current ConditionsInventories of
Finished GoodsSupplier
Delivery Times
Manufacturing i> 50 n= 50
Construction h> 50 h< 50

Spitzzeile Titel32
A selection of comments from the panel of businesses surveyed over the past month.
What the Panel Said
“We are offering good quality product at good prices to foreign clients.” Pharmaceuticals manufacturing company
“Inventories are higher because of low orders.” Iron and steel manufacturing company
“We have raised stocks because in the next quarter sales are expected to increase.” Speciality Chemicals manufacturing company
“Raw material is available with the supplier at a fair price so delivery time is shorter.” Industrial machinery manufacturing company
“Poor sales have resulted in higher inventories.” Paper manufacturing company
“Too meet future expectations of orders we are stocking more.” Pharmaceutical manufacturing company
“We have to deliver orders on time so we need enough stocks.” Non-durable household manufacturing company
“Supplier delivery times are shorter because of low order rate.” Industrial machinery manufacturing company
“We are working with more number of people as per requirement.” Heavy Construction company
“There are very few projects and the expected orders did not happen on time so we have reduced our workforce.” Industrial machinery manufacturing company
“We are flushed with orders till December so have raised production.” Electrical components and equipment manufacturing company
“To introduce more products in the market, we have increased production.” Heavy Construction Company
“Non productive assets are increasing, so financial position is weaker.” Iron and steel manufacturing company
“Banks will pass down the reduction in interest rates by the RBI in the coming three months.” Textile manufacturing company
“Our rating with banks has increased, liquidity is improving and financials are strong.” Containers and packaging manufacturing company
“There are liquidity issues in the market.” Speciality Chemicals manufacturing company
“Less demand, decline in product prices and margins are affecting our financial position.” Speciality Chemicals manufacturing company
“Market conditions are very poor.” Clothing and accessories manufacturing company
“It is a much harder time because there is no domestic demand.” Clothing and accessories manufacturing company
“Production is down and there are not many orders.” Food products manufacturing company
“Poor bookings or demand in this season.” A Hotels Group
“Not much growth due to cheap Chinese imports.” Iron and steel manufacturing company
“The automobile market is improving.” Auto parts manufacturing company
“Interest rates should come down as Mr.Rajan (the RBI Governor) told banks to reduce rates.” Diversified Industrials manufacturing company
“Financial position is weak due to low cost Chinese imports.” Iron and steel manufacturing company
“There is less margin in the business.” Iron and steel manufacturing company
“We have changed our lender to the one who is offering us reduced interest rates.” Auto parts manufacturing company
MNI India Business Report - December 2015 33

Spitzzeile Titel34
35 Historical Summary
36 Historical Records
37 Historical Records - Quarterly
Data tables
MNI India Business Report - December 2015 35
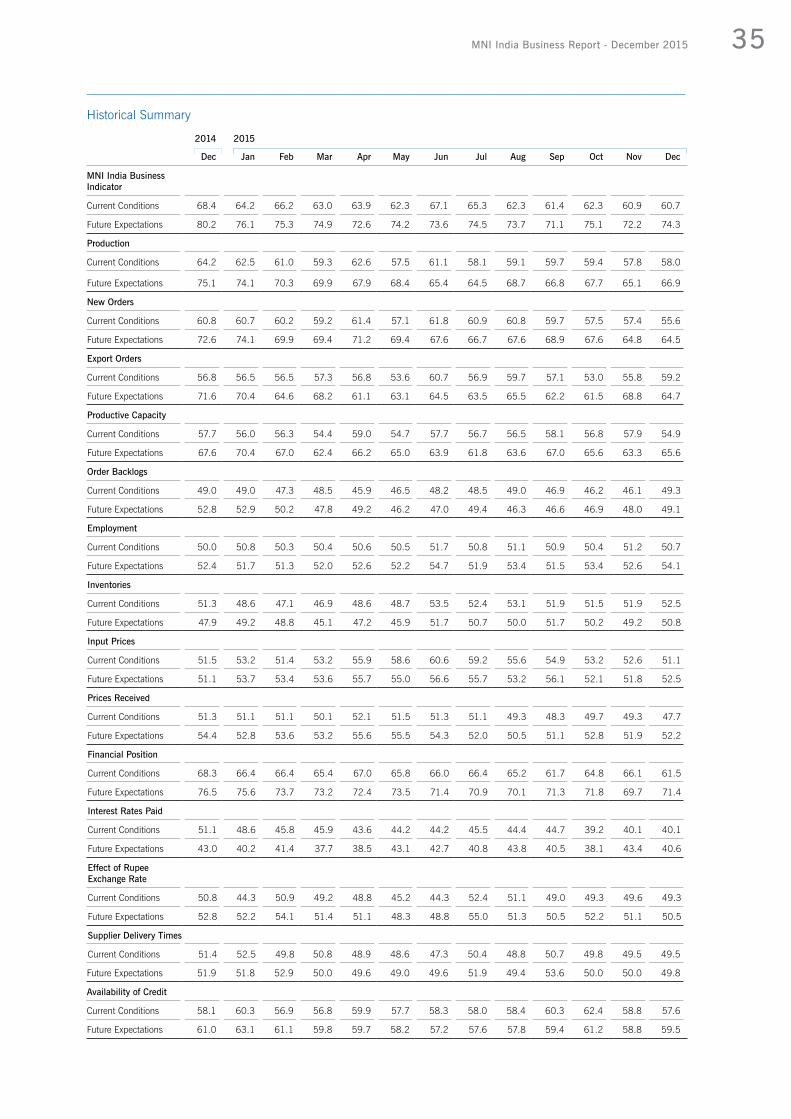
Historical Summary
2014 2015
Dec Jan Feb Mar Apr May Jun Jul Aug Sep Oct Nov Dec
MNI India BusinessIndicator
Current Conditions 68.4 64.2 66.2 63.0 63.9 62.3 67.1 65.3 62.3 61.4 62.3 60.9 60.7
Future Expectations 80.2 76.1 75.3 74.9 72.6 74.2 73.6 74.5 73.7 71.1 75.1 72.2 74.3
Production
Current Conditions 64.2 62.5 61.0 59.3 62.6 57.5 61.1 58.1 59.1 59.7 59.4 57.8 58.0
Future Expectations 75.1 74.1 70.3 69.9 67.9 68.4 65.4 64.5 68.7 66.8 67.7 65.1 66.9
New Orders
Current Conditions 60.8 60.7 60.2 59.2 61.4 57.1 61.8 60.9 60.8 59.7 57.5 57.4 55.6
Future Expectations 72.6 74.1 69.9 69.4 71.2 69.4 67.6 66.7 67.6 68.9 67.6 64.8 64.5
Export Orders
Current Conditions 56.8 56.5 56.5 57.3 56.8 53.6 60.7 56.9 59.7 57.1 53.0 55.8 59.2
Future Expectations 71.6 70.4 64.6 68.2 61.1 63.1 64.5 63.5 65.5 62.2 61.5 68.8 64.7
Productive Capacity
Current Conditions 57.7 56.0 56.3 54.4 59.0 54.7 57.7 56.7 56.5 58.1 56.8 57.9 54.9
Future Expectations 67.6 70.4 67.0 62.4 66.2 65.0 63.9 61.8 63.6 67.0 65.6 63.3 65.6
Order Backlogs
Current Conditions 49.0 49.0 47.3 48.5 45.9 46.5 48.2 48.5 49.0 46.9 46.2 46.1 49.3
Future Expectations 52.8 52.9 50.2 47.8 49.2 46.2 47.0 49.4 46.3 46.6 46.9 48.0 49.1
Employment
Current Conditions 50.0 50.8 50.3 50.4 50.6 50.5 51.7 50.8 51.1 50.9 50.4 51.2 50.7
Future Expectations 52.4 51.7 51.3 52.0 52.6 52.2 54.7 51.9 53.4 51.5 53.4 52.6 54.1
Inventories
Current Conditions 51.3 48.6 47.1 46.9 48.6 48.7 53.5 52.4 53.1 51.9 51.5 51.9 52.5
Future Expectations 47.9 49.2 48.8 45.1 47.2 45.9 51.7 50.7 50.0 51.7 50.2 49.2 50.8
Input Prices
Current Conditions 51.5 53.2 51.4 53.2 55.9 58.6 60.6 59.2 55.6 54.9 53.2 52.6 51.1
Future Expectations 51.1 53.7 53.4 53.6 55.7 55.0 56.6 55.7 53.2 56.1 52.1 51.8 52.5
Prices Received
Current Conditions 51.3 51.1 51.1 50.1 52.1 51.5 51.3 51.1 49.3 48.3 49.7 49.3 47.7
Future Expectations 54.4 52.8 53.6 53.2 55.6 55.5 54.3 52.0 50.5 51.1 52.8 51.9 52.2
Financial Position
Current Conditions 68.3 66.4 66.4 65.4 67.0 65.8 66.0 66.4 65.2 61.7 64.8 66.1 61.5
Future Expectations 76.5 75.6 73.7 73.2 72.4 73.5 71.4 70.9 70.1 71.3 71.8 69.7 71.4
Interest Rates Paid
Current Conditions 51.1 48.6 45.8 45.9 43.6 44.2 44.2 45.5 44.4 44.7 39.2 40.1 40.1
Future Expectations 43.0 40.2 41.4 37.7 38.5 43.1 42.7 40.8 43.8 40.5 38.1 43.4 40.6
Effect of Rupee Exchange Rate
Current Conditions 50.8 44.3 50.9 49.2 48.8 45.2 44.3 52.4 51.1 49.0 49.3 49.6 49.3
Future Expectations 52.8 52.2 54.1 51.4 51.1 48.3 48.8 55.0 51.3 50.5 52.2 51.1 50.5
Supplier Delivery Times
Current Conditions 51.4 52.5 49.8 50.8 48.9 48.6 47.3 50.4 48.8 50.7 49.8 49.5 49.5
Future Expectations 51.9 51.8 52.9 50.0 49.6 49.0 49.6 51.9 49.4 53.6 50.0 50.0 49.8
Availability of Credit
Current Conditions 58.1 60.3 56.9 56.8 59.9 57.7 58.3 58.0 58.4 60.3 62.4 58.8 57.6
Future Expectations 61.0 63.1 61.1 59.8 59.7 58.2 57.2 57.6 57.8 59.4 61.2 58.8 59.5

MNI India Business Report - December 201536
Historical Records
2012 - Current
Minimum Maximum Mean Median
MNI India Business Indicator
Current Conditions 47.5 71.2 62.3 62.7
Future Expectations 49.7 82.4 71.9 74.2
Production
Current Conditions 41.0 67.3 60.0 59.8
Future Expectations 41.3 77.3 67.8 68.8
New Orders
Current Conditions 39.7 69.1 59.2 60.8
Future Expectations 40.4 78.6 68.4 69.4
Export Orders
Current Conditions 41.3 67.4 57.9 57.7
Future Expectations 45.2 76.1 65.2 65.3
Productive Capacity
Current Conditions 41.0 64.0 56.6 57.4
Future Expectations 40.7 71.4 64.4 65.6
Order Backlogs
Current Conditions 35.6 59.3 48.6 48.5
Future Expectations 32.8 59.6 48.7 49.2
Employment
Current Conditions 48.9 54.1 51.1 50.8
Future Expectations 49.5 57.5 52.6 52.4
Inventories
Current Conditions 46.9 64.9 52.9 51.9
Future Expectations 31.0 59.5 50.1 50.7
Input Prices
Current Conditions 51.1 79.6 62.1 60.6
Future Expectations 50.9 74.9 60.0 57.2
Prices Received
Current Conditions 41.5 67.1 53.3 52.9
Future Expectations 45.1 73.7 55.9 55.6
Financial Position
Current Conditions 53.4 72.3 64.8 66.3
Future Expectations 51.6 83.3 72.1 73.3
Interest Rates Paid
Current Conditions 39.2 73.2 54.0 52.0
Future Expectations 37.7 71.7 50.4 46.9
Effect of Rupee Exchange Rate
Current Conditions 30.9 77.8 49.9 49.3
Future Expectations 30.1 75.5 51.9 52.2
Supplier Delivery Times
Current Conditions 47.3 59.6 52.3 52.5
Future Expectations 39.5 59.0 52.6 53.1
Availability of Credit
Current Conditions 41.1 64.6 56.7 57.9
Future Expectations 40.9 67.8 59.0 59.5
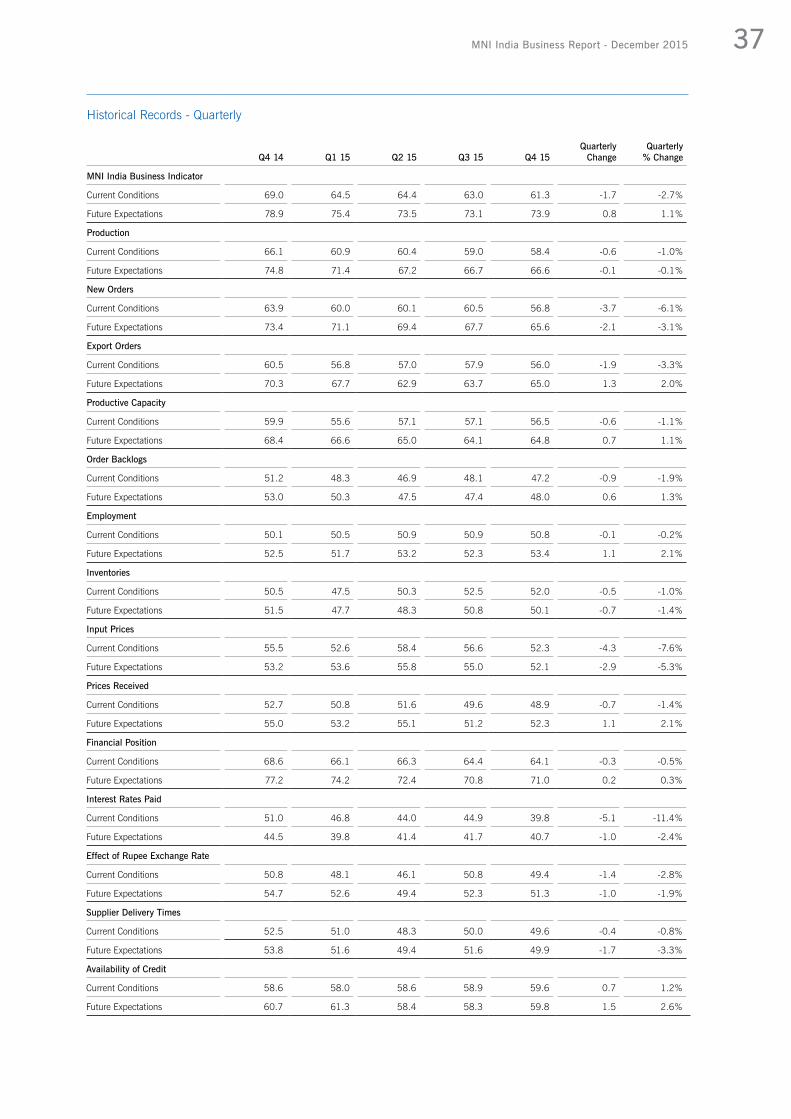
MNI India Business Report - December 2015 37
Historical Records - Quarterly
QuarterlyChange
Quarterly% ChangeQ4 14 Q1 15 Q2 15 Q3 15 Q4 15
MNI India Business Indicator
Current Conditions 69.0 64.5 64.4 63.0 61.3 -1.7 -2.7%
Future Expectations 78.9 75.4 73.5 73.1 73.9 0.8 1.1%
Production
Current Conditions 66.1 60.9 60.4 59.0 58.4 -0.6 -1.0%
Future Expectations 74.8 71.4 67.2 66.7 66.6 -0.1 -0.1%
New Orders
Current Conditions 63.9 60.0 60.1 60.5 56.8 -3.7 -6.1%
Future Expectations 73.4 71.1 69.4 67.7 65.6 -2.1 -3.1%
Export Orders
Current Conditions 60.5 56.8 57.0 57.9 56.0 -1.9 -3.3%
Future Expectations 70.3 67.7 62.9 63.7 65.0 1.3 2.0%
Productive Capacity
Current Conditions 59.9 55.6 57.1 57.1 56.5 -0.6 -1.1%
Future Expectations 68.4 66.6 65.0 64.1 64.8 0.7 1.1%
Order Backlogs
Current Conditions 51.2 48.3 46.9 48.1 47.2 -0.9 -1.9%
Future Expectations 53.0 50.3 47.5 47.4 48.0 0.6 1.3%
Employment
Current Conditions 50.1 50.5 50.9 50.9 50.8 -0.1 -0.2%
Future Expectations 52.5 51.7 53.2 52.3 53.4 1.1 2.1%
Inventories
Current Conditions 50.5 47.5 50.3 52.5 52.0 -0.5 -1.0%
Future Expectations 51.5 47.7 48.3 50.8 50.1 -0.7 -1.4%
Input Prices
Current Conditions 55.5 52.6 58.4 56.6 52.3 -4.3 -7.6%
Future Expectations 53.2 53.6 55.8 55.0 52.1 -2.9 -5.3%
Prices Received
Current Conditions 52.7 50.8 51.6 49.6 48.9 -0.7 -1.4%
Future Expectations 55.0 53.2 55.1 51.2 52.3 1.1 2.1%
Financial Position
Current Conditions 68.6 66.1 66.3 64.4 64.1 -0.3 -0.5%
Future Expectations 77.2 74.2 72.4 70.8 71.0 0.2 0.3%
Interest Rates Paid
Current Conditions 51.0 46.8 44.0 44.9 39.8 -5.1 -11.4%
Future Expectations 44.5 39.8 41.4 41.7 40.7 -1.0 -2.4%
Effect of Rupee Exchange Rate
Current Conditions 50.8 48.1 46.1 50.8 49.4 -1.4 -2.8%
Future Expectations 54.7 52.6 49.4 52.3 51.3 -1.0 -1.9%
Supplier Delivery Times
Current Conditions 52.5 51.0 48.3 50.0 49.6 -0.4 -0.8%
Future Expectations 53.8 51.6 49.4 51.6 49.9 -1.7 -3.3%
Availability of Credit
Current Conditions 58.6 58.0 58.6 58.9 59.6 0.7 1.2%
Future Expectations 60.7 61.3 58.4 58.3 59.8 1.5 2.6%

MNI India Business Report - December 201538
About MNI Indicators Insight and data for better decisions
MNI Indicators offers unique macro-economic data and insight to businesses and the investment community. We produce data and intelligence that is unbiased, pertinent and responsive. Our data moves markets.
MNI Indicators specialises in business and consumer focused macro-economic reports that give our customers the ability to make timely and relevant decisions. We strive to provide up-to-date information on business and consumer confidence on the economy.
MNI Indicators publishes data on a monthly basis. Our indicators are based on a unique and proprietary methodology and are designed to present an advance picture of the economic landscape as perceived by businesses and consumers every month.
Our monthly reports explore attitudes, perspectives and confidence across different countries and regions. They deliver in-depth analysis, highlight changing patterns and how these can affect potential developments in business and consumer activities.
MNI Indicators is part of MNI, a leading provider of news and intelligence. MNI is a wholly owned subsidiary of Deutsche Börse Group, one of the largest worldwide exchange organisations.

Insight and data for better decisions
Discovering trends in Emerging MarketsMNI’s Emerging Markets Indicators explore attitudes, perspectives and confidence in Russia, India and China. Our data and monthly reports present an advance picture of the economic landscape as perceived by businesses and consumers.
Our indicators allow investors, economists, analysts, and companies to identify economic trends and make informed investment and business decisions. Our data moves markets.
www.mni-indicators.com

Published byMNI Indicators | Deutsche Börse GroupWestferry House11 Westferry CircusLondon E14 4HEwww.mni-indicators.com
Copyright © 2015 MNI Indicators | Deutsche Börse Group.
Reproduction or retransmission in whole or in part is prohibited except by permission. All rights reserved.
@MNIIndicatorsMNI Indicators


