23
Mobile Gaming Forum - 25 January 2012 Mobile Gaming: State of the European Market Jeremy Copp, Vice President Mobile Europe [email protected], +44 7876 567742
| Date post: | 01-Nov-2014 |
| Category: |
Business |
| Upload: | romain-fonnier |
| View: | 723 times |
| Download: | 0 times |

Mobile Gaming Forum - 25 January 2012
Mobile Gaming: State of the European Market
Jeremy Copp, Vice President Mobile Europe
[email protected], +44 7876 567742
2 © comScore, Inc. Proprietary and Confidential.
Agenda
– Mobile Media Landscape
Usage, Devices & Market Drivers
Smartphone Trends
Mobile Gaming
Who Does What & How?
Which Handsets?
Who are the Consumers?
Monetisation
Advertising
Paid Downloads & Freemium
In Game Purchases
Takeaways
3 © comScore, Inc. Proprietary and Confidential.
Mobile Media Landscape
Usage, Devices & Market Drivers
Smartphone Trends
4 © comScore, Inc. Proprietary and Confidential.
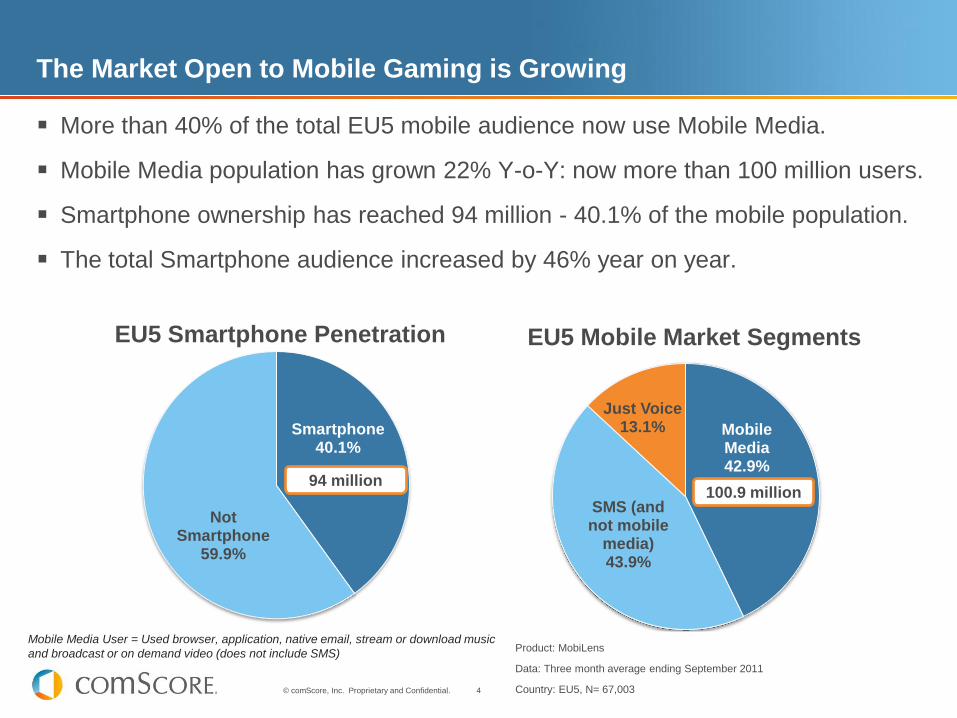
The Market Open to Mobile Gaming is Growing
More than 40% of the total EU5 mobile audience now use Mobile Media.
Mobile Media population has grown 22% Y-o-Y: now more than 100 million users.
Smartphone ownership has reached 94 million - 40.1% of the mobile population.
The total Smartphone audience increased by 46% year on year.
Product: MobiLens
Data: Three month average ending September 2011
Country: EU5, N= 67,003
Mobile Media User = Used browser, application, native email, stream or download music
and broadcast or on demand video (does not include SMS)
Smartphone 40.1%
Not Smartphone
59.9%
EU5 Smartphone Penetration
94 million
Mobile Media 42.9%
SMS (and not mobile
media) 43.9%
Just Voice 13.1%
EU5 Mobile Market Segments
100.9 million

5 © comScore, Inc. Proprietary and Confidential.
Smartphone Ownership a Key Market Driver
Since December 2010, smartphones have dominated new mobile phone purchases
Now more than 59% of devices sold in EU5 are smartphones
Product: MobiLens
Data: Three month average ending September 2011
Country: EU5, N= 67,003
72% 70% 70% 69% 62% 59%
52% 49% 47% 42% 41%
28% 30% 30% 31% 38% 41%
48% 51% 53% 58% 59%
0%
10%
20%
30%
40%
50%
60%
70%
80%
90%
100%
Q1 2009 Q2 2009 Q3 2009 Q4 2009 Q1 2010 Q2 2010 Q3 2010 Q4 2010 Q1 2011 Q2 2011 Q3 2011
% A
cq
uir
ed
Dev
ice in
Mo
nth
Acquired Device in Month by Type
Not Smartphone Smartphone

6 © comScore, Inc. Proprietary and Confidential.
Google’s Android Has Rapidly Grown its Smartphone Market Share
In the past year, Android increased its market share from 8.3% in September 2010
to its current 26.2%.
Apple has increased its share from 19.4% to 20.7% while all other major operating
systems saw their share decline.
Product: MobiLens
Data: Three month average ending September 2011
Country: EU5, N= 67,003
51.8%
33.9%
8.3%
26.2%
19.4% 20.7%
7.9% 9.5%
10.6%
6.3%
2.0% 3.4% 0.0%
10.0%
20.0%
30.0%
40.0%
50.0%
60.0%
Sep-10 Oct-10 Nov-10 Dec-10 Jan-11 Feb-11 Mar-11 Apr-11 May-11 Jun-11 Jul-11 Aug-11 Sep-11
% S
mart
ph
on
e I
nsta
lled
Base
Smartphone Operating Systems - Trend
Symbian Google Apple RIM Microsoft Other
- 4%
+361%
+56%
+74%
-13%
+158%
% YoY
Growth

7 © comScore, Inc. Proprietary and Confidential.
Mobile Media User = Used browser, application, native email, stream or download music
and broadcast or on demand video (does not include SMS)
Smartphone Owners are Over 237% More Likely to Use Mobile Media
than Non-Smartphone Users
Smartphones have revolutionized the market for Mobile Media. More than 94% of Apple’s user base
consume Mobile Media.
Google, Apple and RIM platform users over-index on consumption behavior, compared to the
Smartphone average.
Mobile owners with Microsoft and Symbian based devices are less likely to use Mobile Media than the
average Smartphone user.
Product: MobiLens
Data: Three month average ending September 2011
Country: EU5, N= 67,003
94.3%
86.0% 84.8%
68.5%
51.6%
74.2%
22.0%
89.1%
76.5% 75.4%
56.5%
40.0%
64.6%
14.4%
85.7%
76.2% 72.0%
57.9%
40.3%
63.8%
15.8%
0.0%
10.0%
20.0%
30.0%
40.0%
50.0%
60.0%
70.0%
80.0%
90.0%
100.0%
Apple Google RIM Microsoft Symbian Smartphone Not Smartphone
%P
en
etr
ati
on
Mobile Media Consumption by Operating System
Used connected media (except SMS) Used application (except native games) Used browser

8 © comScore, Inc. Proprietary and Confidential.
Mobile Gaming
Who Does What & How?
Which Handsets?
Who Are the Consumers?

9 © comScore, Inc. Proprietary and Confidential.
Most Prevalent Installed Game Genres are Not Always Most Purchased
Most popular genres purchased are not always the same as the most popular installed
Action/adventure, board, card, strategy & casino games highest volume purchases
Arcade, card, strategy & word or number games largest installed volume
Product: MobiLens
Data: Three month average ending September 2011
Country: EU5, N= 67,003
0
100
200
300
400
500
600
700
800
0
2,000
4,000
6,000
8,000
10,000
12,000
14,000
Arc
ade
pu
zzle
Card
Str
ate
gy
Wo
rd o
r N
um
be
r
Retr
o a
rca
de
Bo
ard
Quiz
Racin
g
Action/a
dventu
re
Sp
ort
s
Casin
o
Sim
ula
tion
First pe
rson
sh
oote
r
Role
Pla
yin
g G
am
es
Music
/Rhyth
m
Kid
s/F
am
ily
Oth
er
Nu
mb
er
Pu
rch
ased
(000)
Nu
mb
er
Insta
lled
(000)
Most Popular Gaming Genres
Installed Purchased

10 © comScore, Inc. Proprietary and Confidential.
Distinct Audiences for Different Game Genres
Young, heavily male audience for action/adventure, RPG, sports and first person shooter games
Puzzles, card games, quizzes and board games attract an older audience more evenly spread
between genders
Musical and strategy games have a younger, more female demographic
Product: MobiLens
Data: Three month average ending September 2011
Country: EU5, N= 67,003
Action/adventure
Arcade puzzle
Board
Card
Casino
First person shooter
Music/Rhythm
Role Playing Games
Quiz
Racing
Retro arcade
Kids/Family
Simulation
Sports
Strategy
Word or Number Other
15%
25%
35%
45%
55%
65%
10.0 12.0 14.0 16.0 18.0 20.0 22.0 24.0 26.0 28.0 30.0
% F
em
ale
Median Age
Demographic Profile of Installed Game Users
Size of bubbles = % of the market
Higher on chart = More female
Further to right = Older

11 © comScore, Inc. Proprietary and Confidential.
Consumers Continue to Play Mobile Games Regularly
Over 25% of mobile phone users (62m consumers) played a game in the month
Nearly 13m users play a game almost every day
Product: MobiLens
Data: Three month average ending September 2011
Country: EU5, N= 67,003
0.0
5.0
10.0
15.0
20.0
25.0
30.0
Almost every day At least once each week Once to three timesthroughout the month
Ever in month
Pro
po
rtio
n o
f T
ota
l A
ud
ien
ce (
%)
Frequency of Playing Games
12 © comScore, Inc. Proprietary and Confidential.
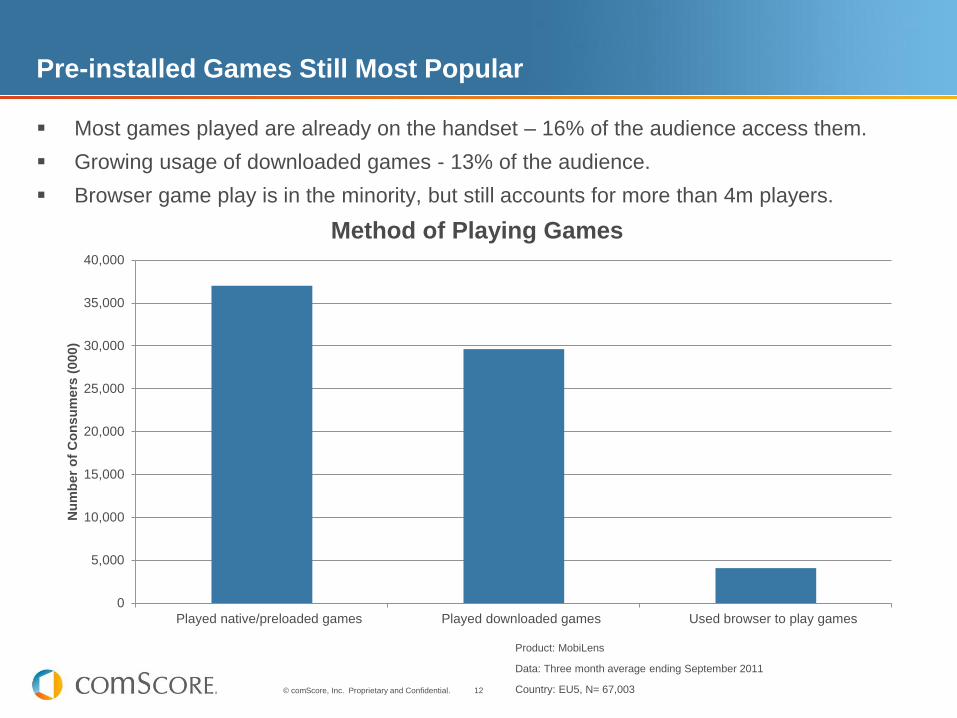
Pre-installed Games Still Most Popular
Most games played are already on the handset – 16% of the audience access them.
Growing usage of downloaded games - 13% of the audience.
Browser game play is in the minority, but still accounts for more than 4m players.
Product: MobiLens
Data: Three month average ending September 2011
Country: EU5, N= 67,003
0
5,000
10,000
15,000
20,000
25,000
30,000
35,000
40,000
Played native/preloaded games Played downloaded games Used browser to play games
Nu
mb
er
of
Co
nsu
mers
(000)
Method of Playing Games

13 © comScore, Inc. Proprietary and Confidential.
Most Consumers Download Two or Fewer Games Per Month
More than 60% of downloaders added up to two games in the month
Heavy users account for 12% of downloaders, adding 5 or more games in the month
More than one third of those with games installed have five or more on their phone
Product: MobiLens
Data: Three month average ending September 2011
Country: EU5, N= 67,003
12%
17%
18%
11% 7%
35%
Number of Games Installed
1
2
3
4
5
5+
33%
28%
17%
7%
3% 12%
Number of Games Downloaded in Month
1
2
3
4
5
5+
14 © comScore, Inc. Proprietary and Confidential.
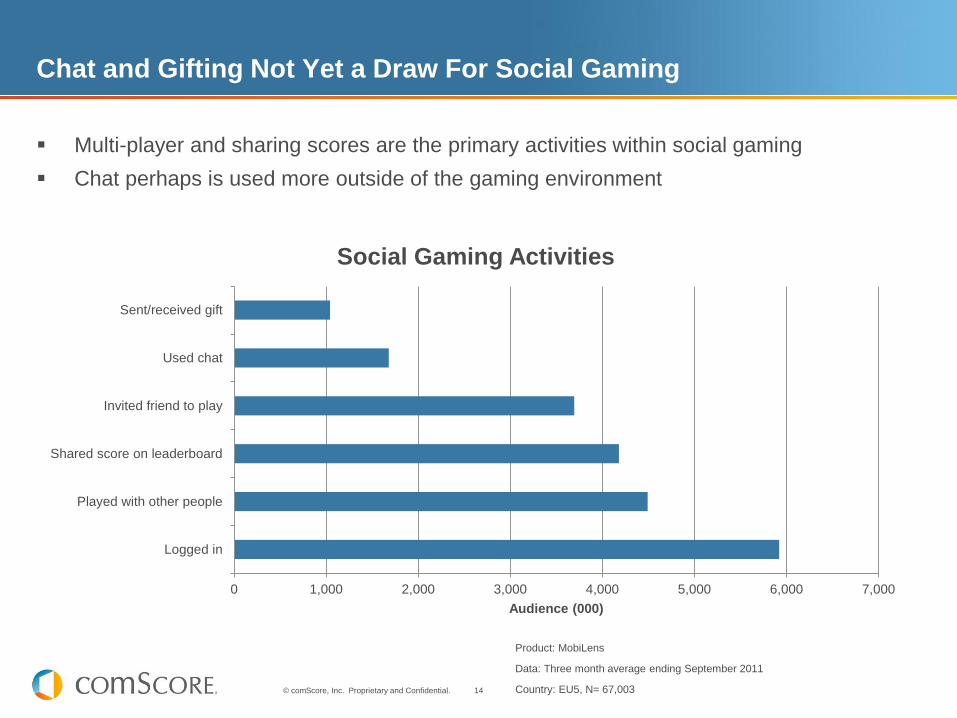
Chat and Gifting Not Yet a Draw For Social Gaming
Multi-player and sharing scores are the primary activities within social gaming
Chat perhaps is used more outside of the gaming environment
Product: MobiLens
Data: Three month average ending September 2011
Country: EU5, N= 67,003
0 1,000 2,000 3,000 4,000 5,000 6,000 7,000
Logged in
Played with other people
Shared score on leaderboard
Invited friend to play
Used chat
Sent/received gift
Audience (000)
Social Gaming Activities

15 © comScore, Inc. Proprietary and Confidential.
iPhone is the Mobile Gaming Device of Choice
iPhones predominate as gaming devices with more than 10m players.
53% of iPhone owners played a game – users of Android based devices show a similar
propensity with 45% playing
Product: MobiLens
Data: Three month average ending September 2011
Country: EU5, N= 67,003
Handset Model Number Playing Games (000)
Apple - iPhone 4 16GB (Fourth Generation) [GSM] 3,466
Apple - iPhone 3G S 16GB (Third Generation) 1,528
Apple - iPhone 4 32GB (Fourth Generation) [GSM] 1,321
RIM - BlackBerry Curve 8520 1,318
Samsung - Galaxy S I9000 8GB 1,223
Apple - iPhone 3G S 32GB (Third Generation) 1,145
Nokia - 5800 XpressMusic 1,132
HTC - Desire [GSM] 969
Apple - iPhone 3G 16GB (Second Generation) 887
HTC - Wildfire [GSM] 831
Apple - iPhone 3G S 8GB (Third Generation) 789
Samsung - Galaxy S II 16GB (no NFC) 696
Samsung - Galaxy Ace S5830 588
HTC - Desire HD 568
Nokia – 5230 523
Samsung - S5230 521
HTC - Wildfire S [GSM] 515

16 © comScore, Inc. Proprietary and Confidential.
Monetisation
Advertising
Paid Downloads & Freemium
In Game Purchases
17 © comScore, Inc. Proprietary and Confidential.
74.2%
44.2%
39.3%
0.0%
10.0%
20.0%
30.0%
40.0%
50.0%
60.0%
70.0%
80.0%
Mobile Media Social Networking Played Games
% S
mart
ph
on
e
Methods of Interacting
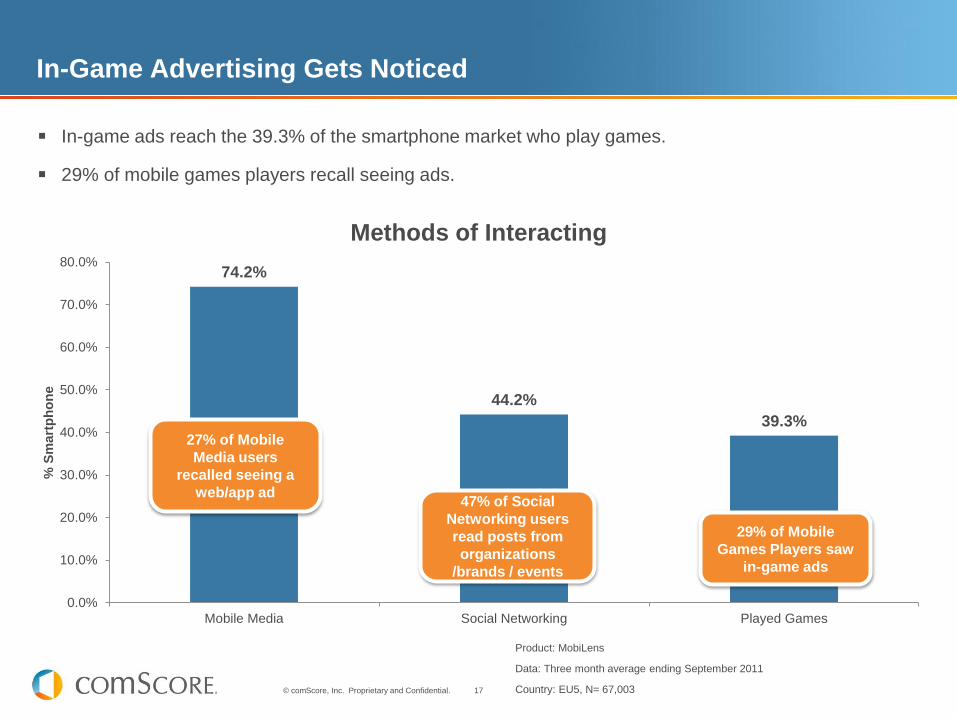
In-Game Advertising Gets Noticed
In-game ads reach the 39.3% of the smartphone market who play games.
29% of mobile games players recall seeing ads.
Product: MobiLens
Data: Three month average ending September 2011
Country: EU5, N= 67,003
27% of Mobile
Media users
recalled seeing a
web/app ad 47% of Social
Networking users
read posts from
organizations
/brands / events
29% of Mobile
Games Players saw
in-game ads

18 © comScore, Inc. Proprietary and Confidential.
Increasingly Users Download Trial Rather Than Purchase
Unsurprisingly more than half of consumers download games for free
Increasing proportion of users are downloading trial versions rather than purchasing games
Product: MobiLens
Data: Three month average ending September 2011
Country: EU5, N= 67,003
27%
21%
52%
Game Download Methods
Trial only download
Purchased by paying a fee
Downloaded full version of game for free
19 © comScore, Inc. Proprietary and Confidential.
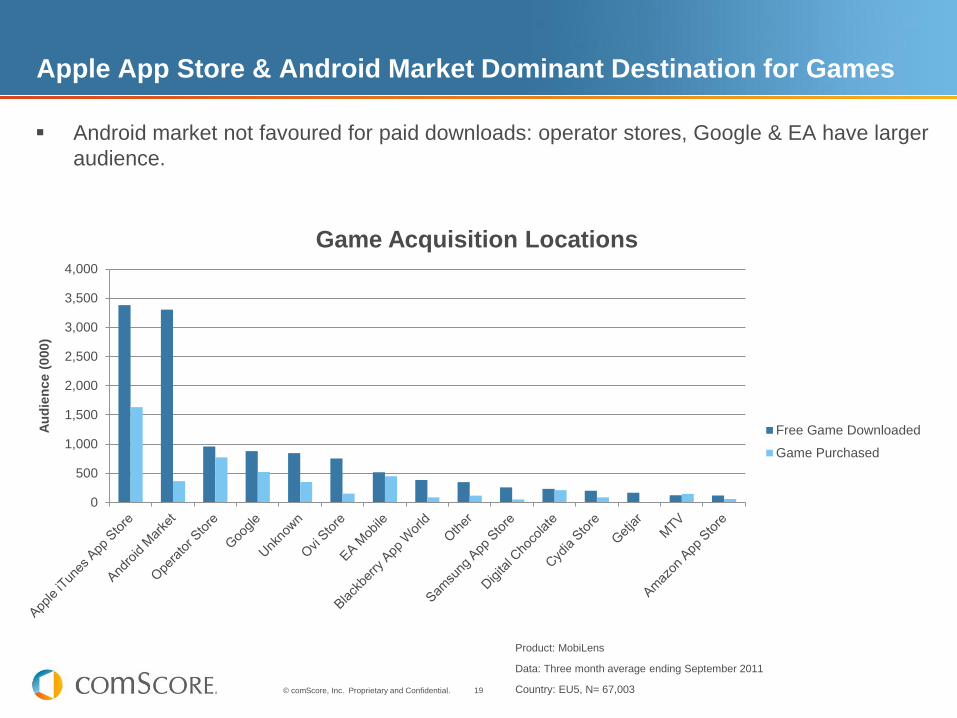
Apple App Store & Android Market Dominant Destination for Games
Android market not favoured for paid downloads: operator stores, Google & EA have larger
audience.
Product: MobiLens
Data: Three month average ending September 2011
Country: EU5, N= 67,003
0
500
1,000
1,500
2,000
2,500
3,000
3,500
4,000
Au
die
nce (
000)
Game Acquisition Locations
Free Game Downloaded
Game Purchased
20 © comScore, Inc. Proprietary and Confidential.
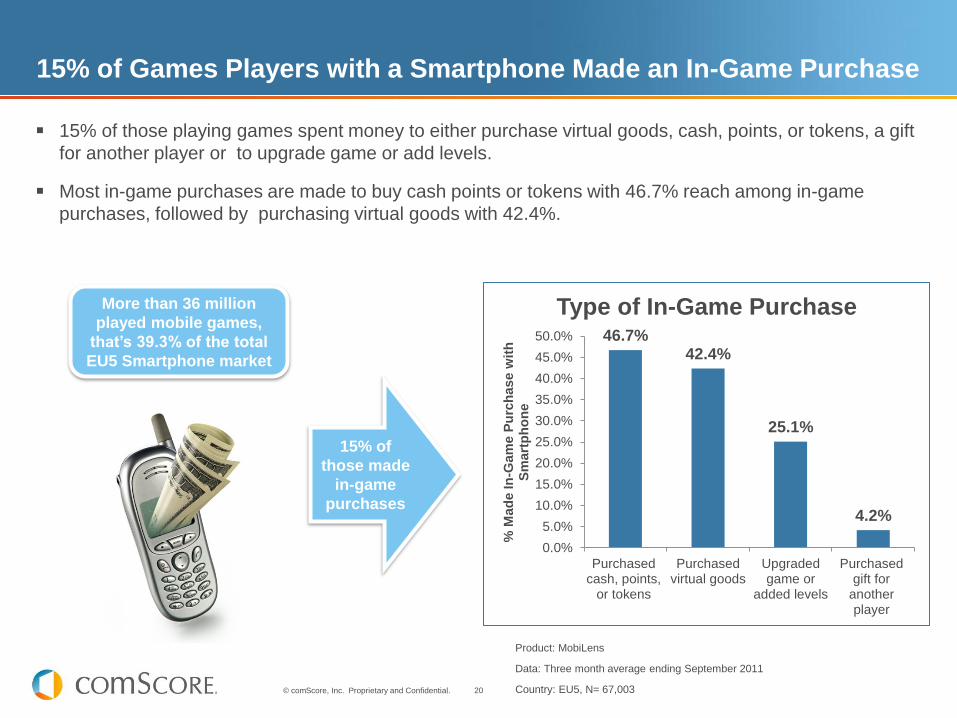
15% of Games Players with a Smartphone Made an In-Game Purchase
Product: MobiLens
Data: Three month average ending September 2011
Country: EU5, N= 67,003
15% of those playing games spent money to either purchase virtual goods, cash, points, or tokens, a gift
for another player or to upgrade game or add levels.
Most in-game purchases are made to buy cash points or tokens with 46.7% reach among in-game
purchases, followed by purchasing virtual goods with 42.4%.
15% of
those made
in-game
purchases
More than 36 million
played mobile games,
that’s 39.3% of the total
EU5 Smartphone market
46.7% 42.4%
25.1%
4.2%
0.0%
5.0%
10.0%
15.0%
20.0%
25.0%
30.0%
35.0%
40.0%
45.0%
50.0%
Purchasedcash, points,
or tokens
Purchasedvirtual goods
Upgradedgame or
added levels
Purchasedgift for
anotherplayer
% M
ad
e In
-Gam
e P
urc
hase w
ith
S
mart
ph
on
e
Type of In-Game Purchase

21 © comScore, Inc. Proprietary and Confidential.
Takeaways

22 © comScore, Inc. Proprietary and Confidential.
Takeaways
The market for mobile gaming in Europe continues to grow – Ever more smartphone owners driving the update in gaming – More than 25% of mobile phone owners in Europe play games every month
The installed base of games & most popular download genres differ – Downloading becoming more popular but browser based games a minority – Ensure you understand the route to market for your products
There are distinct target audiences for different types of games – Know how to reach them with your marketing and delivery channels
The iPhone is a good bet as a target platform – Users have a high propensity to play games – Currently represent the highest volume platform for gamers in Europe – However, Android based phone users show similar characteristics
Monetise through in-game purchases or advertising – Paid downloads a decreasing proportion of the market
Consider the market carefully – how will you reach your target
audience? – The reality as revealed by measurement is often different from intuition


