Mobile Networks Benchmarking Results 2013 Background The TRA is committed to ensure both quality and variety in telecommunication services throughout the UAE. This is an essential part of the long term plan to help the UAE become a recognized regional ICT hub. The TRA is also keen to ensure that the terms of licensees are well adhered to. The Telecommunications Regulatory Authority (TRA) of the United Arab Emirates (UAE) has carried out an extensive benchmarking survey of the Mobile networks and services provided by mobile licensees (Etisalat and du). The survey has covered more than 11,000 Km of the UAE’s unique roads between April – July, 2013 at peak hours during working days. All of the emirates including: Abu Dhabi, Dubai, Sharjah, Ajman, Um Al Quwain, Ras Al Khaimah, Fujairah, the Western Region and major highways were covered. The TRA has performed thousands of test calls during the survey in addition to similar tests were conducted indoor for 34 static venues; Figure 1 illustrates the survey’s drive test routes; Figure 1: Test paths in UAE
Transcript
Mobile Networks Benchmarking Results 2013
Background
The TRA is committed to ensure both quality and variety in telecommunication services throughout the UAE. This is an
essential part of the long term plan to help the UAE become a recognized regional ICT hub. The TRA is also keen to ensure
that the terms of licensees are well adhered to.
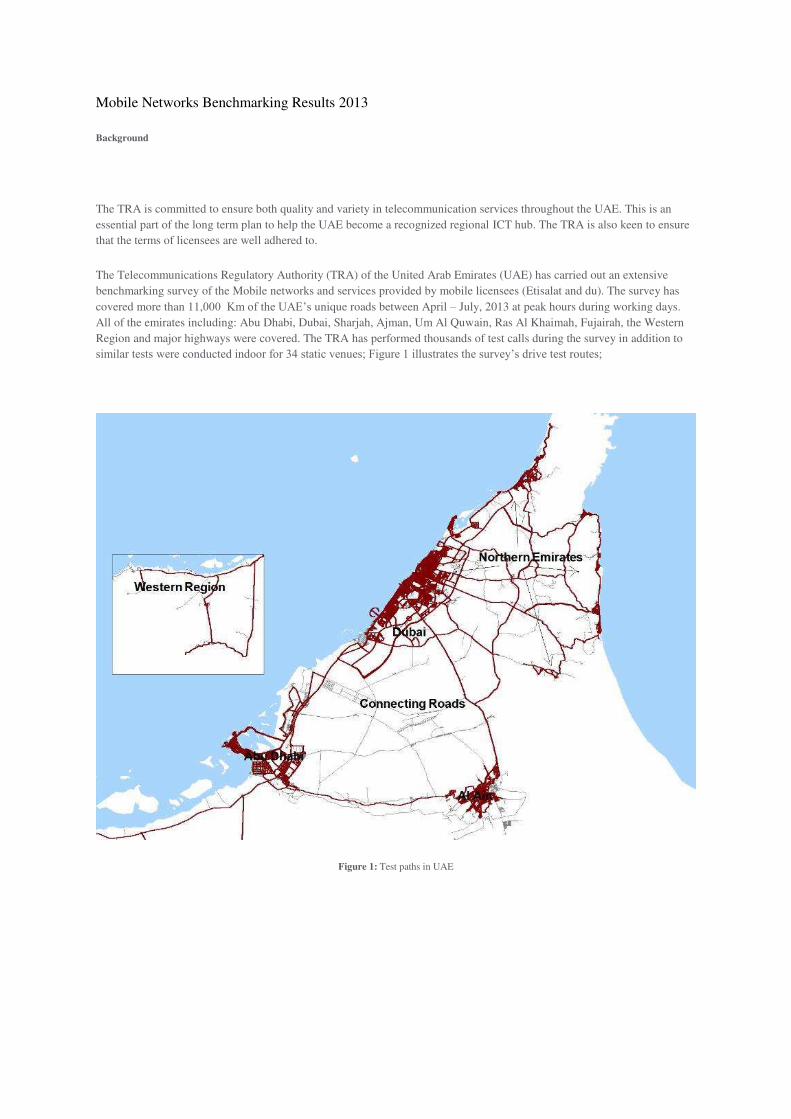
The Telecommunications Regulatory Authority (TRA) of the United Arab Emirates (UAE) has carried out an extensive
benchmarking survey of the Mobile networks and services provided by mobile licensees (Etisalat and du). The survey has
covered more than 11, 000 Km of the UAE’s unique roads between April – July, 2013 at peak hours during working days.
All of the emirates including: Abu Dhabi, Dubai, Sharjah, Ajman, Um Al Quwain, Ras Al Khaimah, Fujairah, the Western
Region and major highways were covered. The TRA has performed thousands of test calls during the survey in addition to
similar tests were conducted indoor for 34 static venues; Figure 1 illustrates the survey’s drive test routes;
Figure 1: Test paths in UAE
What was measured?
The survey addressed 2nd and 3rd generation mobile networks for both licensees (du and etisalat). QoS standards used in the survey include:
1. Call Completion Success Rate
2. Call Setup Success Rate
3. Call Drop Rate
4. Voice Quality
5. Service Coverage
6. Data Transfer Rate
Definition of User Simulation QoS
1. Call Completion Success Rate: Is the measure of calls that were successfully set up and normally terminated, note
that a high Call Completion Success Rate is desirable.
2. Call Setup Success Rate: Percentage of attempts that resulted in successful, note that a high Call Setup Success Rate is
desirable.
3. Call Drop Rate: This refers to the disconnection of mobile calls by the network during a 120-second call-holding
period for each call, note that a low Call Drop Rate is desirable. The target is to achieve a ratio of less than 2% in
the index of the dropped calls.
% Dropped calls =Number of Dropped Calls / Number of Good Initiations
4. Voice Quality: The overall voice quality rate is equal to the average voice quality on the downlink and uplink which
refers to the network's ability in achieving an acceptable level of voice quality using the Mean Opinion Score
(MOS) measure and 2.8 score has been set as the MOS threshold, note that a high Voice Quality Rate is desirable.
5. Service Coverage: This is based on signal strength and refers to the network's ability in achieving a signal strength of
-100 dBm or higher.
6. Data Transfer Rate Rate at which data is transmitted over the application protocol levels. Provided in kilobit-per-
second (kbps), where 1 kilobit = 1000 bits. Both FTP & HTTP have been tested.:
- FTP (File Transfer Protocol): used to upload files from a workstation to a FTP server or download files
from a FTP server to a workstation. Large file (5 MB) was used for the test.
- HTTP (Hyper Text Transfer Protocol): used to transfer files from a Web server onto a browser in order
to view a Web page that is on the Internet. Small file (500 KB) was used for the test.
Methodology
To ensure that the testing provides a fair comparison of the service provided by the mobile networks and that it provides a
reliable basis for the encouragement of ever improving quality of service throughout the UAE, the TRA has employed a
“state of the art” test equipment that has been used in more than 160 organizations and 70 countries. The equipment measures “key performance indicators” that directly relate to the public’s experience through Outdoor (in-car user
experience) and Indoor user experience. These include network coverage, dropped calls and the clarity of calls.
The ratio of the voice calls attempts in regard to Mobile Originated Calls /Mobile Terminated Calls (MOC/MTC) was 1/1.
The call test scenario consisted of a 120 seconds holding period followed by a 45 seconds idle time.
Results Interpretation
In interpreting the results, it should be noted that:
The drive test results represent a snapshot of the mobile service provider's network in-car user experience based on
the specified routes during the time of day when the measurements were carried out and using a particular type of
handset. The reported level of service quality may therefore not be exactly comparable with the consumer's own
experience;
Consumers should not treat the drive test results as recommended best buys. Factors such as price plans, value
added services, customer care and support are not captured in this report.
Survey Results
1- Outdoor
Call Completion Success Rate
This parameter measures the capability of the network to successful setting up a call and normally terminating it. The call
completion success rate shown below is based on more than 13,000 voice call attempts per operator.
Figure 2: Call Completion Success Rate in Outdoor Coverage
Call Setup Success Rate
This parameter measures the capability of the network to successful setting up a call normally. The call completion success rate
below is based on more than 13,000 voice call attempts for each operator.
Figure 3: Call Setup Success Rate in Outdoor Coverage
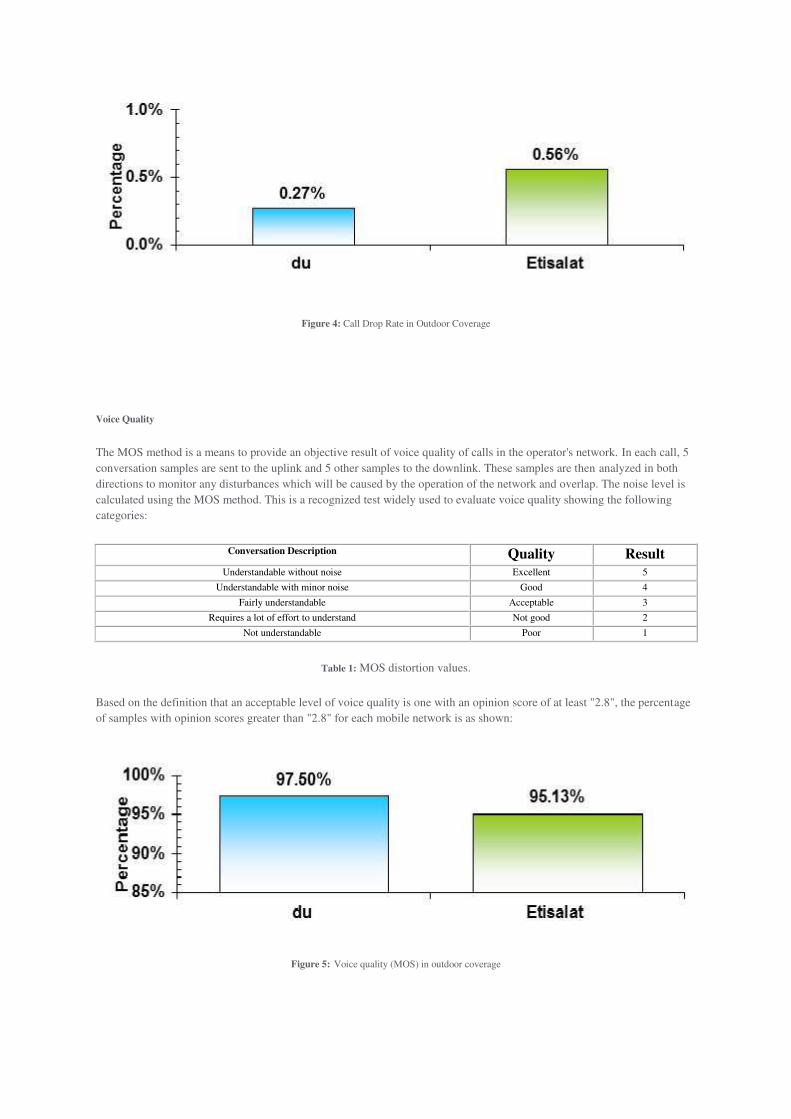
Call Drop Rate
A call is “dropped” when it is disconnected prematurely during the 120-second holding period. Call drop may occur due to
poor coverage, interference or other network related issues. The Call Drop Rate statistics for each mobile network are shown
below based on more than 13,000 voice call attempts per operator:
Figure 4: Call Drop Rate in Outdoor Coverage
Voice Quality
The MOS method is a means to provide an objective result of voice quality of calls in the operator's network. In each call, 5
conversation samples are sent to the uplink and 5 other samples to the downlink. These samples are then analyzed in both
directions to monitor any disturbances which will be caused by the operation of the network and overlap. The noise level is
calculated using the MOS method. This is a recognized test widely used to evaluate voice quality showing the following
categories:
Conversation Description Quality Result
Understandable without noise Excellent 5
Understandable with minor noise Good 4
Fairly understandable Acceptable 3
Requires a lot of effort to understand Not good 2
Not understandable Poor 1
Table 1: MOS distortion values.
Based on the definition that an acceptable level of voice quality is one with an opinion score of at least "2.8", the percentage
of samples with opinion scores greater than "2.8" for each mobile network is as shown:
Figure 5: Voice quality (MOS) in outdoor coverage
Service Outdoor Coverage
This parameter measures the availability of service coverage in the regions. Therefore it measures the network's ability to
achieve the minimum signal strength of - 100dBm..
Figure 6: Coverage level in the *Single Mode (2G) and **Dual Mode (2G/ 3G)
*Single Mode: Here the mobile device is locked to the 2G Network (GSM) and not allowed to handover to the 3G Network
(UMTS).
** Dual Mode: Here the mobile device is allowed to handover between both 2G and 3G networks based on the received
signal from the network.
Data Transfer Rate
Packet Data Performance (Throughputs): Rate at which data is transmitted over the application protocol levels. Provided in
kilobit-per-second (kbps), where 1 kilobit = 1000 bits. Both FTP & HTTP have been tested.
FTP (File Transfer Protocol): used to upload files from a workstation to a FTP server or download files from a
FTP server to a workstation. Large file (5 MB) was used for the test.
HTTP (Hyper Text Transfer Protocol): used to transfer files from a Web server onto a browser in order to view a
Web page that is on the Internet. Small file (500 KB) was used for the test.
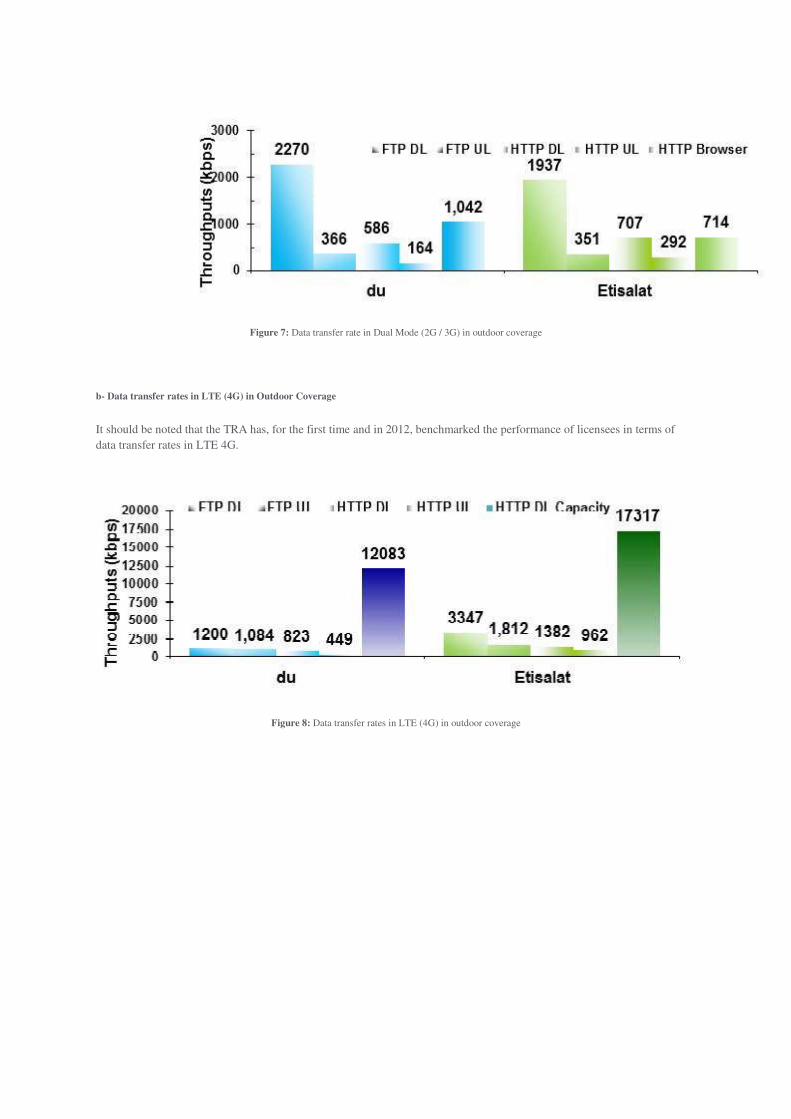
a- Data transfer rate in Dual Mode (2G / 3G) in Outdoor Coverage
Figure 7: Data transfer rate in Dual Mode (2G / 3G) in outdoor coverage
b- Data transfer rates in LTE (4G) in Outdoor Coverage
It should be noted that the TRA has, for the first time and in 2012, benchmarked the performance of licensees in terms of
data transfer rates in LTE 4G.
Figure 8: Data transfer rates in LTE (4G) in outdoor coverage
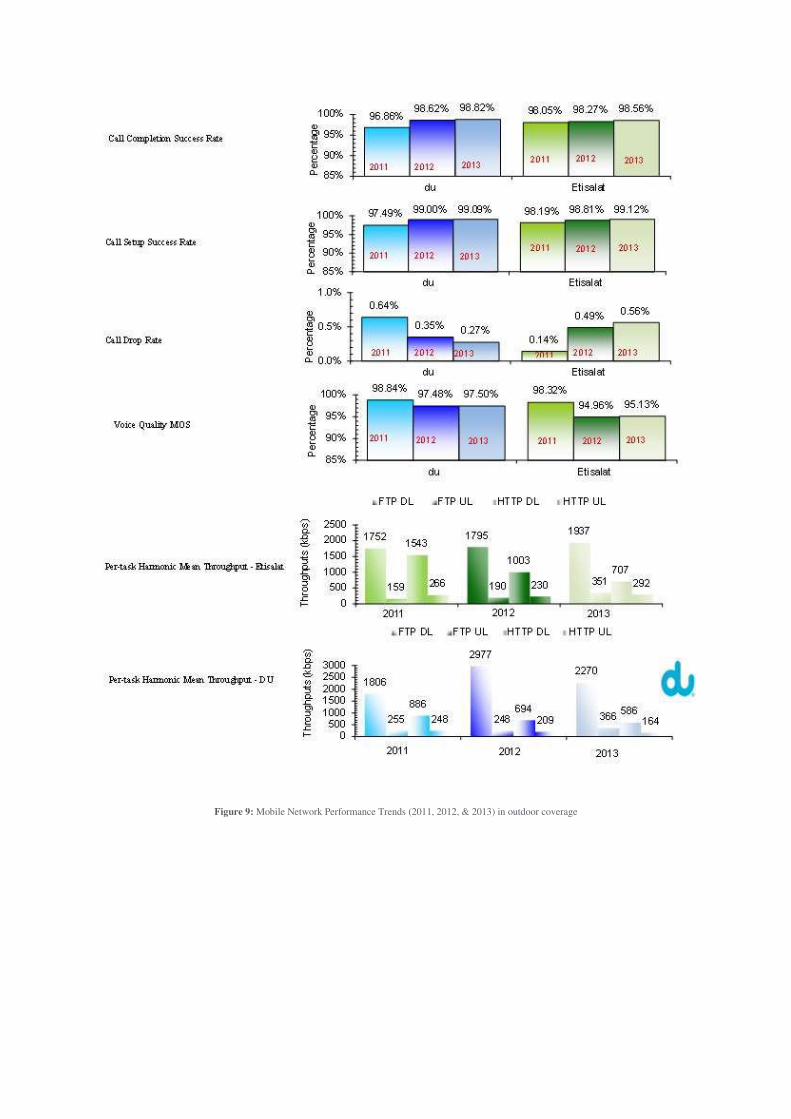
Mobile Network Performance Trends (2011, 2012 & 2013) in the Outdoor Survey
The below graph (Figure 9) compares the performance of both Etisalat’s and du’s mobile networks in terms of the major
Quality of Service Parameters (between 2011, 2012, & 2013)
Figure 9: Mobile Network Performance Trends (2011, 2012, & 2013) in outdoor coverage
1- Indoor Coverage
The TRA has conducted an Indoor Benchmarking Survey similar to the Outdoor Benchmarking Survey to a number of 34 Static Venues. The results
have shown that the licensees (etisalat and du) achieved very good results in the KPI's of voice and data services in 2G, 3G, and 4G.
Call Completion Success Rate in Indoor Coverage
Figure 10: Call Completion Success Rate in Indoor Coverage
Call Setup Success Rate Indoor Coverage
Figure 11: Call Setup Rate in Indoor Coverage
Call Drop Rate Indoor Coverage
Figure 12: Call Drop Rate in Indoor Coverage
Voice Quality Indoor Coverage
Figure 13: Voice quality (by MOS method) in indoor coverage
Data Transfer Rate Indoor Coverage
a- Data transfer rate in Dual Band (2G / 3G) Indoor Coverage
Figure 14: Data transfer rates in Dual Band (2G / 3G) in indoor coverage
b- Data transfer rates in LTE (4G) Indoor Coverage
Figure 15: Data transfer rates in LTE 4G in indoor coverage
Mobile Network Performance Trends (between 2012 & 2013) in the Indoor Survey
Call Completion
Success Rate
Call Setup Success
Rate
Call Drop Rate
Voice Quality MOS
Per-task Harmonic
Mean Throughput in Dual Mode (2G/3G)
Per-task Harmonic
Mean Throughput in
LTE
Figure 16: Mobile Network Performance Trends (between 2012 & 2013) in the Indoor Survey
98.42% 99.06%99.06% 99.05%
85%
90%
95%
100%
du Etisalat
Perc
enta
ge
99.02% 99.28%99.63% 99.57%
85%
90%
95%
100%
du Etisalat
Perc
enta
ge
0.61%
0.44%0.56% 0.52%
0.0%
0.5%
1.0%
du Etisalat
Perc
enta
ge
97.14% 97.20%98.49% 98.31%
85%
90%
95%
100%
du Etisalat
Perc
enta
ge
3329
2320 23251907
200 203 201 323763 567
1490
845
176 130 219 241
1082758
0
1000
2000
3000
4000
2012 Du 2013 Du 2012 Etisalat 2013 Etisalat
Th
roughput
(kbps)
FTP DL FTP UL HTTP DL HTTP UL HTTP Browser
1039 1038
2375
3606
206501 243
568759 827
3460
1190
240 315 276 404
0
1000
2000
3000
4000
5000
2012 Du (LTE) 2013 Du (LTE) 2012 Etisalat (LTE) 2013 Etisalat (LTE)
Th
roughput
(kbps)
FTP DL FTP UL HTTP DL HTTP UL
2012
2012
2012
2012
2012
2012
2012
2012
2013
2013
2013
2013
2013
2013
2013
2013
Conclusion
It should be noted that the results were benchmarked against other similar Benchmarking Surveys conducted by other countries worldwide. The
telecom sector in UAE represented by the Licensees (etisalat and du) has achieved a competitive performance which has exceeded other countries in
some KPI's such as Call Completion Success Rate, Call Drop Rate, and Data Transfer Rate.