Page 1
Mobile networks
performance in Ghana
January 2021
About SpeedChecker
Since 2008 we have helped millions of users get a better
understanding of how to make their Internet go faster. Our
solutions empower mobile and fixed operators, regulators and
researchers in making their Internet infrastructure better and
more available for everyone.
We do that by providing end-users tools such as websites or
mobile apps and offer crowdsourcing systems and data to the
businesses and organizations.
We collect real world end user experience through our passive
and active measurement technology, combined with unique
regional and global partnerships with thousands of apps.
More about SpeedChecker here
Page 2
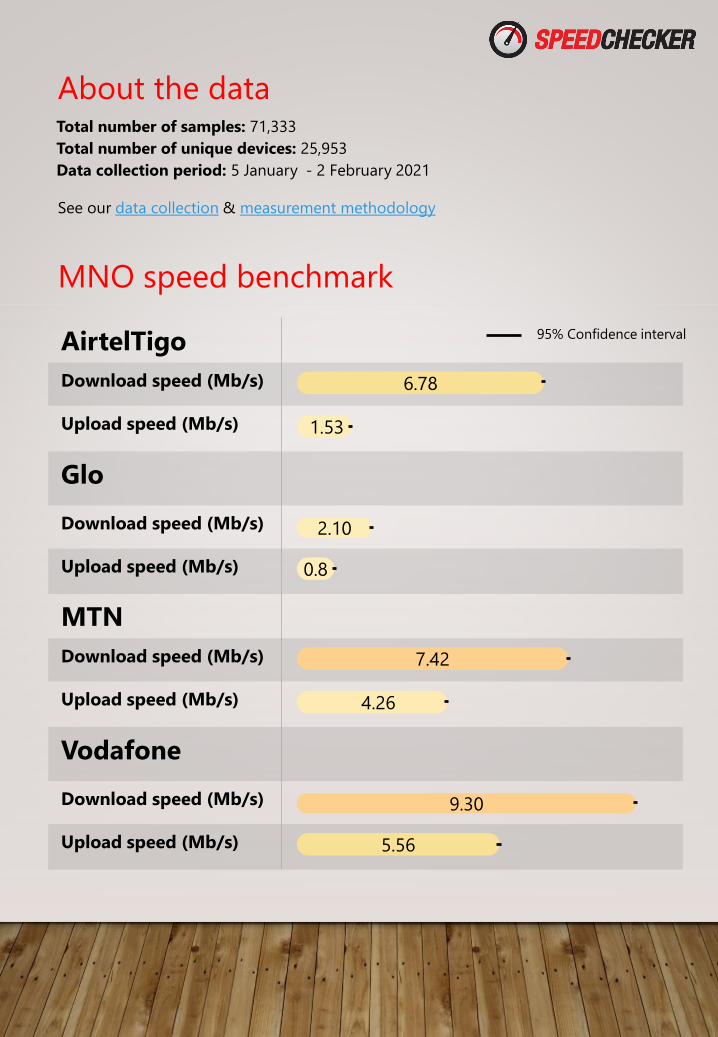
About the data
MNO speed benchmark
AirtelTigo
Download speed (Mb/s)
Upload speed (Mb/s)
Glo
Download speed (Mb/s)
Upload speed (Mb/s)
95% Confidence interval
See our data collection & measurement methodology
Total number of samples: 71,333
Total number of unique devices: 25,953
Data collection period: 5 January - 2 February 2021
2.10
1.53
0.8
6.78
MTN
Download speed (Mb/s)
Upload speed (Mb/s)
Vodafone
Download speed (Mb/s)
Upload speed (Mb/s)
9.30
4.26
5.56
7.42
Page 3
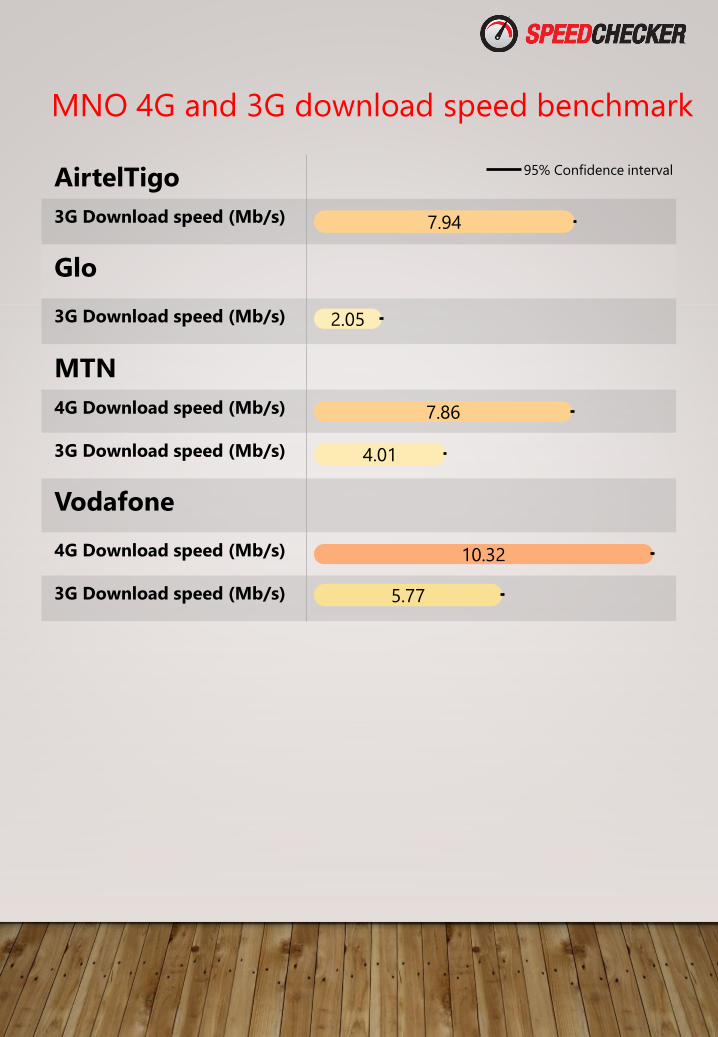
MNO 4G and 3G download speed benchmark
AirtelTigo
3G Download speed (Mb/s)
Glo
3G Download speed (Mb/s)
95% Confidence interval
2.05
7.94
MTN
4G Download speed (Mb/s)
3G Download speed (Mb/s)
Vodafone
4G Download speed (Mb/s)
3G Download speed (Mb/s)
10.32
4.01
5.77
7.86
Page 4
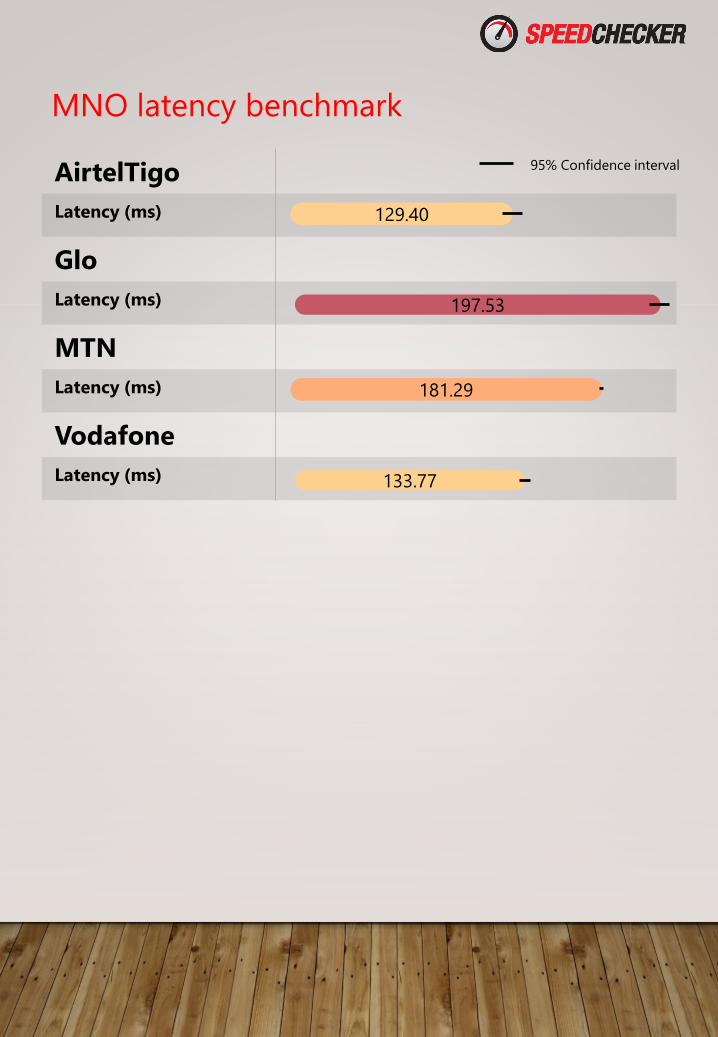
MNO latency benchmark
AirtelTigo
Latency (ms)
Glo
Latency (ms)
95% Confidence interval
197.53
129.40
MTN
Latency (ms)
Vodafone
Latency (ms) 133.77
181.29
Page 5
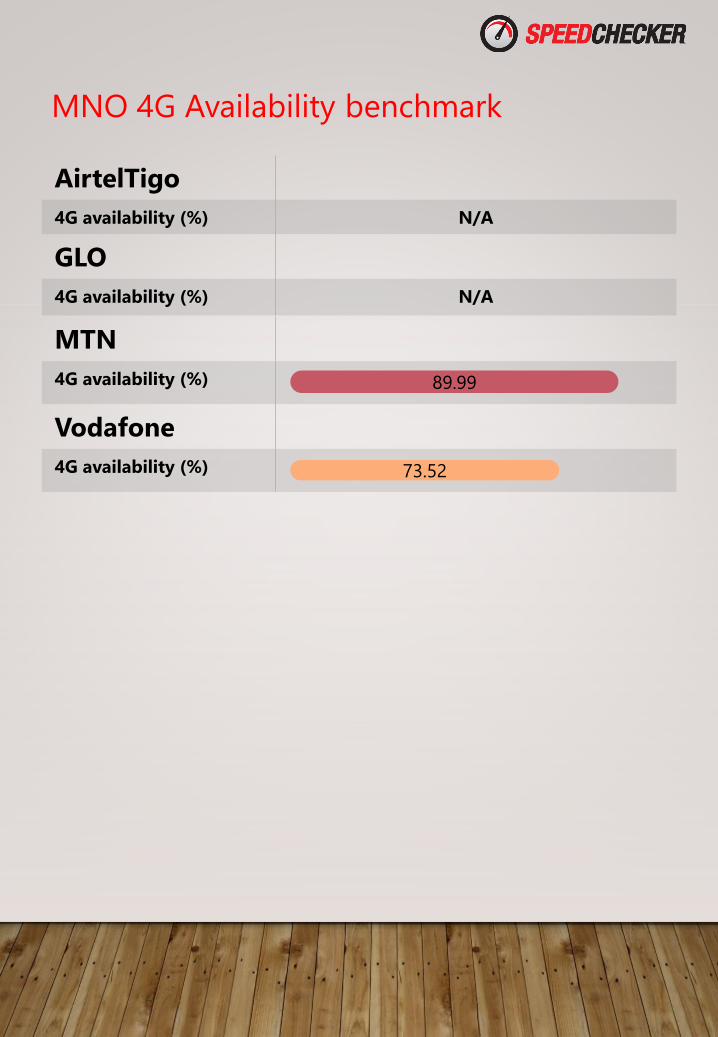
MNO 4G Availability benchmark
AirtelTigo
4G availability (%) N/A
GLO
4G availability (%) N/A
MTN
4G availability (%)
Vodafone
4G availability (%) 73.52
89.99
Page 6
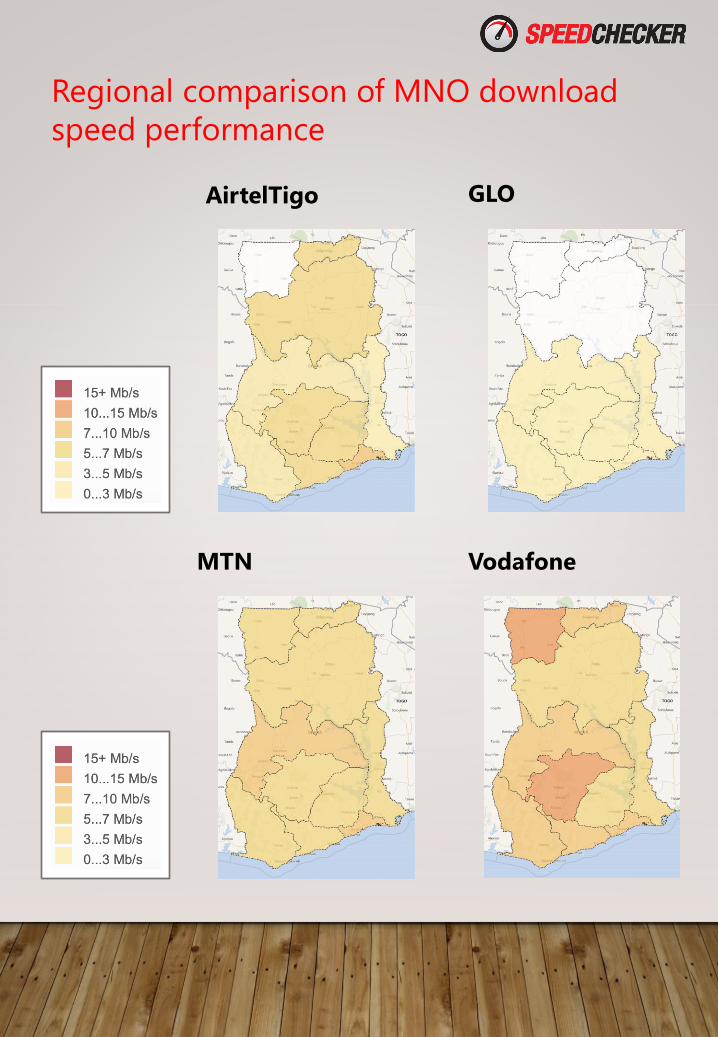
Regional comparison of MNO download
speed performance
AirtelTigo GLO
MTN Vodafone
Page 7
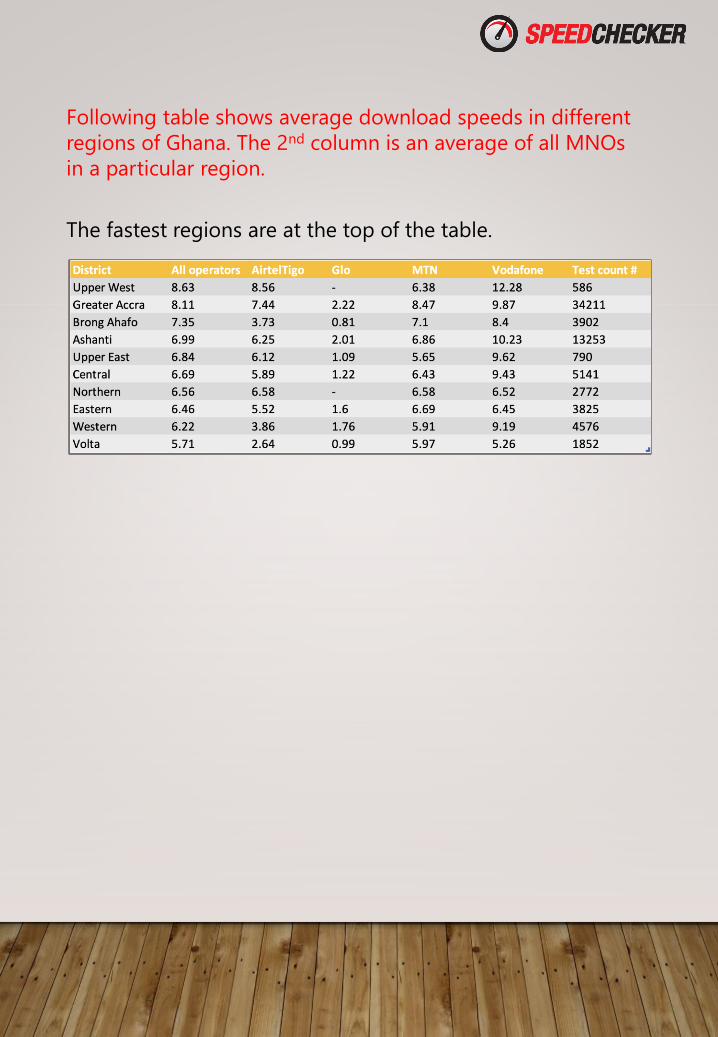
Following table shows average download speeds in different
regions of Ghana. The 2nd column is an average of all MNOs
in a particular region.
The fastest regions are at the top of the table.
Page 8
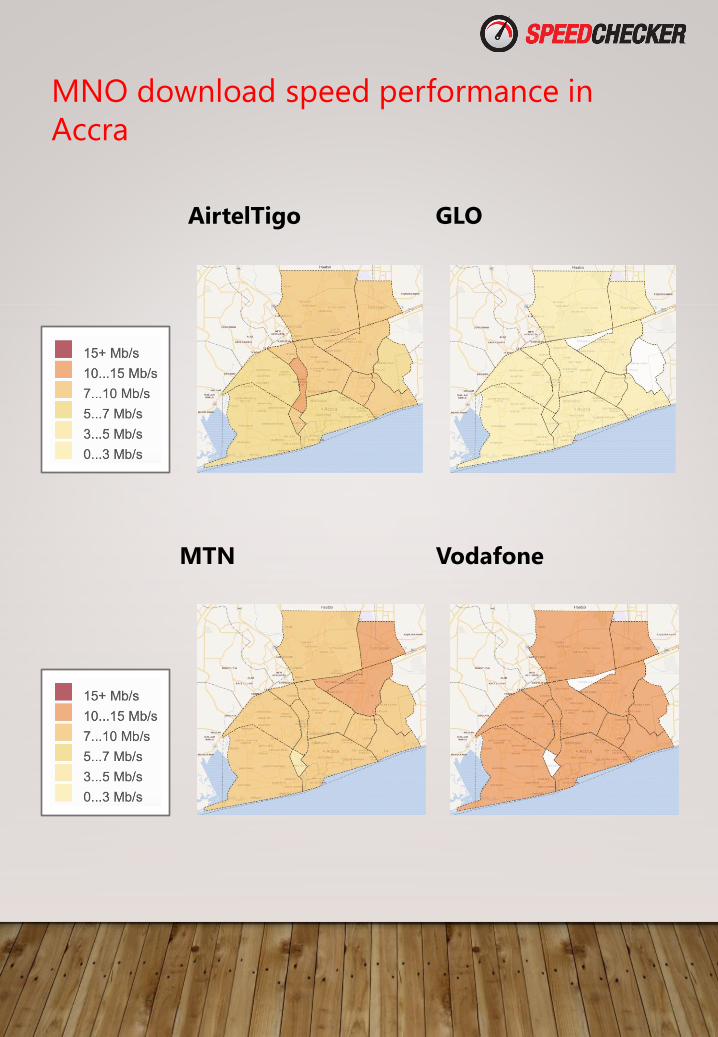
MNO download speed performance in
Accra
AirtelTigo GLO
MTN Vodafone
Page 9
ARE YOU LOOKING FOR MORE DETAILED CROWDSOURCED DATA IN GHANA ?
What you see in this free report is a high-level snapshot
of the crowdsourced data we offer to our clients. Our
crowdsourcing system contains billions of data points
collected from mobile devices worldwide. Unlike our
competitors, we can sell access to the data with different
granularity: Our clients can pick data they need with
significant cost savings associated with a reduced scope.
CONTACT US FOR MORE INFORMATION
Page 10
Flexibility is in our DNA
Our customers value our flexible and modular approach in delivering
our solutions. There is no one size fits all in providing crowdsourcing
projects. Customers increasingly require tailored solutions which will
satisfy all technical, operational and legal requirements.
With reduced scope comes reduced price. Our Basic KPI set is
a more cost effective way to get speed test data. Our
Advanced KPI set is more comprehensive with 100+ active
and passive KPIs.
Crowdsourcing is about trade-offs. Do you want more tests
or do you want tests to run longer ? Do you want to collect
data passively without impacting the network and user
bandwidth or run active tests which will stress and assess the
capacity better?
Do you want us to host the solution for fast & easy
deployment or require data to be within your data center for
compliance reasons.
You not only want the data but you also want your own app
or web-based tester? We can do it all. Our team can produce
iOS, Android, HTML, Windows and MAC clients tailored to
your specific needs.
CONTACT US FOR MORE INFORMATION
Page 11
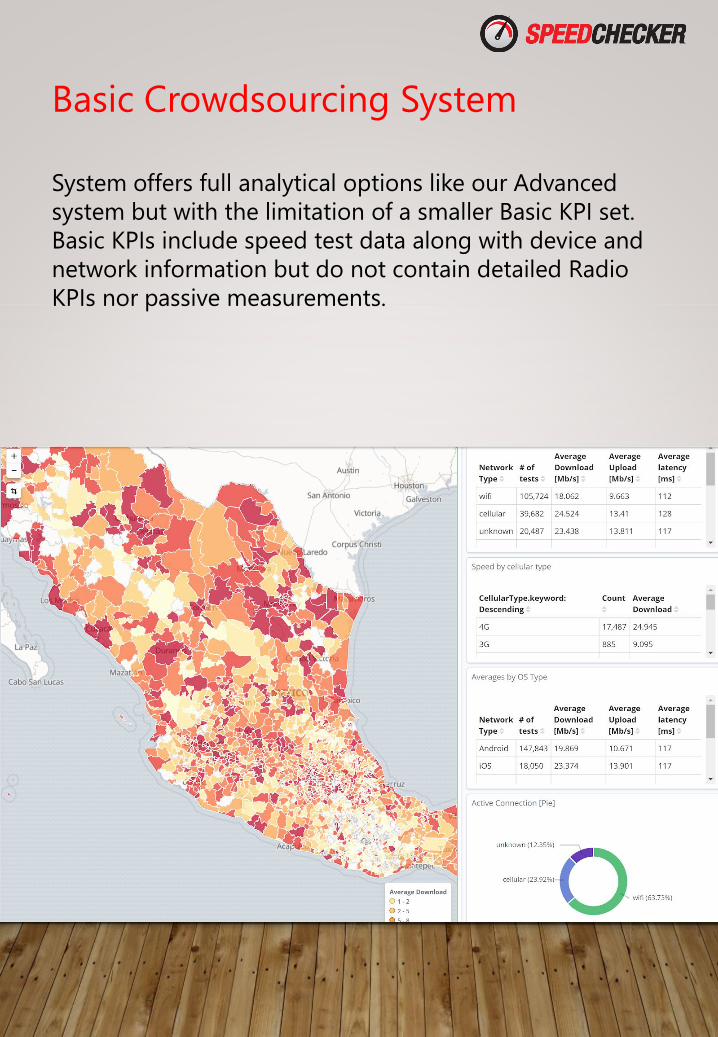
Basic Crowdsourcing System
System offers full analytical options like our Advanced
system but with the limitation of a smaller Basic KPI set.
Basic KPIs include speed test data along with device and
network information but do not contain detailed Radio
KPIs nor passive measurements.
Page 12
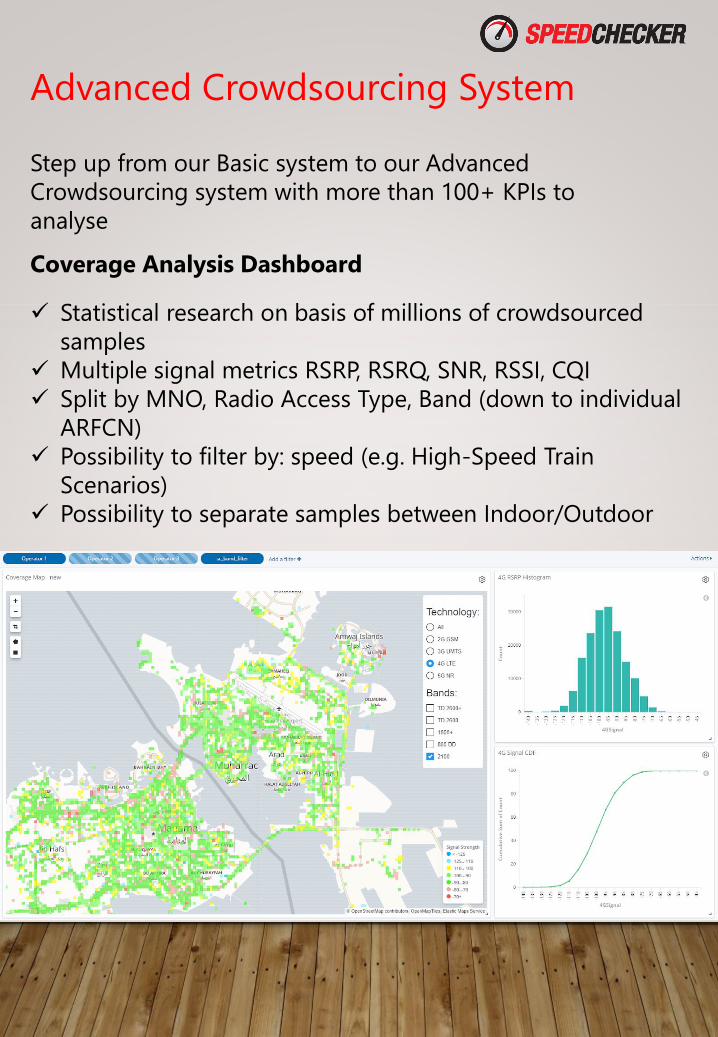
Advanced Crowdsourcing System
Step up from our Basic system to our Advanced
Crowdsourcing system with more than 100+ KPIs to
analyse
Coverage Analysis Dashboard
✓ Statistical research on basis of millions of crowdsourced
samples
✓ Multiple signal metrics RSRP, RSRQ, SNR, RSSI, CQI
✓ Split by MNO, Radio Access Type, Band (down to individual
ARFCN)
✓ Possibility to filter by: speed (e.g. High-Speed Train
Scenarios)
✓ Possibility to separate samples between Indoor/Outdoor
Page 13
Advanced Crowdsourcing System
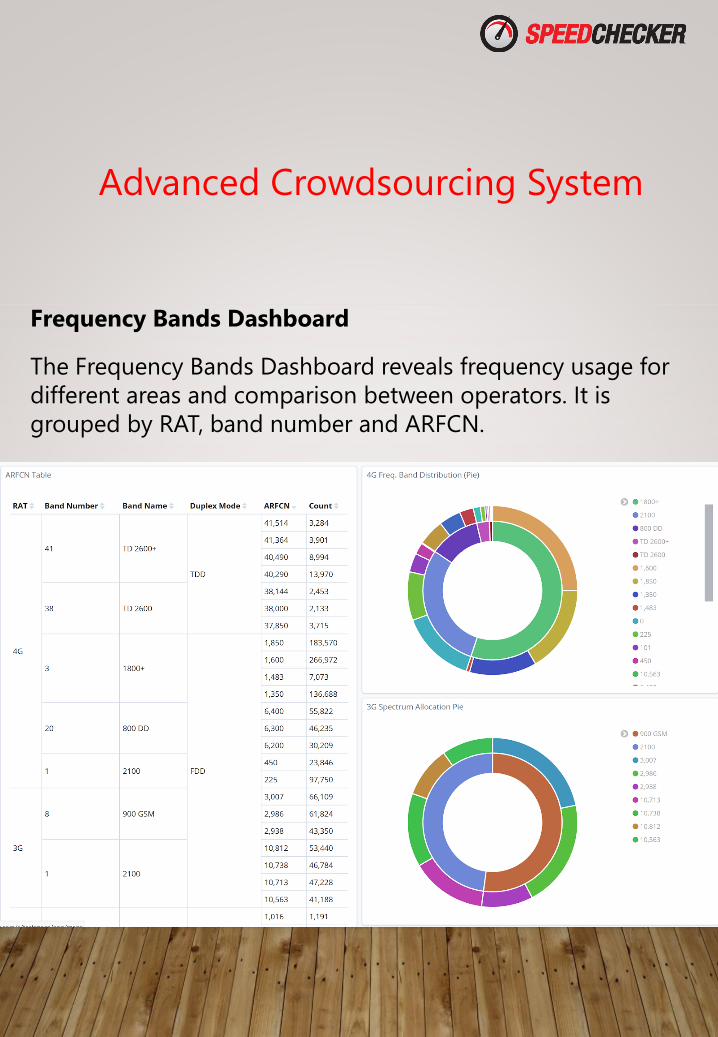
Frequency Bands Dashboard
The Frequency Bands Dashboard reveals frequency usage for
different areas and comparison between operators. It is
grouped by RAT, band number and ARFCN.
Page 14
Advanced Crowdsourcing System
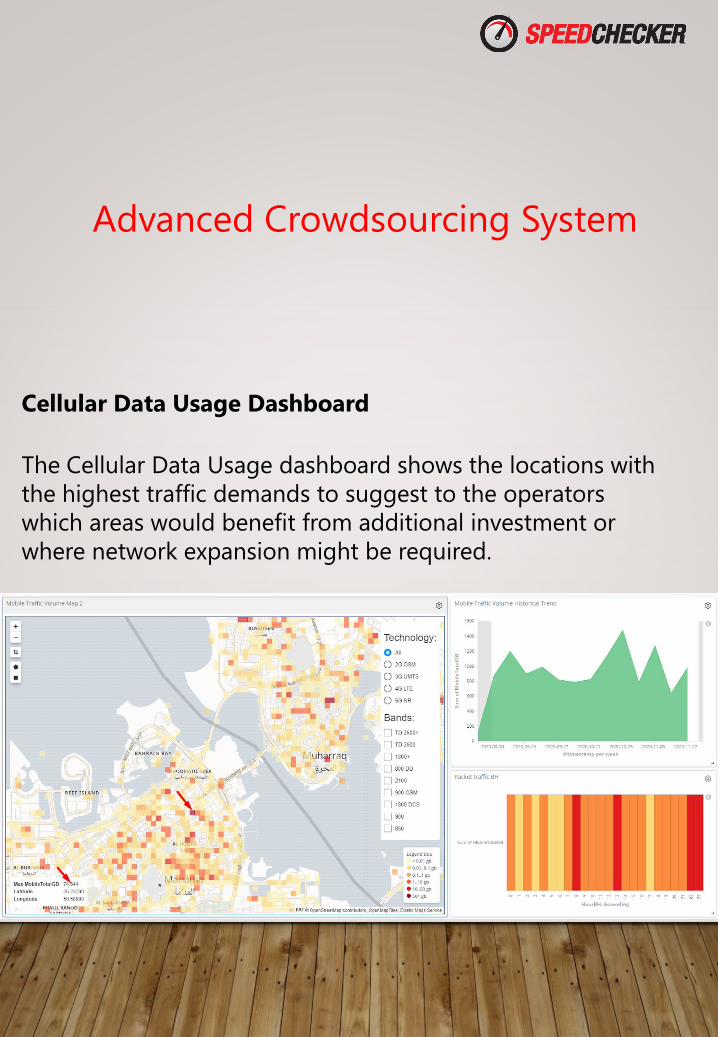
Cellular Data Usage Dashboard
The Cellular Data Usage dashboard shows the locations with
the highest traffic demands to suggest to the operators
which areas would benefit from additional investment or
where network expansion might be required.
Page 15
Advanced Crowdsourcing System
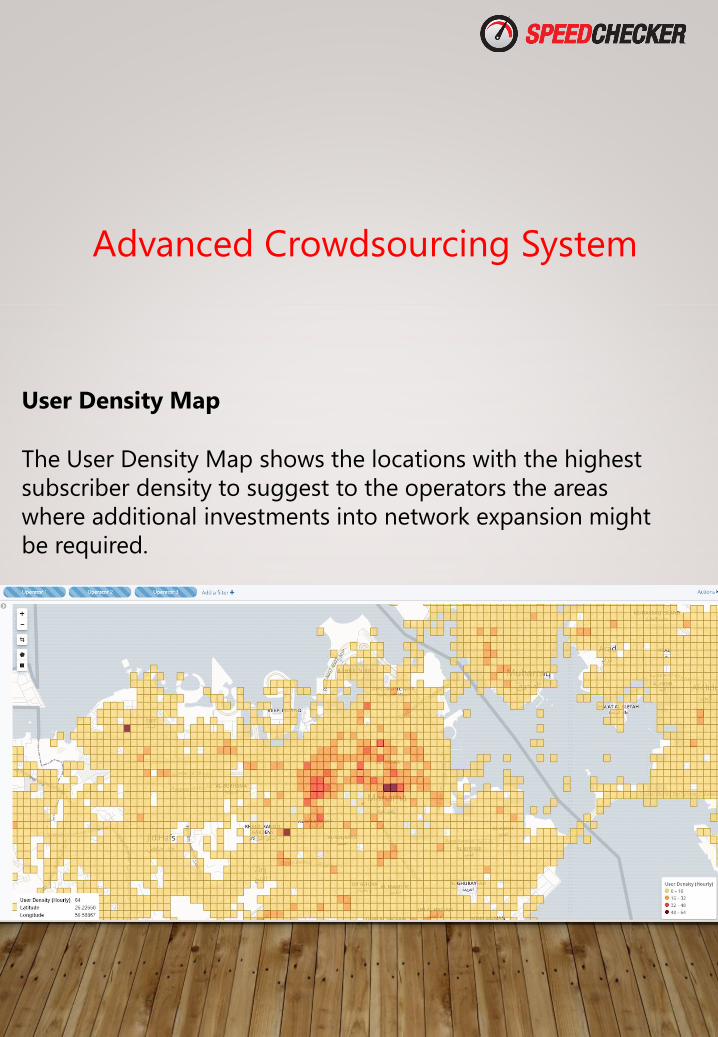
User Density Map
The User Density Map shows the locations with the highest
subscriber density to suggest to the operators the areas
where additional investments into network expansion might
be required.
Page 16
Advanced Crowdsourcing System
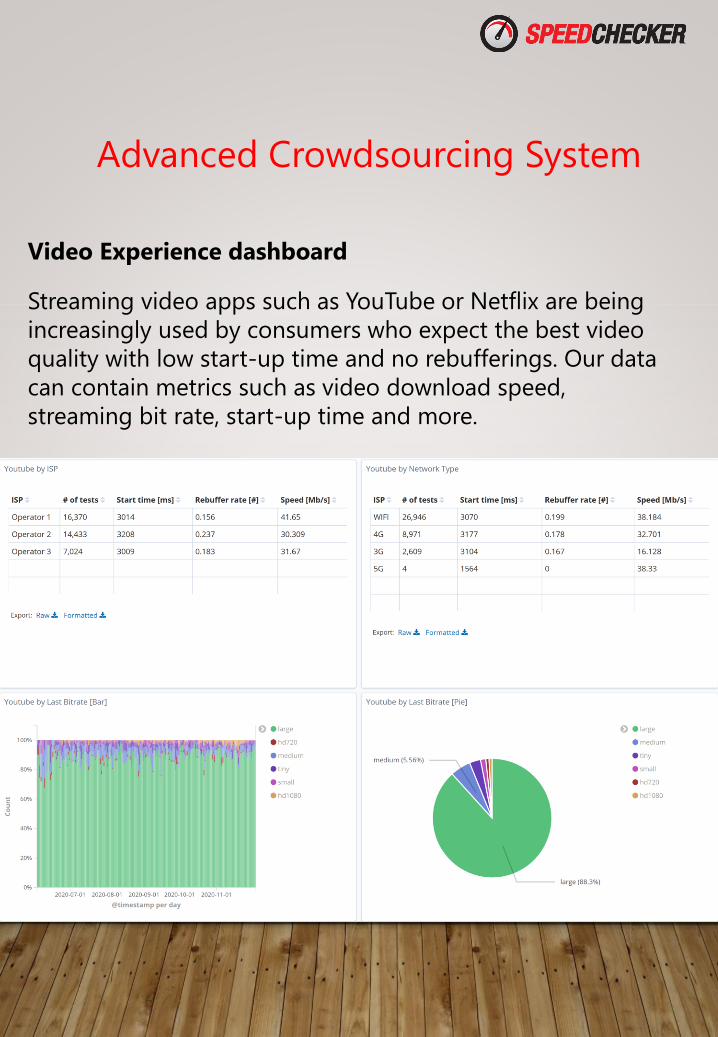
Video Experience dashboard
Streaming video apps such as YouTube or Netflix are being
increasingly used by consumers who expect the best video
quality with low start-up time and no rebufferings. Our data
can contain metrics such as video download speed,
streaming bit rate, start-up time and more.
Page 17
Advanced Crowdsourcing System
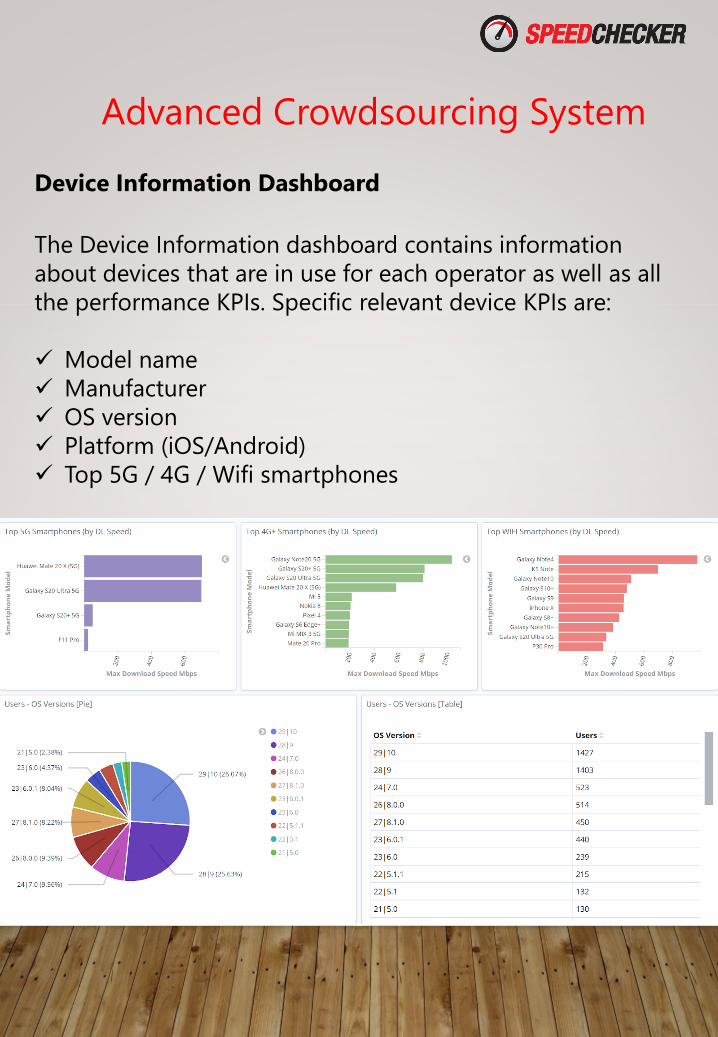
Device Information Dashboard
The Device Information dashboard contains information
about devices that are in use for each operator as well as all
the performance KPIs. Specific relevant device KPIs are:
✓ Model name
✓ Manufacturer
✓ OS version
✓ Platform (iOS/Android)
✓ Top 5G / 4G / Wifi smartphones
Page 18
Advanced Crowdsourcing System
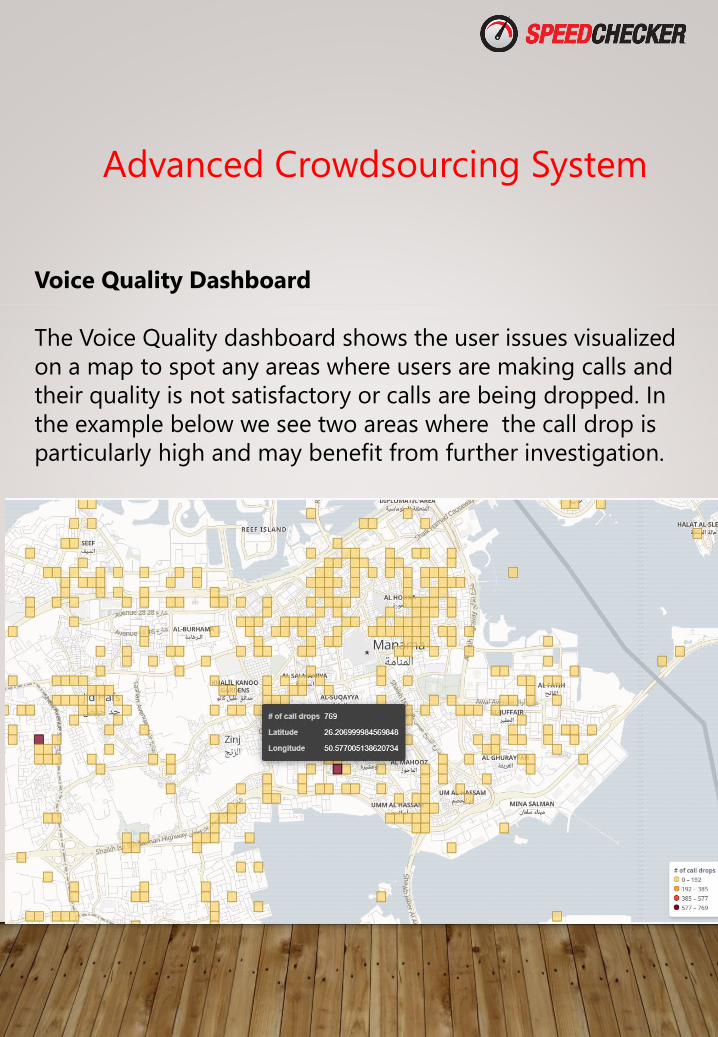
Voice Quality Dashboard
The Voice Quality dashboard shows the user issues visualized
on a map to spot any areas where users are making calls and
their quality is not satisfactory or calls are being dropped. In
the example below we see two areas where the call drop is
particularly high and may benefit from further investigation.
Page 19
Data collection methodology
Our data is collected from end user devices running Android
and iOS systems. All measurements are executed towards a
CDN which has a large geographical footprint and hosts a
significant part of the content that is being accessed by the
users. This ensures our results are a good approximation of
the user’s actual quality of experience.
All measurements must contain accurate location
information using GPS or wi-fi geolocation method.
Measurements are considered only from the apps that have
been approved by SpeedChecker. Submitted measurements
are checked if they are within expected ranges and
additional security precautions are implemented to ensure
measurement data is not being manipulated.
The data collection process aims to deliver a single
measurement sample from every device in our
crowdsourcing system device pool and we strive to remove
all duplicates. Due to privacy settings on some users phones
we cannot reliably detect unique devices therefore some
devices have contributed to more than 1 measurement into
this dataset.
CONTACT US FOR MORE INFORMATION
Page 20
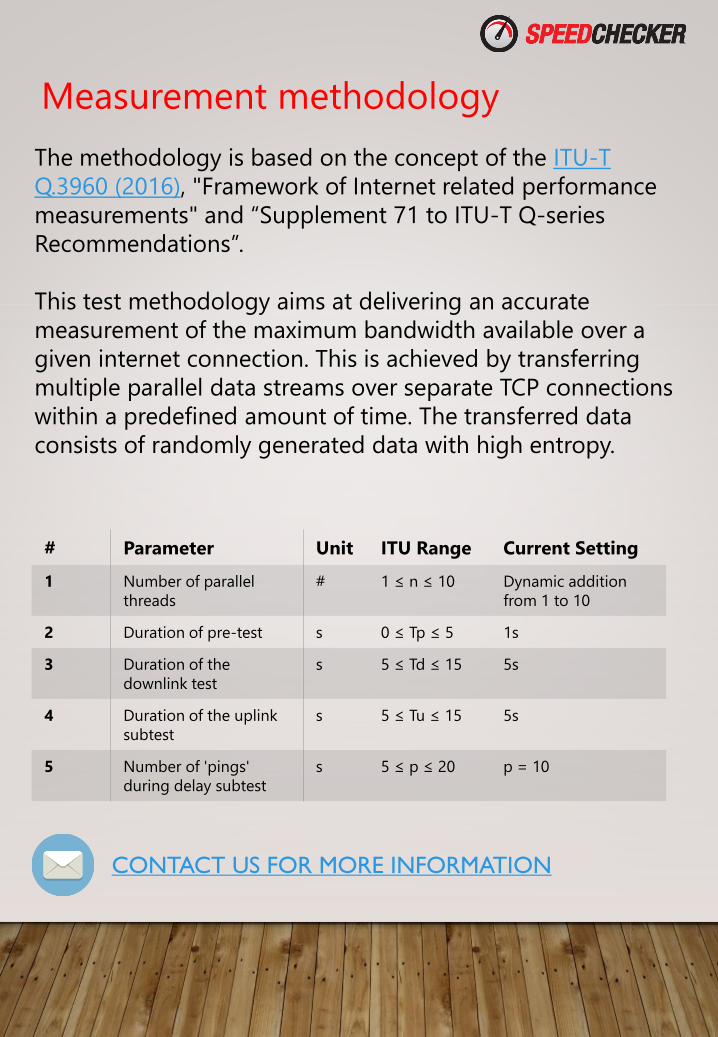
Measurement methodology
The methodology is based on the concept of the ITU-T
Q.3960 (2016), "Framework of Internet related performance
measurements" and “Supplement 71 to ITU-T Q-series
Recommendations”.
This test methodology aims at delivering an accurate
measurement of the maximum bandwidth available over a
given internet connection. This is achieved by transferring
multiple parallel data streams over separate TCP connections
within a predefined amount of time. The transferred data
consists of randomly generated data with high entropy.
# Parameter Unit ITU Range Current Setting
1 Number of parallel
threads
# 1 ≤ n ≤ 10 Dynamic addition
from 1 to 10
2 Duration of pre-test s 0 ≤ Tp ≤ 5 1s
3 Duration of the
downlink test
s 5 ≤ Td ≤ 15 5s
4 Duration of the uplink
subtest
s 5 ≤ Tu ≤ 15 5s
5 Number of 'pings'
during delay subtest
s 5 ≤ p ≤ 20 p = 10
CONTACT US FOR MORE INFORMATION