Mobility Emulation on a fixed grid of 802.11 radios Suhas Mathur [email protected]Sanjit Krishnan Kaul [email protected]Abstract - Purely computer based simulators for wireless systems, such as ns-2, often fail to include critical details of a wireless environment and only provide limited support for wireless and network parameters that are becoming increasingly im- portant with the advent of next generation wire- less systems. The ORBIT (Open Access Research Test bed for Next-Generation Wireless Networks) system consists of an indoor ”radio grid emulator” and an outdoor ”field trial system” to be used for different stages of protocol design, evaluation and testing. A 64-node radio grid emulator is cur- rently operational. An important area where the ORBIT grid will be able to help researchers is the testing of protocols and scenarios involving mobil- ity. This requires the integration of an adequate mobility emulation system into ORBIT. This pa- per discusses in detail, the design and working of the mobility emulation system along with some of the performance metrics that may be useful in characterizing the performance of the emulator. I. INTRODUCTION The emulation of mobility on a static grid is a chal- lenging problem. A mobility emulator of the type we have designed is likely to be an indispensable tool to the research community. In this paper, we discuss the essential features of our emulator’s design, its detailed working, measurement mechanisms and some of the parameters that we are trying to emulate. We also provide several measurement results from our investi- gations on the ORBIT grid that have helped us in our design. This paper is organized in 5 sections. In section II, we provide a broad introduction to the problem of mobility emulation, section III delves into the details of the emulator concept and design, section IV talks about Figure 1: Schematic showing the concept of emulated mobility. We attempt to ’approximate’ the continuous motion of a mobile terminal by a path consisting of discrete steps on the ORBIT grid the emulation of the small scale signal characteristics brought about mobility and in Section V we describe the emulation of a mobile Ad-hoc network using our emulator. The ORBIT grid consists of 64 independent nodes ar- ranged in an 8 * 8 square grid. Each node is based on an off-the-shelf PC platform with some modifications (1 Ghz VIA c3 processor with 512 MB RAM and a 20 GB local Hard disk). It has several communication interfaces: • Two 100BaseT Ethernet ports • Two mini-PCI based 802.11 a/b/g wireless interfaces • A bluetooth port • USB ports • One PCI interface for further expansion • Integrated chassis manager 1
Transcript
Mobility Emulation on a fixed grid of 802.11 radios
Abstract - Purely computer based simulators forwireless systems, such as ns-2, often fail to includecritical details of a wireless environment and onlyprovide limited support for wireless and networkparameters that are becoming increasingly im-portant with the advent of next generation wire-less systems. The ORBIT (Open Access ResearchTest bed for Next-Generation Wireless Networks)system consists of an indoor ”radio grid emulator”and an outdoor ”field trial system” to be used fordifferent stages of protocol design, evaluation andtesting. A 64-node radio grid emulator is cur-rently operational. An important area where theORBIT grid will be able to help researchers is thetesting of protocols and scenarios involving mobil-ity. This requires the integration of an adequatemobility emulation system into ORBIT. This pa-per discusses in detail, the design and working ofthe mobility emulation system along with someof the performance metrics that may be useful incharacterizing the performance of the emulator.
I. INTRODUCTION
The emulation of mobility on a static grid is a chal-lenging problem. A mobility emulator of the type wehave designed is likely to be an indispensable tool tothe research community. In this paper, we discuss theessential features of our emulator’s design, its detailedworking, measurement mechanisms and some of theparameters that we are trying to emulate. We alsoprovide several measurement results from our investi-gations on the ORBIT grid that have helped us in ourdesign. This paper is organized in 5 sections. In sectionII, we provide a broad introduction to the problem ofmobility emulation, section III delves into the details ofthe emulator concept and design, section IV talks about
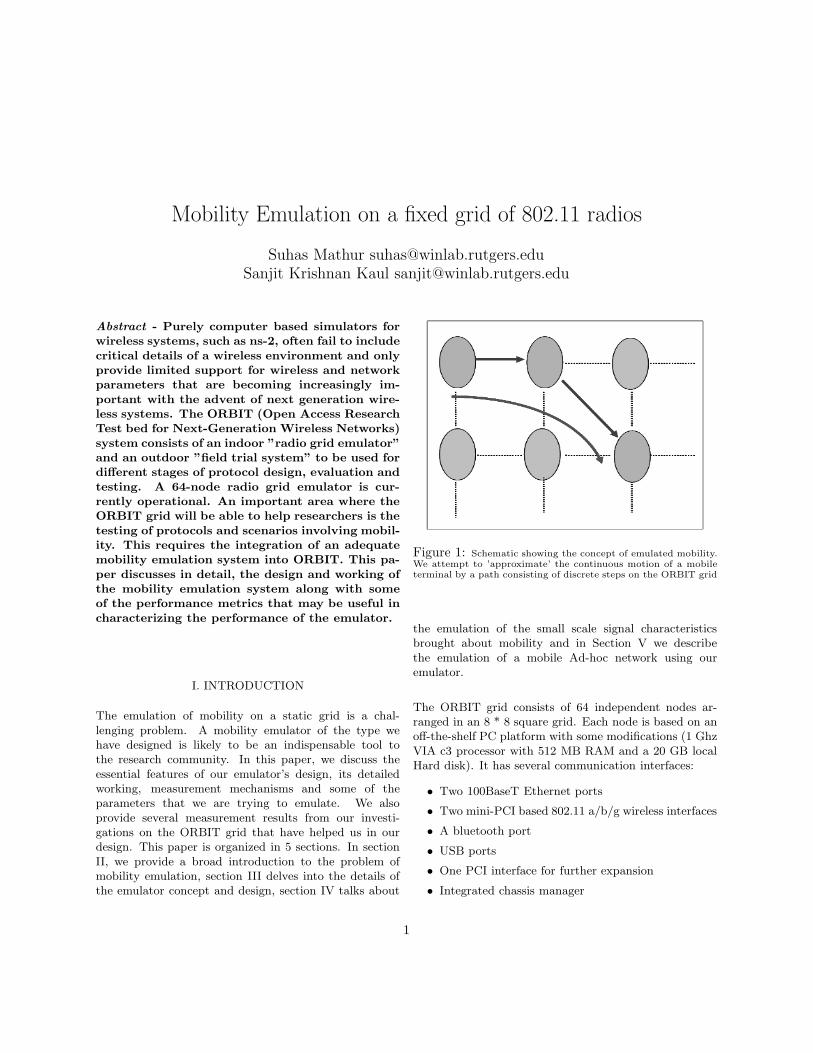
Figure 1: Schematic showing the concept of emulated mobility.We attempt to ’approximate’ the continuous motion of a mobileterminal by a path consisting of discrete steps on the ORBIT grid
the emulation of the small scale signal characteristicsbrought about mobility and in Section V we describethe emulation of a mobile Ad-hoc network using ouremulator.
The ORBIT grid consists of 64 independent nodes ar-ranged in an 8 * 8 square grid. Each node is based on anoff-the-shelf PC platform with some modifications (1 GhzVIA c3 processor with 512 MB RAM and a 20 GB localHard disk). It has several communication interfaces:
• Two 100BaseT Ethernet ports
• Two mini-PCI based 802.11 a/b/g wireless interfaces
• A bluetooth port
• USB ports
• One PCI interface for further expansion
• Integrated chassis manager
1
The mobility emulator utilizes the infrastructure providedby the ORBIT grid. Apart from the hardware compo-nents listed above, a number of software components areintegral to the design of our emulation system, the detailsof which are provided in the next section. Providing mo-bility support in ORBIT without physical movement is abig challenge, as movable parts constitute an even biggermaintenance challenge. The current design of the emu-lator takes the approach wherein the mobile applicationresides on a server off the grid using a virtual wirelessdevice. The basic idea behind the design of our mobilityemulator is the spatial switching of control nodes. Thevirtual driver connects through a tunnel to a node with areal wireless interface which simply forwards all receivedpackets into the tunnel and transmits all packets com-ing from the tunnel. Mobility is accomplished by simplyredirecting the tunnel to a node at a different locationaccording to a specific mobility pattern. The redirectionfunction is performed by the Click modular router devel-oped at MIT.
II. MOBILTY EMULATION APPLICATIONS
The emulation of mobility on the ORBIT grid opens thedoors to a wide gamut of research applications. Considerfor instance a researcher attempting to investigate thebehavior of a mobile device inside a vehicle as the vehicledrives past an access point with a certain velocity. Evena simple scenario such as this one involves several aspectsof radio propagation and network performance whichare far from captured in present day simulators such asns-2. The ORBIT mobility emulator, on the other hand,inherently takes care of practical issues in mobility suchas radio propagation characteristics, the effects of noiseand interference, etc.
Consider now, a more complex scenario consisting of anad-hoc wireless environment in which several mobile usersparticipate. Every mobile user moves independently ofothers and wishes to communicate with another user inthe ad-hoc environment. This scenario simultaneouslyincludes several aspects of mobile communications suchas dynamic routing and multi-hop communication.The ORBIT mobility emulator would make it simplefor a user to investigate such a scenario by providinginput parameters associated with the scenario andobtain behavioral measurements after running a mobility
0
2
4
6
8
12
34
56
78
−90
−85
−80
−75
−70
−65
−60
−55
−50
X co−ordinate on gridY co−ordinate on grid
RS
SI (
dB)
Figure 2: A preliminary measurement of signal strength in theORBIT lab with one transmitter placed at (1,1) and signal atten-uation = 23 dB. The general trend is of exponential fall-off whichis the expected behavior of signal strength according to the pathloss formula. The ripples are due to uneven signal reflections inthe room leading to a specific radio environment with constructiveinterference at some places and destructive interference at others.
emulation for the desired system. We later demonstratethe working of an AODV ad-hoc routing protocol overthe emulator, between a pair of mobile nodes followingrandom walk trajectories.
The ORBIT grid currently consists of and 8 * 8 grid of 64nodes and will be expanded to an indoor environment of20 * 20 grid of 400 nodes. In the preliminary design of theemulator, it was essential to derive information about thespatial variation of signal parameters across the presentgrid, such as signal strength variation and network per-formance at different points on the grid. These results areshown as plots for signal strength variation 1 and ’ping’throughput when the node (1,1) was set up as a transmit-ter in one corner of the grid with an attenuator antennaof 23 dB.
Preliminary measurements showed that it was possibleto control the amount of available signal power acrossthe grid and thus control the network performance atdifferent grid locations. This would be an importantsetup for instance in the example discussed abovewherein a mobile terminal drives past an access point it
1RSSI, Received Signal Strength Indicator, measured usinga handheld Berkeley Yellow Jacket signal analysis device for802.11 g/b signals
2
0
2
4
6
8
12
34
56
78
−20
0
20
40
60
80
100
120
X co−ordinate on gridY co−ordinate on grid
Per
cent
age
thro
ughp
ut
Figure 3: Measurement results for percentage packet transmis-sion on a simple ”ping” experiment carried out at different posi-tions on the ORBIT grid. A single transmitter was placed at thelocation (1,1). The curve was made smooth using polynomial in-terpolation. Again the abnormal dips and peaks indicate the radioenvironment in the room
is associated with, first entering transmission range ofthe cell, spending some time inside it and then leavingit, with a specified trajectory. While the use of anattenuator on a stationary transmitter allows effectivecreation of a signal threshold boundary for a cell, thisapproach would not be feasible in a situation wherewe have only mobile terminal communication with oneanother (unless we used attenuators on each of the nodes).
An effective alternative to this has been the use of anoise generator to strain the communication links be-tween nodes and thus model the effect of increased dis-tance. The use of noise generator antennae on the ORBITgrid has been productive to the design of ad-hoc multi-hop routing scenarios. Plots shown for percentage packetdrops over the grid when node (8,8) was the transmitterconfirm that packet drop ratios are higher in the regionsclose to the noise generator antennae (located at (2,2),(2,7), (7,2) and (8,8)). As the noise level is raised, largerpercentages of packets are dropped indicating worseningof the communication link between (8,8) and the partic-ular node under consideration. As explained in sectionV, such measurements made for all possible transmitterlocations, can be useful in designing schemes involvingmulti-hop communications for testing scenarios that con-sist of a muliti-hop communication mobile environment.
0
10
20
30
40
50
60
70
80
90
100
0
2
4
6
8
12
34
56
78
0
20
40
60
80
100
Percentage frame loss at No Noise
Figure 4: Packet drop profile at no noise. The transmitter is at(8,8)
0
10
20
30
40
50
60
70
80
90
100
0
2
4
6
8
12
34
56
78
0
20
40
60
80
100
Percentage frame loss at Noise = −15 dBm
Figure 5: Packet drop profile at -15 dBm noise. The transmitteris at (8,8)
3
0
10
20
30
40
50
60
70
80
90
100
0
2
4
6
8
12
34
56
78
0
20
40
60
80
100
Percentage frame loss at Noise = 10 dBm
Figure 6: Packet drop profile at -10 dBm noise. The transmitteris at (8,8)
0
10
20
30
40
50
60
70
80
90
100
0
2
4
6
8
12
34
56
78
0
20
40
60
80
100
Percentage frame loss at Noise = −5 dBm
Figure 7: Packet drop profile at -5 dBm noise. The transmitteris at (8,8)
0
10
20
30
40
50
60
70
80
90
100
0
2
4
6
8
12
34
56
78
0
20
40
60
80
100
Percentage frame loss at Noise = 0 dBm
Figure 8: Packet drop profile at 0 dBm noise. The transmitteris at (8,8)
0
10
20
30
40
50
60
70
80
90
100
0
2
4
6
8
12
34
56
78
−20
0
20
40
60
80
100
120
Percentage frame loss at Noise = 5 dBm
Figure 9: Packet drop profile at 5 dBm noise. The transmitteris at (8,8)
4
0
10
20
30
40
50
60
70
80
90
100
0
2
4
6
8
12
34
56
78
0
20
40
60
80
100
Percentage frame loss at Noise = 10 dBm
Figure 10: Packet drop profile at 10 dBm noise. The transmitteris at (8,8)
0
10
20
30
40
50
60
70
80
90
100
0
2
4
6
8
12
34
56
78
−20
0
20
40
60
80
100
120
Percentage frame loss at Noise = 15 dBm
Figure 11: Packet drop profile at 15 dBm noise. The transmitteris at (8,8)
III. EMULATOR DESIGN
We define mobility emulation as imitating the motion ofa mobile node, moving in an ad-hoc radio environment,on a grid of constant number of static nodes. The ideais to simulate on the static grid the velocity, directionand last but not the least the radio environment of themobile node. We shall call the mobile to be emulatedas EMN (Emulated Mobile Node). Two kinds of nodesare used to emulate the EMN. We call them the VirtualMobile Controller (VMC) and Virtual Mobile Node(VMN). There is a one-to-one correspondence betweenthe EMN(s) and the VMN(s) i.e. for each mobile nodethat needs to be emulated on the grid we require aVMN. The EMN, at all times of the experiment, needsto be associated with a VMN and a VMC, though itsassociation with either of them may change with time.
The VMC may not be a part of the actual grid butneeds to be connected to the grid via a wire lineinterface. Presently, all the experiments use a node onthe grid as the VMC. The VMC has no wireless interfaceand communicates via gigabit ethernet. It runs theMobile Application that needs to be tested for variouscharacteristics, for example, packet drop experienced ina given radio environment. The VMN has a temporaryassociation with an EMN. This association is controlledby the VMC. The VMC decides which node on thegrid is to act as the VMN for an EMN. The VMNcommunicates with other VMNs via radio and with itsVMC via wired ethernet.
A Simple Scenario
Consider a simple experiment that involves two mobilenodes trying to PING each other. Let us call themobile nodes EMN-1 and EMN-2. To emulate the PINGprotocol between the mobile nodes on the static gridwe assign each of the mobile nodes a VMC, VMC-1 forEMN-1 and VMC-2 for EMN-2. Further, the VMCs areconfigured so that they can associate VMN-1 and VMN-2with EMN-1 and EMN-2 respectively. The configurationsteps will be detailed later. For the sake of simplicity letus assume that the associations mentioned above do notchange during the experiment. It is important to realizethat EMN-1 and EMN-2 do not really exist.
The experiment starts when we initiate a ping sessionfrom VMC-1. The ping packets are sent by VMC-1 to
5
the VMN it is associated to i.e. VMN-1. The transfertakes place via wired Ethernet. VMN-1, on receivingthe ping packets forwards them to VMN-2 on the radiointerface. VMN-2 then sends the received packets toVMC-2. VMC-2 runs the ping application which, in areal scenario would run on EMN-2. The ping applicationresponds to the ping packets that are then routed viaVMN-2, VMN-1 back to the ping application on VMC-1,completing a round trip ping. Data such as ping packetsdropped can be collected at VMN-1/VMC-1 and VMN-2/VMC-2 with utilities explained later. This data wouldbe affected by the radio environment that exists betweenthe VMNs and can be used to test the mobile application.
CLICK Modular Router:
All the data that is routed between the VMNs and theVMCs is via the CLICK Modular Router that is installedon each of the VMNs and VMCs. Click is a software ar-chitecture for building flexible and configurable routers.A Click router is assembled from packet processing mod-ules called elements. Individual elements implement sim-ple router functions like packet classification, queuing,scheduling, and interfacing with network devices. Com-plete configurations are built by connecting elements intoa graph; packets flow along the graphs edges. Several fea-tures make individual elements more powerful and com-plex configurations easier to write, including pull process-ing, which models packet flow driven by transmitting in-terfaces, and flow-based router context, which helps an el-ement locate other interesting elements. We demonstrateseveral working configurations, including an IP router andan Ethernet bridge. These configurations are modulartheIP router has 16 elements on the forwarding pathandeasy to extend by adding additional elements, which wedemonstrate with augmented configurations.
The router is configured using simple scripts called clickscripts. The click scripts once installed can route packetsreceived on an interface (say eth0) to any other hostas per configuration. Similarly, it can route packetsreceived from its host. The click configuration primarilyconsists of the PokeHandler, EtherEncap, FromHost andToHost elements. The PokeHandler updates the clickconfiguration dynamically at specified times. The newconfiguration and the time is specified as its arguments.EtherEncap encapsulates the data packet with theEthernet header. FromHost is used to snoop packetssent by the host and direct them as per the configurationspecified in the PokeHandler or the EtherEncaps. A
snapshot of a sample click script is shown below.
Consider the configuration for a ping experiment thatwas carried out. The experiment was similar to the oneexplained earlier with one difference that the associationof EMN-1 switches from VMN-1 to VMN-2 to VMN-3to VMN-4 to VMN-5 to VMN-6 to VMN-7 at times 0, 5,10, 15, 20, 25, 30 (sec). The association of EMN-2 waswith VMN-8 and VMC-2 for the entire duration of theexperiment.
The table below shows the configuration used by theclick router installed on VMC-1. The three columns aretime, wired Ethernet address of VMN, wireless interfaceaddress of VMN. The VMN is the one that was emulatingEMN-1 at the specified time. The time column is theoffset from the start time of the experiment when thenew configuration has to be used.
00, 00:0F:EA:4C:A6:B6, 00:60:B3:25:BF:FE
05, 00:0F:EA:4A:8B:5A, 00:60:B3:25:BF:EF
10, 00:0F:EA:47:6C:86, 00:60:B3:AC:A1:CB
15, 00:0F:EA:4D:9B:18, 00:60:B3:25:C0:0A
20, 00:0F:EA:4D:95:16, 00:60:B3:25:C0:0E
25, 00:0F:EA:4B:FE:C4, 00:60:B3:AC:A1:CE
30, 00:0F:EA:4A:8B:5E, 00:60:B3:25:C0:02
As per the configuration at time 0 EMN-1 is em-ulated by VMN-1 whose wired Ethernet address is00:0F:EA:4C:A6:B6 and wireless Ethernet address is00:60:B3:25:BF:FE. The second row corresponds toVMN-2 and similarly the last row to VMN-7. A similartable was used at VMC-2. The association EMN-2,VMC-2, VMN-8 was static throughout the experiment.Hence, we see that the entries are the same for all timeinstants.
00, 00:0F:EA:4B:FE:C2, 00:60:B3:AC:A1:CD
05, 00:0F:EA:4B:FE:C2, 00:60:B3:AC:A1:CD
10, 00:0F:EA:4B:FE:C2, 00:60:B3:AC:A1:CD
15, 00:0F:EA:4B:FE:C2, 00:60:B3:AC:A1:CD
20, 00:0F:EA:4B:FE:C2, 00:60:B3:AC:A1:CD
25, 00:0F:EA:4B:FE:C2, 00:60:B3:AC:A1:CD
30, 00:0F:EA:4B:FE:C2, 00:60:B3:AC:A1:CD
The data in the two tables is correlated using scriptswritten in perl. The perl script reads the above tables
6
and generates click scripts for the VMCs. Below isattached a snapshot of the click script generated forVMC-1. The script is not shown and is on similar lines.
ee_Own::EtherEncap(00:11:22:33:45:32,
00:00:00:00:00:00)
ee_VM21_VM22::EtherEncap(00:60:B3:25:BF:FE,
00:60:B3:AC:A1:CD)
The etherencap encapsulates the application data withthe specified source Ethernet address and destinationaddress. The element ee Own is used to encapsulate thepackets that are sent from the VMC-1 to VMN-1. Thepackets that are sent to VMN-1 also encapsulate theethernet header that VMN-1 will use to route the packetsfurther. This inner encapsulation is done using the ele-ment ee VM21 VM22 . The inner encapsulation makesthe VMN-1 transparent to the data that is being sentthrough it. In other words we can say that data is sentfrom VMC-1 to VMC-2 by tunneling it through VMN-1and VMN-2. The VMNs make no decision regardingthe routing of a packet. All the control is with the VMCs.
The VMC-1 PokeHandler does the job of updating theEthernet addresses used by the etherencap elementsas per the time offset from the start of experiment.The code below shows the instructions executed by thepokehandler at times 0, 5 (0 + 5), 10 (5 + 10). Theother entries are omitted for brevity.
PokeHandlers(
wait 0,
write ee_Own.dst 00:0F:EA:4C:A6:B6,
wait 5,
write ee_Own.dst 00:0F:EA:4A:8B:5A,
write ee_VM21_VM22.src 00:60:B3:25:BF:EF,
write ee_VM21_VM22.dst 00:60:B3:AC:A1:CD,
wait 5,
write ee_Own.dst 00:0F:EA:47:6C:86,
write ee_VM21_VM22.src 00:60:B3:AC:A1:CB,
write ee_VM21_VM22.dst 00:60:B3:AC:A1:CD,
)
The entries in the pokehandler are generated by a perlscript that correlates the data for all VMCs.
The first entry in the PokeHandler is for time 0. Itupdates the element the destination Ethernet addressof ee Owns with the Ethernet address of the VMN thatthe VMC-1 is connected to at time 0. The Ethernetaddress is therefore that of VMN-1. The source addressof VMC-1 is its own Ethernet address and need not beupdated as the association of VMC-1 with EMN-1 is forthe entire experiment. At time 0, the PokeHandler alsoupdates the ee VM21 VM22 with the source address (thewireless interface address of VMN-1) and the destinationaddress (the wireless interface address of VMN-2). Thisee VM21 VM22 encapsulation is within the ee Ownencapsulation and helps in tunneling data through theVMNs transparently.
Hence, at time 0 the tunnel that is formed is VMC-1 toVMN-1 to VMN-8 to VMC-2. At time 5 the destinationaddress in ee Own is updated with the Ethernet addressof VMN-2. So at time 5 VMC-1 is connected to VMN-2(the two together emulate the mobile node EMN-1).
Hence, at time 5 the tunnel that is formed is VMC-1 toVMN-2 to VMN-8 to VMC-2. We can say that the EMN-1 moved a distance from VMN-1 to VMN-2 in 5 seconds.Similarly, in the next 5 seconds it moves from VMN-2to VMN-3. All the while the transmissions to VMN-8continue transparently.
Click scripts are generated for the VMNs and the VMCs.The script for the VMN takes as input the name of theVMC’s configuration file, the Ethernet address of theVMC and the test network mask. The VMC’s config-uration file contains one or more rows that specify theVMN the VMC is associated with at a certain experi-ment time instant. Also in each row are the wired andwireless Ethernet interface addresses of the VMN. Thescript relates the data in the VMC’s file and files cor-responding to other VMCs based on the time instants,to generate the arguments for the click PokeHandler andEtherEncaps. An EtherEncap is generated for each otherVMC and the VMN. The wait times of the PokeHandlerare selected to be the minimum time interval in which theassociation of at least one VMC with its VMN changes.Classifier patterns are generated to distinguish packetsbased on the Ethernet address of the destination, whichcould be a particular VMC, or a broadcast address.
For each VMN the scripts reads a file that specifies thetime instant and the Ethernet address of the VMC withwhich the VMN is associated. Accordingly, the EtherEn-
7
cap and PokeHandler are generated.
IV. EMULATION OF SMALL SCALE SIGNALCHARACTERISTICS
The emulation of signal characteristics on a small timescale is likely to be an important area in mobility emula-tion from the point of view of a researcher who wants touse our mobility emulation system for modeling parame-ters such as frame loss patterns. A number of small scalesignal characteristics can be identified for ’emulation’ us-ing the static nodes. Some of these are more relevant foremulation than are others. Imposed on this set of possi-ble signal characteristics and requirements of emulationare constraints that we are bound to, due to the natureof the emulation system (static grid). In what follows,we motivate the reasons for emulation of small scale sig-nal characteristics, and list out a few such characteristicsthat we might want to emulate and the challenges andconstraints that we face.
Why would someone want to emulate small scale signalcharacteristics brought about by mobility ? The smallscale variation in signal strength can be responsible forbursty frame loss. Frame loss occurs, when the receivedsignal strength is too low, i.e. below a certain threshold.In such a situation , the demodulator is not able toproduce reliable output and the entire frame must bedropped because of large number of bit errors (i.e. no.of bit errors in a frame¿ maximum number of tolerablebit errors per frame, given the error coding scheme beingused, if at all). The signal strength may fall below thethreshold either in a short bursty manner (randomlyoccurring jagged sharp dips falling and rising quickly)or in a more regular manner. Therefore trying to modelframe loss patterns would be a primary application areafor a researcher using ORBIT for the emulation of smallscale signal characteristics brought about by mobility.
Another possible application area could be the estimationof the speed of a mobility terminal by a base station oraccess point (AP) it is associated with. Level crossingrate is a useful parameter in this regard and a number ofalgorithms for speed estimation of mobile terminal usinglevel crossing rate have been proposed in the recent past.This may help the AP or base station to intelligentlyalter its channel coding scheme (e.g. increase the channel
coding overhead for that particular mobile user in aneffort to counter the increased bit error rate. Alternatelythe AP may adaptively change its modulation rate (e.g.multi rate CDMA) or power for that mobile user if itfinds that the mobile terminal is traveling too fast andtherefore has a high fading rate)
Mobility introduces several types of small scale changesto the received signal.
1. Multipath fading or Rayleigh fading is a rapid fluc-tuation of the signal power. A Rayleigh faded signalis caused by the summation of a very large numberof individual reflected signals. Each of these signalshas a random phase and amplitude at the receivercaused by the difference in path length and attenua-tion. These signals rarely combine to greater than 10dB above the average signal power. The deep fades(destructive interference) range from just a few dB to50 dB below the average signal power. The receiver’sfront end must be sensitive enough to function prop-erly over these power fluctuations.
2. Relative path delay is a phenomenon where individ-ual signals from the transmitter arrive at differenttimes at the receiver. In a digital transmission sys-tem, this causes the received symbols to overlap, re-sulting in inter-symbol interference.
3. Relative path loss occurs when individual signal re-flections arriving at the receiver are at different ab-solute power levels. The difference in power levelsbetween signal paths is caused by physical elementsin the signal path.
4. Doppler or frequency shift from the carrier frequencyoccurs when the distance between the receiver andthe transmitter is changing. The Doppler frequencycan be either positive or negative, depending onwhether the mobile receiver is moving away from ortoward the transmitter. The receiver must functionproperly even though the signal has shifted from theoriginal RF carrier frequency.
5. Log-normal shadowing is the slow variation of thesignal envelope over time. Log-normal shadowing isa loss in the signal strength at the receiver causedby a blockage or absorption of the signal from thetransmitter by elements in the environment. This isoften called shadowing since the receiver is passingthrough the signal ”shadow” of a large object.
In our measurements so far with the robot and the nodes,we have very clearly observed at least two of the above
8
phenomena, namely Rayleigh Fading and Log NormalShadowing. Based on the perceived importance of em-ulating small scale signal characteristics, we have listedbelow a few ’candidate’ parameters that might be worthemulating on our static wireless test bed (in order of de-creasing importance):
1. Fading pattern
2. Level crossing rate
3. Variance of the received signal about its windowedmean.
4. Spread or ’range’ of increase in the mean signalstrength (Strictly speaking this isn’t really a smallscale characteristic)
5. Log normal Shadowing
A logical method of emulating small scale signal charac-teristics is to switch between nodes in a manner so as tovary the small scale signal characteristic that we are try-ing to emulate and make it more closely resemble thatavailable from ’true mobility experimental data. For thispurpose we need to empirically design a suitable switchingpattern for transferring control to and fro between adja-cent nodes. In this design we are fundamentally limitedin the variation we can bring about in the small scale pa-rameter that we attempt to model. We can only switch ina deterministic manner, i.e. the switching strategy mustbe pre-decided. We can switch only Modulo N , whereN ≥ 2.
The mobile radio environment suffers from the signalimpairments described above. These impairmentsdistinguish the mobile channel from a simple AdditiveWhite Gaussian Noise (AWGN) environment. Smallscale fading is probably the most important of thesesignal impairments as far as small scale signal emulationis concerned. This is because burtsy frame losses arelargely due to fading and not as a result of additive noisebeing large, especially in radio environments with a highSignal-to-Noise ratios. When noise is low, (high SNR)frame loss occurs primarily due to the mobile terminalbeing in a ’deep fade’. The probability of being in a ’deepfade’ for a mobile user is always non-zero and is relatedto the rate of change of the wireless channel. The fastera mobile terminal moves, the more likely it is to be insidea ’deep fade’ at any given time. A deep fade essentiallycauses the signal strength to drop to an extremely lowvalue for a short duration; as a result frames sent inthat duration are lost because of too many bit errors.
The deep fade itself is produced because various signalcomponents add up destructively at the point in timeand space.2
The challenge faced by us is the emulation of fading usinga static grid. Measurements collected from a real mobileterminal3 clearly show a fading pattern characteristic ofits speed. If we were to observe the signal strength profileusing signal measurements from the nodes that formedour emulation trajectory, we do not find any fades.This is because: for a static node, fading is entirelydependent on the ’speed’ at which its immediate wirelessenvironment is changing. The wireless environment inthe ORBIT lab is hardly changing (with respect to seeinga fading pattern). Hence for the emulation of fading, weneed to come up with a way to ’artificially’ introducefades in the ’combined’ signal strength profile of theswitched nodes.
Current signal measurements from the nodes provideus with received packet sequence number along withits reported signal strength. When signal strength isbelow a certain threshold, the packet is dropped and itssequence number is found missing in the measurementdata-file. For experimental runs without or very lownoise, we have seen that packets are hardly ever lost.(This is because static nodes do not go into deep fades(or hardly ever; an occasional packet might be droppedbecause of a rare deep fade) At high noise levels, largepacket drop is observed near the noise generators. Thispacket drop is again not because of fades but because ofincreased noise and consequent dropped SNR.
The observation to be made here is that a packet isdropped when SNR is low. SNR can be low in twoways: (1) Noise is too high (2) Signal is too low. Theformer case is what the paragraph above talks about.
2Hence the fading pattern changes with time and space. Inother words a static terminal will see a fading pattern (due tothe changing wireless channel) depending upon how fast thechannel changes. If we freeze time and move the mobile termi-nal in space then the mobile will experience a fading patterndepending on the rate at which it is moved.
3A robot with a mounted wireless node was used for collect-ing signal measurements. The robot was moved in a straightline along a single row of the orbit grid with the node at theend of the row as the transmitter. The received signal strengthmeasurements from the robot were then compared with similarmeasurements obtained from the other nodes in the same rowusing the click script.
9
1200 1300 1400 1500 1600 1700 1800 190012.5
13
13.5
14
14.5
15
15.5
16
16.5
17
Packet sequence number
Sig
nal s
tren
gth
(dB
sca
le)
Figure 12: Received signal strength measured on the robot dur-ing motion toward a transmitter plotted on a per packet basis atambient noise level. The X-axis shows the packet sequence num-ber. Notice that smaller fades where the packets have not beendropped are clearly visible as not-so-deep dips in signal strength.This feature is not seen in the signal plots for the static nodes.Also notice the periodic rise and fall of the mean signal level. Thisis due to log normal shadowing. Log normal shadowing was ob-served in the signal plots for some of the static nodes.
0 100 200 300 400 500 60010
11
12
13
14
15
16
17
Packet sequence number
Sig
nal S
treng
th (d
B s
cale
)
Figure 13: Received signal measured on static node (2, 5) ofthe grid at a noise level of 5 dbm created by the vector signalgenerator. The signal strength has been plotted against receivedpacket sequence, ignoring the dropped packets (at a noise level of5 dBm, a significant fraction of packets are dropped) The nodeseems to be in a location where it is experiencing frequent deepfades. These are the type of fades we hope to artificially introduceby one of the schemes discussed above.
0 500 1000 1500 2000 2500 300016.4
16.6
16.8
17
17.2
17.4
17.6
17.8
18
18.2
18.4
Packet sequence number
Sig
nal S
tren
gth
(dB
sca
le)
Signal strengthMoving average
Figure 14: This plot shows the variation in signal strength (inthe dB scale) obtained by switching through a single row of nodesas the robot moves along the same row. The switching scheme isdesigned in a way such that the variance of the signal strengthabout the moving average is closely matched to the variance ofthe signal strength obtained by the robot about its moving aver-age. The window size for the moving average filter was made aslarge as possible to maximize the continuity of the resultant sig-nal strength waveform. Moving variance is one of the parametersworth emulating in the domain of small scale signal characteristics.
The latter occurs in the event of a deep fade. When thereceiver drops a packet due to low SNR, it does not knowwhich of the two situations are responsible(assumingno intelligence in the receiver). Hence we may use theformer to emulate the latter. This method of emulatingmobility requires sharply raising the noise level from thenoise generator in a controlled (programmed) fashion.However, this would affect all nodes. Also a givenprogrammed pattern of noise change would emulatea single velocity (since velocity and fading rate areproportional) and so this method can only be used whenall the nodes are moving at the same velocity and we donot mind creating a perfectly correlated fading pattern(in time) across different nodes. A possible way to avoidthese problems might be to use just one noise antennain a corner of the grid and to use a combination ofnoise-generator programming and intelligent routing ofmobile nodes. In such a situation only the nodes nearthe noise antenna would get affected by the ’spikes’ innoise level and would therefore see an ’emulated fade’.When its time to provide a fade to mobile terminalwith velocity v1, we take it near the noise generatorand provide it a noise level spike with a frequency ofoccurrence that is related to v1, when its the turn for
10
another mobile terminal with velocity v2, we take it closeto the noise antenna and give it noise spike in accordancewith v2, and so on. While it serves our purpose, this isa complicated scheme and it messes with the routing ofthe nodes which is supposed to be on a different layerand independent.
A more coarse method for emulating fading, but onewhich places greater control in our hands is the techniqueof hacking the MAC to drop packets intentionally, witha certain frequency so as to emulate the fading patternof a mobile terminal with a user specified velocity. Whilethis method provides greater control with respect to theaspect discussed in the previous paragraph, it requiresconsiderable programming and is coarse because at timeswhen our hack in the MAC decides to place an ’artificialfade’, the signal quality might actually be good and so itmay not ’look’ like a fade. But I guess this can be takencare of. And I guess this is not very significant given thatwe do actually get controlled fading emulation at our dis-posal. Another advantage of this method is that someresearch has been done in this area. Its not entirely newand we would not have to start from scratch.
V. EMULATION OF AN AD-HOC NETWROK
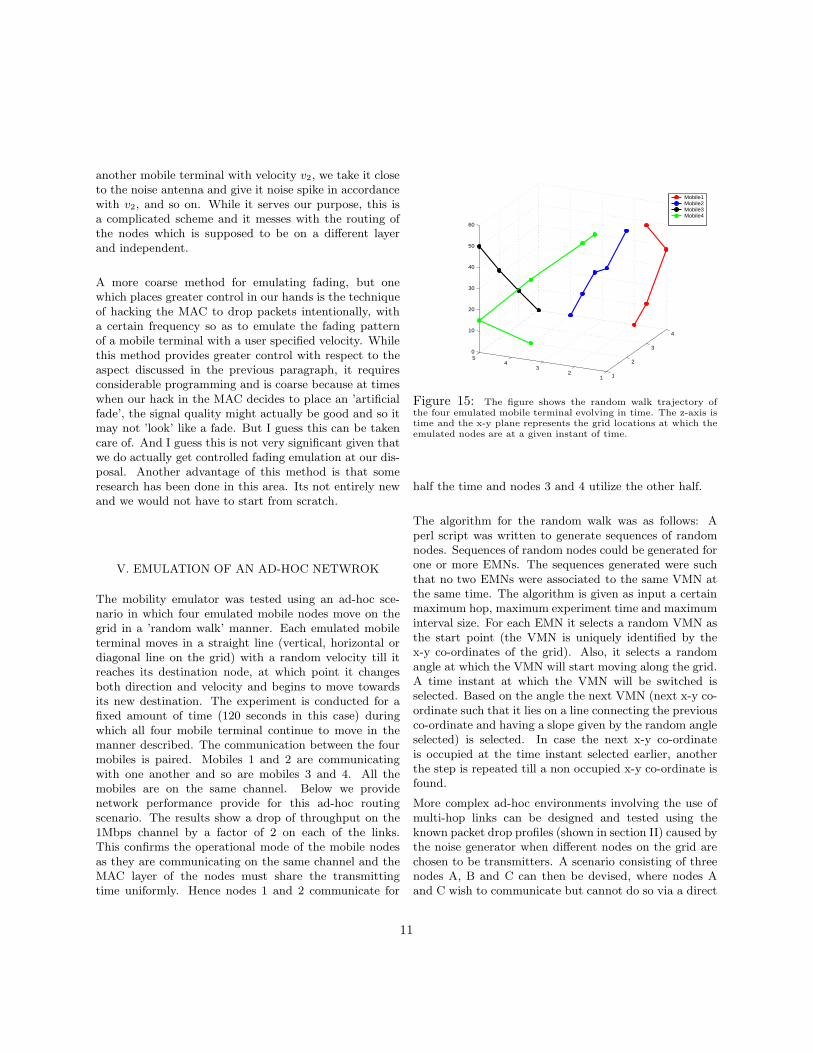
The mobility emulator was tested using an ad-hoc sce-nario in which four emulated mobile nodes move on thegrid in a ’random walk’ manner. Each emulated mobileterminal moves in a straight line (vertical, horizontal ordiagonal line on the grid) with a random velocity till itreaches its destination node, at which point it changesboth direction and velocity and begins to move towardsits new destination. The experiment is conducted for afixed amount of time (120 seconds in this case) duringwhich all four mobile terminal continue to move in themanner described. The communication between the fourmobiles is paired. Mobiles 1 and 2 are communicatingwith one another and so are mobiles 3 and 4. All themobiles are on the same channel. Below we providenetwork performance provide for this ad-hoc routingscenario. The results show a drop of throughput on the1Mbps channel by a factor of 2 on each of the links.This confirms the operational mode of the mobile nodesas they are communicating on the same channel and theMAC layer of the nodes must share the transmittingtime uniformly. Hence nodes 1 and 2 communicate for
1
2
3
4
12
34
50
10
20
30
40
50
60
Mobile1Mobile2Mobile3Mobile4
Figure 15: The figure shows the random walk trajectory ofthe four emulated mobile terminal evolving in time. The z-axis istime and the x-y plane represents the grid locations at which theemulated nodes are at a given instant of time.
half the time and nodes 3 and 4 utilize the other half.
The algorithm for the random walk was as follows: Aperl script was written to generate sequences of randomnodes. Sequences of random nodes could be generated forone or more EMNs. The sequences generated were suchthat no two EMNs were associated to the same VMN atthe same time. The algorithm is given as input a certainmaximum hop, maximum experiment time and maximuminterval size. For each EMN it selects a random VMN asthe start point (the VMN is uniquely identified by thex-y co-ordinates of the grid). Also, it selects a randomangle at which the VMN will start moving along the grid.A time instant at which the VMN will be switched isselected. Based on the angle the next VMN (next x-y co-ordinate such that it lies on a line connecting the previousco-ordinate and having a slope given by the random angleselected) is selected. In case the next x-y co-ordinateis occupied at the time instant selected earlier, anotherthe step is repeated till a non occupied x-y co-ordinate isfound.
More complex ad-hoc environments involving the use ofmulti-hop links can be designed and tested using theknown packet drop profiles (shown in section II) caused bythe noise generator when different nodes on the grid arechosen to be transmitters. A scenario consisting of threenodes A, B and C can then be devised, where nodes Aand C wish to communicate but cannot do so via a direct
11
0 20 40 60 80 100 1200.3
0.35
0.4
0.45
0.5
0.55
0.6
0.65
0.7
0.75
0.8
Time (seconds)
Inst
anta
neou
s th
roug
hput
(M
bps)
Figure 16: The throughput for communication link betweenemulated mobiles 1 and 2. The channel has a capacity of 1 Mbps.It is evident that the throughput hovers around a number below0.5 Mbps (because of MAC inefficiencies). The emasurements weremade using the nuttcp tool. Emulated mobile 1 was made to runthe nuttcp server and the emulated mobile 2 was made the client.
0 20 40 60 80 100 120 1400.3
0.35
0.4
0.45
0.5
0.55
Time (seconds)
Inst
anta
neou
s th
roug
hput
(M
bps)
Figure 17: The throughput for communication link betweenemulated mobiles 3 and 4. The channel has a capacity of 1 Mbps.It is evident that the throughput hovers around a number below0.5 Mbps (because of MAC inefficiencies). The emasurements weremade using the nuttcp tool. Emulated mobile 3 was made to runthe nuttcp server and the emulated mobile 4 was made the client.
link because of the poor quality of the link between Aand C. A then uses B as a hop and B routes traffic fromA to C. In order to design such a scenario, we need touse measurement data for packet drop ratios at variouslocations on the grid for different transmitter locationsand come up with suitable locations for A, B and C. Theresult may then be extended to the ad-hoc random walkcase wherein A, B and C move on the grid ion a randomwalk manner and the link between A and C alternatesbetween being a direct one and a hop through B. Workis this area is currently on.
References
[1] D. Johnson, D. Maltz, Y.-C. Hu, and J. G. Jetcheva, ”Dy-
namic SourceRouting Protocol for Mobile Ad Hoc Net-
works (DSR)ting,” IETF MANET group, INTERNET
DRAFT, November 2001.
[2] C. E. Perkins and E. M. Royer, ”Adhoc on-demand dis-
tance vector routing,” in Proceedings of the 2nd IEEE
Workshop on Mobile Computing Systems and Applica-
tions, Feb. 1999, pp. 90100.
[3] H. Lundgren, D. Nielsen, J. Nordstrom, and E. Tschudin,
”A large-scale test bed for reproducible ad hoc protocol
evaluations,” IEEE WCNC, 2002.
[4] Y. Zhang and W. Li, ”An integrated environment for test-
ing mobile adhoc networks,” in Proceedings of the third
ACM international symposium on Mobile ad hoc net-
working and computing. ACM Press, 2002, pp. 104111.
[5] J. Kaba and D. Raichle, ”Test bed on a desktop: Strate-
gies and techniques to support multi-hop manet routing
protocol development,” 2001
[6] E. Kohler, R. Morris, B. Chen, J. Jannotti, and M. F.