Mode-division multiplexed transmission with inline few-mode fiber amplifier
Neng Bai,1,6 Ezra Ip,1,* Yue-Kai Huang,1 Eduardo Mateo,1 Fatih Yaman,1 Ming-Jun Li,2
Scott Bickham,2 Sergey Ten,2 Jesús Liñares,3 Carlos Montero,3 Vicente Moreno,3
Xesús Prieto,3 Vincent Tse,4 Kit Man Chung,4 Alan Pak Tao Lau,4 Hwa-Yaw Tam,4
Chao Lu,4 Yanhua Luo,5 Gang-Ding Peng,5 Guifang Li,6 and Ting Wang1 1NEC Labs America, 4 Independence Way, Princeton, NJ 08540, USA 2Corning Incorporated, 1 Riverfront Plaza, Corning, NY 14831, USA
3Faculty of Physics and School of Optics and Optometry, University of Santiago de Compostela,
Santiago de Compostela, Spain 4Department of Electrical Engineering, The Hong Kong Polytechnic University, Hong Kong, China
5School of Electrical Engineering & Telecommunications, University of New South Wales, Sydney, Australia 6The College of Optics & Photonics, University of Central Florida, Orlando, FL 32816, USA
7. Y. Yung, S. Alam, Z. Li, A. Dhar, D. Giles, I. Giles, J. Sahu, L. Grüner-Nielsen, F. Poletti, and D. Richardson,
“First demonstration of multimode amplifier for spatial division multiplexed transmission systems,” in 37th
European Conference and Exposition on Optical Communications, OSA Technical Digest (CD) (Optical Society
of America, 2011), paper Th.13.K.4.
8. R. Ryf, A. Sierra, R. Essiambre, S. Randel, A. Gnauck, C. A. Bolle, M. Esmaeelpour, P. J. Winzer, R. Delbue, P.
Pupalaikis, A. Sureka, D. Peckham, A. McCurdy, and R. Lingle, “Mode-Equalized Distributed Raman
Amplification in 137-km Few-Mode Fiber,” in 37th European Conference and Exposition on Optical
Communications, OSA Technical Digest (CD) (Optical Society of America, 2011), paper Th.13.K.5.
9. J. Liñares, C. Montero, V. Moreno, M. C. Nistal, X. Prieto, J. R. Salgueiro, and D. Sotelo, “Glass processing by
ion exchange to fabricate integrated optical planar components: applications,” Proc. SPIE 3936, 227–238 (2000).
#157732 - $15.00 USD Received 7 Nov 2011; revised 12 Dec 2011; accepted 13 Dec 2011; published 20 Jan 2012(C) 2012 OSA 30 January 2012 / Vol. 20, No. 3 / OPTICS EXPRESS 2668
10. J. R. Salgueiro, V. Moreno, and J. Liñares, “Model of linewidth for laser writing on a photoresist,” Appl. Opt.
41(5), 895–901 (2002).
11. E. Ip and J. M. Kahn, “Digital equalization of chromatic dispersion and polarization mode dispersion,” J.
Lightwave Technol. 25(8), 2033–2043 (2007).
1. Introduction
As the capacity of optical systems based on single mode fiber (SMF) approach the nonlinear
Shannon’s limit [1], further capacity growth requires new transmission paradigm. Time-
division multiplexing (TDM) and wavelength-division multiplexing (WDM) are examples of
parallel transmission in time/frequency which have been successfully employed in SMF
systems. To further increase the number of parallel channels, the spatial dimensions may be
exploited. Indeed, space-division multiplexing (SDM) is gaining prominence as the most
promising technology for overcoming the capacity crunch. To date, SDM transmission has
been reported for three fiber types: these are weakly coupled multicore fibers (MCF) [2],
like parallel SMF channels, and have the lowest decoding complexity per bit. However, the
achievable information capacity per unit area is low. By contrast, both strongly coupled MCF
and MMF require multiple-input multiple-output (MIMO) detection techniques with high
decoding complexity, but can achieve higher information capacity per unit area.
In principle, the capacity of SDM transmission scales linearly with the number of parallel
channels, i.e., the number of modes per core multiplied by the number of cores in the fiber.
The same capacity increase, however, can also be obtained by using parallel SMF fibers. To
make SDM systems competitive with parallel SMF, it is necessary to integrate devices such as
inline amplifiers, as well as simplify the digital signal processing (DSP) requirement so that
power consumption is manageable. Erbium-doped fiber amplifiers based on FMF was studied
in [6], and was recently demonstrated in [5] and [7]; while Raman amplification in FMF was
studied in [8]. The highest capacity reported to date over FMF, which employed both WDM
and mode-division multiplexing (MDM), was 88 × 3 × 112-Gb/s using only the C-band [5]. In
this paper, we will furnish further details of the WDM-MDM transmission. The outline of the
paper is as follows: in Section 2, we measure the characteristics of the FM-EDFA. In Section
3, the experimental setup for WDM-MDM transmission is introduced. Experimental results
are presented in Section 4, including results for performance versus algorithmic complexity.
In Section 5, the modal group delay and chromatic dispersion characteristics of the FMF are
characterized.
2. Few-mode EDFA
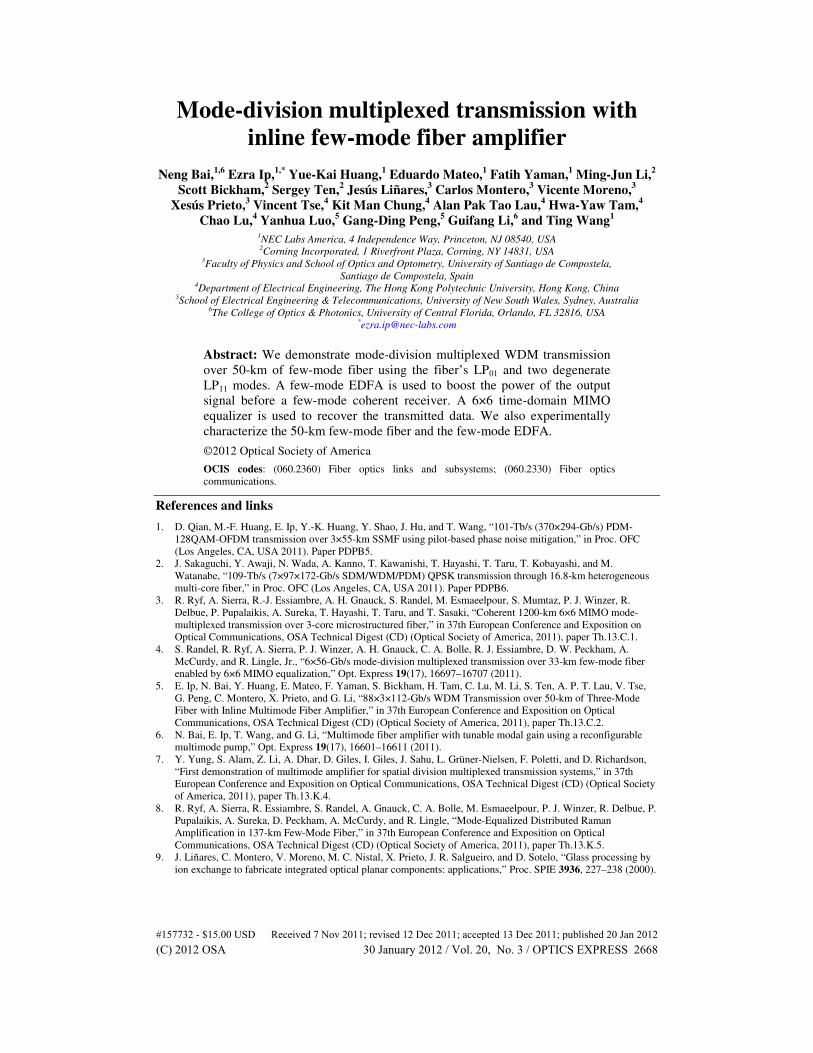
A few-mode erbium-doped fiber amplifier (FM-EDFA) was constructed out of 15 meters of
few-mode erbium-doped fiber. Originally intended as a step-index profile fiber with a
uniformly doped core, the actual refractive index profile measured in the radial direction is
shown in Fig. 1(a). The FM-EDF supports two mode groups at the signal wavelength (around
1550 nm): ( )
01
sLP and
( )11
sLP , and four mode groups at the pump wavelength (around 980 nm):
( )01
pLP ,
( )11
pLP ,
( )21
pLP and
( )02
pLP . Normalized intensity distributions for the signal and pump
modes of interest are shown in Fig. 1(b).
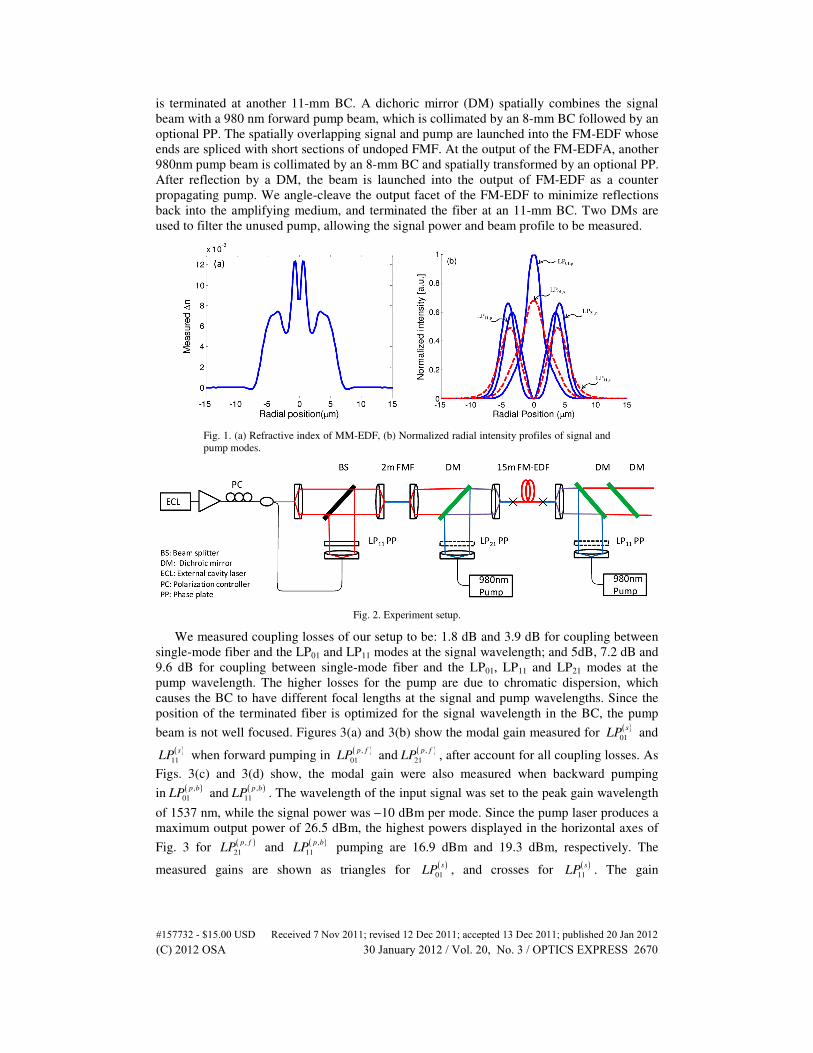
To characterize the FM-EDFA, we use the experiment setup shown in Fig. 2. A tunable C-
band external cavity laser (ECL) is amplified and passed through a polarization controller
(PC), and is then spatially transformed by a mode multiplexer. The mode multiplexer splits
the input signal into two paths. The single-mode fiber in each path is terminated by a beam
collimator (BC) with focal length of 11 mm. At one of the paths, a phase plate (PP) converts
the LP01 Gaussian beam into an LP11 mode. The two beams are passively combined by a
passive beam splitter (BS) and launched into two meters of undoped FMF of the same type as
the 50-km FMF used in the transmission experiment described in Section 3 which supports
the propagation of LP01 and LP11 modes at the signal wavelength. At the FM-EDFA, the FMF
#157732 - $15.00 USD Received 7 Nov 2011; revised 12 Dec 2011; accepted 13 Dec 2011; published 20 Jan 2012(C) 2012 OSA 30 January 2012 / Vol. 20, No. 3 / OPTICS EXPRESS 2669
is terminated at another 11-mm BC. A dichoric mirror (DM) spatially combines the signal
beam with a 980 nm forward pump beam, which is collimated by an 8-mm BC followed by an
optional PP. The spatially overlapping signal and pump are launched into the FM-EDF whose
ends are spliced with short sections of undoped FMF. At the output of the FM-EDFA, another
980nm pump beam is collimated by an 8-mm BC and spatially transformed by an optional PP.
After reflection by a DM, the beam is launched into the output of FM-EDF as a counter
propagating pump. We angle-cleave the output facet of the FM-EDF to minimize reflections
back into the amplifying medium, and terminated the fiber at an 11-mm BC. Two DMs are
used to filter the unused pump, allowing the signal power and beam profile to be measured.
Fig. 1. (a) Refractive index of MM-EDF, (b) Normalized radial intensity profiles of signal and
pump modes.
Fig. 2. Experiment setup.
We measured coupling losses of our setup to be: 1.8 dB and 3.9 dB for coupling between
single-mode fiber and the LP01 and LP11 modes at the signal wavelength; and 5dB, 7.2 dB and
9.6 dB for coupling between single-mode fiber and the LP01, LP11 and LP21 modes at the
pump wavelength. The higher losses for the pump are due to chromatic dispersion, which
causes the BC to have different focal lengths at the signal and pump wavelengths. Since the
position of the terminated fiber is optimized for the signal wavelength in the BC, the pump
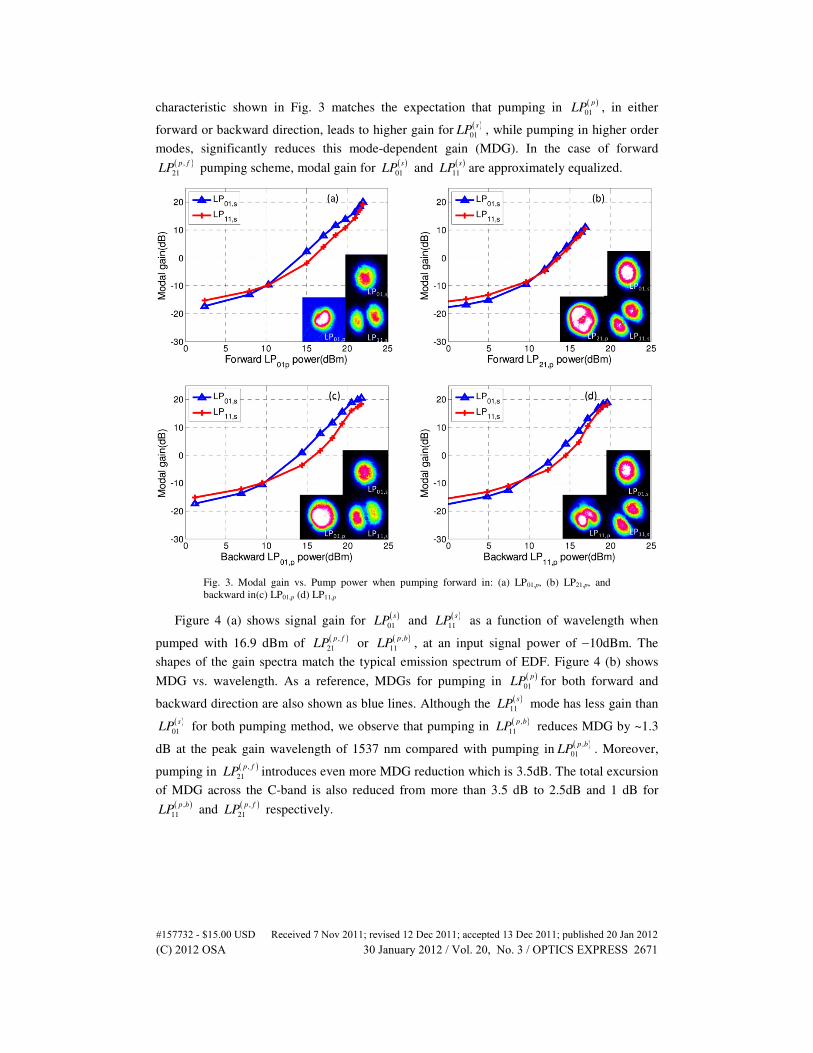
beam is not well focused. Figures 3(a) and 3(b) show the modal gain measured for ( )
01
sLP and
( )11
sLP when forward pumping in
( ),
01
p fLP and
( ),
21
p fLP , after account for all coupling losses. As
Figs. 3(c) and 3(d) show, the modal gain were also measured when backward pumping
in( ),
01
p bLP and
( ),
11
p bLP . The wavelength of the input signal was set to the peak gain wavelength
of 1537 nm, while the signal power was −10 dBm per mode. Since the pump laser produces a
maximum output power of 26.5 dBm, the highest powers displayed in the horizontal axes of
Fig. 3 for ( ),
21
p fLP and
( ),
11
p bLP pumping are 16.9 dBm and 19.3 dBm, respectively. The
measured gains are shown as triangles for ( )
01
sLP , and crosses for
( )11
sLP . The gain
#157732 - $15.00 USD Received 7 Nov 2011; revised 12 Dec 2011; accepted 13 Dec 2011; published 20 Jan 2012(C) 2012 OSA 30 January 2012 / Vol. 20, No. 3 / OPTICS EXPRESS 2670
characteristic shown in Fig. 3 matches the expectation that pumping in ( )
01
pLP , in either
forward or backward direction, leads to higher gain for( )
01
sLP , while pumping in higher order
modes, significantly reduces this mode-dependent gain (MDG). In the case of forward ( ),
21
p fLP pumping scheme, modal gain for
( )01
sLP and
( )11
sLP are approximately equalized.
Fig. 3. Modal gain vs. Pump power when pumping forward in: (a) LP01,p, (b) LP21,p, and
backward in(c) LP01,p (d) LP11,p
Figure 4 (a) shows signal gain for ( )
01
sLP and
( )11
sLP as a function of wavelength when
pumped with 16.9 dBm of ( ),
21
p fLP or
( ),
11
p bLP , at an input signal power of −10dBm. The
shapes of the gain spectra match the typical emission spectrum of EDF. Figure 4 (b) shows
MDG vs. wavelength. As a reference, MDGs for pumping in ( )
01
pLP for both forward and
backward direction are also shown as blue lines. Although the ( )
11
sLP mode has less gain than
( )01
sLP for both pumping method, we observe that pumping in
( ),
11
p bLP reduces MDG by ~1.3
dB at the peak gain wavelength of 1537 nm compared with pumping in( ),
01
p bLP . Moreover,
pumping in ( ),
21
p fLP introduces even more MDG reduction which is 3.5dB. The total excursion
of MDG across the C-band is also reduced from more than 3.5 dB to 2.5dB and 1 dB for ( ),
11
p bLP and
( ),
21
p fLP respectively.
#157732 - $15.00 USD Received 7 Nov 2011; revised 12 Dec 2011; accepted 13 Dec 2011; published 20 Jan 2012(C) 2012 OSA 30 January 2012 / Vol. 20, No. 3 / OPTICS EXPRESS 2671
Fig. 4. (a) Modal gain vs. signal wavelength, using LP21,p (forward) and LP11,p (backward) and
(b) MDG vs. signal wavelength using forward pumps in LP01,p, LP21,p and backward pumps in
LP01,p, LP11,p
3. Phase plates
In order to achieve high-efficiency crosstalk-free modal transformation, high optical quality
phase plates with accurate optical transfer function are required. The fabrication process needs
to provide an accurate, stable and steep phase transition between regions. For this purpose we
designed, fabricated and characterized monolithic binary phase plates using a highly uniform
Ag+/Na+ ion-exchange (IE) in glass, which provides important advantages compared to
methods based on changing the thickness of the material. IE in glass is a well-established
technique for material processing, integrated optics and other applications [9]. High precision
and versatility are achieved through control of fabrication parameters such as diffusion time,
temperature, diffusion coefficient, and the salt melt concentration. By using a Gaussian model
together with the Inverse Wentzel-Kramer-Brillouin Method (IWKB) method, the desired
phase-shift can be predicted by optimizing the refractive index variation of the Ion exchanged
region. Phase plates designed for 1550 nm and 980 nm operation were fabricated with 5%
AgNO3/NaNO3 salt melt at 340 °C. Multi-region binary plates were fabricated by using multi-
region masks made by high-precision photolithographic techniques [10].
Phase plates were characterized by interferometry together with a modified Carré
algorithm for the phase recovery. After phase is determined, an approximation technique for
the diffusion time is used to improve the value of the required phase if necessary. The final
phase value was set at 98% of the desired value (π radians) so tilting the phase plate by a
small angle enables modal conversion be optimized.
4. Transmission experiment
The experimental setup is shown in Fig. 5. At the transmitter, 88 lasers (87 distributed-
feedback (DFB) laser and one external cavity laser (ECL) for the channel measured) are
divided into odd and even groups. Each group is separately modulated with 28 Gbaud QPSK,
where the in-phase (I) and quadrature (Q) drive voltages are generated from pseudorandom
binary sequence (PRBS) of length 231−1. We generate polarization-multiplexed signals by
splitting the modulator outputs, delaying one path by 405 symbols (14.46 ns), rotating it to the
orthogonal polarization before polarization recombining. Odd and even channels are
combined using an optical interleaver. The signal spectrum at the output of the single-mode
transmitter is shown as an inset of Fig. 5. In the mode multiplexing circuit, the signal is split
into three tributaries. Following decorrelation delays and amplification, the single-mode fibers
are terminated at beam collimators (BC) with focal lengths of 11 mm. The beams propagating
in free-space have 1/e radii of ~2 mm. For the LP11o and LP11e tributaries, phase plates with
dual partitions having relative path delays of 0 and π radians at 1550 nm are used to spatially
modulate the signal beam. Figure 6(a) shows the intensity patterns measured by a beam
#157732 - $15.00 USD Received 7 Nov 2011; revised 12 Dec 2011; accepted 13 Dec 2011; published 20 Jan 2012(C) 2012 OSA 30 January 2012 / Vol. 20, No. 3 / OPTICS EXPRESS 2672
profiler placed in the far field. We combine the three spatially orthogonal beams using passive
beam splitters (BS), and the mode-division multiplexed (MDM) signal is launched into 50 km
of FMF via an 11-mm BC. In this experiment, the relative difference in path lengths seen by
the LP11o, LP01, and LP11e tributaries (from the 1-by-3 splitter to the FMF input) are 0, 48.75
ns and 81.14 ns, respectively (corresponding to 0, 1365 and 2272 symbols). Thus, the
minimum decorrelation delay between the six spatial-polarization modes is 405 symbols
arising from the polarization multiplexer. This value is much greater than the modal group
delay (MGD) of the FMF or the length of the time-domain equalizer used for MIMO
demultiplexing, thus ensuring no spurious convergence where an equalizer output tributary
obtains degenerate information from two different launched modes. The intensity patterns
measured for the three spatial modes after 50-km transmission are shown in Fig. 6(b). Note
that the LP11 patterns depend on the instantaneous coupling condition between odd and even
modes, and is time-varying. We amplify the MDM signal using the FM-EDF considered in
Section 2, with two 980 nm lasers pumps in forward and reverse directions. Pump and signal
wavelengths are combined using free-space dichroic mirrors with insertion loss ~0.5 dB.
Phase plates (designed for 980 nm) are used to spatially modulate the pumps. The forward-
propagating pump is in the LP21 mode, while the backward-propagating pump is in the LP11
mode [6].
Fig. 5. Experimental setup.
Fig. 6. (a) Intensity patterns at transmitter, (b) intensity patterns after 50-km FMF.
#157732 - $15.00 USD Received 7 Nov 2011; revised 12 Dec 2011; accepted 13 Dec 2011; published 20 Jan 2012(C) 2012 OSA 30 January 2012 / Vol. 20, No. 3 / OPTICS EXPRESS 2673
Fig. 7. Digital signal processing architecture.
At the receiver, the mode demultiplexer is a mirror image of the transmitter’s mode
multiplexer: we terminate the FMF at an 11-mm BC and use BSs to split the signal into three
tributaries. In the LP11o and LP11e tributaries, the signal is spatially demodulated using phase
plates. All three tributaries are then coupled back into single mode fibers using 11-mm BC.
These signals are amplified and then filtered by wavelength selective switches (WSS). The
channel of interest is downconverted to electrical baseband by mixing the signals with a
common local oscillator (LO) laser using three polarization-and-phase diversity hybrids and
twelve photodetectors, recovering the in-phase (I) and quadrature (Q) components of the six
spatial-polarization modes. The electrical signals are sampled using three quad-channel
sampling oscilloscopes with sampling rates and electrical bandwidths of 40 GSa/s and 16
GHz.
For data recovery, the digital signal processing algorithm shown in Fig. 7 is used. First, we
upsample the signals to 2M = times the baud rate (56 GHz). Optional frequency-domain
equalizers (FDE) are used to compensate the average chromatic dispersion at (CD) of the LP01
and LP11 mode groups (see Section 6), followed by a 6×6 multiple-input multiple-output
(MIMO) time-domain equalizer (TDE) that demultiplexes the six spatial-polarization modes.
The operation of the equalizer can be generalized from [11]. Let T
1, ,mk k N k = y y y⋯ be
the vector of received samples used to recover symbol k, where 6m
N = is the number of
modes, and T
, , ,i k i Mk L i Mk Ly y+ − = y ⋯ is a vector of 2 1N L= + complex-valued samples
received at mode i at M times baud rate. The equations for MIMO equalization and equalizer
update are given by:
ˆ , andT
k kx W y= (1)
*2 .T
k kW W yµ ε+֏ (2)
In Eq. (1), T
1, ,ˆ ˆ ˆ
mk k N kx x = x ⋯ is the equalized symbol, and W is the equalizer matrix
11 1
1
m
m m m
N
N N N
=
W W
W
W W
⋯
⋮ ⋱ ⋮
⋯
(3)
comprising Nm × Nm components ij
W , each of which is a time-domain column vector of
length N – i.e., , ,
T
ij ij L ij LW W− = W ⋯ . In the least-means square (LMS) update equation
shown in Eq. (2), µ is the step size, and kε the error vector obtained for symbol k. In decision-
aided (DA) mode, the transmitted symbol k
x is known, so ˆk k k= −ε x x ; in decision-directed
#157732 - $15.00 USD Received 7 Nov 2011; revised 12 Dec 2011; accepted 13 Dec 2011; published 20 Jan 2012(C) 2012 OSA 30 January 2012 / Vol. 20, No. 3 / OPTICS EXPRESS 2674
(DD) mode, a symbol decision [ ]k Dx is made on the equalized symbol
kx , and the error
[ ] ˆk k kD= −ε x x is the difference between the decision and its equalized value. For this
experiment, we used a training sequence of 20,000 symbols for initial convergence of the
TDE, at which point, the equalizer is switched to decision-directed (DD) adaptation. To
ensure non-degeneracy of the outputs, we check the cross-correlation of the six output
tributaries. In the experimental results presented in Sections 5 and 6, twenty data sets of
32,768 symbols were captured. For each data set, bit-error rate (BER) and Q-factor were
computed from the second-half of the data after convergence of the TDE, (i.e., 655,360 bits
per spatial-polarization modes were evaluated).
In this experiment, the coupling loss between single-mode fiber and the LP01 mode of the
FMF is 1.8 dB, while the coupling loss between single-mode fiber and the LP11 of the FMF
(the loss due to the phase plate is negligible) is 3.5 dB. The losses of the beam splitter are 2.8
dB (through) and 4.0 dB (reflected). The attenuation of the FMF are ~0.22 dB/km for the LP01
mode and ~0.25 dB/km for the LP11 mode. Summing these losses, the LP11o and LP11e modes
have the highest total end-to-end loss of ~29.1 dB. The gains of the transmitter’s single-mode
fiber amplifiers were set so that all three spatial modes have the same power at the output of
the FMF (i.e., before the FM-EDFA).
5. Experimental results
Figure 8 shows BER vs. OSNR curves for: (i) single-mode fiber back-to-back (BTB), (ii)
MDM transmission BTB (via 1 meter of FMF), and (iii) after transmission for channel 38 at
1550.12 nm. It is observed that at a target BER of 10−3
, the OSNR penalty for cases (i) and (ii)
with respect to the theoretical additive white Gaussian noise-limited BER vs. OSNR curve for
QPSK are 1.2 dB and 2.8 dB, respectively. The similar penalties experienced by all three
spatial modes in case (ii) indicate the channel matrix is approximately unitary. For case (iii),
we used a TDE of 301 taps per tributary to compensate MGD and CD (i.e., no FDE was
used). The length of the TDE was sufficient to overcome the MGD of the channel (see
Section 6). The larger OSNR penalties for the higher-order LP11o and LP11e modes are caused
by a combination of mode coupling at the MM-EDFA and mode-dependent gain in the
amplifying medium causing the channel matrix to be non-unitary.
Fig. 8. BER vs. OSNR.
Figure 9 shows an example of the TDE obtained after convergence. The subplot at the
intersection of the i-th row and j-th column is the vector , ,
T
ij ij L ij LW W− = W ⋯ as
outlined in Section 4. In this experiment, we used 2M = times oversampling and 301N =
taps for the TDE, which corresponds to a time span of 151 symbols sufficient to overcome the
channel’s MGD. The vertical axis in each subplot is the value (real and imaginary
#157732 - $15.00 USD Received 7 Nov 2011; revised 12 Dec 2011; accepted 13 Dec 2011; published 20 Jan 2012(C) 2012 OSA 30 January 2012 / Vol. 20, No. 3 / OPTICS EXPRESS 2675
components shown) of the filter coefficient, and the horizontal axis is the time index
L l L− ≤ ≤ . We aligned the training symbols with the received signal in such manner that the
coefficient at 0l = is about halfway between the arrival times of the LP01 and LP11 modes.
The coefficients 0l > are the causal coefficients, and the coefficients 0l < are anti-causal
coefficients.
Fig. 9. Time-domain equalizer taps after convergence.
Fig. 10. Training characteristic: Mean square error vs. adaptation period.
From the equalizer description provided in Eq. (1) the columns of Fig. 9 (left to right) are
the TDE coefficients used to recover the symbols transmitted in the 01,x
LP , 01, y
LP , 11 ,o x
LP ,
11 ,o yLP ,
11 ,e xLP and
11 ,e yLP modes; while the rows denote the TDE coefficients operating on
the outputs recovered at the 01,x
LP , 01, y
LP , 11 ,o x
LP , 11 ,o y
LP , 11 ,e x
LP and 11 ,e y
LP ports of the
#157732 - $15.00 USD Received 7 Nov 2011; revised 12 Dec 2011; accepted 13 Dec 2011; published 20 Jan 2012(C) 2012 OSA 30 January 2012 / Vol. 20, No. 3 / OPTICS EXPRESS 2676
coherent receiver. The principle sub-matrices of the TDE are the 2×2 sub-matrix at the top-
left quadrant and the 4×4 sub-matrix at the bottom-right quadrant, which denote energy
transmitted in one mode group being received at the ports of that mode group. Most of the
energy in these submatrices is concentrated around a single peak corresponding to the
expected arrival time for a signal propagating in that mode group in the FMF. The lack of
spurious peaks indicates negligible multipath interference (MPI), where energy launched into
one mode group is coupled to another mode group and then back again. By contrast, the off-
diagonal sub-matrices denote energy transmitted in one mode group being received at the
ports of the other mode group. This arises from mode mixing either at the transmitter, the FM-
EDFA or the receiver. Considering the 4×2 sub-matrix in the bottom-left quadrant, the right-
most peak denotes the signal propagating in the LP01 mode in the FMF, but is received at an
LP11 port, while the left-most peak denotes the LP01 signal is coupled to LP11 at the
transmitter, which propagates in the LP11 mode in the FMF and is received at an LP11 port.
The temporal separation between the two peaks is the modal group delay in the 50-km FMF,
which in this instance is around 91 symbols (3.25 ns), corresponding to a MGD of 65 ps/km.
The dispersed peaks of the LP01 and LP11 modes arise from CD. Figure 10 shows a typical
training characteristic, where it is observed the TDE taps converged after ~10,000 symbols.
Fig. 11. Q vs. Launch Power after transmission.
Figure 11 shows Q vs. launch power after transmission. It is observed that the Q-factor is
still increasing at the highest power, indicating that the system remains in the linear regime
even when the transmitter’s EDFAs are set to their maximum output powers. System
performance is therefore limited by the combined amplified spontaneous emission (ASE) of
the FM-EDFA and single-mode EDFAs. In Fig. 12, the BERs after transmission is shown for
all the channels at the optimal launch power of −0.5 dBm/λ. It is observed that the BER of all
modes of all the WDM channels are below the threshold of 3.8×10⁻³
for 7% hard-decision
forward-error correction (HD-FEC) code. The BERs at the short wavelengths (right-hand
side) are slightly higher due to the gain vs. wavelength characteristic of the MM-EDFA. The
constellations of the best (Ch. 48) and worst (Ch. 88) channels are shown in the insets.
From the TDE taps observed in Fig. 9, it is possible to achieve significant reduction in
algorithmic complexity by keeping only those equalizer taps with significant energy around
each peak. Additionally, the number of significant taps at each peak can be reduced by
compensating known CD using the FDE shown in Fig. 7. Figure 13 shows Q penalty vs.
number of taps (taps
N ) per TDE tributary, where half of the taps are allocated around each
peak centered at the LP01 and LP11 arrival times. It is observed that to achieve Q penalty less
than 1 dB, around 80 taps per tributary is required.
#157732 - $15.00 USD Received 7 Nov 2011; revised 12 Dec 2011; accepted 13 Dec 2011; published 20 Jan 2012(C) 2012 OSA 30 January 2012 / Vol. 20, No. 3 / OPTICS EXPRESS 2677
Fig. 12. Measured BER for all WDM channels after transmission. Insets: Constellation
diagrams of best and worst modes.
Fig. 13. Q penalty vs. No. of taps per tributary of 6 × 6 equalizer.
6. Fiber characterization
The FMF has a graded index core that was optimized to simultaneously achieve large
effective area, low MGD and low coupling between the LP01 and LP11 modes. The calculated
effective areas of the LP01 and LP11 modes are 137 and 183 µm2, respectively, and the
calculated MGD and chromatic dispersion are plotted in Fig. 14. The MGD of all the channels
can be estimated experimentally from the equalizer coefficients after convergence. Figure
15(a) shows the results, where it is observed that MGD varies from 50 to 80 ps/km across the
C-band. In addition, the use of training symbols enables measurement of the change in group
delay with channel wavelength, and hence the CD of each mode of the FMF. The results are
shown in Fig. 15(b). It is observed that the CD of the LP01 and LP11 modes at 1550 nm are
around 20.5 and 19.8 ps/nm/km, respectively. The fluctuations of the data points from the
regressive lines is due to measurement “noise” which arises from temperature drift as the
channels are swept − i.e., small changes in either refractive index and fiber length will cause a
change in the arrival time of the signal (group delay) independent of chromatic dispersion. To
reduce measurement noise, we captured the channel sweep in ascending order of channel
number as rapidly as possible to reduce thermal fluctuations. The measured differential MGD
and chromatic dispersion agree well with the calculated values.
To characterize the fiber attenuation, we took OTDR traces with different offset launch
positions with a standard single mode fiber. When there is no offset, it is expected that most
light is launched into the LP01 mode. When the offset increases, more and more light will be
#157732 - $15.00 USD Received 7 Nov 2011; revised 12 Dec 2011; accepted 13 Dec 2011; published 20 Jan 2012(C) 2012 OSA 30 January 2012 / Vol. 20, No. 3 / OPTICS EXPRESS 2678
launched into the LP11 mode. Figure 16 shows OTDR traces for seven different launch
positions. The attenuation increases slightly from 0.243 dB/km to 0.252 dB/km from center to
12 µm offset, indication very small attenuation difference between the LP01 and LP11 mode.
Fig. 14. Predicted (a) differential mode group delay and (b) chromatic dispersion.
Fig. 15. Measured (a) differential MGD and (b) dispersion characteristic for experimental FMF.
Fig. 16. Measured OTDR traces at different offset launch positions.
7. Conclusion
We successfully transmitted a 26.4 Tb/s mode-division multiplexed DWDM signal over 50-
km of few-mode fiber with an inline few-mode EDFA before the receiver. Phase plates and
free-space optics were used for spatial mode multiplexing and demultiplexing. The received
signal was detected using three synchronized coherent receivers. We compensated mode
coupling, modal group delay and chromatic dispersion using a digital 6 × 6 × 301 MIMO
#157732 - $15.00 USD Received 7 Nov 2011; revised 12 Dec 2011; accepted 13 Dec 2011; published 20 Jan 2012(C) 2012 OSA 30 January 2012 / Vol. 20, No. 3 / OPTICS EXPRESS 2679
equalizer. We also characterized the mode-dependent gain of the few-mode EDFA, as well as
the differential modal group delay and dispersion characteristics of the transmission few-
mode fiber.
Our experiment was ultimately limited by ASE noise of the receiver’s single-mode
EDFAs. We attribute this to the high loss of the receiver’s spatial demultiplexer. To enable
longer transmission distance, it is possible to (i) use a spatial hologram to demultiplex the
MDM signal without the high losses incurred by the current spatial demultiplexer, and (ii) use
a higher-gain FM-EDFA to boost the MDM signal power above sensitivity. In particular, it is
necessary for the gain of the FM-EDFA to be at least equal to the span loss in both mode
groups of the FMF in order to enable multi-span transmission using a recirculating loop.
#157732 - $15.00 USD Received 7 Nov 2011; revised 12 Dec 2011; accepted 13 Dec 2011; published 20 Jan 2012(C) 2012 OSA 30 January 2012 / Vol. 20, No. 3 / OPTICS EXPRESS 2680