modeFinance Monthly Overview October 2011 In order to give a financial and economic overview of miscellaneous companies from different countries, modeFinance analysts executed a monthly study regarding the calculated ratings.
Transcript
Monthly Overview: October 2011
modeFinance AREA Science Park
Padriciano 99 34012 Trieste ITALY
For more information visit: www.modefinance.com
modeFinance Monthly Overview
October 2011
In order to give a financial and economic overview of
miscellaneous companies from different countries, modeFinance
analysts executed a monthly study regarding the calculated
ratings.
Monthly Overview: October 2011
modeFinance AREA Science Park
Padriciano 99 34012 Trieste ITALY
For more information visit: www.modefinance.com
How many companies? In October, 2011modeFinance calculated 2,256,884 ratings based on 2010 annual financial statements in 93 countries across the world. In the table of ratings by country (Tab.1), the first 10 countries with the number of the ratings which are evaluated by modeFinance using MORE rating technology (please see the details here) are presented.
Country Number of evaluated ratings Mean Rating
Russian Federation 596,549 B Romania 487,427 B Spain 256,836 B Italy 213,087 B United Kingdom 124,578 B France 92,118 BB Norway 67,067 BB Sweden 57,775 BB Estonia 54,696 BB Serbia 53,656 B Others 253,095 BB TOTAL 2,256,884 B
Tab 1 the first 10 countries in terms of number of evaluated ratings in October 2010
In October, 2011the value of the sum of the Total Turnover of the rated companies is 7,387,131 million Euros. The distribution of the Total Turnover for the rated companies is shown if the following graph.
The evolution of ROI and ROE?
On the evaluated companies, a statistical study of the distribution of ROI and ROE during the observed years (2008-2009-20010) is executed.
Using the Leverage Ratio it is possible to understand the evolution of total debts during the years.
How many companies with profits or losses?
In the following graph it is possible to understand the evolution of Profit&Loss during the years in our study.
0% 20% 40% 60% 80% 100%
2008
2009
2010
0,0-2,0
2,0-5,0
>5,0
<0,0
0%
10%
20%
30%
40%
50%
60%
70%
80%
90%
100%
2008 2009 2010
P/L >= 0
P/L < 0
Monthly Overview: October 2011
modeFinance AREA Science Park
Padriciano 99 34012 Trieste ITALY
For more information visit: www.modefinance.com
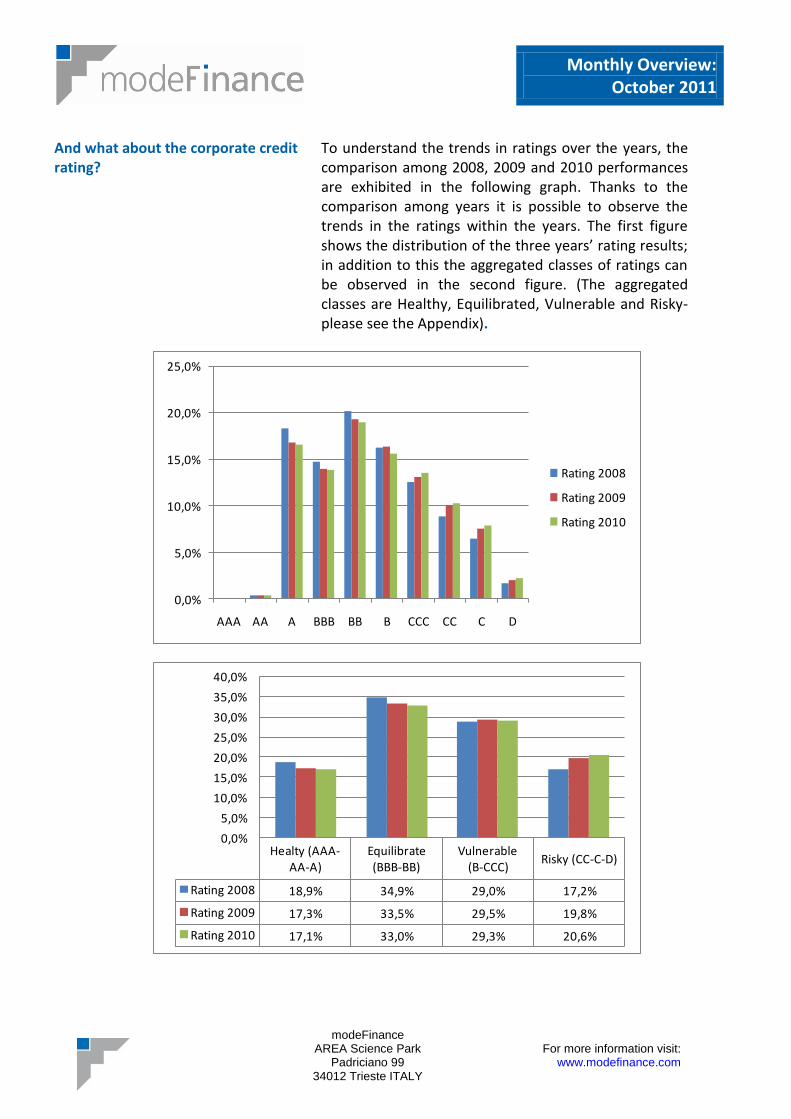
And what about the corporate credit rating?
To understand the trends in ratings over the years, the comparison among 2008, 2009 and 2010 performances are exhibited in the following graph. Thanks to the comparison among years it is possible to observe the trends in the ratings within the years. The first figure shows the distribution of the three years’ rating results; in addition to this the aggregated classes of ratings can be observed in the second figure. (The aggregated classes are Healthy, Equilibrated, Vulnerable and Risky- please see the Appendix).
0,0%
5,0%
10,0%
15,0%
20,0%
25,0%
AAA AA A BBB BB B CCC CC C D
Rating 2008
Rating 2009
Rating 2010
Healty (AAA-AA-A)
Equilibrate (BBB-BB)
Vulnerable (B-CCC)
Risky (CC-C-D)
Rating 2008 18,9% 34,9% 29,0% 17,2%
Rating 2009 17,3% 33,5% 29,5% 19,8%
Rating 2010 17,1% 33,0% 29,3% 20,6%
0,0%
5,0%
10,0%
15,0%
20,0%
25,0%
30,0%
35,0%
40,0%
Monthly Overview: October 2011
modeFinance AREA Science Park
Padriciano 99 34012 Trieste ITALY
For more information visit: www.modefinance.com
And what about probability of default?
It is interesting to check the evolution of the mean probability of default evaluated on every companies with 2010 data. This month the modeFinance Risk Index is 0,1075.
0
0,02
0,04
0,06
0,08
0,1
0,12
modeFinance Risk Index
modeFinance Risk Index
Monthly Overview: October 2011
modeFinance AREA Science Park
Padriciano 99 34012 Trieste ITALY
For more information visit: www.modefinance.com
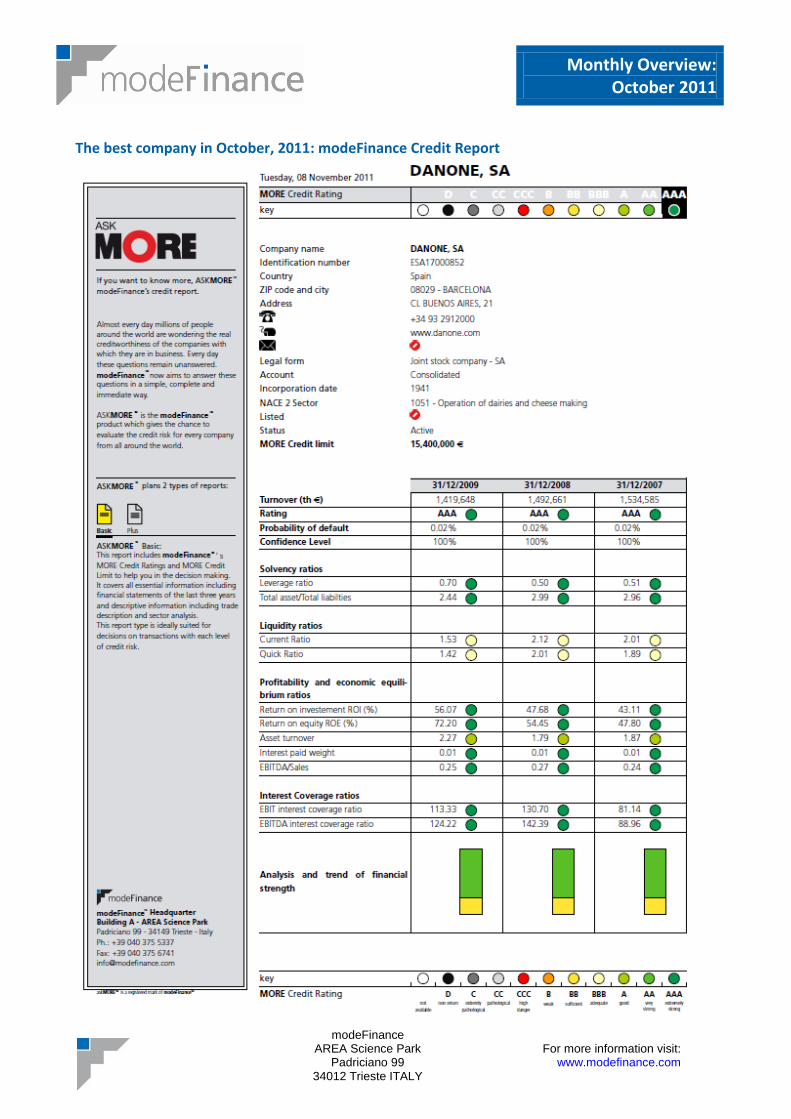
Which company had the best rating in October?
The top ten companies with the best ratings (according to the available data in October 2010) are exhibited in Table 2. The companies were selected from the global database, hence they represent different countries.
Company name Country Rating
DANONE, SA Spain AAA CONTINENTAL MABOR - INDUSTRIA DE PNEUS, S.A. Portugal AAA SOUZA CRUZ OVERSEAS, S.A. (ZONA FRANCA DA MADEIRA) Portugal AAA SATURN Russian Federation AAA LOLLAND SA Spain AAA ENERGOTRANS, A.S. Czech Republic AAA SUN FOOD INTERNATIONAL CO LTD Thailand AAA SANTILLANA EDUCACION SL Spain AAA KPMG SP. Z O.O. Poland AAA JUST ITALIA S.R.L. Italy AAA
Monthly Overview: October 2011
modeFinance AREA Science Park
Padriciano 99 34012 Trieste ITALY
For more information visit: www.modefinance.com
The best company in October, 2011: modeFinance Credit Report
Monthly Overview: October 2011
modeFinance AREA Science Park
Padriciano 99 34012 Trieste ITALY
For more information visit: www.modefinance.com
APPENDIX
MORE rating guide General vision A credit rating is an opinion of the general creditworthiness of an obligor (issuer rating), or the
creditworthiness of an obligor in respect of a specific debt security, or other financial obligation (issue
rating), based on relevant risk factors.
The Multi Objective Rating Evaluation (MORE) model is essentially used to assess the level of distress of
industrial companies by using data included in financial statements.
The basic idea of the model is to analyze a set of financial and economic ratios in a predictive corporate
bankruptcy model with the purpose of creating a fundamental credit rating model for each industrial
sector.
Results of the model are obtained by applying newly developed numerical methodologies, drawing
together financial theory, data mining and engineering design methodologies. The heart of MORE is a multi
dimensional and multi objective algorithm that produces a classification of each company, by taking into
account any attributes (such as sector and country) characterizing a firm.
The model gives the opportunity to assign a rating to a company even without considering a complete data
analysis and allows to process quality information. It induces a better understanding of a company’s
strength and weakness thanks to sophisticated data mining tools and taking into account the analysts’
knowledge.
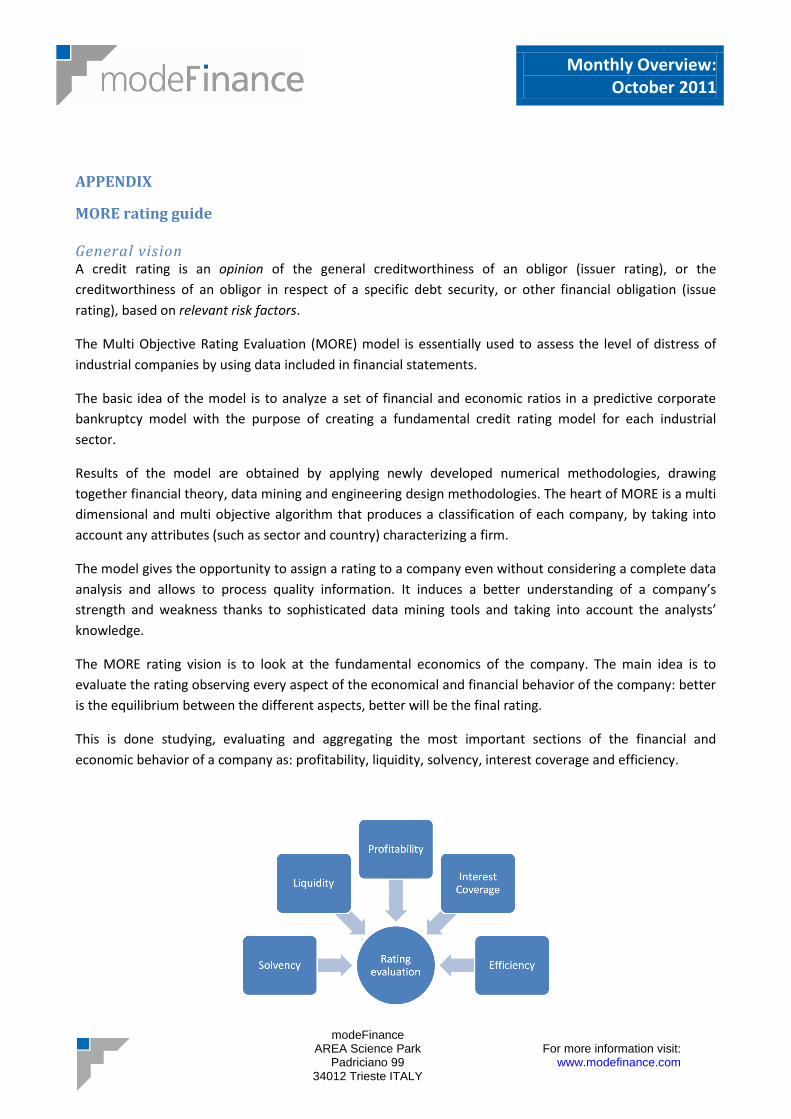
The MORE rating vision is to look at the fundamental economics of the company. The main idea is to
evaluate the rating observing every aspect of the economical and financial behavior of the company: better
is the equilibrium between the different aspects, better will be the final rating.
This is done studying, evaluating and aggregating the most important sections of the financial and
economic behavior of a company as: profitability, liquidity, solvency, interest coverage and efficiency.
Monthly Overview: October 2011
modeFinance AREA Science Park
Padriciano 99 34012 Trieste ITALY
For more information visit: www.modefinance.com
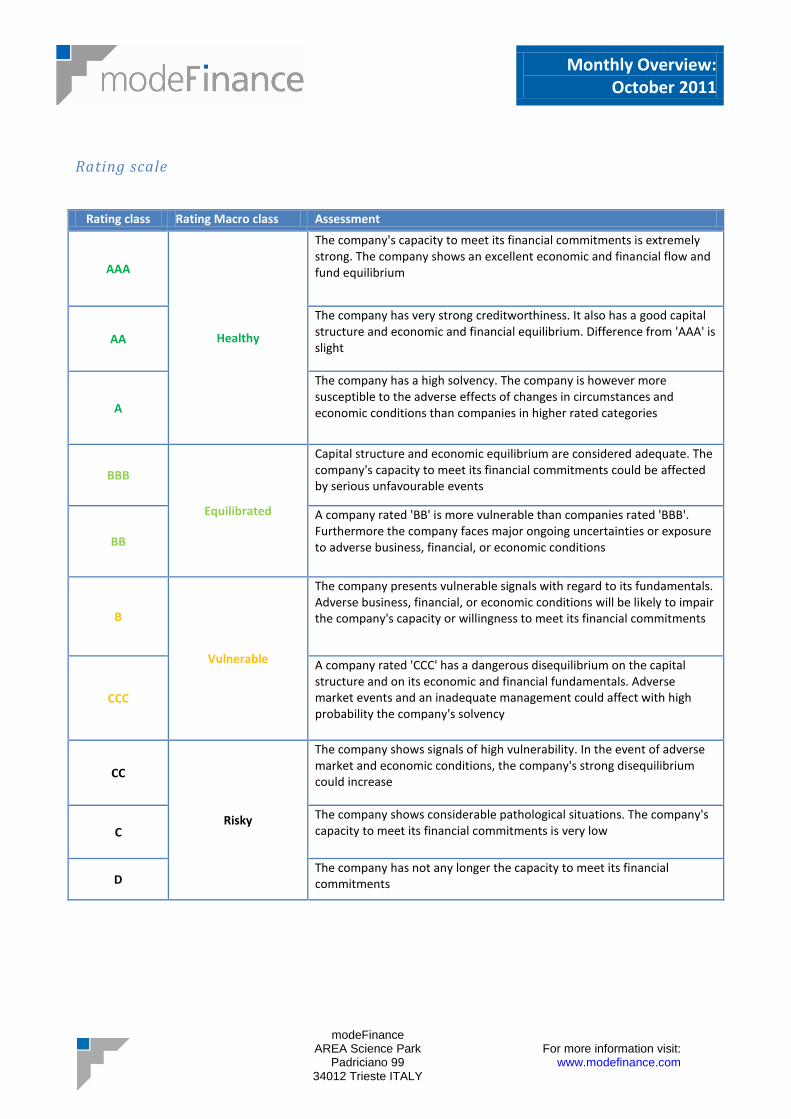
Rating scale
Rating class Rating Macro class Assessment
AAA
Healthy
The company's capacity to meet its financial commitments is extremely strong. The company shows an excellent economic and financial flow and fund equilibrium
AA
The company has very strong creditworthiness. It also has a good capital structure and economic and financial equilibrium. Difference from 'AAA' is slight
A
The company has a high solvency. The company is however more susceptible to the adverse effects of changes in circumstances and economic conditions than companies in higher rated categories
BBB
Equilibrated
Capital structure and economic equilibrium are considered adequate. The company's capacity to meet its financial commitments could be affected by serious unfavourable events
BB
A company rated 'BB' is more vulnerable than companies rated 'BBB'. Furthermore the company faces major ongoing uncertainties or exposure to adverse business, financial, or economic conditions
B
Vulnerable
The company presents vulnerable signals with regard to its fundamentals. Adverse business, financial, or economic conditions will be likely to impair the company's capacity or willingness to meet its financial commitments
CCC
A company rated 'CCC' has a dangerous disequilibrium on the capital structure and on its economic and financial fundamentals. Adverse market events and an inadequate management could affect with high probability the company's solvency
CC
Risky
The company shows signals of high vulnerability. In the event of adverse market and economic conditions, the company's strong disequilibrium could increase
C
The company shows considerable pathological situations. The company's capacity to meet its financial commitments is very low
D The company has not any longer the capacity to meet its financial commitments
Monthly Overview: October 2011
modeFinance AREA Science Park
Padriciano 99 34012 Trieste ITALY
For more information visit: www.modefinance.com
Fundamental Credit Rating Ratios
Solvency ratios
Leverage ratio Measures the level of total liabilities of the company in comparison with equity
Assets to debt Indicates company’s solvency. The company shows a level of deficit when the value of this ratio is under one unit
Financial ratios
Fixed Assets coverage ratio Only for holdings. It measures the capital structure i.e. whether a company covers the fixed assets with long term capital.
Liquidity ratios
Current ratio The current ratio measures whether a company has sufficient short-term assets to cover its short-term liabilities.
Quick ratio The quick ratio compares current liabilities only to those assets that can be readily turned into cash.
Profitability and economic ratios
Return on Investment (ROI) It measures the profitability of company investments without regard to the way the investment is financed.
Return on Equity(ROE) It measures the profitability of the equity.
Asset turnover It indicates the investments turnover with regard to sales. The level assumed from the ratio depends on the sector in which the company operates.
Profit margin It indicates the profitability of the sales.
Interest coverage ratio
Interest Paid coverage Indicate the ability of the company to cover interest expenses through the economic margins (Gross profit and EBIT) and through the cash flow from operating activities.
Monthly Overview: October 2011
modeFinance AREA Science Park
Padriciano 99 34012 Trieste ITALY
For more information visit: www.modefinance.com
mF Credit Limit mF Credit limit is the estimation of the amount of maximum credit that is possible to assign on a
commercial relationship with the analyzed company with an outlook of one year.
modeFinance used the following values associated with the company analyzed while computing the credit
limit:
Size;
Years in Business;
Average number of suppliers;
Liquidity of the company and the comparison with its sector;;
The funds dedicated to be paid to suppliers;
The likelihood that a company October pay its debts in the next 12 months (MORE Ratings).
The credit limit in this report is merely a suggested value of commercial credit limit calculated on the basis
of annual public data. This value should be reviewed by paying attention at the Confidence Level value and
by using other information such as other business information, news... etc; and private information such as
the relationship with client, history of payments, guarantees andthe knowledge of the sector.
Probability of default and Confidence Level In addition to the MORE rating, modeFinance also estimates the probability of default and provides a level
of confidence. The probability of default is the degree of certainty (in quantitative terms) that the company
will go into default.
As the probability of default is strongly affected by the economic climate the company is operating in,
companies in the same MORE class will not necessarily have the same probability of default.
The MORE model can produce a MORE rating even if there is missing data by using an associated
confidence level:
nInformatioTotal
nInformatioAvailableConfidence
The level of confidence does not indicate financial confidence in the company. It is a reflection of the
variations in availability of financial data across Europe due to filing regulations and suggests the degree of
financial detail the MORE rating is able to take into account for each company.
For companies with fully populated records a confidence level of 100% would be applied: companies where
no financial data is provided, 0%. This puts the MORE rating in a context for the user and aids