MODEL BASED APPLICATION LEVEL MIDDLEWARE FOR DESIGN OF WIRELESS SMART CITY Yujie Liang, Rendong Ying, Peilin Liu School of Electronic Information and Electrical Engineering Shanghai Jiao Tong University, 800 Dongchuan Road Shanghai, China Emails: [email protected]Submitted: Feb.12, 2013 Accepted: May 7, 2013 Published: June 5, 2013 Abstract- The Wireless Smart City (WSC), an emerging concept in Smart Grid and Internet of Things, has attracted an increasing number of customers and developers - based with its promise of low cost implementation and flexibility. At the same time, the challenges faced with in the field applications hinder the progress of WSC from researches into commercial production. A model based application level auxiliary platform is presented to help the development of WSC. This middleware together with the existing network simulators replace field test during WSC design. The proposed platform reduces engineering cost and increases development efficiency. Network optimization is implemented to provide an automatic design of WSC. Index terms: Smart City, Performance Evaluation, Optimal Deployment, Simulated Annealing, Wireless Sensor Network INTERNATIONAL JOURNAL ON SMART SENSING AND INTELLIGENT SYSTEMS VOL. 6, NO. 3, JUNE 2013 1180
Transcript
MODEL BASED APPLICATION LEVEL MIDDLEWARE FOR
DESIGN OF WIRELESS SMART CITY
Yujie Liang, Rendong Ying, Peilin Liu
School of Electronic Information and Electrical Engineering
Yujie Liang, Rendong Ying, Peilin Liu, MODEL BASED APPLICATION LEVEL MIDDLEWARE FOR DESIGN
1187
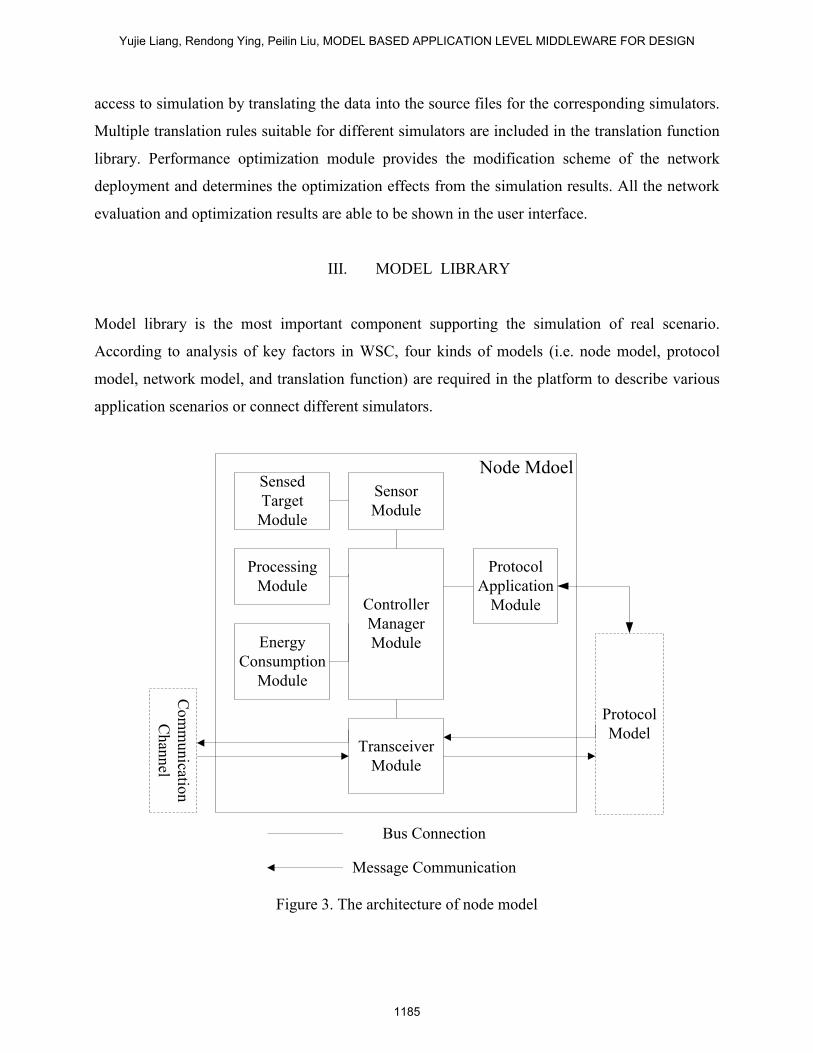
Attenuation through space obstacles must be considered in order to present a realistic model of
communication channel with multiple obstacles in the simulation. Here, we give the examples of
radio propagation considering air attenuation, space obstacle attenuation factor and interior
decoration attenuation factor, respectively. A kind of semi-empirical algorithm is used during the
course of channel modeling.
In free space, the power reaching the receiving antenna, which is separated from the transmitting
antenna by a distance d, is given by the Friis free-space equation:
2
2 24
t t rr
PG GP
d L
(1)
where Gt and Gr are the gain of the transmitting and the receiving antenna, respectively. Pt and
Pr are the transmitted and received power, respectively. L is the system loss factor, not related to
propagation. λ is the wavelength in meters. Path loss (PL) can be defined by [9], [10]
10log t
r
PPL dB
P (2)
In the real wireless channel, free space is not the appropriate medium. A general PL model uses
a parameter, γ, to denote the power-law relationship between the separation distance and the
received power. So, path loss can be expressed as [9], [11]
00
10 log dPL d PL d Xd
(3)
where d0 is the received-power reference point. Xσ denotes a zero-mean Gaussian random
variable of standard deviation σ. γ=2 characterizes free space. However, γ is generally higher for
wireless channels. In the villa, γ is measured as 2.74.
The floor and wall attenuation are seen as a mean path loss exponent that was a function of the
number of floors or walls between source and destination [11]. If the distance between source and
destination is much larger than the thickness of floor or wall, the factor of angle should be
neglected. The path loss then takes the form [9]
S
s
G
Q
q
F
P
p
W qSPAFqSPAFpSPAFdddBdPL111
0/log10 (4)
where P, Q, S are the number of walls and floors, respectively. SPAFW, SPAFF, SPAFG are the
attenuation factor of wall, floor, and glass partition, respectively. These three factors can be
calculated from the measurements.
INTERNATIONAL JOURNAL ON SMART SENSING AND INTELLIGENT SYSTEMS VOL. 6, NO. 3, JUNE 2013
1188
The analysis of interior decoration attenuations is similar to that of space partition attenuations.
The only difference is that the impact factor of radio propagation angel can not be neglected
because of the irregular shape of the decoration object. The path loss then is expressed as
0
1
10log / / cosP
p
PL d dB d d IDAF p
(5)
where θ is the angle. IDAF is the attenuation factor of interior decoration. Considering that angel
is related to the position of source and destination. The path loss also can take the form
0
, , ,
10log / , , ,s s d d
s s d d
x y x y
PL d dB d d IDAF x y x y
(6)
Where xs, ys, xd, yd are x and y positions of source and destination, respectively.
The case of continuous even distributed objects is specially considered in the RPM which
requires a huge amount of calculations. According that the distance between any two objects is a
constant, the attenuation through this kind of object array can be seen as the function of the
distance interval d. The PL model with object array attenuation factor is
0 010log / , 10log / avg
dPL d dB d d IDAF d d d IDAF
D
(7)
d. Translation Function
Translation function is aimed to provide an application interface for the simulators. As the types
of source files in various simulators differ from one another, a library is necessary in the platform
to make it easy to connect with these different simulators. Translation rules are included in
library aimed to the corresponding simulator and may modified by the professional users with the
change of simulator.
IV. OPTIMIZATION OF NETWORK DEPLOYMENT
a. Performance Evaluation Metric
As the proposed platform is designed for field application, no complex performance evaluation
metrics are commended in it. Simple and direct evaluation conclusions are pursuit by the field
experts not major in the communication field. An evaluation metric, named RCT, is provided in
this section in order to quickly estimate the performance of WSC in which reliability and
timeliness are the two important requirements of control system. RCT is measured in terms of the
Yujie Liang, Rendong Ying, Peilin Liu, MODEL BASED APPLICATION LEVEL MIDDLEWARE FOR DESIGN
1189
network reception rate, to estimate performances of the whole system. The network reception is
defined how many percentage of packets sent can be received correctly and timely. In this
definition, there are three conditions of packet reception: the first one is that the packet must
arrive at the destination; the second one is that the received packet should be correct; and the
third one is that the arrival time is less than the threshold value. In general, system fault in
process of data exchange in WSC can be divided into two types: transmission failure and
reception out of time. Transmission failure means that the packets are dropped by senders or
routers. And reception out of time means that the arrival time of packet is larger than the
threshold value. In the following, the arrival time threshold is set as 0.05s, which means that the
packet arriving beyond 0.05s is seen as the reception out of time. Prtimeout is defined as the
probability of timeout reception, which can be expressed as
0 0
Pr Pr 1 Pr
S S
S S
T T
recv recv
t T t Ttimeout S timelyT T
recv recv
t t
r t Packet
T t T
r t Packet
(8)
where T is the arrival time threshold. Ts is the simulation time. rrecv(t) is the packet sending rate.
Packetrecv is the packet number received by destinations in each time unit. Prtimely is the timely
reception rate. And Prfailure is defined as the probability of sending failure, which can take the
form
Pr Pr 1 Prsent recv
failure S correctly
sent
Packet PacketT t
Packet
(9)
where Packetsend is the number of packets expected to be sent to the destinations at a time unit.
Prcorrectly is the correctly reception rate.
As the independence of these two failures, RCT can be expressed as
1
Pr 1 Pr 1 Prn
i timeout failure
i
RCT A
(10)
b. Optimization algorithm
Optimization of network deployment is the obvious advantage of the proposed scheme providing
automatic regulation and judgment. It is aimed to trace a kind of network deployment in line with
the user requirements through some optimal algorithms. Designers have to firstly define the
constraint conditions in the user interface, and then the deployment will be auto-adjusted to meet
these conditions. Various sensitive variables exist in field application to impact performance
INTERNATIONAL JOURNAL ON SMART SENSING AND INTELLIGENT SYSTEMS VOL. 6, NO. 3, JUNE 2013
1190
evaluation and increase optimization difficulty, in which remote control number, user operation,
and node location are all the attractive impact factors changing at any time.
max senVar ,
s.t S sen THR Var R ,
senMIN sen senMAXVar Var Var (11)
where Varsen is the sensitive variable, VarsenMIN and VarsenMAX are the minimum and maximum
value of the sensitive variable. RTH is the threshold of RCT defined in different fields.
In the first time, we select Simulated Annealing (S.A.) to implement the network optimization
which is based on an iterative improvement technique, suitably corrected introducing random
moves [14]. A generation and an acceptance procedure for the different network configurations
must be introduced during the process of such an algorithm, or, better, a perturbation method has
to be defined allowing to pass from one configuration to another. The acceptance criterion is
managed by a random number generator and a control parameter, called temperature.
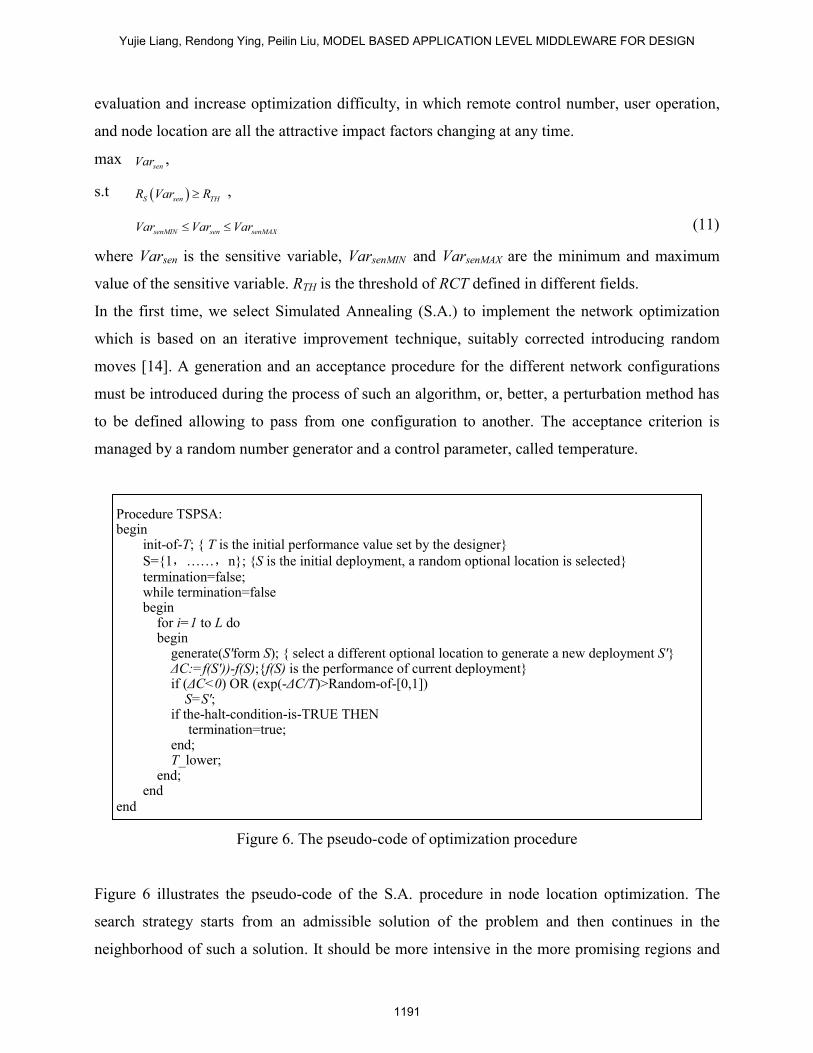
Figure 6. The pseudo-code of optimization procedure
Figure 6 illustrates the pseudo-code of the S.A. procedure in node location optimization. The
search strategy starts from an admissible solution of the problem and then continues in the
neighborhood of such a solution. It should be more intensive in the more promising regions and
Procedure TSPSA: begin
init-of-T; { T is the initial performance value set by the designer}
S={1,……,n}; {S is the initial deployment, a random optional location is selected}
termination=false; while termination=false begin for i=1 to L do begin generate(S′form S); { select a different optional location to generate a new deployment S′} ΔC:=f(S′))-f(S);{f(S) is the performance of current deployment} if (ΔC<0) OR (exp(-ΔC/T)>Random-of-[0,1]) S=S′; if the-halt-condition-is-TRUE THEN termination=true; end; T_lower; end; end
end
Yujie Liang, Rendong Ying, Peilin Liu, MODEL BASED APPLICATION LEVEL MIDDLEWARE FOR DESIGN
1191
avoiding the searches that move far from these regions but accepting with certain probability,
also searches that worsen the solution. Slowly modifying of the temperature T drives the system
toward the final solution, which corresponds to a local minimum of the objective function.
Metropolis algorithm is the core of this procedure. The value of exp(-ΔC/T) is a number in [0,1]
when ΔC and T are positive, which may be correctly understood as a probability dependent on
ΔC and T . The cooling ratio of T represents the number of iteration executed for each value of
the temperature, i.e., the length of the Markov chain in the Metropolis algorithm.
V. SIMULATION RESULTS AND ANALYSIS
a. Simulation Environment
In this paper, we use this proposed platform to test the scenario of a 3-theroy villa building. A
home WSC is equipped in a villa which is composed of 34 wireless nodes. The structure of villa
building incorporating 300m2 of living space brings the growing number and type of device
nodes and space obstacles to complicate the network topology and increase the space
interferences. The size of each storey is 12m×8m and the height is 3m. There are 3 bedrooms, 3
living rooms, and some other functional rooms in the villa, in which 6 persons are assumed to
live. Devices in WSC are classified into sources and destinations. There are 4 thermostats and 8
remote controls in the villa which are two kinds of sources. Each thermostat transmits one packet
to its destination every 60s. The remote control is set to transmit traffic according to the Poisson
distribution or the constant distribution with different operation intervals and the lower limit of
100ms is obtained from the hardware information. The detailed parameters of all user operations
in the villa are listed in Table 1.
IEEE 802.15.4/ZigBee (unslotted CSMA/CA mode) is selected as the communication protocol in
this WSC is. The simulator selected in this section is OPNET Modeler. Compared field test is
implemented in the testbed of TI CC2430.
b. Performance Evaluation and Optimization
We choose RCT as the metric in this lecture to comprehensive evaluate the performances of
control and sensing in the WSC. RCT is defined as the packet number received correctly and
INTERNATIONAL JOURNAL ON SMART SENSING AND INTELLIGENT SYSTEMS VOL. 6, NO. 3, JUNE 2013
1192
timely by the sink node per second. The sensitive variables of sending frequency per source,
source number, and node position are discussed in this section.
Table 1: Parameter Settings of user operations
Source Destination Operation Interval (s)
G1 A1, C1, D1 ≥0.1
H1 B1, E1, F1, J1 ≥0.1
I1 J1 60
K1 J2, L2, N2, G3, I3 ≥0.1
G2 A2, C2, D2, E2, J2 ≥0.1
H2 B2, C2, D2, F2, L2 ≥0.1
I2 J2 60
K2 L2 ≥0.1
M2 N2 ≥0.1
E3 A3, B3, C3, D3, G3 ≥0.1
F3 G3 60
H3 I3 60
b. i Discussion on variable of source number
The number of traffic created by source nodes directly impacts the network load. The worst case
is that all the source nodes deliver packets at the same time. How many source nodes are allowed
to send control commands at one time should come into view.
Figure 7(a) shows the continuous decreasing trend of RCT with the growing source number at the
range of sending frequency from 0packet/s/source to 10packet/s/source. When source number is
larger than 4 and sending frequency is larger than 2 packet/s/source, MAC contentions are
brought about and enhanced with the increasing source number causing packet losses. Otherwise,
all the traffic can arrive at the determination timely with no error which means the value of RCT
can be kept as 100%. Figure 7(b) illustrates the comparison between field test and simulator in
the case of 2 packets transmission per second per source. The results of field test are changed on
the same trend of that obtained from the proposed scheme. The error rate of simulation in this
case is shown in figure 7(c), the maximum value of which is within 7%. When the source number
is large, the error rate is promoted because of the incomplete modeling of MAC contentions. It is
Yujie Liang, Rendong Ying, Peilin Liu, MODEL BASED APPLICATION LEVEL MIDDLEWARE FOR DESIGN
1193
required to be improved in the next work. Figure 7(d) shows the optimization tracing of source
number when sending frequency is kept as 2packet/s/source. The maximum number of
optimization step is set as 6. The target RCT is set as 99%. The halt condition is that the number
of outside loops is larger than that of optional locations. And the optimal value of source number
is 6 which is Metropolis accepted by S.A. algorithm.
(a) RCT with variable sending frequency
(0~10 packet/s/source)
(b) RCT comparison between field test and
simulation when sending frequency is
2packet/s/source
(c) Error rate of simulation when sending
frequency is 2packet/s/source
(d) Optimization process of source number
when sending frequency is
2packet/s/source
Figure 7. Performance evaluation and optimization with variable source node number
INTERNATIONAL JOURNAL ON SMART SENSING AND INTELLIGENT SYSTEMS VOL. 6, NO. 3, JUNE 2013
1194
b. ii Discussion on variable of sending frequency
(a) RCT with variable source number (0~12) (b) RCT comparison between field test and
simulation when source number is 6
(c) Error rate of simulation when source
number is 6
(d) Optimization process of sending
frequency when source number is 6
Figure 8. RCT at variable user operation
Lowering network load is one of the best ways to enhance the system reliability. Except for
reducing source number, changing operation frequency has the same impact on the performance
enhancement. Therefore, we discuss the minimum time user should keep between two operations.
Actually, not all e traffic at the APS layer can be successful sent to the MAC layer due to
constraint of queue length in the hardware. This fact forms a kind of flow control at the APS
Yujie Liang, Rendong Ying, Peilin Liu, MODEL BASED APPLICATION LEVEL MIDDLEWARE FOR DESIGN
1195
layer to decrease the number of packets waiting to be sent. The packets at the APS layer could be
sent to the MAC Layer successfully when the sending frequency is less than 1.03packet/s/source,
Shown in Figure 8(a), RCT is decreasing with increasing sending frequency at the range of source
number from 0 to 12. Figure 8(b) illustrates the comparison between field test and simulator in
the case of 6 source nodes existing. The results of field test are changed on the same trend of that
obtained from the proposed scheme. The error rate of simulation in this case is shown in figure
8(c), the maximum value of which is within 11%. Multiple source nodes promote the error rate
because CC2430 is a kind of integrated wireless microcontroller. There are no detailed
performance introductions of each component (such as RF frontend, power unit, and processer)
so that the node model is not accurate. Figure 8(d) shows the optimization tracing of sending
frequency when source number is kept as 6. The maximum number of optimization step is set as
6. The target RCT is set as 99%. The halt condition is that the number of outside loops is larger
than that of optional locations. And the optimal value of sending frequency is 3packet/s/source
which is get at the 5th
step by S.A. algorithm.
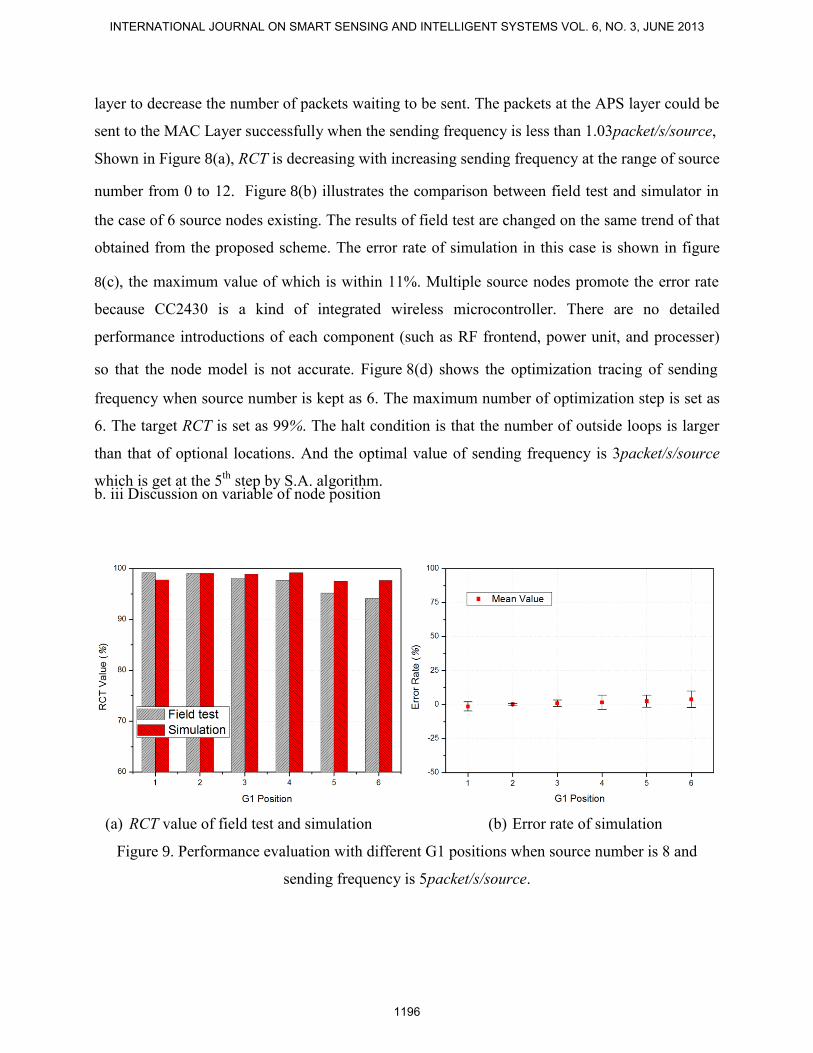
b. iii Discussion on variable of node position
(a) RCT value of field test and simulation (b) Error rate of simulation
Figure 9. Performance evaluation with different G1 positions when source number is 8 and
sending frequency is 5packet/s/source.
INTERNATIONAL JOURNAL ON SMART SENSING AND INTELLIGENT SYSTEMS VOL. 6, NO. 3, JUNE 2013
1196
In this case, the end device G1 is selected as the optimal object which can be installed in six
optional positions which are labeled as red circle in figure 10. Source number is set as 8 and
sending frequency is set as 5packet/s/source.
Figure 9(a) shows the system performance in different positions. The error rate of simulation is
shown in figure 9(b), the maximum value of which is within 3.2%.
Table 2: Optimization tracing of G1 location
Step 3D Coordinates of G1 Optimization
X (m) Y (m) Z (m) RCT (%) Is opt.
1 4.0 7.5 3.0 97.8 No
2 9.0 2.5 1.2 99.1 New Opt.
3 4.0 0.5 1.2 98.9 Metropolis
Accepting
4 6.0 1.5 1.2 99.2 New Opt.
5 5.5 0.5 3.0 97.5 No
6 11.5 7.5 3.0 97.7 No
The optimization process is listed in Table 2. The maximum number of optimization step is set as
6. The target RCT is set as 99%. The halt condition is that the number of outside loops is larger
than that of optional locations. Firstly, the initial position of G1 is randomly selected from the six
optional ones. Figure 10 shows the optimal result of network deployment. The 3D coordinates of
the optimal location of G1 is (6.0m, 1.5m, 1.2m) which is labeled as red solid circle in figure 10.
the optimal position via optimization process
the optional positions of G1
Figure 10. The optimal result of network deployment
Yujie Liang, Rendong Ying, Peilin Liu, MODEL BASED APPLICATION LEVEL MIDDLEWARE FOR DESIGN
1197
VI. CONCLUSIONS
Computer aided simulation takes place of the traditional field test to provide a quick and effective
way to evaluate the real scenario of WSC. The existing simulators are not suitable for the domain
experts except for the professional software engineers. Thus, a model based application level
middleware is present in this paper to assist the simulator in the system simulation. Friendly user
interface makes all designers implement the simulation without constraint of professional
knowledge. Huge model libraries guarantee the accuracy of simulation results and reduce the set-
up time of a new scenario. Translation function provides the various simulation interfaces
suitable for different simulators. Furthermore, this middleware has the function of automatic
optimization to give the deployment suggestions to designers which is not provided by the
existing simulators. The application of this platform highly reduces engineer costs and promotes
design efficiency. Accurate and reliability performance evaluation and analysis can be acquired
with the implementation of this platform.
REFERENCES
[1] V. C. Gungor, D. Sahin, T. Kocak, S. Ergut, C. Buccella, C. Cecati, G. P. Hancke, “Smart
Grid Technologies: Communication Technologies and Standards”, IEEE Trans. on Industrial
Informatics, vol. 7, no. 4, pp. 529-539, 2011.
[2] M. Zorzi, A. Gluhak, S. Lange, A. Bassi, “From Today’s INTRAnet of Things to A Future
INTERnet of Things: a Wireless- and Mobility-Related View”, IEEE Wireless Communications,
vol. 17, no. 6, pp. 44-51, 2010.
[3] S. Edward Jero, A. Balaji Ganesh, and T. K. Radhakrishnan, "Implementation of A Simple
Wireless Sensor Node for the Detection of Gaseous Substances Leakage", International Journal
on Smart Sensing and Intelligent Systems, vol. 4, no. 3, pp. 482-495, 2011.
[4] T. Jayakumar, C. Babu Rao, John Philip, C. K .Mukhopadhyay, J. Jayapandian, and C.
Pandian, "Sensors for Monitoring Components, Systems and Processes", International Journal on
Smart Sensing and Intelligent Systems, vol. 3, no. 1, pp. 61-74, 2010.
[5] M. Al-Bado, C. S engul, and R. Merz, “Accuracy-Preserving Measurement Collection for
Realistic Wireless Simulations”, in Proc. IEEE ISCC, 2012.
INTERNATIONAL JOURNAL ON SMART SENSING AND INTELLIGENT SYSTEMS VOL. 6, NO. 3, JUNE 2013
1198
[6] P. Horvath, M. Yampolskiy, Y. Xue, X. D. Koutsoukos, and J. Sztipanovits, “An Integrated
System Simulation Approach for Wireless Networked Control Systems”, in Proc. IEEE ISRCS,
2012.
[7] M. Al-Bado, C. Sengul, and R. Merz, “What Details are Needed for Wireless Simulations? -
A Study of A Site-Specific Indoor Wireless Model”, in Proc. IEEE INFOCOM, 2012.
[8] F. V. Gallego, J. Alonso-Zarate, C. Liss, C. Verikoukis, “OpenMAC: A New Reconfigurable
Experimental Platform for Energy-Efficient Medium Access Control Protocols”, IET Science,