22
Model Evaluation Saed Sayad 1 www.ismartsoft.com
| Date post: | 30-Dec-2015 |
| Category: |
Documents |
| Upload: | aidan-cochran |
| View: | 42 times |
| Download: | 0 times |
Model EvaluationModel Evaluation
Saed Sayad
1www.ismartsoft.com

Data Mining Steps
www.ismartsoft.com 2

Model Evaluation
www.ismartsoft.com 3
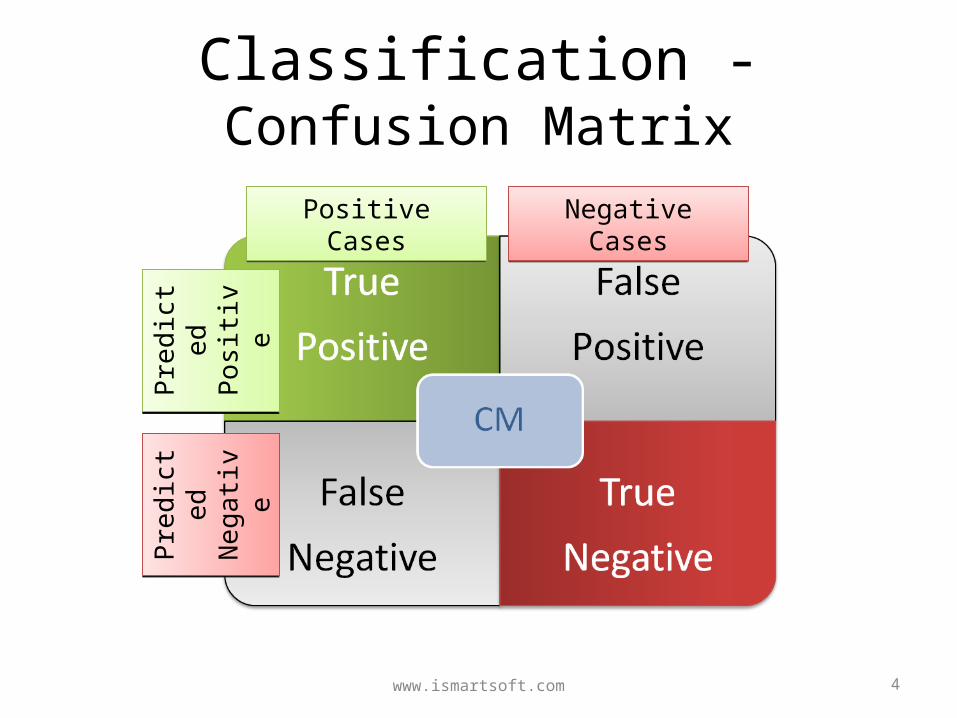
Classification - Confusion Matrix
www.ismartsoft.com 4
Positive CasesPositive Cases Negative CasesNegative Cases
Pred
icte
d Po
sitiv
ePr
edic
ted
Posi
tive
Pred
icte
d N
egati
vePr
edic
ted
Neg
ative
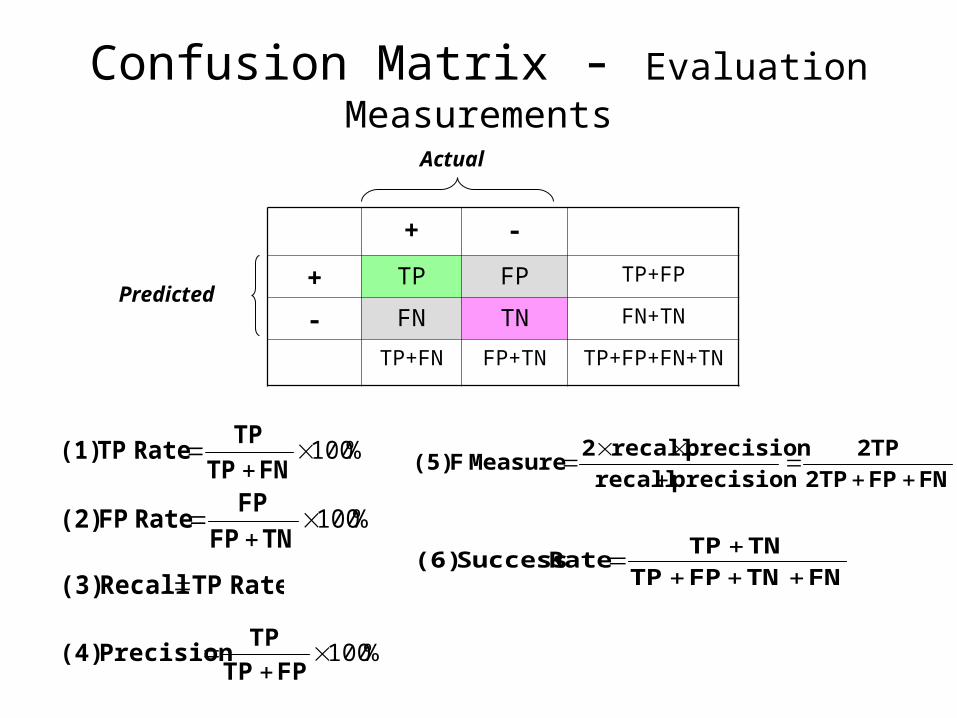
Confusion Matrix - Evaluation Measurements
+ -
+ TP FP TP+FP
- FN TN FN+TN
TP+FN FP+TN TP+FP+FN+TN
%100
FNTP
TP Rate TP (1)
%100
TNFP
FP Rate FP (2)
Predicted
Actual
Rate TPRecall (3)
%100
FPTP
TP Precision (4)
FNFP2TP
2TP
precisionrecall
precisionrecall2 Measure F (5)
FNTNFPTP
TNTP Rate Success (6)
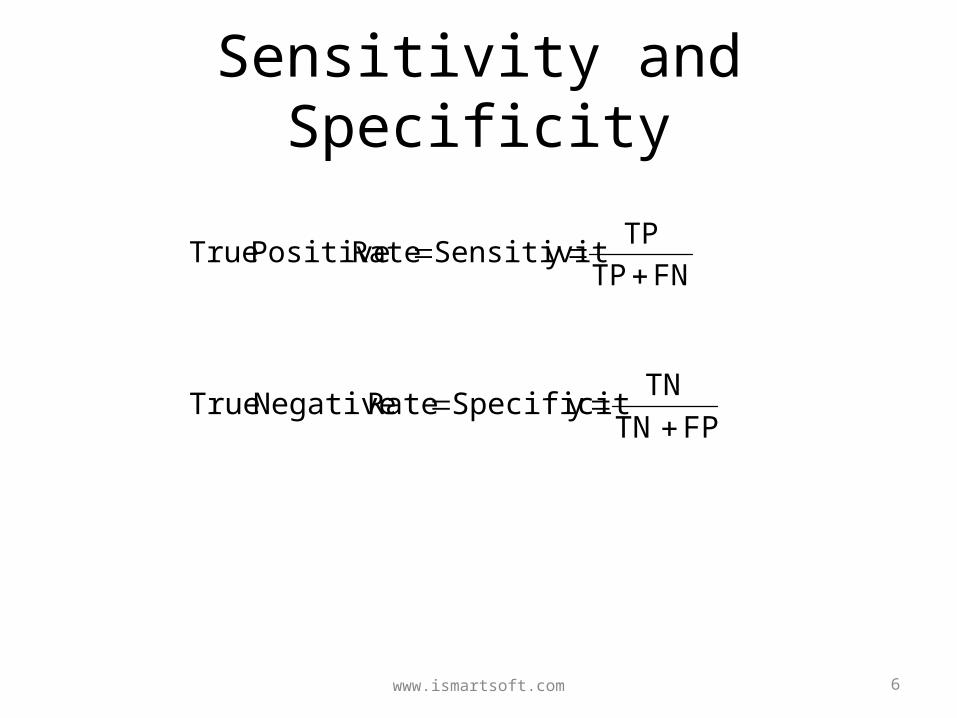
Sensitivity and Specificity
www.ismartsoft.com 6
FNTP
TPySensitivitRate Positive True
FPTN
TNySpecificitRate Negative True

Classification – Gain Chart
www.ismartsoft.com 7
Population%Population%
50%
100%
100%0%
Target%Target%
WizardWizard
RandomRandom
ModelModel
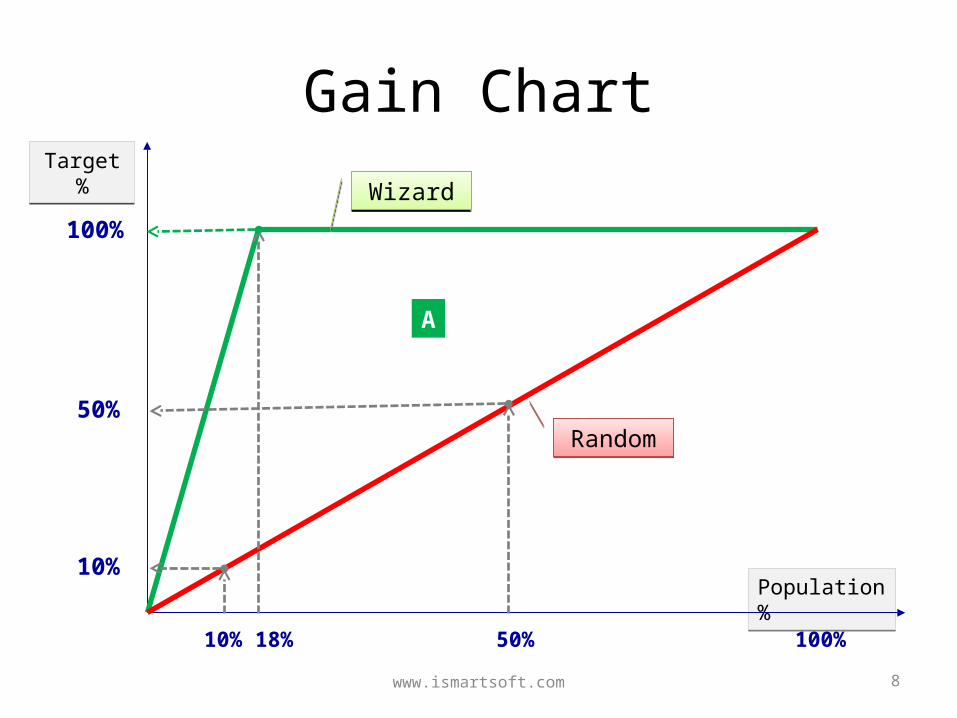
Gain Chart
www.ismartsoft.com 8
Population%Population%
50%10% 18%
100%
100%
10%
Target%Target%
RandomRandom
WizardWizard
50%
A
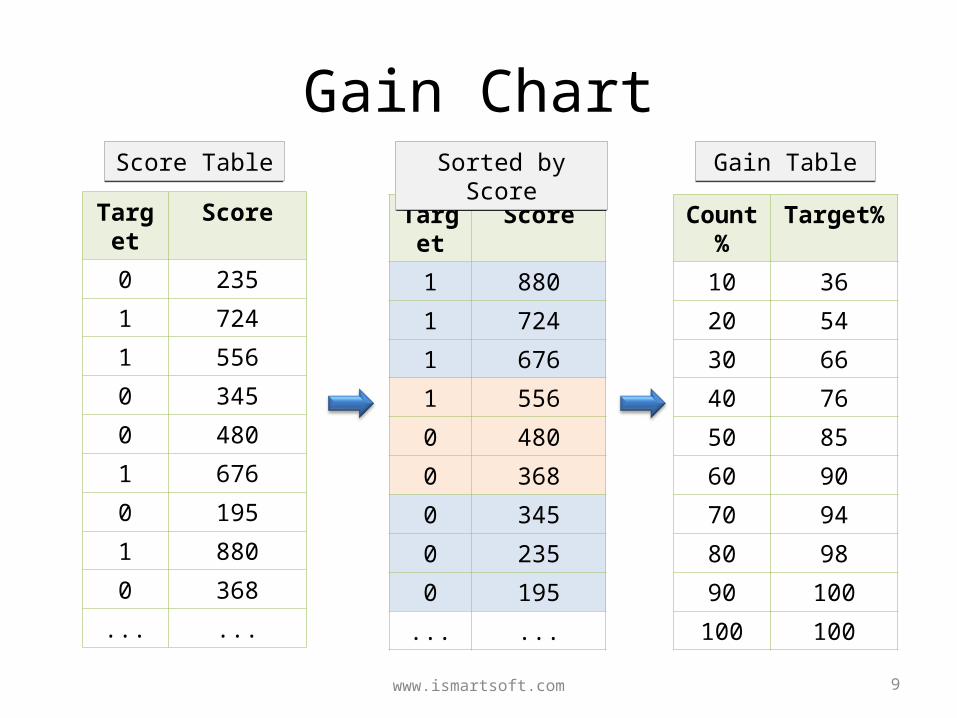
Gain Chart
Target Score
0 235
1 724
1 556
0 345
0 480
1 676
0 195
1 880
0 368
... ...
www.ismartsoft.com 9
Target Score
1 880
1 724
1 676
1 556
0 480
0 368
0 345
0 235
0 195
... ...
Sorted by ScoreSorted by Score
Count% Target%
10 36
20 54
30 66
40 76
50 85
60 90
70 94
80 98
90 100
100 100
Gain TableGain TableScore TableScore Table

Classification – Gain Chart
www.ismartsoft.com 10
Population%Population%
10% 20% 30% 40% 50%
100%
100%
36%
Target%Target%
Copyright iSmartsoft Inc. 2008
54%
66%
76%
85%
B
A
BIndex Gini
A
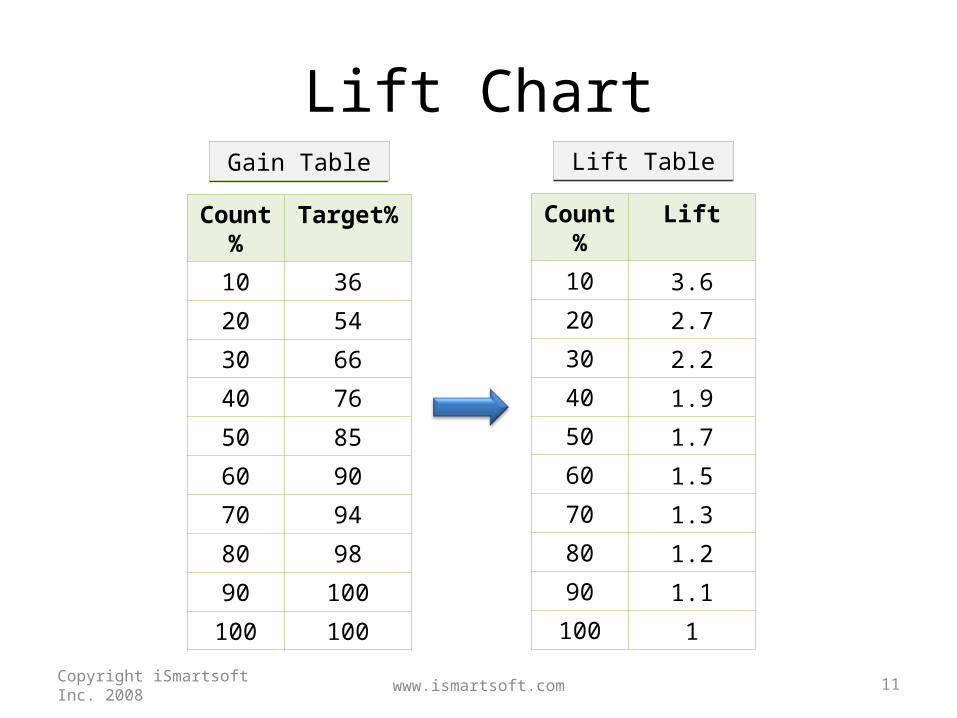
Lift Chart
Copyright iSmartsoft Inc. 2008 www.ismartsoft.com 11
Count% Lift
10 3.6
20 2.7
30 2.2
40 1.9
50 1.7
60 1.5
70 1.3
80 1.2
90 1.1
100 1
Lift TableLift Table
Count% Target%
10 36
20 54
30 66
40 76
50 85
60 90
70 94
80 98
90 100
100 100
Gain TableGain Table
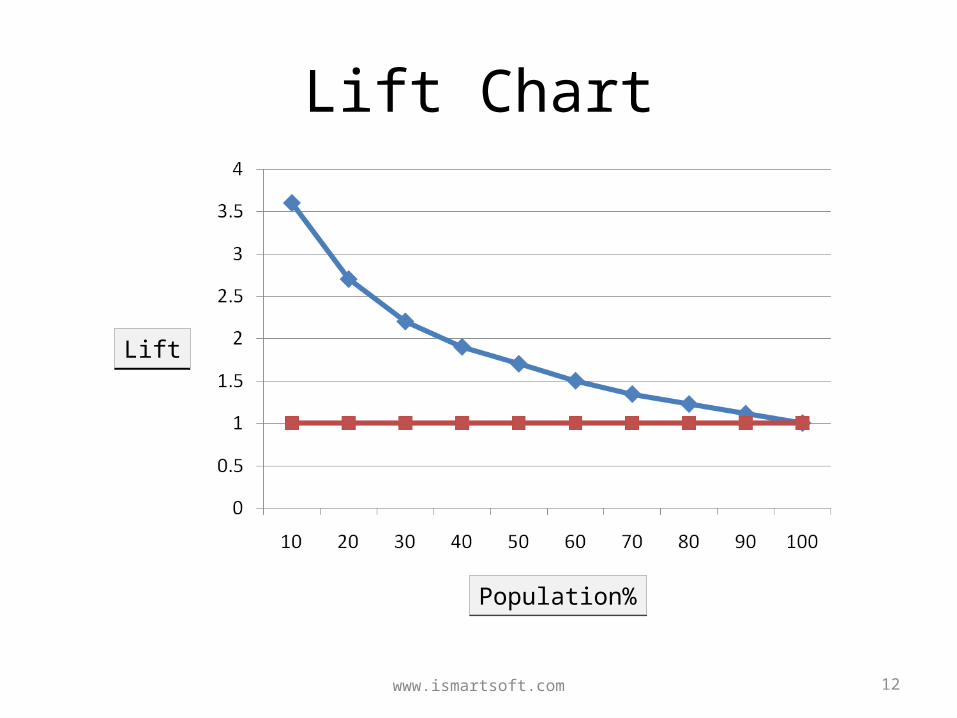
Lift Chart
www.ismartsoft.com 12
LiftLift
Population%Population%

K-S Chart (Kolmogorov-Smirnov)
www.ismartsoft.com 13
Score Range Count Cumulative Count
Lower Upper Target Non-Target Target Non-Target K-S
0 100 3 62 0.5% 0.8% 0.3%
100 200 0 23 0.5% 1.1% 0.6%
200 300 1 66 0.7% 2.0% 1.3%
300 400 7 434 2.0% 7.7% 5.7%
400 500 181 5627 34.3% 81.7% 47.4%
500 600 112 886 54.3% 93.3% 39.0%
600 700 83 332 69.1% 97.7% 28.6%
700 800 45 63 77.1% 98.5% 21.4%
800 900 29 37 82.3% 99.0% 16.7%
900 1000 99 77 100.0% 100.0% 0.0%
K-S
K(0.95) = 6.0% K(0.99) = 7.1%

K-S Chart
www.ismartsoft.com 14
ScoreScore
Count%Count%
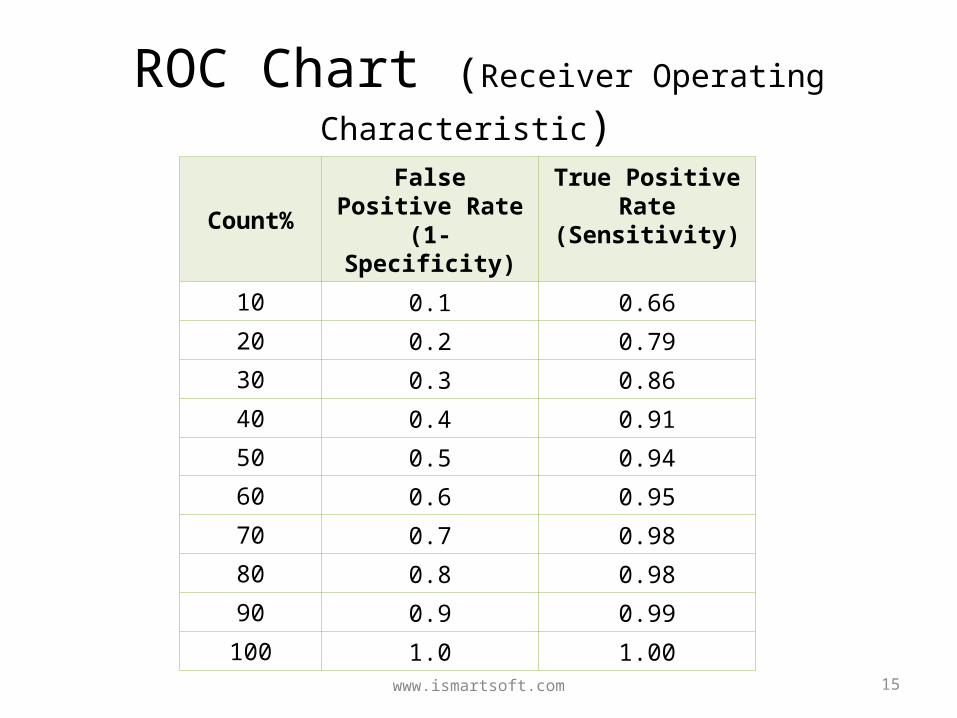
ROC Chart (Receiver Operating Characteristic)
www.ismartsoft.com 15
Count% False Positive Rate (1-Specificity)
True Positive Rate(Sensitivity)
10 0.1 0.66
20 0.2 0.79
30 0.3 0.86
40 0.4 0.91
50 0.5 0.94
60 0.6 0.95
70 0.7 0.98
80 0.8 0.98
90 0.9 0.99
100 1.0 1.00
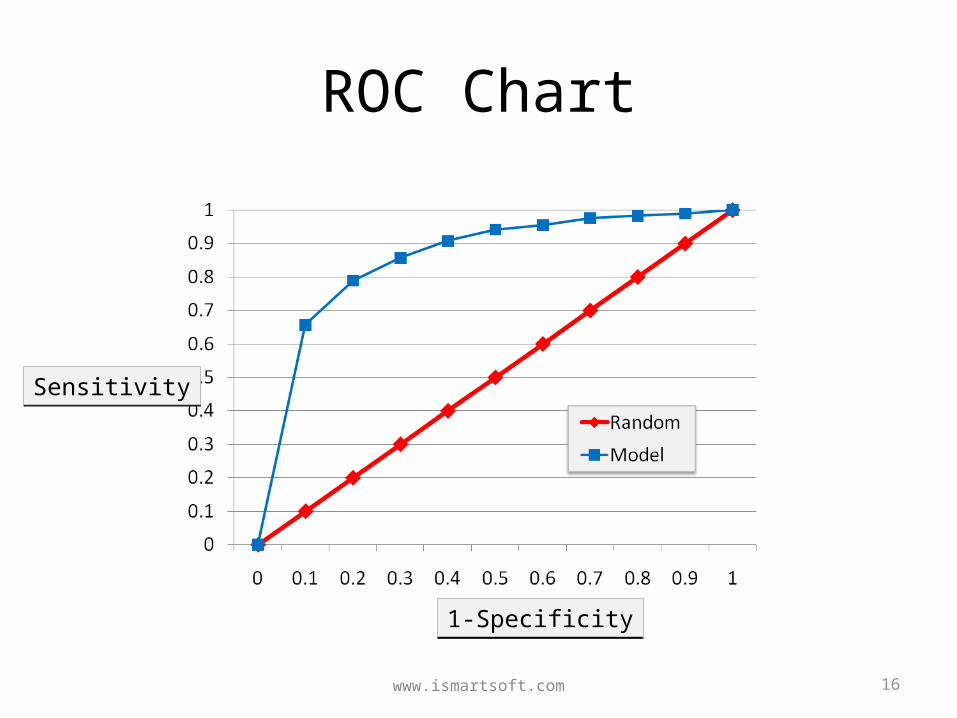
ROC Chart
www.ismartsoft.com 16
1-Specificity1-Specificity
SensitivitySensitivity
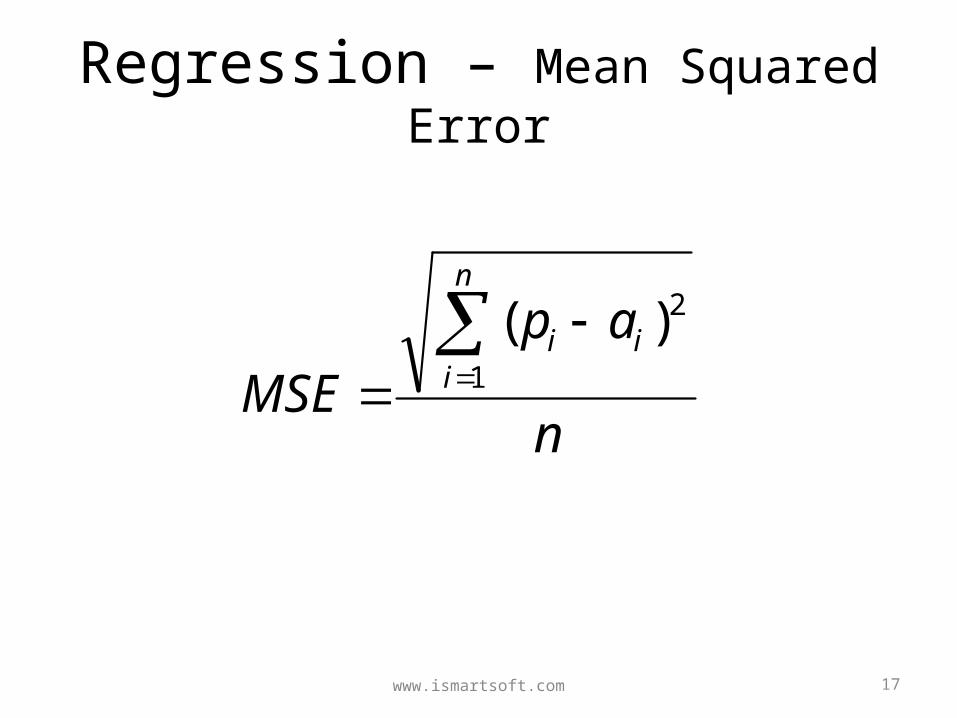
Regression – Mean Squared Error
www.ismartsoft.com 17
n
ap
MSE
n
iii
1
2)(

Regression – Relative Squared Error
www.ismartsoft.com 18
n
iii
n
iii
aa
apRSE
1
2
1
2
)(
)(

Regression – Mean Absolute Error
www.ismartsoft.com 19
n
apMAE
n
iii
1

Regression – Relative Absolute Error
www.ismartsoft.com 20
n
iii
n
iii
aa
apMAE
1
1

Regression – Standardized Residuals Plot
www.ismartsoft.com 21
Standard Residuals
-2-1.5
-1-0.5
00.5
11.5
22.5
0 5 10 15 20 25
e
ii S
ed

22www.ismartsoft.com
Questions?


