That temperature anomalies cause coral bleaching and deathhas been demonstrated in countless studies, as has the factthat not all coral species are equally affected (Coles and
Brown, 2003). Among the corals, variable resistance to bleach-ing (Loya et al., 2001) may either be genetically determined atspecies-level or by distribution and environmental variabilitywithin any given reef (McClanahan et al., 2007). Among themore susceptible species, the genus Acropora, a dominant reef
e c o l o g i c a l m o d e l l i n g 2 2 0 ( 2 0 0 9 ) 192–208 193
framework-builder in the Indo-Pacific and until fairly recentlyalso in the Atlantic, is a conspicuous member.
A disadvantage or, worse, loss of Acropora as dominantspecies has important biological and geological implicationsstretching from changes in community structure to the near-cessation or switch-off of reefbuilding. It is unclear whetherreef corals will be able to adapt to bleaching (Baker et al.,2004) or whether constantly upward-inching temperatureexcursions will cause extinction of species (Sheppard, 2003;McClanahan et al., 2007).
In the Arabian/Persian Gulf, Acropora is of overwhelm-ing importance in the relatively species-poor assemblagethat makes up the region’s bioherms, biostromes and non-framebuilding communities. Up to six Acropora species occur,but species richness varies with recurring mortality eventscaused by strong cold- or hot-spells that primarily disad-vantage Acropora species (Riegl, 1999, 2002, 2003; Purkis andRiegl, 2005). Since this genus is a dominant space-competitor,any mortality is truly compensatory (sensu Connell, 1978)with important implications for population and commu-nity dynamics (Connell, 1975). Riegl (1999, 2001) and Purkisand Riegl (2005) maintained that this repetitive mortalitywas necessary to explain assemblage structure and spa-tial patterns in nearshore biostromal and non-framebuildingcommunities. Little, however, is known about the vital rates(fecundity, mortality rates) and other population parametersthat would make survival possible in such a dramatic distur-bance regime.
With this background and scenarios of impending globalwarming (Sheppard, 2003), we were interested in modelingthe dynamics of Arabian/Persian Gulf coral assemblages ina way that would allow us to better understand competi-tion, population dynamics and how assemblage structure ismaintained or altered. The same model would then allowus to forecast changes in various disturbance scenarios.But models of population dynamics and competition requireestimates of population sizes, interaction parameters andfertilities for parameterization. Much of this information isnot easy to come by, especially when working far fromhome base and in management environments that do notallow unhindered research. In our case, this led to a sig-nificant shortfall of baseline data, which we attempted tomitigate by using remote-sensing data, in particular theinformation on areas classified as corals (Purkis and Riegl,2005), to upscale population size-estimates made in smallerareas.
Due to its extreme temperature environment, the Ara-bian/Persian Gulf has been presented as an ideal laboratoryto evaluate coral reef persistence in global change conditions(Riegl, 2003). In the Arabian/Persian Gulf, reef corals alreadypersist at temperatures forecast to affect many more temper-ate areas (Sheppard, 2003). Therefore, here developed modelhas relevance beyond the regional scope since the predictedrates and patterns of regeneration or collapse will be similarin other systems.
In this study we (1) build an ODE (ordinary differen-tial equation)-based mathematical model of population andspecies-interactions to capture competitive dynamics, (2) useremote sensing to estimate some key population parametersof a model (N of corals at specific time-step, carrying capac-
Fig. 1 – The Arabian/Persian Gulf and the two chosen studyareas in U.A.E. (Ras Hasyan) and Qatar (Halul).
ity), (3) find the necessary vital rates using field observations,remote sensing and literature and examine their plausibleranges by sensitivity analysis, (4) verify whether such a com-munity can theoretically persist in the postulated disturbanceenvironment, (5) examine assemblage dynamics under dif-ferent disturbance regimes and (6) forecast likely shifts orpersistence of community patterns in a warming climatewith increasingly frequent temperature-mediated bleachingevents.
2. Study area
Our study area was defined by the gently sloping bathymetryof the Arabian homocline along the mainland coastline andhighs produced primarily by salt diapirism that form banksand offshore islands (Purser and Seibold, 1973). With regardsto the recent coral ecosystem, wind and waves are amongthe dominant determinants of temperature and turbidity.Land/sea breezes and the seasonal northerly Shamal windsinfluence local wave-induced currents and thus sedimenttransport, water clarity and habitat suitability for corals(Kirkham, 1998; Sheppard et al., 1992). The north–west trend-ing coastline of the U.A.E. and the northern edges of theoffshore islands are most strongly influenced by the Shamaldue to absence of shelter by offshore barriers. Traditionally,these have been the areas with best coral framework develop-ment (Purser, 1973; Schlager, 2005).
Two systems were studied in greater detail (Fig. 1). Severalsquare-kilometers between Jebel Ali and Ras Hasyan (UnitedArab Emirates) were investigated with 4-m resolution Ikonossatellite imagery and Halul Island (Qatar) was studied with28-m resolution Landsat TM. Details of imagery and imageprocessing are given in Purkis et al. (2005), Purkis (2005).The studied system near Ras Hasyan (U.A.E., Fig. 1) extendedshore-parallel for ∼7 km and ∼1.5 km offshore, and attained atypical depth of 8 m. Previous studies (Riegl, 1999, 2002; Purkisand Riegl, 2005; Purkis et al., 2005) identified a complicatedhabitat mosaic of coral carpets (=biostromes), unconsolidatedsand, macroalgae and seagrass, frequently underlain by hard-grounds (Shinn, 1969). Five coral assemblages of variable livecover occur:
Author's personal copy
194 e c o l o g i c a l m o d e l l i n g 2 2 0 ( 2 0 0 9 ) 192–208
• Large, well-spaced Porites lutea and other Porites mixed withother massive species; widely distributed on hardgrounds.
• Dense patches of tabular Acropora clathrata and A. downingiwith 40–90% live substrate-cover within patches.
• Clusters of faviids (mostly Platygyra daedalea, Cyphastreaserailia, and Favia spp.) either widely spaced or denselypacked.
• Widely spaced Siderastrea savignyana colonies on sandyhardground.
• Patches of densely packed (80% coral cover) columnar Poritesharrisoni intermingled with faviids (Favia spp., and Platygyraspp.).
A comparable coral system exists around the offshoreisland Halul. The island is roughly circular with a discontinu-ous fringe of reefal coral associations (Purser, 1973; Schlager,2005) and a relatively abruptly sloping shelf to about 20 mdepth.
3. Materials and methods
3.1. Ecological background data
Baseline data regarding the biology of the system consistof series of 10 m and 50 m line transects as well as photo-transects taken between 1995 and 2007 between Jebel Aliand Ras Ghantoot, but also at Halul (2004, 2005, and 2006).Overall, 60 photo-transects, 155 line transects exist for theJebel Ali/Ras Hasyan area, 10 photo- and 20 line transects forHalul and 2700 geo-referenced point observations for the AbuDhabi and Qatar offshore islands. Some of these data anddetailed methodologies are published elsewhere (Riegl, 1999,2001, 2002; Purkis and Riegl, 2005; Purkis et al., 2005) and areused here as background information for the calibration ofmodels.
Transects were geo-referenced at the beginning point andplacement was originally stratified random in a geographicalgrid before detailed habitat maps were available (prior to 2002).Later, additional photo-transects were haphazardly placedwithin known sparse and dense coral areas for targeted sam-pling. Photo-transects consisted of overlapping photographsalong a 10-m-long measuring tape. After merging images anddigitizing coral outlines, images were re-gridded to unit pixel-size to allow area calculations. Point observations are short(10 s), geo-referenced video-clips that allow qualitative andsome quantitative observations of coral populations.
Although the coral area at Ras Hasyan, monitored since1995, was recently mostly destroyed by the developmentof artificial islands and causeways, community successionaldynamics was still apparent, revisited and sampled and alsodescribed by Burt et al. (2008). Halul appears to be a keystepping-stone for the regeneration of SE Arabian/Persian Gulfcoral populations, since it was one of the few sites with sig-nificant Acropora recovery. During extensive surveys betweenQatar and Dubai, noteworthy Acropora populations were foundin Qatar only at Umm al Arshan and Halul, in Abu Dhabibetween Taweelah and Ras Ghanada and at Al Hila, in Dubaiat Ras Ghantoot and some survivors near Ras Hasyan, andin Sharjah at Sir Abu Nuair. These sites are also home to
important communities of massive corals and connectivitycan be assumed (own unpubl. data), which is important forthe model.
3.2. The model
We base our assumptions of ecosystem functioning ondynamics observed prior to, during and in the aftermath ofcoral mass mortality caused by temperature anomalies in1996, 1998 and 2002. In 1995, when some parts of the inves-tigated system had presumably reached climax (Riegl, 1999),the following pattern was observed:
Well-defined patches of almost 100% and >100% (tablesovertopping) of Acropora cover were observed. Underneaththe tables was an understory of smaller massive colonies, amixed assemblage of faviids, siderastreids and poritids. Sec-tioning massive corals and tagging of Acropora had yieldedapproximate growth rates of around 1–2 cm per year for mas-sive corals and 5–10 cm per year for Acropora. Thus, the coralassemblage was partitioned into a dominant guild made upby tabular Acropora species (primarily A. downingi and A.clathrata) and a subordinate guild made up by the massivecoral genera (primarily Favia, Favites, Porites, and Pseudosideras-trea). Acropora have more effective nematocysts than faviidsand Porites allowing them to win in competitive interactions(Thomason and Brown, 1986; Baird and Hughes, 2000). Largemassive colonies persisted despite being surrounded by amostly closed canopy of Acropora if the massive colonies hadgrown to a size which made it impossible for the Acropora toovertop or kill them entirely when in physical contact. Thisusually meant a size of at least 30–50 cm diameter in hemi-spherical colonies. In the studied systems and in fact mostArabian/Persian Gulf coral assemblages, topography plays norole since virtually all colonies grow on the same substratumat the same height. This is due to the strong bioerosion thatremoves colonies after mass mortality events (for detailed dis-cussion of this phenomenon see Riegl, 2001).
From these observations, the following dynamics wasinferred.
• the assemblage can be divided into two major guilds: com-petitively dominant branching corals and competitivelyinferior massive corals, within which faviids aggressivelydominate poritids.
• within the guilds, dynamics were assumed to be essen-tially neutral with no species capable of gaining a strongadvantage over the others. Thus the dynamics of the entirecommunity can be subsumed into few equations governingguild-behaviour.
• since large massive colonies persisted even in otherwiseclosed Acropora canopies, it was assumed that the competi-tively inferior massive colonies could grow into a size-refugewhere displacement by others became impossible (Sebens,1982). The mechanism of persistence would be taller sizethan neighboring Acropora, thus eluding being overtopped,and having enough tissue area that losses due to directcompetition could not endanger the inferior competitor’ssurvival.
• while Acropora were considered competitively alwayssuperior outside the size-refuge, they suffer repeated catas-
Author's personal copy
e c o l o g i c a l m o d e l l i n g 2 2 0 ( 2 0 0 9 ) 192–208 195
Fig. 2 – Structure of the model. m = migration term,Di = mortality term, Ri = within-population recruitment term(ignoring immigration), Gi = growth term, ε = aggressionterm, which is Nj(NiRi)/K if species j is aggressed upon byspecies i. K = carrying capacity term indicating thatpresence of stage i in species i has a negative influence onanother stage/species at which the arrow is pointed.Arrows show the direction of an interaction. Solid arrowsare growth-based interaction and point at the recipient ofnumerical increase, i.e., one stage grows or recruits intoanother. Dotted arrows are competitive interactions, thearrow points at the loser.
trophic mortality at roughly decadal scales (Riegl, 1999) asa true compensatory mortality (sensu Connell, 1978) thatwould only displace the dominant competitor, giving mem-bers of the inferior guild an opportunity to reach theirsize-refuge (Connell, 1975).
• all corals started as small, reproductively inactive coloniesthat grew, following a fixed ratio, into large colonies(Babcock, 1991; Hall and Hughes, 1996) (Figs. 2 and 3).
The above described mechanism is a case ofLotka–Volterra-type competition between the dominantand subordinate species. A similar system was developed bySebens (1982) who modelled a competitively inferior speciessuffering mortality from a dominant species only at thesmallest colony stage but that could also attain a size-refugein which it was immune from competition. We extended thismodel to a three-species, two life-stages situation with moreinvolved interactions. Only large specimens were consideredfertile. Recruitment was allowed into any free cell, each cellcould be settled only by one specimen, leading to a finitecarrying capacity (K).
Small Acropora were modelled as follows:
dN1
dt= R1N2
K(K − N1 − N2 − N4 − N6) − N1(G1 + D1 + n) + mA
(1)
where dN1/dt is the rate of change in abundance of the smallstage of the dominant species as a function of fertility of thelarge specimens in the same species (R1N2) with recruits only
allowed to settle into free space (thus subtraction of all largecolony abundances from carrying capacity). Also, fragmentsof big Acropora can enter this group but fragment productionrate is included in R1. Losses occur by growth into the largesize-class (G1) and mortality (D1). Post-settlement mortalityand death of early larval stages, which can be high (Mumbyand Dytham, 2006), is included in R1. Di (i = 1, 3, and 5) occurs inEqs. (1), (3), and (5) and refers to diseases or predation on youngcolonies and can be ignored and included into Gi, in particu-lar when the model focusses on big coral dynamics. We testedboth approaches. An outside, connected, population (A) canadd larvae to the focal population via a migration term m. Ara-bian/Persian Gulf Acropora are prone to local extinction duringmass mortality, which requires another connected populationfor maintanance and regeneration of any local population.An emigration term (n) allows larvae to move from focal toconnected population.
Acropora rapidly grow into big, aggressive colonies. Theirrate of change dN2/dt depends primarily on availability ofsmall colonies and their success to reach the size-refuge(G1N1), mortality rate (D2), and the ability to out-compete otherspecies, which is implicit in other species’ carrying capacitybeing influenced by N2 (see formulae (3) and (5)).
dN2
dt= G1N1 − D2N2 (2)
Faviids are massive corals with slower growth than Acropora,are competitively subordinate, but dominate Porites. Rate ofchange of small colonies depends on adult fertility (R2N4),recruitment density is self-limited as well as by large coloniesof the subordinate guild. Losses occur due to growth (N3G2),other factors like diseases or predation (D3) of direct compe-tition (i.e., overgrowth in same cell) by Acropora recruits (Bairdand Hughes, 2000). The likelihood follows Sebens (1982): spacecovered by any species is Nj, rate of contact per unit spacewith propagules of other species i is NjRiNi/K (i and j denotingdifferent species); hence, if faviids are agressed upon by Acro-pora, but not Porites, this is N3R1N2/K. Faviid recruits are alsohindered by already settled Acropora of the small size-class(hence subtraction of N1 from K). Again, immigration (m) andemigration (n) terms are added/subtracted.
dN3
dt= R2N4
K(K − N3 − N1 − N2 − N4 − N6)
− N3(G2 + D3 + n + R1N2
K) + mB (3)
Large faviid colonies have equivalent dynamics to large Acro-pora. They have reached a size-refuge and can no longer bekilled by other species. They can lose tissue in competition,but would not die. Such tissue loss is shrinkage, but it is neversufficient to shrink back into N3 and size-variability within thebig size-class is ignored. Hence no term for subtraction is nec-essary. A mortality term (D4) allows for inclusion of diseasesand other non-catastrophic mortality.
dN4
dt= G2N3 − D4N4 (4)
Author's personal copy
196 e c o l o g i c a l m o d e l l i n g 2 2 0 ( 2 0 0 9 ) 192–208
Fig. 3 – Dynamics as in Fig. 2 validated by photographs of actual interaction. (a) Acropora downingi and Favia pallida recruitssettled on a Porites lutea; live Porites tissue is seen to the left of the Acropora recruit (b) large faviids competitively encroachon large Porites harrisoni, which is too big to be killed entirely (c) Acropora downingi overgrowing faviids, but most are too bigto be killed (images by G. Foster).
Finally, small poritids are limited due to space pre-emption byall big and small colonies and loose in encounters with recruitsof other species. A portion (N5G3) grows up into adults andreaches a size-refuge, in which neither Acropora, nor faviidscan kill them. Some (m) immigrate from outside populations,some emigrate (n):
dN5
dt= R3N6
K
(K −
6∑i=1
Ni
)− N5
(G3 + D5 + n + R1N2
K
)+ mC
(5)
dN6
dt= G3N5 − D6N6 (6)
In these six equations, the constants Ri (intrinsic rate ofincrease), Ki (carrying capacity), Di (death rate), Gi (growthrate into adults) and m, n (migration rates) are equivalent inmeaning and subscripts denote unique treatment for eachspecies.
Numerical approximations of the six ODEs were performedusing the Matlab ODE solver implementing second-orderRunge–Kutta methods (Gilat and Subramanian, 2008). Catas-
Author's personal copy
e c o l o g i c a l m o d e l l i n g 2 2 0 ( 2 0 0 9 ) 192–208 197
Fig. 4 – Space cover of environments in (a) Ras Hasyan area (c) and Halul using classification of satellite imagery. (b) Blackbars show habitats used to estimate model parameters for Ras Hasyan. The equivalent was done in Halul (not shown).Striped bars are unsuitable for corals. Vertical exaggeration at Ras Hasyan in (a) 500-fold to show topography. The area haschanged dramatically subsequent to this analysis due to major coastal construction (Burt et al., 2008).
trophic mortality was introduced as a multiplyer of Ni after acertain number of solution steps.
3.3. Parameter estimation
To estimate population parameters, we combined remotesensing with in situ ground-truthing. From photo-transectswe estimated how many corals occurred per unit area sparseor dense coral to calculate approximate numbers of corals perpixel. The dense coral area, dominated by Acropora, was delin-eated by GPS to allow differentiating Acropora pixels from thosecontaining other genera. Ground-truthing consisted of differ-entially corrected GPS fixed localities of 5 m radius that wereevaluated for type of bottom cover, percent cover of dominantbottom type, coral identity and cover (Purkis and Riegl, 2005;Purkis, 2005). Ceramic settlement tiles (five racks of 20 tileseach) were deployed during 2005/2006/2007 spawning seasonsbut low replication has not yet allowed useful estimates ofrecruitment. Thus, fertility parameters had to be estimated
from the model and from size/frequency distribution dataobtained from photo-transects (see Section 3.3.2).
3.3.1. Population sizePopulation sizes were obtained by assigning coral density perunit area estimates obtained from digitized photo-transectsand ground-control-points to color-coded habitat classes onclassified satellite imagery (Fig. 4). This resulted in an esti-mated number of corals contained in pixels coded as denseand sparse coral. Carrying capacity of the system (K) wasestimated as sum of all coral pixels plus all pixels includ-ing substratum onto which corals could recruit and formnew coral patches (hardgrounds, dense dead coral, dead reef,etc.).
The basis of all optical classifications and maps were satel-lite images (IKONOS and Landsat ETM7 11-bit multispectralsatellite image, 4 m and 28 m pixel-size, respectively). Detailsabout image processing, ground-truthing and the approachtaken to obtain maps are given in Purkis (2005) and Purkis
Author's personal copy
198 e c o l o g i c a l m o d e l l i n g 2 2 0 ( 2 0 0 9 ) 192–208
Fig. 5 – Sizes of coral colonies as determined from photo-transects. One square meter is covered by 4800 pixels(1 pixel = 2.08 cm2). Faviids and Porites showed similar distributions. Regressions (solid lines, middle panel) are highlysignificant (p < 0.01).
et al. (2005). Bathymetry for depth correction of spectralreflectance values was obtained from acoustic surveys andtidally corrected against data from in situ loggers. Image clas-sification was conducted by unsupervised k-means clusteringand a multivariate normal probability driven classifier (Purkisand Pasterkamp, 2004) after masking of pixels outside thedepth-resolution of the images and without coral. Imagerywas classified into pixels containing: corals (either denseor sparse as determined by ground-truthing), dead corals(mostly dead and overgrown Acropora killed in 1996) mixed
hardground (bare, sparsely coral-, and sparsely algal-coveredhardgrounds). Other categories, even if present, (Fig. 4) werenot used for the model. Classification accuracy was validatedby extensive ground-truthing (Ikonos map overall accuracy81%, Landsat map 72%). Accuracy differences were largely dueto different spatial resolution (pixel size) and the size of thestudied areas (Purkis et al., 2005; Purkis and Riegl, 2005). Confu-sion existed primarily between algae and seagrass, bare versussparsely covered hardgrounds and between coral and algaesince dead coral (killed in 1996/1998; Riegl, 1999, 2002; Purkis
Author's personal copy
e c o l o g i c a l m o d e l l i n g 2 2 0 ( 2 0 0 9 ) 192–208 199
and Riegl, 2005) had dense algal overgrowth. These inaccura-cies had little influence on coral population estimations.
At Ras Hasyan, Acropora colonies prior to mass mortalityhad mean sizes between 0.5 m and 0.8 m radius, which allows2 large colonies to occupy a single 4 m × 4 m Ikonos pixel. Atotal of 293,316 pixels were classified as dense dead coral sug-gesting a total population of big Acropora tables of 586,632prior to mass mortality. Among dense Acropora, few othercorals were found and no massives were assigned to thesepixels. The 157,567 pixels assigned to dense live coral con-sisted primarily of large massive corals, with attending smallcolonies and recruits. Average colonies covered 0.02–0.03 m2
(see Section 3.3.2) and we assigned 10 massive colonies toeach pixel, which was plausible in comparison with photo-transects. Another 677,763 pixels were assigned as sparsecorals and we assigned 5 corals per pixel. This suggested atotal population of 4,964,485 massive corals. We partitionedthis number between faviids and Porites according to the dis-tribution observed in photo-transects (54% Porites and 46%faviids) and within each group, partitioned between “small”and “big” according to Fig. 5. For Acropora we assigned 52/48%small/big (see Section 3.3.2). The total theoretical carryingcapacity was considered to consist of all suitable substratumfor coral growth in the entire area—a sum of dense dead, denselive and sparse coral covered areas plus the area of bare hard-ground, which summed to 888,056 pixels. Thus the entire areaavailable for coral growth was 2,016,703 pixels. If we assumethat these pixels will be mostly covered by the most aggres-sive corals (Acropora) in the climax community, but that undereach Acropora table at least one subordinate coral will persist,then we obtain a carrying capacity of 1 coral m−2 or a total of8,066,812 colonies, given the 4-m pixel-size of the image.
At Halul, 350 Landsat pixels were classified as “live reef”,275 as “dead reef”, and 139 as “mixed hardground” (Fig. 4).Of the entire area classified as “live reef”, Acropora was onlyencountered in the SE-quadrant, about 12.5% of the area, or39,375 m2. Acropora colonies occurred on average with 5 mspacing or clumps of up to 4 colonies with inter-cluster dis-tance of 20 m. Thus we estimated one Acropora colony everyfifth meter square (i.e., 1 per 25 m2) leading to a total pop-ulation estimate of 1575 colonies. The remaining 87.5% ofthe classified “live reef” area were covered by massive coralsat higher density with smaller colonies than Acropora. Weassumed one colony per square-meter, leading to an esti-mated population size of 275,625 massive colonies, partitionedinto 54% Porites (107,163 small and 41,674 big) and 46% favi-ids (97,625 small and 29,161 big) using the approximationobtained at Ras Hasyan. Total carrying capacity was calcu-lated as the area classified as “live reef” presently bearinglive coral, plus the area classified as “dead reef”, which hadbeen bearing live coral until only a few years ago, plus thearea classified as “mixed hardground”, because it could havebeen bearing corals before, certainly was suitable habitat forcorals, and could conceivably be colonized. Therefore, totalcarrying capacity assuming a limit of 1 coral per square meterwas 687,600 corals. During the surveys, no Acropora was foundthat exceeded one square meter in size. If they obtained largersizes, they would overtop other corals and by this mechanismthe density of 1 coral per square meter would be maintained,supporting above simplified density assumption.
3.3.2. Coral demographic parametersLittle information is available about the vital rates (fecun-dity, settlement of spat, survivability, and general mortality)that are needed to evaluate our hypothesis of repetitive mor-tality or to parameterize a model. We were therefore forcedto estimate the relevant parameters from the data and lit-erature available. We used photo-transects to determine thesize-frequency distribution of corals. Photo-transects weredigitized into color-coded bitmaps and the areas of all coralsin the chosen species groups (faviidae: Favia spp, Platygyradaedalea, Cyphastrea spp., Pseudosiderastrea tayamai; Porites:Porites lutea, P. solida, P. harrisoni) were evaluated for size. Atotal of 1165 colonies were counted. In a log–log plot of sizeversus frequency (Fig. 5), both faviids and Porites showed aninflection point at 160 pixels (333 cm2), which equates to radiiof about 14 cm, at which sizes increased more rapidly. Thischange was more pronounced in Porites than in faviids and wasconsidered the cut-off point between the functional groups“small” and “big” due to the apparent change in dynamics.In faviids/Porites, 77/72% of the population were small, 23/28%were big. This size-distribution compares to Bak and Meesters(1999) and Meesters et al. (2001) for several Caribbean speciesof massive coral. Average faviid size was 272 cm2 (∼9 cmradius), average Porites size was 372 cm2, (∼11 cm radius). InAcropora, it was more difficult to estimate the frequency of bigversus small colonies. In the regenerating phase after mortal-ity events, we observed only recruits, and in the dominatingphase in between disturbances, the large adult colonies fre-quently precluded settlement within the dense coral areas.We therefore assumed that 48% of all colonies were big, 52%small, which corresponded to values obtained from randomphoto-transects and is a useful mean in comparison withother studies (Smith et al., 2005). However, this analysis is lessprecise than that for Porites and faviids.
For the estimation of graduation rates into the next size-class, we used the approach of Fong and Glynn (1998) anddivided growth rate by the width (i.e., colony diameter) of thesize-class. Acropora linear extension rates are around 5–10 cmper year (Coles and Fadlallah, 1991), versus 1 cm per year forporitids and 1.5 cm for faviids (own unpublished data based ongrowth-band measurements). We considered Acropora to enterthe “big” size-class at 20 cm radius (G1 = 0.25) with a conserva-tive growth assumption of 5 cm per year, faviids (G2 = 0.11) andPorites at 14 cm radius (G3 = 0.07). Immigration and emigrationrates were varied between uniform and random, depending onmodel run. If random, n and m were assigned random numbersfrom a Gaussian distribution with mean 0 and variance 1.
3.3.3. Vital rates3.3.3.1. Model formulation describing recruitment rate. Fieldobservations support our model assumption of continuedrecruitment immediately after disturbance events. In 1999,58 Acropora recruits of 7.6 ± 3.5 cm diameter (suggesting thatthey were at least 1-year old and had settled in 1997 or 1998)and some bigger (of several years age, i.e., >10 cm diameter)colonies were found in a small area that would not have heldmore than 5800 adult colonies. From this a 1% survivorshipassumption can be derived for the 1996 event. Also Fadlallah(1996) showed that Acropora, even if stressed, have at least alimited ability to finish the gametogenic cycle and produce
Author's personal copy
200 e c o l o g i c a l m o d e l l i n g 2 2 0 ( 2 0 0 9 ) 192–208
propagules. Acropora usually spawn in early summer, thusboth heat- and cold-anomalies occur after spawning whichpotentially allows some spat to survive (Loya et al., 2001). Forthe model, we assume that recruit settlement was equallyspread over dense and sparse coral areas as well as hard-ground. This coincides with observations of recruitment ontoall available suitable substrata (unpublished own data; Purkisand Riegl, 2005).
However, reproductive rates for all coral groups in the Ara-bian/Persian Gulf were unknown. Since we knew Ni for allspecies and K from the satellite images (see Section 3.3.1)and Gi (see Section 3.3.2), we were in a position to explic-itly solve for Di in Eqs. (2), (4), and (6), provided Di in Eqs.(1), (3), and (5) (juvenile mortality) were set to zero. Once Di
values were obtained (D2 = 0.27, D4 = 0.37, and D6 = 0.18), wecould then calculate Ri values (R1 = 0.4, R2 = 1, and R3 = 1.1). Forthe calculations we considered migration (both in- and out-) zero, since we were interested in the stability of the localpopulation.
Such a model implicitly expects constant environment andconstant variables and we were primarily interested in explor-ing whether the corals could also survive under differentdisturbance scenarios. Therefore, we considered these valuesprimarily as guide for the range within which to search forvariables that would allow the population to persist in thedisturbed environment.
We evaluated our model under assumptions of constantfertility and settlement (=constant R) as well as under assump-tions of stochastically varying R. To achieve the latter, R wasassigned a random number value from a Gaussian distribu-tion with mean zero and variance 1. This adds realism, sincerecruitment processes have been observed to be variable intime (Fong and Glynn, 1998; Smith et al., 2005).
3.4. Sensitivity analysis
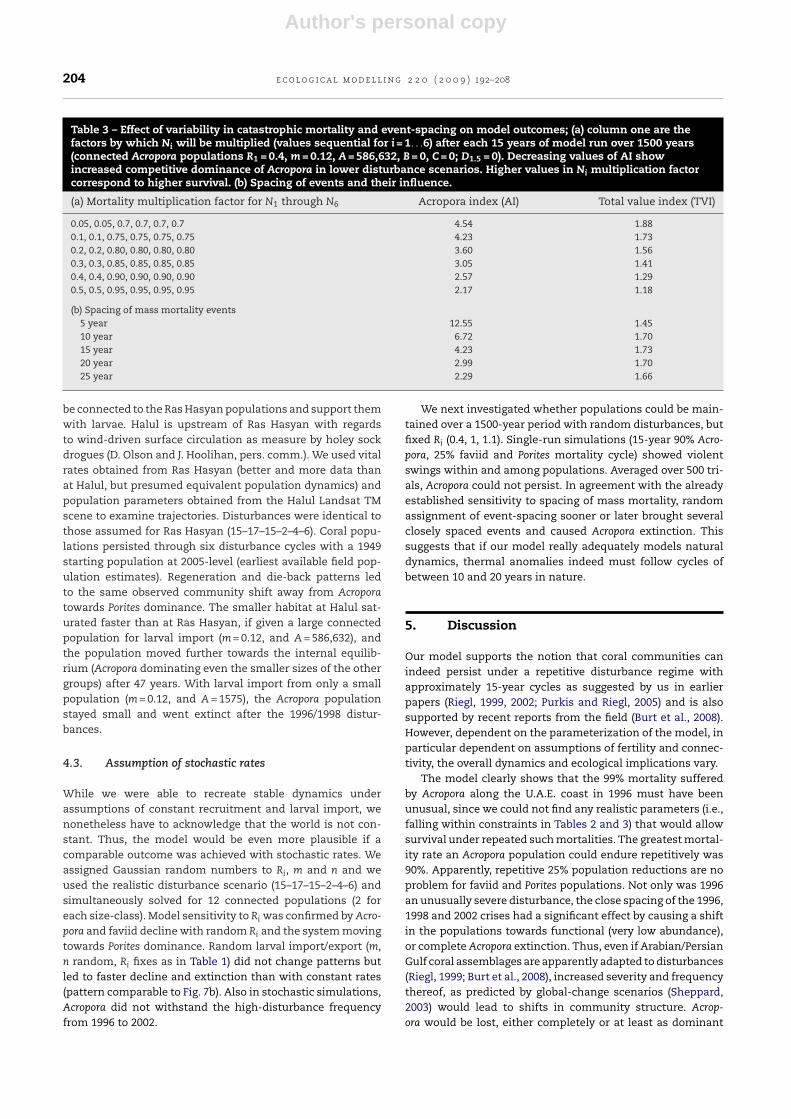
To assess which parameters most strongly affected modelbehavior, and to evaluate the realism of the estimation ofvalues where little empirical basis existed, we varied thoseparameters obtained by explicit solution. Analyses are basedon the effect of a change in one parameter with all otherskept the same, i.e., local sensitivity. Equations were plottedwith variable parameters and inspected to ensure that resul-tant curves did not deviate significantly. Two indices examinedeffects of parameter changes: (1) total values index (TVI): meanof ratios of all population sizes at end of numerical experimentover sizes at beginning (N1–6). Index shows whether overallcoral cover at end is reconciled with expectation of reachinglevels comparable to beginning, (2) Acropora index (AI): sumof all small plus big populations other than Acropora over sumof small plus big Acropora populations. It indicates communitystructure, i.e., abundance ratio at end of numerical experimentcompared to beginning; default value ∼4 (see Tables 2 and 3)allowed to vary from 8.06 to 2.01 (i.e., halved Acropora abun-dance to doubled Acropora abundance).
3.5. Isolated versus connected population
Our model aims at evaluating effects of mass mortality. Basedon observations in the field, between 90% and 99% of all Acro-
pora can succumb to such events. But our observations alsosuggest that the severity of mortality may be strongly influ-enced by local variables and may not be uniform over theentire region. After the 1996 mass mortality, which killed about99% of corals in the Ras Hasyan area, some surviving popula-tions that had suffered less mortality were found at nearbyRas Ghantoot and Deira. It is conceivable that such popu-lations can act as a larval reservoir for resettlement of thedenuded areas since wind and tide-driven long-shore currentsfrequently reverse and connect these sites that are only sep-arated by few dozen km. We thus considered our populationmodel in two distinct settings:
• an isolated population with no external larval input at all.• two openly connected populations that can exchange
propagules freely during every recruitment event either atfixed or random rates.
In the latter case, we simultaneously solved 12 ODEs, 6for each population (a focal population and a connected pop-ulation) consisting of the 2 guilds: dominant (Acropora), anddominated (faviids, and Porites). The focal and the connectedpopulation could have the same vital rate, or Ri was variedas a Gaussian random number, giving each (sub)population aunique dynamics. Connectivity via m and n was either heldconstant (at arbitrary values 0.1 or 0.01) or was also assigneda random number from a Gaussian distribution with meanzero, variance and standard deviation unity. We used Gaus-sian random numbers centered on zero because they favorlow recruitment rates over occasional high rates. This is remi-niscent of the situation in coral reefs where high-recruitmentevents are rarer than low-recruitment events (Mumby andDytham, 2006). A, B, and C of formulae (1), (3), and (5) thenbecame the appropriate Ni of the connected population.
3.6. Disturbance dynamics
Coral assemblages in the SE Arabian/Persian Gulf havebeen identified to be strongly influenced by temperature-related mortality events (Sheppard et al., 1992; George andJohn, 1999, 2000; Riegl, 1999, 2001, 2002; Purkis and Riegl,2005). Disturbances are repetitive and most likely cyclic innature. Bleaching events with region-wide coral mortalitywere observed in 1996, 1998 and 2002 (George and John, 1999,2000; Riegl, 1999, 2003; Sheppard and Loughland, 2002; Purkisand Riegl, 2005; Burt et al., 2008). A previous mortality event inDubai in the early 1980s is recorded by Holt Titgen (1982) andShinn (1976) describes a large-scale Acropora kill on the Qatareast coast in 1964. We used the HadlSST dataset (Reynoldsand Smith, 1994) to identify peaks in temperature excursionin order to verify the known mortalities and learn about oth-ers. During these anomalies, preferentially Acropora are killed(Shinn, 1976; Riegl, 1999; Purkis and Riegl, 2005). In areaswhere Acropora was killed, massive corals (mainly faviidae andPorites) persisted and increased in size (Riegl, 2003).
The HadlSST temperature data set suggested that the massmortality events, which could be clearly pinpointed from lit-erature records and own observation, likely had strong localdrivers. In the 1 × 1 geographic degrees and monthly aver-aged dataset, the temperature spikes were generally not very
Author's personal copy
e c o l o g i c a l m o d e l l i n g 2 2 0 ( 2 0 0 9 ) 192–208 201
Fig. 6 – Intrinsic properties of the model: (a) 3d phase-plane solution of trajectories of competitive interaction between thesmall stages of all species. All converge towards a narrow region of Acropora dominance and (b) the species groups in Eqs.(1)–(6) parameterized from satellite imagery and photo-transects (Table 1) reach carrying capacity and then remain stable.Porites should be most frequent, then Acropora, then faviids.
obvious, with the exception of 1998, which clearly was anunusually hot year. The 1964 mass mortality in Qatar recordedby Shinn (1976) fell into a warmer-than-usual period, with 1964being clearly a hot summer with a preceeding warm and a fol-lowing cold winter. Ruiz-Sebastian et al. (personal commentand in preparation) suggest that the combination of cold win-ter/hot summer predisposes corals to bleaching. Therefore,there is a possibility that both a hot summer and then anunusual, but brief, cold-spell in winter could have damagedthe corals. A mass mortality near Jebel Ali around 1980 (HoltTitgen, 1982) coincided with the highest positive seasonallyadjusted summer temperature anomaly (1980) between 1969and 1987 followed by a cold winter and an even hotter summer.1987/1988 had hot summers and warm winters without mor-tality. Mass mortality occurred in 1996 during a hot summerand in 1998 during the hottest summer on record. In summer2002 corals bleached severely but mortality was low (Riegl,2003; Purkis and Riegl, 2005). In the summers of 2006–2008,mild bleaching with hardly any mortality occurred. Althoughtoo short to allow generalizations, the sequence of major coralmortality events 1964–1981–1996, coupled with characteristicsof the areas coral build-ups (or, rather, lack thereof), suggeststhat a roughly 15–17-year cycle of recurring mass mortality,predominantly in the genus Acropora exists (Riegl, 1999).
The mortality during these events was known from previ-ous transect studies and was <25% for massive corals but atleast 90% for Acropora (Riegl, 1999, 2003). Therefore, we evalu-ated the model with mortality settings 25% for massive coralsand 90% or 99% for Acropora. While transect studies suggestedthat Acropora mortality was near-total, no regeneration couldhave been observed in 1999 if nothing at all had survived, yetrecruits and some larger colonies were encountered. Thus weassumed a 1–10% survival of large and small Acropora. Catas-trophic mortality was modeled by reducing input Ni by 99%,90% (in Acropora) or 25% (in faviids and Porites) at definedtime-steps. This mortality was thus extraneous to regular pop-ulation dynamics and not included as a factor in formulae(1)–(6).
4. Results
4.1. Assumption of constant rates—model runs forRas Hasyan
In the first instance, we wanted to know whether the envis-aged dynamics, as defined by the six ODEs, had at all thecapability of reproducing community dynamics as observedin the field. Parameters were needed to fulfil the hypothesisthat these coral assemblages had indeed been subjected torepetitive mass mortality but yet had persisted. We examinedwhether on a set disturbance frequency with a set mortal-ity rate, a perpetually regenerating population was indeedpossible. We assumed the population levels of 1995 as thebaseline since at this time, the abundance of corals had beenestimated and we could tune the model towards reachingcomparable levels (TVI ∼ 1.7, AI ∼ 4). Sensitivity analysis usedTVI to evaluate effects of parameter variation on overall coralpopulations, AI to evaluate deviations in community compo-sition.
In the field, we had observed disturbances twice with 15-year, and once with 17-year recurrence. As a first step, weassumed a constant 15-year disturbance cycle recurring 100times. Under assumption of constant reproductive rate Ri, theparameters derived by explicit solution allowed a regularlyrecurring disturbance of 90% mortality in small and big Acro-pora, 25% in small and big faviids and Porites every 15 yearsfor 1500 years (a time-period of relative environmental con-stancy in the region) with recovery to pre-disturbance levels(set at 1995 values). Longer runs (>1500 years) did not changethe outcome. However, in the isolated population with no lar-val import (m = 0), we had to adjust the R1 (Acropora rate ofincrease) from 0.4 to 0.88, to avoid its extinction. Without thisincrease (R1 = 0.4), larval import had to support regenerationof the decimated Acropora population. Suitable values werea stable outside population of N2 (the start and 1995 values)with m = 0.12. None of the other parameters required adjust-ment.
Author's personal copy
202 e c o l o g i c a l m o d e l l i n g 2 2 0 ( 2 0 0 9 ) 192–208
To evaluate stability we calculated the system’s Jacobianand its eigenvalues. We arrived at a dominant, negative, realeigenvalue (−0.95) and two small, complex eigenvalues. Thissuggested stability, i.e., the system would converge towards astable region if allowed to reach climax. In a 3d phase-planesolved for the small stages (big stages show little compet-itive interaction) trajectories converge towards, but do notmeet in, a single point (Fig. 6a). The complex eigenvaluessuggested some oscillation (Edelstein-Keshet, 2005). The prop-erties of the three differential equations contain the possibilitythat the assemblage could converge to a region where thedominant Acropora eventually out-competes the other species(Fig. 6a). Since the vital rates were calculated from values ina community where they coexisted, the model in the presentparameterization (Table 1) allows coexistence (Fig. 6b).
Sensitivity analysis examined possible ranges of parametervariability without changing outcomes (Table 2). The con-nected model allowed wider variability of parameters thanthe isolated population model, and both were most sensitiveto variations in Ri and Di. Variability of catastrophic mortal-ity (Table 3), an extraneous factor to the population model,primarily affected species composition (Acropora outcompet-ing other species at lowered mortality = declining AI) but didnot strongly affect TVI. The model was very sensitive to spac-ing of mass mortality events (Table 3). Shorter intervals ledto marked decreases, longer intervals to marked increases inAcropora dominance. Mortality spacing could vary between 10and 20 years to maintain a community roughly comparable tothat used as baseline.
The model also allowed different ways of treating smallcolony mortality. It could be included in Gi, since higher smallcoral mortality would result in a lower transfer rate into thebigger size-class. More independent small colony dynamicscan be modeled with a separate mortality term (D1, D3, andD5). In this case, however, explicit solution for Di and Ri val-ues is not possible and we also lacked field-derived, realisticvalues. After explicit solution for D2, D4, and D6 (with D1,D3, and D5 = 0) we found by iteration that mortality could bepartitioned ∼10/90% between small/large colonies while stillobtaining a comparable outcome (unpartitioned mortality:TVI = 1.06, AI = 2.07; partitioned mortality: TVI = 0.89, AI = 4.79).Again, wider variability of Di was possible in the connected,rather than the isolated, model (Table 2).
Next, we tested these assumptions in a more realistic dis-turbance scenario (Fig. 7). We assumed for want of better datathat the same number of corals as in 1995 had existed in 1949at the start of model runs. Thermal anomalies were detected in1949, 1964, 1981, 1996, 1998 and 2002. The severities of mortal-ity were kept constant: small and large Acropora were reducedby 90%, while small and large faviids were reduced by 25%(Fig. 7a). In order to maintain the Acropora population, its Rvalue had to be raised from 0.4 to 0.87. When this was done,Acropora populations were found to strongly rebound withoutoutside larval input, as did faviids and Porites, until the closelyspaced 1996–2008–2002 disturbance triplett did not allow suf-ficient time for population recovery, pushing all populations tovery low levels, and Acropora to extinction. Faviids and Poritesshowed strong signs of recovery from 2002 to 2008 and hadalmost attained full population level (Fig. 7a). In the connectedmodel (R1 = 0.4, m = 0.12, and A = const, Table 1), Acropora was
Tabl
e1
–Po
pu
lati
onp
aram
eter
su
sed
tom
odel
cora
lass
embl
ages
.Val
ues
are
base
don
mea
sure
men
tsfr
omm
onit
orin
g(m
orta
lity
atd
istu
rban
ce),
from
sate
llit
eim
egar
y(N
i),ca
lcu
lati
onba
sed
onp
hot
o-tr
anse
cts
(gro
wth
rate
s),e
xp
lici
tso
luti
onfr
omth
eeq
uat
ion
s(f
erti
lity
,big
and
smal
lcol
ony
mor
tali
ty),
and
iter
ativ
ely
det
erm
ined
sett
ings
(mig
rati
onra
te).
Acr
opor
aFa
viid
sPo
rite
sC
arry
ing
cap
acit
yD
istu
rban
cese
qu
ence
Ras
Has
yan
:806
6812
;H
alu
l:68
7600
100*
15yr
,or
15–1
7–15
–2–4
–6
Fert
ilit
yp
erco
lon
yB
asic
:0.4
;dis
turb
ed:0
.88
orra
nd
om1
orra
nd
om1.
1or
ran
dom
Nsm
all
Ras
Has
yan
645,
295
1,75
8,42
11,
930,
192
Nbi
gR
asH
asya
n58
6,63
252
5,24
275
0,63
0N
smal
lH
alu
l17
0697
,625
107,
163
Nbi
gH
alu
l15
7529
,161
41,6
74Sm
allc
olon
ym
orta
lity
0or
0.3
0or
0.4
0or
0.02
Big
colo
ny
mor
tali
ty0.
27or
0.24
0.37
or0.
330.
18or
0.16
Gro
wth
tobi
gger
size
0.25
0.11
0.07
Nei
ghbo
rin
gp
opu
lati
onsi
zeR
asH
asya
n0
or58
6,63
2(c
onst
ant)
orra
nd
om0
or1,
758,
421
(con
stan
t)or
ran
dom
0or
1,93
0,19
2(c
onst
ant)
orra
nd
omN
eigh
bori
ng
pop
ula
tion
size
Hal
ul
0or
1575
(con
stan
t)0
or29
,161
(con
stan
t)0
or41
,674
(con
stan
t)M
igra
tion
rate
0,0.
12,0
.01
orra
nd
om0,
0.12
,0.0
1or
ran
dom
0,0.
12,0
.01,
orra
nd
om
Mor
tali
tyat
dis
turb
ance
90%
or99
%25
%25
%
Author's personal copy
e c o l o g i c a l m o d e l l i n g 2 2 0 ( 2 0 0 9 ) 192–208 203Ta
ble
2–
Loca
lsen
siti
vity
ofth
em
odel
tosi
ngl
ep
aram
eter
vari
atio
n(c
olu
mn
1)w
ith
the
oth
ers
hel
dco
nst
ant.
Sen
siti
vity
isev
alu
ated
wit
hre
spec
tto
tota
lval
ues
ind
ex(T
VI)
and
Acr
opor
ain
dex
(AI)
both
inth
eis
olat
edca
se(c
olu
mn
3)an
dal
low
ing
imm
igra
tion
from
anou
tsid
ep
opu
lati
onof
fix
edva
lue
(col
um
n5)
.
Loca
lsen
siti
vity
(mod
elti
me
1500
year
s,d
istu
rban
ces
ever
y15
year
s)
Var
ied
fact
orV
alu
ein
un
con
nec
ted
mod
el(1
pop
ula
tion
)A
llow
edva
riab
ilit
y,m
ult
ipli
cati
onfa
ctor
Val
ue
inco
nn
ecte
dm
odel
(2p
opu
lati
ons,
m=
0.12
)A
llow
edva
riab
ilit
y,m
ult
ipli
cati
onfa
ctor
Ri
0.88
,1,1
.10.
98–1
0.4,
1,1.
10.
5–1
R1
only
0.88
0.98
–10.
40.
1–1
Gi
0.25
,0.1
1,0.
070.
9–1.
10.
25,0
.11,
0.07
1–5
Di
0,0.
27,0
,0.3
7,0,
0.18
1–1.
050,
0.27
,0,0
.37,
0,0.
181–
2D
i0.
03,0
.24,
0.4,
0.33
,0.0
2,0.
160.
95–1
.01
0.03
,0.2
4,0.
4,0.
33,0
.02,
0.16
0.1–
2K
8,06
6,81
20.
1–5
8,06
6,81
21–
3m
0n
.a.
0.12
0.3–
1.5
A0
n.a
.58
6,63
20.
3–1.
5B
0n
.a.
0n
.a.
C0
n.a
.0
n.a
.
Dis
turb
ance
inte
rval
Not
e:i=
1,..
.,6;a
llow
edva
riab
ilit
yra
nge
set
byA
Isp
an8.
06–2
.01.
able to recover after the 1996/1998/2002 events due to constantlarval subsidy from outside (Fig. 7b).
Following model runs addressed the question whether theAcropora population, with unaltered recruitment or mortal-ity rates, could sustain itself if 99% mortalities, as observedin 1996, were the recurrent norm. We used the same real-istic disturbance frequency (15–17–15–2–4–6 years) as above.While faviids and Porites persisted through the disturbanceswith 25% mortality, and showed strong recovery after thethree short-interval disturbances (2–4–6 years), Acropora wasonly capable to persist in the system with larval importfrom a constant-size, large (A = 586,632) outside population,it went extinct without larval subsidy. This suggested thatthe 1996 mortality was unusual in its severity and wouldcause significantly altered community structure if such dis-turbances became the norm. However, both in the field andthe connected model Acropora persisted through the distur-bances and had staged a moderate come-back by 2008 (seealso Burt et al., 2008). This suggested that outside popula-tions had replenished the locally depleted populations. Weare aware of areas having escaped both the 1996 and 1998mortalities that could have served as larval sources for theinvestigated populations (Riegl, 1999, 2002). Larval sourceslikely will not remain constant as assumed above, but willfluctuate. Next, we considered two fully connected popula-tions and allowed continuous larval import/export, assumingthat the focal and connected populations had the same vitalrates and population parameters. This is likely a conservativeunderestimation of the realistically available pool of corals,however, it allows for expansion/depression of the availablelarval pool as all populations fluctuate. We forced both popu-lations to fluctuate synchronously (i.e., region-wide, uniformimpact of mortality event), but one population to subsidy theother with more larvae than it received itself (m = 0.12, n = 0.01in the receiving population; m = 0.01, n = 0.12 in the donor pop-ulation), simulating an upstream/downstream effect. Acroporawent extinct after two (donor population) or three (receivingpopulation) disturbances, while faviids and Porites expanded.Persistence of the connected population was only possiblewith another sizeable and stable donor population (Fig. 7b),simultaneous depression of focal and connected populationseverely disadvantaged Acropora to the point of virtual extinc-tion (Ni Acropora, < 10 at the end of model runs, Fig. 7c). Larvalretention increased populations, larval export reduced popu-lations but more than one connected population would havebeen necessary to maintain a big enough larval pool to com-pensate for the heavy mortality with R1 = 0.4. With R1 = 0.88,Acropora populations persisted until the 1996/1998 combinedevents. We deduce that populations as observed prior to the1996 event could only have existed if recurrent mass mor-tality did not exceed or reach 90% on a regular basis and asufficiently large larval pool for local recovery subsidy wasavailable, confirming the 1996 mortality and the close spacingof the 1996/1998/2002 events as unusually severe.
4.2. Using the model from Ras Hasyan to forecastdynamics at Halul
The coral community around Halul was also severelyimpacted in 1998. Its corals could, via other islands or directly,
Author's personal copy
204 e c o l o g i c a l m o d e l l i n g 2 2 0 ( 2 0 0 9 ) 192–208
Table 3 – Effect of variability in catastrophic mortality and event-spacing on model outcomes; (a) column one are thefactors by which Ni will be multiplied (values sequential for i = 1. . .6) after each 15 years of model run over 1500 years(connected Acropora populations R1 = 0.4, m = 0.12, A = 586,632, B = 0, C = 0; D1.5 = 0). Decreasing values of AI showincreased competitive dominance of Acropora in lower disturbance scenarios. Higher values in Ni multiplication factorcorrespond to higher survival. (b) Spacing of events and their influence.
(a) Mortality multiplication factor for N1 through N6 Acropora index (AI) Total value index (TVI)
(b) Spacing of mass mortality events5 year 12.55 1.4510 year 6.72 1.7015 year 4.23 1.7320 year 2.99 1.7025 year 2.29 1.66
be connected to the Ras Hasyan populations and support themwith larvae. Halul is upstream of Ras Hasyan with regardsto wind-driven surface circulation as measure by holey sockdrogues (D. Olson and J. Hoolihan, pers. comm.). We used vitalrates obtained from Ras Hasyan (better and more data thanat Halul, but presumed equivalent population dynamics) andpopulation parameters obtained from the Halul Landsat TMscene to examine trajectories. Disturbances were identical tothose assumed for Ras Hasyan (15–17–15–2–4–6). Coral popu-lations persisted through six disturbance cycles with a 1949starting population at 2005-level (earliest available field pop-ulation estimates). Regeneration and die-back patterns ledto the same observed community shift away from Acroporatowards Porites dominance. The smaller habitat at Halul sat-urated faster than at Ras Hasyan, if given a large connectedpopulation for larval import (m = 0.12, and A = 586,632), andthe population moved further towards the internal equilib-rium (Acropora dominating even the smaller sizes of the othergroups) after 47 years. With larval import from only a smallpopulation (m = 0.12, and A = 1575), the Acropora populationstayed small and went extinct after the 1996/1998 distur-bances.
4.3. Assumption of stochastic rates
While we were able to recreate stable dynamics underassumptions of constant recruitment and larval import, wenonetheless have to acknowledge that the world is not con-stant. Thus, the model would be even more plausible if acomparable outcome was achieved with stochastic rates. Weassigned Gaussian random numbers to Ri, m and n and weused the realistic disturbance scenario (15–17–15–2–4–6) andsimultaneously solved for 12 connected populations (2 foreach size-class). Model sensitivity to Ri was confirmed by Acro-pora and faviid decline with random Ri and the system movingtowards Porites dominance. Random larval import/export (m,n random, Ri fixes as in Table 1) did not change patterns butled to faster decline and extinction than with constant rates(pattern comparable to Fig. 7b). Also in stochastic simulations,Acropora did not withstand the high-disturbance frequencyfrom 1996 to 2002.
We next investigated whether populations could be main-tained over a 1500-year period with random disturbances, butfixed Ri (0.4, 1, 1.1). Single-run simulations (15-year 90% Acro-pora, 25% faviid and Porites mortality cycle) showed violentswings within and among populations. Averaged over 500 tri-als, Acropora could not persist. In agreement with the alreadyestablished sensitivity to spacing of mass mortality, randomassignment of event-spacing sooner or later brought severalclosely spaced events and caused Acropora extinction. Thissuggests that if our model really adequately models naturaldynamics, thermal anomalies indeed must follow cycles ofbetween 10 and 20 years in nature.
5. Discussion
Our model supports the notion that coral communities canindeed persist under a repetitive disturbance regime withapproximately 15-year cycles as suggested by us in earlierpapers (Riegl, 1999, 2002; Purkis and Riegl, 2005) and is alsosupported by recent reports from the field (Burt et al., 2008).However, dependent on the parameterization of the model, inparticular dependent on assumptions of fertility and connec-tivity, the overall dynamics and ecological implications vary.
The model clearly shows that the 99% mortality sufferedby Acropora along the U.A.E. coast in 1996 must have beenunusual, since we could not find any realistic parameters (i.e.,falling within constraints in Tables 2 and 3) that would allowsurvival under repeated such mortalities. The greatest mortal-ity rate an Acropora population could endure repetitively was90%. Apparently, repetitive 25% population reductions are noproblem for faviid and Porites populations. Not only was 1996an unusually severe disturbance, the close spacing of the 1996,1998 and 2002 crises had a significant effect by causing a shiftin the populations towards functional (very low abundance),or complete Acropora extinction. Thus, even if Arabian/PersianGulf coral assemblages are apparently adapted to disturbances(Riegl, 1999; Burt et al., 2008), increased severity and frequencythereof, as predicted by global-change scenarios (Sheppard,2003) would lead to shifts in community structure. Acrop-ora would be lost, either completely or at least as dominant
Author's personal copy
e c o l o g i c a l m o d e l l i n g 2 2 0 ( 2 0 0 9 ) 192–208 205
Fig. 7 – Model of six disturbance cycles (shown by year in which disturbance occurred) that suggests persistence of the coralassemblage in the postulated disturbance regime. (a) Isolated populations at Ras Hasyan (m = 0, R1 = 0.87, 90% mortality inAcropora, 25% in faviids and Porites at each disturbance; D1, D3, and D5 = 0). (b) Connected populations at Ras Hasyan(m = 0.12, A = 586,632, R1 = 0.4, 90% mortality in Acropora, 25% in faviids and Porites at each disturbance; D1, D3, and D5
included as in Table 1). (c) Ras Hasyan, dynamically connected populations (m = 0.12, n = 0.01 in receiving population,n = 0.12, m = 0.01 in donor population; R1 = 0.4, 90% mortality in Acropora, 25% in faviids and Porites at each disturbance; D1,D3, and D5 included as in Table 1). The far lower Acropora values than in (a) and (b) are due to simultaneous depression inpopulation levels in focal and connected population.
species. Extrapolating to all reef areas of the world, one couldsurmise that more rapidly repeated and severe bleachingevents will leave a depauperate community of only few butvery robust species.
Our model contributes to a better understanding of the vitalrates necessary to survive the predicted disturbance regime,and an estimation of maximum severity of repetitive dis-turbances. Due to their aggressive superiority, the analyticsolution required Acropora to have a fertility of 0.4 survivingrecruits per adult colony, the lowest of the modelled species.Sensitivity analysis showed that R1 could vary between 0.2 and0.4 in the connected case (Table 2) which put it very close tovalues in the literature. While this is higher than the fertilitiesof 0.1 assumed by Lirman (2003) for Caribbean A. palmata, ourmodel did not separate asexual from sexual recruitment. Since
the latter is included in our R1 values, and Arabian/Persian GulfAcropora are as capable of asexual reproduction as those in theCaribbean (pers. observation), our estimated fertility rates donot deviate much. However, in the disturbed case (repetitive90% mortality) in an isolated population with fixed vital rates,we had to adjust the Acropora fecundity to 0.88 in order to avoidextinction. A constant fertility of 0.2–0.4 was only possiblewith continuous and assured import of larvae.
The required fertility for faviids are higher than, thoseof Porites comparable to estimates in the literature (Babcock,1991; Schloeder and Guzman, 2008). We believe our rates to berealistic based on calculations of plausible numbers of polypsand published per-polyp fecundity rates (Table 4).
Even if herein established fecundity differs from other reefareas, strong local variability cannot be discounted. Fecundity
Author's personal copy
206 e c o l o g i c a l m o d e l l i n g 2 2 0 ( 2 0 0 9 ) 192–208
Table 4 – Approximation of fertility to verify the fertility assumptions required for our model to allow a sustainable coralpopulation despite recurring mass mortality. Values for gonads and eggs taken from Mumby and Dytham (2006).
Acropora Faviids Porites
Average colony size in cm2 3848 272 372Number of polyps per cm2 2 1 18Number of gonads per polyp 6 6 6Number of eggs per gonad 2 2 2Number of gametes per average colony 92,363 3264 80,352Gamete survival required for model fecundity 0.000004–0.000008 0.0003 0.00001
could be higher in Gulf coral communities because larvae set-tle into a strongly unsaturated environment with much freelyavailable space. High urchin abundances (∼5 m−2, unpubl.data) efficiently control macroalgae populations (Carpenter,1986) and create abundant competition-free space for larvaeto settle when coral populations are low. This is in contrastto the Caribbean, where an absence of urchins has repeatedlybeen blamed for strong presence of macroalgae with concomi-tant reduction of settlement space and survival of coral larvae(Hughes, 1994; Mumby et al., 2006, 2007).
One weakness of our model is that it ignores all othertrophic compartments, such as herbivores (fishes or sea-urchins) that have a demonstrated effect on the survival andrecruitment of corals (Mumby et al., 2006). However, whilethe Arabian/Persian Gulf moves towards a generally over-fished state, like all other oceans of the world (Bellwood etal., 2004), fish density in the study area did not decline untilvery recently (Riegl, 2002; own unpubl. data) and high urchinabundance suggests efficient, un-impacted herbivory. There-fore, our model presents an admittedly coral-centric view ofdynamics in an otherwise little modified ecosystem.
Our model suggests that isolated populations require farmore stability in parameters than connected populations, andare therefore less buffered against environmental perturba-tions. In the case of an isolated population, it was not possibleto vary parameters as widely as in the connected case and stillobtain consistent results (Table 2). Connectivity therefore isessential for population survival (Cowen et al., 2007). We con-sider our model parameters and outcomes most realistic inthe case of connected populations. Our model also underlinesthe importance of the size of a connected population. Acroporasurvival was only possible with a stable, sizeable populationas larval donor. Once the connected population fluctuatedat the same intensity as the focal population, Acropora wentextinct (Fig. 7c). This mechanism underlines the importanceof refuges that maintain large populations and can act as“reseeding batteries”.
It is likely that mortality levels per disturbance indeedvary strongly and are not constant as assumed in our model.Any downward adjustment in mortality level would allowlower recruitment rates, but the relatively low sensitivityof the model to variability in catastrophic mortality sug-gests that internal factors, such as recruitment, are moreimportant. Coral survival (as measured by TVI) in the harshenvironment simulated by the model is founded in fecundityrather than resistance and lowered mortality in response tostressors. However, community structure was strongly influ-enced by mortality events, because compensatory mortality(Connell, 1978) was observed at several levels. Firstly, if Acro-
pora were not severely disadvantaged by the mortalities, theyout-competed the other species until these only maintainedlarge colonies within their size-refuge (Sebens, 1982). We sawthis in the field (Purkis and Riegl, 2005; Burt et al., 2008) aswell as in the simulations. A preferential mortality of Acroporaalways leads to an increase in the other species.
Demographic and environmental stochasticity compro-mised populations, leading to loss of Acropora and dominanceby Porites. In many areas of the Arabian/Persian Gulf, Poritesis dominant and Acropora rare, even though suitable habi-tat is available. This is the case in regions with a harsherenvironment (Gulf of Salwah, Yasat Islands, Khor Odaidarea; Sheppard and Loughland, 2002) where temperatureexcursions are higher and less predictable. This communitypattern may be a result of long-term Acropora decline, causedby reduced or variable fertility and disturbances at morerapid and irregular recurrence. With disturbances potentiallybecoming more severe, more frequent and less predictable(Sheppard, 2003), the entire Gulf may be moving towards thistrajectory, putting the future of Acropora as a dominant speciesinto doubt.
If we accept as premise that either unusual cold (Colesand Fadlallah, 1991) or hot events (George and John, 1999;Riegl, 1999; Purkis and Riegl, 2005) cause mass mortality, thenno direction for evolutionary change towards either hot- orcold-adaptation should be expected. Any alleles that imparta generally wide temperature tolerance should be selectedfor. If the herein described population oscillations were purelycaused by unidirectional stresses (i.e., only heat or only cold),the population genetic outcome should be easily predictable:rapidly the allele with the tolerance for the highest (or low-est) temperature should dominate, since the high mortality(90% or >90%) certainly would depress the evolutionary fitnessof the worse-adapted allele. In the present case, the allelesof the zooxanthellae are of importance, since coral death ismostly due to high- or low-temperature-induced bleaching.However, while our direct observations can only confirm hot-kills, the literature (Shinn, 1976; Coles and Fadlallah, 1991)clearly implicates cold-kills as well, which would negate direc-tional evolution towards either hot- or cold-adaptation. Lackof information regarding the proportion of hot- to cold-killsmade us refrain from quantitative analysis. The closely spacedhot-kills of the late-1990s and early 2000s may have led toa phenotypic shift towards more hot-adapted corals, in par-ticular Acropora. Riegl (2003) illustrates bleached faviids andunbleached Acropora in 2002—a clear reversal of the situationin 1996, where the mortality pattern was exactly the opposite.During the hot summers of 2007 and 2008, only mild bleachingwithout mortality was observed. Indeed our model supports
Author's personal copy
e c o l o g i c a l m o d e l l i n g 2 2 0 ( 2 0 0 9 ) 192–208 207
data in Baker et al. (2004), who found most Arabian/PersianGulf Acropora to contain the temperature-tolerant zooxanthel-lae clade D.
Confusion of adaptive trajectories may be introduced byconnectivity between populations. Our model shows theimportance of large connected populations for larval import(Caley et al., 1996). The severity and cause of mass mortal-ity may vary among localities due to the shallow, enclosedand high-latitude position of the Gulf. Thus, different phe-notypic shifts might be observed among populations if somehad experienced cold-kills while others experienced hot-kills. In this case, connectivity within an open populationhas important implications. Different mortality may leadto different population sizes, which is important for popu-lation persistence. If populations were simultaneously anduniformely depressed in our model, not enough propaguleswere available and extinction ensued. But if a large popula-tion was available for larval import, focal and/or connectedpopulations (Acropora, faviids, Porites) persisted. Dependingon the regional cause for mortality, different parts of thesame open population or metapopulation (sensu Hanski, 1994)could follow independent population trajectories. As longas any one part of the (meta)population might survive andbe available for re-seeding the denuded area, little evolu-tionary pressure would be exerted onto any genotype. Byfinding refuge within any given sub-population and act-ing as a weed (i.e., rapidly occupying and giving-up freespace—as evidenced by the absence of reefal frameworks.If corals persisted, frameworks would form; Riegl, 2001),even genotypes apparently badly adapted to the presentlyobserved environmental stress could prevail. Thus, cold-adapted as well as hot-adapted alleles might persist in thepopulation.
It appears, however, that hot-kills will likely becomethe norm (Sheppard and Loughland, 2002; Sheppard, 2003;Nasrallah et al., 2004) and that mortality will be uniformand synchronized across the region. This makes majorand permanent shifts in community structure (i.e., loss ofAcropora) a likely scenario. However, zooxanthellae in theGulf are mostly of the hot-adapted D-clade (Baker 2004).This, combined with the theoretical and empirically provencapability of Arabian/Persian Gulf corals to persist in a high-disturbance environment may give these corals an edge intheir struggle for survival in an anthropogenically alteredclimate, provided disturbances do not become more fre-quent.
Acknowledgements
This study was conceived and baseline data collected atHalul during the Dolphin Energy/WWF Coral Reef Project. Wethank Qatar SCENR for the availability of UQ research ves-sel Mukhtabar al-Bihar and A. al Cibahy and T. Abdesalaamat EAD for access to boats and field stations. Kevin Kohlercontributed many excellent ideas and discussions. Support byNOAA to NCRI via CSCOR grant NA04NOS4260065 is appreci-ated. D. Olson of RSMAS and J. Hoolihan of NOAA (formerlyAbu Dhabi EAD) provided surface current data. This is NCRIcontribution #103.
r e f e r e n c e s
Babcock, R.C., 1991. Comparatice demography of three species ofscleractinian corals using age- and size-dependentclassifications. Ecological Monographs 61, 225–244.
Bak, R.P.M., Meesters, E.H., 1999. Population structure as aresponse of coral communities to global change. AmericanZoologist 39, 56–65.
Baird, A.H., Hughes, T.P., 2000. Competitive dominance by tabularcorals: an experimental analysis of recruitment and survivalof under storey assemblages. Journal of Experimental MarineBiology and Ecology 251, 117–132.
Bellwood, D.R., Hughes, T.P., Folke, C., Nystrom, M., 2004.Confronting the coral reef crisis. Nature 429, 827–833.
Burt, J., Bartholomew, A., Usseglio, P., 2008. Recovery of corals adecade after a bleaching event in Dubai, United ArabEmirates. Marine Biology 154, 27–36.
Caley, M.J., Carr, M.H., Hixon, M.A., Hughes, T.P., Jones, G.P.,Menge, B.A., 1996. Recruitment and the local dynamics ofopen marine population. Annual Review of Ecology andSystematics 27, 477–500.
Carpenter, R.C., 1986. Partitioning herbivory and its effects oncoral reef communities. Ecological Monographs 56, 345–363.
Coles, S.L., Fadlallah, Y.H., 1991. Reef coral survival and mortalityat low temperatures in the Arabian Gulf: new species-specificlower temperature limits. Coral Reefs 9, 231–237.
Coles, S.L., Brown, B.E., 2003. Coral bleaching—capacity foracclimatization and adaptation. Advances in Marine Biology46, 183–223.
Connell, J.H., 1975. Some mechanisms producing structure innatural communities: a model and evidence from fieldexperiments. In: Cody, M.L., Diamond, J.D. (Eds.), Ecology andEvolution of Communities. Belknap Harvard, Cambridge, pp.460–490.
Connell, J.H., 1978. Diversity in tropical forests and coral reefs.Science 199, 1302–1310.
Cowen, R.K., Gawarkiewicz, S., Monismith, S., Largier, J., 2007.Population connectivity in marine systems. An Overview.Oceanography 20 (3), 14–21.
Edelstein-Keshet, L., 2005. Mathematical models in biology.Classics in Applied Mathematics. SIAM, Philadelphia, 585 p.
Fadlallah, Y.H., 1996. Synchronous spawning of Acropora clathratacolonies from the western Arabian Gulf (Saudi Arabia).Bulletin of Marine Science 59, 209–216.
Fong, P., Glynn, P.W., 1998. A dynamic size-structured populationmodel: does disturbance control size structure of a populationof the massive coral Gardineroseris planulata in the EasternPacific? Marine Biology 130, 663–674.
George, J.D., John, D.M., 1999. High sea temperatures along thecoast of Abu Dhabi (UAE), Arabian Gulf—their impact uponcorals and macroalgae. Reef Encounter 25, 21–23.
George, J.D., John, D.M., 2000. The effects of the recent prolongedhigh seawater temperatures on the coral reefs of Abu Dhabi(UAE). In: International Symposium on Extent of CoralBleaching, pp. 28–29.
Gilat, A., Subramanian, V., 2008. Numerical methods forscientists and engineers. Wiley, 457 p.
Hall, V.R., Hughes, T.P., 1996. Reproductive strategies of modularorganisms: comparative studies of reef-building corals.Ecology 77 (3), 950–963.
Hanski, I., 1994. A practical model of metapopulation dynamics.Journal of Animal Ecology 63, 151–162.
Holt Titgen, R., 1982. The systematics and ecology of thedecapods, and their zoogeographic relationship to the
Author's personal copy
208 e c o l o g i c a l m o d e l l i n g 2 2 0 ( 2 0 0 9 ) 192–208
Arabian Gulf and the western Indian Ocean. Unpubl PhDDissertation, Texas A7M Univ, 291 p.
Hughes, T.P., 1994. Catastrophes, phase shifts, and large-scaledegradation of a Caribbean coral reef. Science 265, 1547–1551.
Kirkham, A., 1998. A quaternary proximal foreland ramp and itscontinental fringe, Arabian Gulf, U.A.E. In: Wright, V.P.,Burchette, T.P. (Eds.), Carbonate Ramps, 149. GeologicalSociety of London Special Publication, pp. 15–42.
Lirman, D., 2003. A simulation model of the population dynamicsof the branching coral Acropora palmate. Effects of stormintensity and frequency. Ecological Modelling 161, 169–182.
Loya, Y., Sakai, K., Yamazato, K., Nakano, Y., Sambali, H., vanWoesik, R., 2001. Coral bleaching, the winners and the losers.Ecology Letters 4, 122–131.
McClanahan, T.R., Ateweberhan, M., Graham, N.A.J., Wilson, S.K.,Ruiz Sebastián, C., Guillaume, M.M.M., Bruggemann, J.H.,2007. Western Indian Ocean coral communities: bleachingresponses and susceptibility to extinction. Marine EcologyProgress Series 337, 1–13.
Meesters, E.H., Hilterman, M., Kardinaal, E., Keetman, M., deVries, M., Bak, R.P.M., 2001. Colony size-frequencydistributions of scleractinian coral populations: spatial andinterspecific variation. Marine Ecology Progress Series 209,43–54.
Mumby, P.J., Dytham, C., 2006. Metapopulation dynamics of hardcorals. In: Kritzer, J.P., Sale, P.F. (Eds.), Marine metapopulations.Academic Press, pp. 157–203.
Mumby, P.J., Hedley, J.D., Zychaluk, K., Harborne, A., Blackwell,P.G., 2006. Revisiting the catastrophic die-off of the urchinDiadema setosum on Caribbean coral reefs: fresh insights onresilience from a simulation model. Ecological Modelling 196,131–148.
Mumby, P.J., Harborne, A.R., Williams, J., Kappel, C.V., Brumbaugh,D.R., Micheli, F., Holmes, K.E., Dahlgren, C.P., Paris, C.P.,Blackwell, P.G., 2007. Trophic cascade facilitates coralrecruitment in a marine reserve. Proceedings of the NationalAcademy of Sciences 104, 8362–8367l.
Nasrallah, H.A., Nieplova, E., Ramadan, E., 2004. Warm seasonextreme temperature events in Kuwait. Journal of AridEnvironments 56, 357–371.
Purkis, S.J., 2005. A “reef-up” approach to classifying coralhabitats from Ikonos imagery. IEEE Transactions inGeoscience and Remote Sensing 43, 1375–1390.
Purkis, S.J., Pasterkamp, R., 2004. Integrating in situ reef-topreflectance spectra with Landsat TM imagery to aidshallow-tropical benthic habitat mapping. Coral Reefs 23,5–25.
Purkis, S.J., Riegl, B., 2005. Spatial and temporal dynamics ofArabian Gulf coral assemblages quantified fromremote-sensing and in situ monitoring data (Jebel Ali, Dubai,U.A.E.). Marine Ecology Progress Series 287, 99–113.
Purkis, S.J., Riegl, B., Andréfouët S, 2005. Remote sensing ofgeomorphology and facies patterns on a modern carbonateramp (Arabian Gulf U.A.E.). Journal of Sedimentary Research75, 861–876.
Purser, B.H., 1973. Sedimentation around bathymetric highs inthe southern Persian Gulf. In: Purser, B.H. (Ed.), The Persian
Gulf. Holocene Carbonate Sedimentation and Diagenesis in aShallow Epicontinental Sea. Springer, Berlin Heidelberg/NewYork, pp. 157–179.
Purser, B.H., Seibold, E., 1973. The principal environmentalfactors influencing Holocene sedimentation and diagenesis.In: Purser, B.H. (Ed.), The Persian Gulf. Holocene CarbonateSedimentation and Diagenesis in a Shallow EpicontinentalSea. Springer, Berlin Heidelberg/New York, pp. 234–269.
Reynolds, R.W., Smith, T.M., 1994. Improved global sea surfacetemperature analyses using optimum interpolation. Journal ofClimate 7, 929–948.
Riegl, B., 1999. Coral communities in a non-reef setting in thesouthern Arabian Gulf (Dubai, U.A.E.): fauna and communitystructure in response to recurrent mass mortality. Coral Reefs18 (1), 63–73.
Riegl, B., 2001. Inhibition of reef framework by frequentdisturbance: examples from the Arabian Gulf, South Africa,and the Cayman Islands. Paleogeography, Paleoclimatology,Paleoecology 175, 79–101.
Riegl, B., 2002. Effects of the 1996 and 1998 SST anomalies oncorals, coral diseases and fish in the Arabian Gulf (Dubai,U.A.E.). Marine Biology 140, 29–40.
Riegl, B., 2003. Global climate change and coral reefs: differenteffects in two high latitude areas (Arabian Gulf, South Africa).Coral Reefs 22 (3), 433–446.
Ruiz-Sebastian, C., Sink, K.J., McClanahan, T.R., Cowan, D.A.Bleaching response of corals and their Symbiodiniumcommunities in southern Africa. in preparation.
Sebens, K.P., 1982. Competition for space: growth rate,reproductive output, and escape in size. American Naturalist120, 189–197.
Schlager, W., 2005. Carbonate sedimentology and sequencestratigraphy. Concepts in Sedimentology and Paleontology 8,200.
Schloeder, C., Guzman, H.M., 2008. Reproductive patterns of theCaribbean coral Porites furcata (Anthozoa, Scleractinia,Poritidae) in Panama. Bulletin of Marine Science 82, 107–117.
Sheppard, C.R.C., 2003. Predicted recurrence of mass coralmortality in the Indian Ocean. Nature 425, 294–297.
Sheppard, C.R.C., Price, A.R.G., Roberts, C.M., 1992. Marine ecologyof the Arabian region: Patterns and Processes in ExtremeTropical Environments. Academic Press, London, pp. 257.
Sheppard, C.R.C., Loughland, R., 2002. Coral mortality in responseto increasing temperature in the southern Arabian Gulf.Aquatic Ecosystems Health & Management 5, 395–402.
Shinn, E.A., 1969. Submarine lithification of Holocene carbonatesediments in the Persian Gulf. Sedimentology 12, 109–144.
Shinn, E.A., 1976. Coral recovery in Florida and the Persian Gulf.Environmental Geology 1, 241–254.
Smith, L.D., Devlin, M., Haynes, D., Gilmour, J.P., 2005. Ademographic approach to monitoring the health of coralreefs. Marine Pollution Bulletin 51, 399–407.
Thomason, J.C., Brown, B.E., 1986. The cnidom: an index ofaggressive proficiency in scleractinian corals. Coral Reefs 5,93–101.