Copyright © 2019 Tech Science Press CMC, vol.58, no.3, pp.859-878, 2019
CMC. doi:10.32604/cmc.2019.03634 www.techscience.com/cmc
Modeling and Analysis the Effects of EMP on the Balise System
Zhiwei Gao1, *, Shuai Zhang 1, Li Hao1 and Ning Cao2
Abstract: Balise system is one kind of high-rate point-mode data transmission equipment.
It plays an indispensable role in Chinese Train Control System (CTCS), and it has been
immigrated and widely used for passenger dedicated lines and high-speed lines. Thus, its
working conditions directly affect train operation safety. However, the balise information
transmission system (BITS) is based on the principle of electromagnetic induction, and
the communication process is susceptible to external electromagnetic interference.
Therefore, it is vital to study the influence of transient signal interference on the balise
system. This paper builds the up-link model between the vehicle antena and the balise,
and verifies the model’s correctness using finite-difference time-domain method and
electromagnetic field theory. This paper analyzes the effect of electromagnetic pulses on
the transponder's uplink and simulates the coupled current under irradiation. The spectral
distribution of the three types of pulse interference is analyzed according to relevant
standards. Strong electromagnetic pulses have a strong energy distribution in the working
frequency band of the up-link, which will generate in-band interference and bit errors. It
will affect the balise communication and threaten the safety of train operation. As we
know we are the first to analyze the effects of EMP on Chinese BITS, which will lay a
foundation for the research of electromagnetic anti-interference or protection to high-
speed railway.
Keywords: Balise system, BTM, EMP, electromagnetic anti-interference.
1 Introduction
The Balise system is a high-speed information transmission device based on the principle
of electromagnetic induction, and it is a crucial part of the China Train Control System
(CTCS) [Pu, Wang and Zhang (2010); Zhao and Shi (2013); Xiao and Zhao (2008)]. As
shown in Fig. 1, the balise information transmission system (BITS) serves as an
indispensable part of the train control system, composed of on-board Balise Transmission
Module (BTM) and ground Balise [Zhao, Tang and Li (2010); Xu, Zhang and Wang
(2010); Zheng and Zhao (2008)]. Fig. 2 shows the system diagram of the balise
information transmission system.
The fixed message balise belongs to the passive balise and the stored message is fixed.
The passive balise is in the sleep state when there is no train. In the process of train
1 Shijiazhuang Tiedao University, 17 Northeast Second Inner Ring, Shijiazhuang, 050043, China.
2 College of Information Engineering, Sanming University,Sanming, China.
* Corresponding Author: Zhiwei Gao. Email: [email protected].
860 Copyright © 2019 Tech Science Press CMC, vol.58, no.3, pp.859-878, 2019
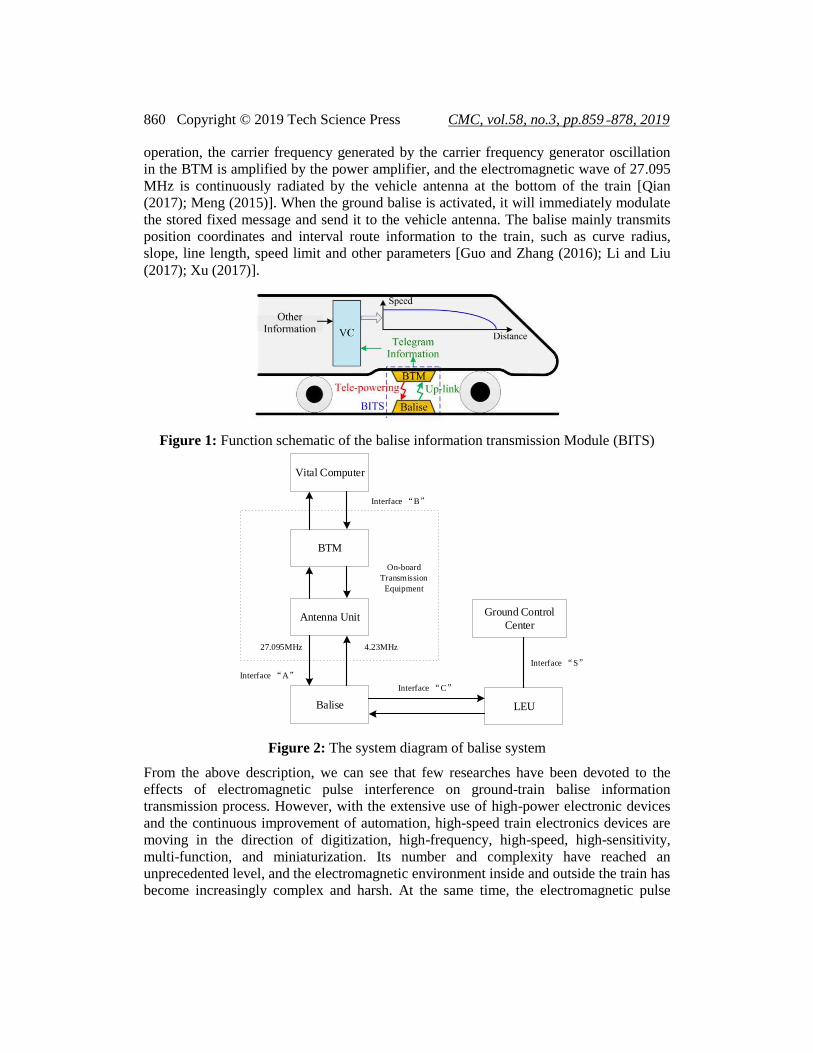
operation, the carrier frequency generated by the carrier frequency generator oscillation
in the BTM is amplified by the power amplifier, and the electromagnetic wave of 27.095
MHz is continuously radiated by the vehicle antenna at the bottom of the train [Qian
(2017); Meng (2015)]. When the ground balise is activated, it will immediately modulate
the stored fixed message and send it to the vehicle antenna. The balise mainly transmits
position coordinates and interval route information to the train, such as curve radius,
slope, line length, speed limit and other parameters [Guo and Zhang (2016); Li and Liu
(2017); Xu (2017)].
Figure 1: Function schematic of the balise information transmission Module (BITS)
Vital Computer
BTM
Antenna Unit
Balise LEU
Ground Control
Center
27.095MHz 4.23MHz
On-board
Transmission
Equipment
Interface B
Interface A
Interface C
Interface S
Figure 2: The system diagram of balise system
From the above description, we can see that few researches have been devoted to the
effects of electromagnetic pulse interference on ground-train balise information
transmission process. However, with the extensive use of high-power electronic devices
and the continuous improvement of automation, high-speed train electronics devices are
moving in the direction of digitization, high-frequency, high-speed, high-sensitivity,
multi-function, and miniaturization. Its number and complexity have reached an
unprecedented level, and the electromagnetic environment inside and outside the train has
become increasingly complex and harsh. At the same time, the electromagnetic pulse
Modeling and Analysis the Effects of EMP on the Balise System 861
weapon gradually develops towards miniaturization, which has high power, wide
spectrum and large lethality [Mao, Sun and Sun (2015); Qiao, Pan, He et al. (2017);
Zhang, He and Kong (2018)]. It will be easily coupled into the electronic devices through
front door coupling and back door coupling. Once the railway system is attacked, it will
certainly cause irreversible breakdown and harm. Therefore, it is necessary to research
the coupling effect of the electromagnetic pulse on balise system and ensure the safe
communication of the railway system. This paper studies the dynamic transmission
process of the balise up-link signal in basic theoretical level, and the up-link
communication process between the balise and the vehicle BTM antenna is established
based on the three-dimensional full-wave electromagnetic simulation method. The
simulation data is compared with the theoretical analysis results to verify the correctness
and applicability of the model. The simulation results show that when the spectral range
of the strong electromagnetic pulses overlaps with the operating band of the balise uplink,
it will generate intraband interference and bit errors in up-link signal, which will cause
safety hazard to high-speed train operation and train control system. As we know we are
the first to analyze the effects of EMP on Chinese BITS, which will lay a foundation for
the research of electromagnetic anti-interference or protection to high speed railway.
The remainder of this paper is organized as follows: Section 2 introduces the modeling
and simulation analysis of the dynamic transmission process of the balise up-link signal
based on finite-difference time-domain method and electromagnetic field theory. Section
3 presents the experimental verification for the proposed optimization measures. Section
4 analyzes the time-frequency characteristics, frequency spectrum distribution and energy
distribution of the typical electromagnetic pulses. In addition, the effects of three typical
strong electromagnetic pulses on the balise up-link signal are studied. Finally, the paper
is concluded in Section 5.
2 Modeling and simulation of the dynamic transmission process of the balise up-link
signal
2.1 Modeling and simulation of the balise antenna
The Balise Antenna is the transmitting end of the balise up-link model. According to the
European balise specification SUBSET-036, balise are divided into standard balise and
compact balise, of which the size of the standard balise is 358 mm×488 mm (5 mm×20
mm in cross section) and the size of the compact balise is 200 mm × 390 mm (5 mm × 20
mm in cross section) [Liang (2017)]. This paper uses standard balise dimensions for
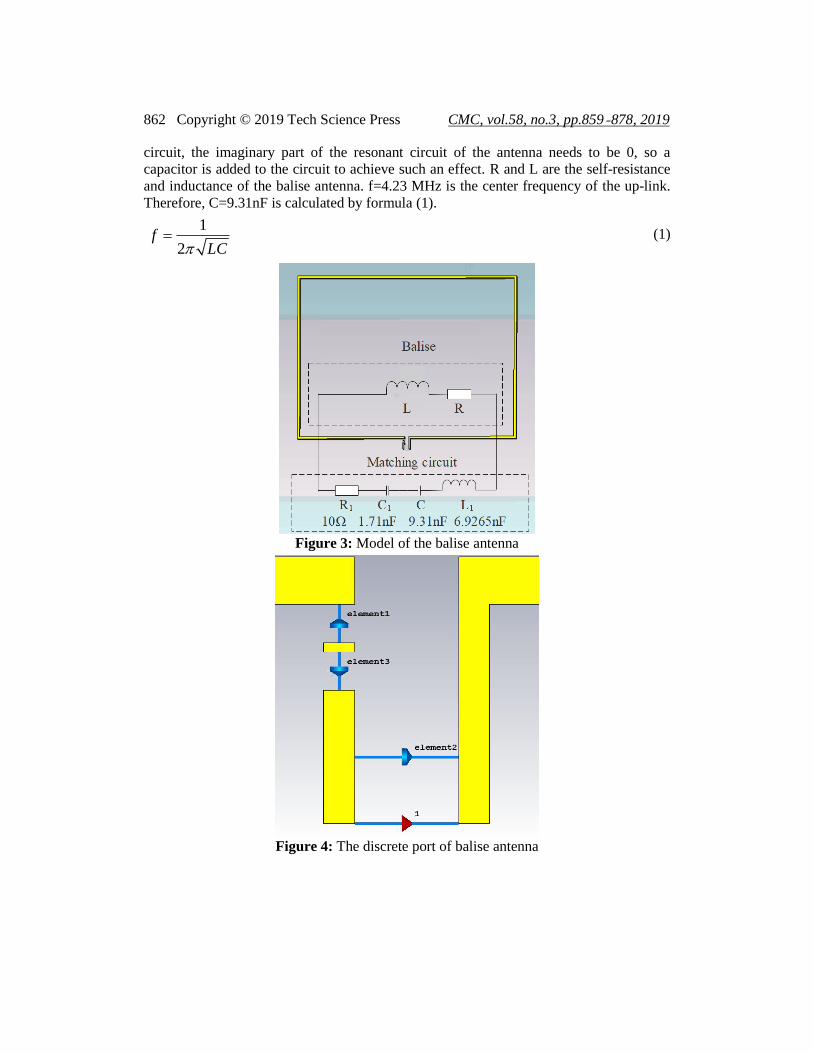
modeling and simulation. The model of a standard balise antenna is shown in Fig 3. Its
shape is a ring-shaped slice. The material of the model is solid copper and the
conductivity of the material is 5.8×10⁷ S/m. Fig. 3 shows a three-dimensional model of a
balise antenna built in the CST software. In the matching circuit diagram, the parameters
of each electronic component are marked and described. Then, in Fig. 4, we can see the
location of the discrete ports and the three resistors. In the antenna, the power is fed
through the discrete ports.
In the CST Microwave Studio, we calculated that the impedance of the antenna itself is
Z=0.02+16.48 j. In order to maximize the transmission efficiency of the antenna, it is
necessary to make it in the resonant state. According to the resonance principle of the
862 Copyright © 2019 Tech Science Press CMC, vol.58, no.3, pp.859-878, 2019
circuit, the imaginary part of the resonant circuit of the antenna needs to be 0, so a
capacitor is added to the circuit to achieve such an effect. R and L are the self-resistance
and inductance of the balise antenna. f=4.23 MHz is the center frequency of the up-link.
Therefore, C=9.31nF is calculated by formula (1).
1
2f
LC=
(1)
Figure 3: Model of the balise antenna
Figure 4: The discrete port of balise antenna
Modeling and Analysis the Effects of EMP on the Balise System 863
V L
R
C
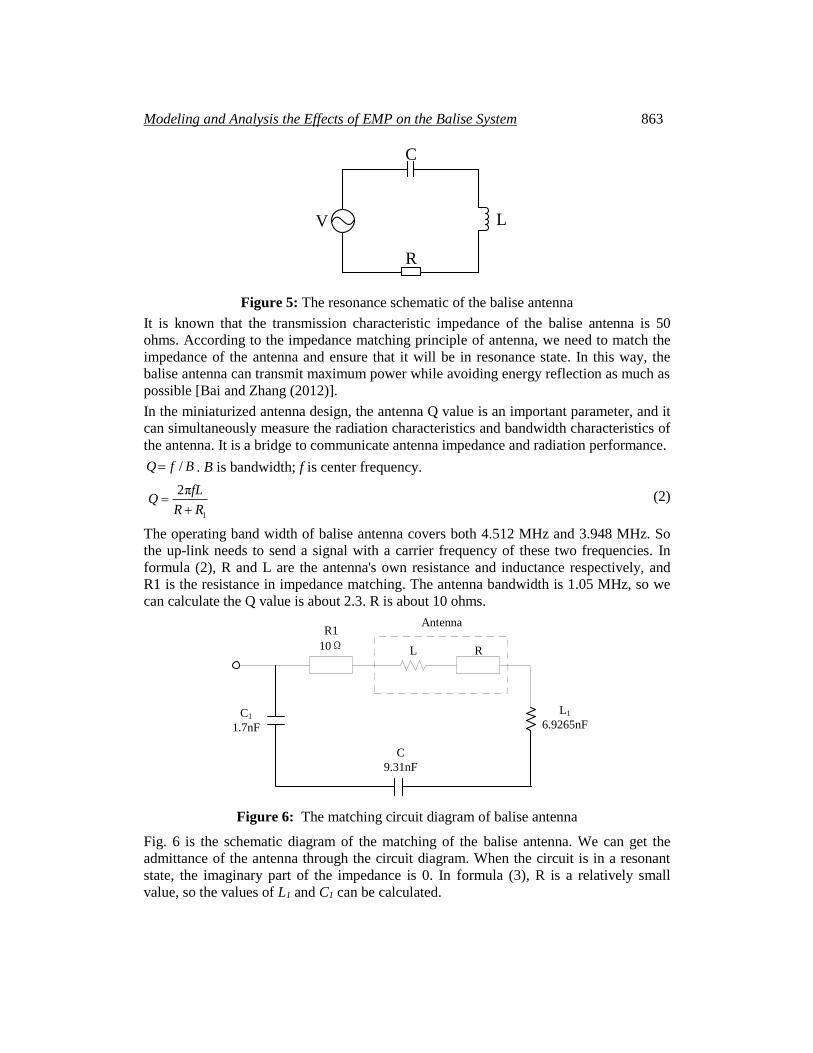
Figure 5: The resonance schematic of the balise antenna
It is known that the transmission characteristic impedance of the balise antenna is 50
ohms. According to the impedance matching principle of antenna, we need to match the
impedance of the antenna and ensure that it will be in resonance state. In this way, the
balise antenna can transmit maximum power while avoiding energy reflection as much as
possible [Bai and Zhang (2012)].
In the miniaturized antenna design, the antenna Q value is an important parameter, and it
can simultaneously measure the radiation characteristics and bandwidth characteristics of
the antenna. It is a bridge to communicate antenna impedance and radiation performance.
/Q f B= . B is bandwidth; f is center frequency.
1
2πfLQ
R R=
+ (2)
The operating band width of balise antenna covers both 4.512 MHz and 3.948 MHz. So
the up-link needs to send a signal with a carrier frequency of these two frequencies. In
formula (2), R and L are the antenna's own resistance and inductance respectively, and
R1 is the resistance in impedance matching. The antenna bandwidth is 1.05 MHz, so we
can calculate the Q value is about 2.3. R is about 10 ohms.
C1
1.7nF
R1
10Ω L R
Antenna
L1
6.9265nF
C
9.31nF
Figure 6: The matching circuit diagram of balise antenna
Fig. 6 is the schematic diagram of the matching of the balise antenna. We can get the
admittance of the antenna through the circuit diagram. When the circuit is in a resonant
state, the imaginary part of the impedance is 0. In formula (3), R is a relatively small
value, so the values of L1 and C1 can be calculated.
864 Copyright © 2019 Tech Science Press CMC, vol.58, no.3, pp.859-878, 2019
( ) ( )22
1 1
0
1
R R w L LZ
R R
+ + +=
+ (3)
C is resonant capacitor. In the matching circuit of balise antenna, L1、C1 and R1 are
matching elements. Then these components form a complete matching circuit, and we
can get the impedance of the Balise antenna from Fig. 7.
Figure 7: The impedance of balise antenna (Real part and imaginary part)
After impedance matching, the real and imaginary simulation results of the balise antenna
impedance are shown in Fig. 7. The balise antenna’s impedance is Z=49.6-j0.004. The
real part of the impedance is about 50 ohms, and the imaginary part is approximately zero.
Therefore, the tuning and matching process of the circuit is completed.
V/A Matrix Coefficient in Z [Real Part]
Frequency /MHz (a) Real Part
V/A Matrix Coefficient in Z [Imaginary Part]
Frequency /MHz (b) Imaginary Part
Modeling and Analysis the Effects of EMP on the Balise System 865
2.2 Modeling and simulation of the BTM antenna based on finite-difference time-
domain method
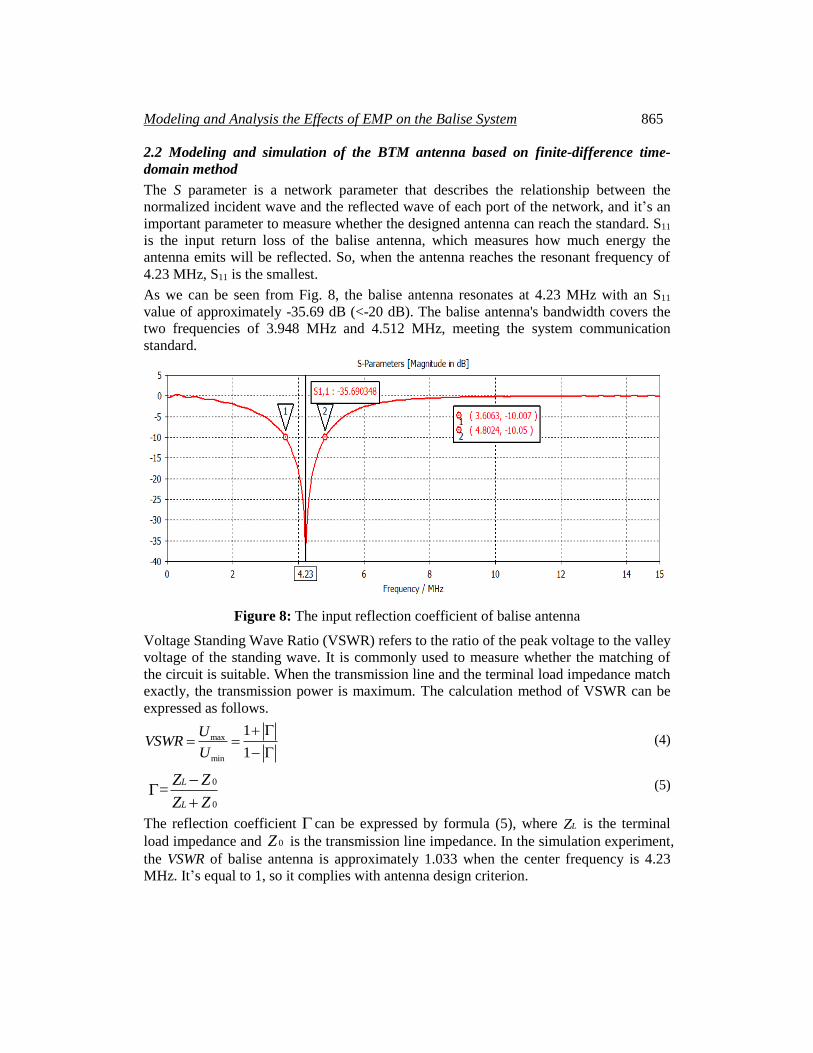
The S parameter is a network parameter that describes the relationship between the
normalized incident wave and the reflected wave of each port of the network, and it’s an
important parameter to measure whether the designed antenna can reach the standard. S11
is the input return loss of the balise antenna, which measures how much energy the
antenna emits will be reflected. So, when the antenna reaches the resonant frequency of
4.23 MHz, S11 is the smallest.
As we can be seen from Fig. 8, the balise antenna resonates at 4.23 MHz with an S11
value of approximately -35.69 dB (<-20 dB). The balise antenna's bandwidth covers the
two frequencies of 3.948 MHz and 4.512 MHz, meeting the system communication
standard.
Figure 8: The input reflection coefficient of balise antenna
Voltage Standing Wave Ratio (VSWR) refers to the ratio of the peak voltage to the valley
voltage of the standing wave. It is commonly used to measure whether the matching of
the circuit is suitable. When the transmission line and the terminal load impedance match
exactly, the transmission power is maximum. The calculation method of VSWR can be
expressed as follows.
max
min
1
1
UVSWR
U
+ = =
− (4)
0
0
=L
L
Z Z
Z Z
−
+ (5)
The reflection coefficient can be expressed by formula (5), where LZ is the terminal
load impedance and 0Z is the transmission line impedance. In the simulation experiment,
the VSWR of balise antenna is approximately 1.033 when the center frequency is 4.23
MHz. It’s equal to 1, so it complies with antenna design criterion.
866 Copyright © 2019 Tech Science Press CMC, vol.58, no.3, pp.859-878, 2019
Figure 9: The VSWR of balise antenna
The vehicle transmission device includes Balise Transmission Module and BTM antenna
unit. The BTM mainly processes the received message information, and the BTM
antenna is used to transmit RF energy signal and receive the up-link signal. The BTM
antenna model built in the CST is a rectangular ring. Its material is copper and its
conductivity is 5.8×10⁷ S/m. The ring has a length and width of 20 mm and the cross-
sectional area is 5 mm×20 mm.
Figure 10: The BTM antenna model
Modeling and Analysis the Effects of EMP on the Balise System 867
Figure 11: The discrete port of BTM antenna
Fig. 10 shows the BTM antenna and its equivalent circuit. Fig. 11 shows the location of
discrete ports and other circuit components clearly. Since the up-link frequency of the
balise is 4.23 MHz, we tuned and matched the circuit according to the principle of the
antenna, and obtained the specific parameters of each component in the equivalent circuit.
C is a resonant capacitor. C1, L2, and R2 are are added to the circuit to make the
impedance of the antenna reach the transmission impedance.
The S-parameter and VSWR are important parameters to characterize antenna
performance. The following two pictures show the simulation results of two parameters.
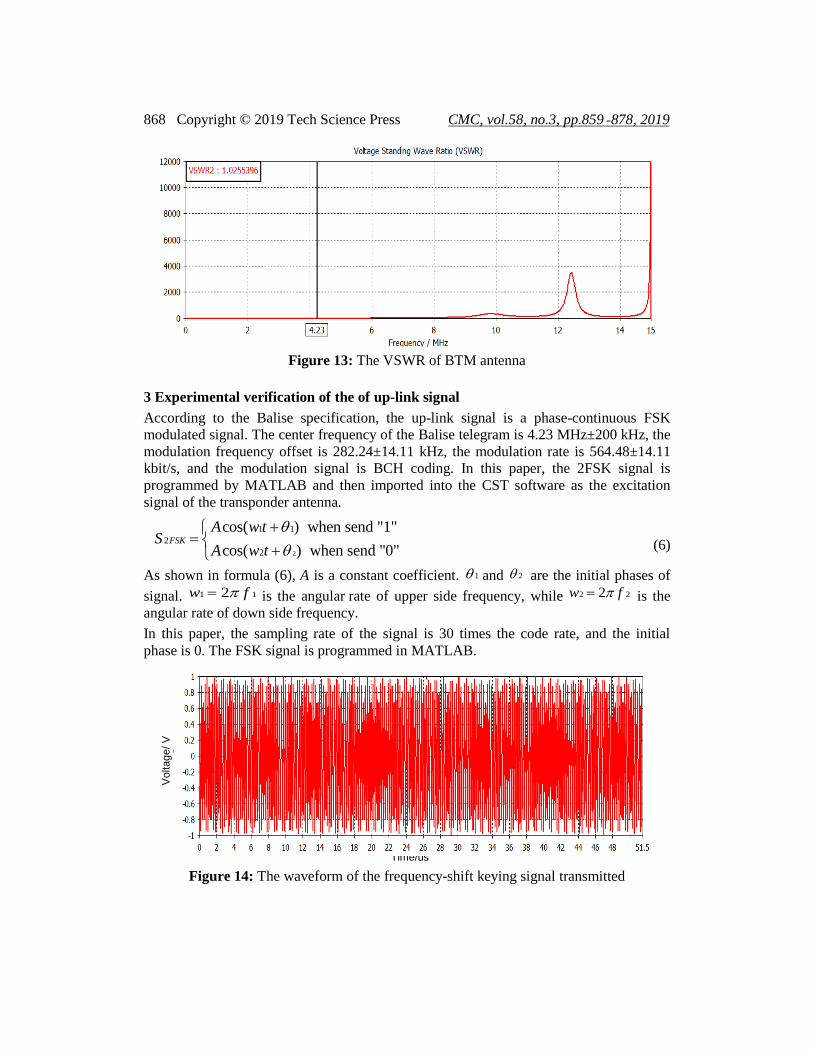
The VSWR of the BTM antenna is 1.025, while the BTM antenna achieves resonance
when frequency is 4.23 MHz. The bandwidth covers 3.948 MHz to 4.512 MHz. So the
antenna model satisfied the technical requirements of the balise up-link process.
Figure 12: The S22 parameter of BTM antenna
868 Copyright © 2019 Tech Science Press CMC, vol.58, no.3, pp.859-878, 2019
Figure 13: The VSWR of BTM antenna
3 Experimental verification of the of up-link signal
According to the Balise specification, the up-link signal is a phase-continuous FSK
modulated signal. The center frequency of the Balise telegram is 4.23 MHz±200 kHz, the
modulation frequency offset is 282.24±14.11 kHz, the modulation rate is 564.48±14.11
kbit/s, and the modulation signal is BCH coding. In this paper, the 2FSK signal is
programmed by MATLAB and then imported into the CST software as the excitation
signal of the transponder antenna.
2
1 1
2
2
cos( ) when send "1"
cos( ) when send "0"FSK
A w tS
A w t
+=
+ (6)
As shown in formula (6), A is a constant coefficient. 1 and 2 are the initial phases of
signal. 1 12w f= is the angular rate of upper side frequency, while 2 22w f= is the
angular rate of down side frequency.
In this paper, the sampling rate of the signal is 30 times the code rate, and the initial
phase is 0. The FSK signal is programmed in MATLAB.
Figure 14: The waveform of the frequency-shift keying signal transmitted
Time/us
Voltage/ V
Time/us
Vo
ltag
e/V
Modeling and Analysis the Effects of EMP on the Balise System 869
Figure 15: The waveform of frequency-shift keying signal received
Figure 16: The Fourier transform result of received FSK signal
Fig. 14 shows the FSK time domain signal waveform transmitted by the balise antenna in
the up-link, and Fig. 15 shows the time domain signal received by the BTM antenna.
Comparing the two graphs, when the BTM receives the FSK signal, the waveform is not
distorted, and the two antennas between the train and the ground can transmit signals
normally.
We perform Fourier transform on the signal received by the BTM antenna, and then
obtain the spectral distribution of the signal. As shown in Fig. 16, the received signal has
two spectral peaks, which correspond to the upper side frequency of the signal of 4.512
MHz and the lower side frequency of 3.948 MHz. Therefore, the bandwidth of the balise
up-link model is verified to meet the communication requirements of the balise system.
Ma
gnitude/
dB
uv
Frequency/MHz
Mag
nit
ud
e/d
Bu
v
Time/us
Voltage/ V
Time/us
Vo
ltag
e/V
870 Copyright © 2019 Tech Science Press CMC, vol.58, no.3, pp.859-878, 2019
Figure 17: The near-field lobe pattern of up-link at different specific frequencies
In the experiment, the dynamic process of balise antenna and BTM antenna along the y-
axis is simulated by setting the scanning parameters. Then we analyze the law of the
near-field lobes and the field strength difference of the up-link as a function of distance.
Figure 18: Rail and balise up-link model (vertical installation)
Fig. 17 shows the near-field lobe of the balise up-link when the frequency is 3.948 MHz,
4.23 MHz, 4.512 MHz. The abscissa is the horizontal relative position of the BTM
antenna and the balise antenna in y direction, and the ordinate indicates the magnetic
field of the up-link in the z-axis component. The simulation results show that the peak of
the sidelobe region and the field strength of the main lobe peak are more than 35 dB in
balise up-link system. As the relative horizontal distance between the two antennas
Voltage/
V
Horizontal distance between BTM antenna and balise /m
Modeling and Analysis the Effects of EMP on the Balise System 871
increases, the component of the up-link magnetic field on the z-axis gradually decreases,
and the field strength between the crosstalk region and the field strength of the contact
region is not less than 60 dB. It can be obtained by simulation calculation of the model
field strength difference, and the model satisfies the requirements of the transponder up-
link field strength consistency.
4 Analysis of the coupling effects of electromagnetic pulse on Balise system
4.1 Time and frequency domain characteristics of typical electromagnetic pulse
Electromagnetic pulse (EMP) is a kind of transient electromagnetic phenomenon [Liu
and Liu (2014); Liu, Liu, Tan et al. (2015)]. It has the characteristics of steep rising edge
and short acting time in the time domain; it shows a wide spectrum range and a large
range of action in the frequency domain. According to existing literature and
international standards, a time-domain waveform of a pulse is generally defined using a
double exponential function [Jia (2013)]; Sheng, Bi and Tian (2003)]. Its double
exponential analytic function is expressed as
( )0 e et tE E k − −= − (7)
E0 is the peak field strength; k is the correction factor; α, β is the parameter characterizing
the front and back edges of the pulse.
Figure 19: Waveform of double exponential pulse
Table.1 shows the different types of electromagnetic pulse waveform parameters,
including α, β, k.
In this paper, three typical electromagnetic pulses conforming to the IEC61000 standard
are selected for analysis and their frequency domain characteristics and laws are studied.
The electromagnetic pulse was set as a plane wave in the experiment.
872 Copyright © 2019 Tech Science Press CMC, vol.58, no.3, pp.859-878, 2019
Table 1: Waveform parameters of three typical electromagnetic pulses
EMP parameters of double exponential function
k
EMP1 5.210×10⁷ 2.580×10⁹ 1.110
EMP2 4.000×10⁷ 6.000×10⁸ 1.300
EMP3 7.714×10⁴ 2.489×10⁵ 2.330
Figure 20: Time domain waveforms of three types of EMP
Figure 21: Spectrum characteristic of three types of electromagnetic pulses
As shown in Fig. 21, the amplitude of the EMP3 spectrum in the low-frequency band is
the largest, which is significantly higher than the latter two, while the EMP1 has the
smallest spectrum amplitude. In addition, EMP3 has the smallest spectral width, followed
by EMP2, while EMP1 has the largest spectral width.
Frequency/Hz
Am
plit
ude/d
B
Time/ns Time/ns Time/ns
Norm
aliz
ed a
mp
litude
Modeling and Analysis the Effects of EMP on the Balise System 873
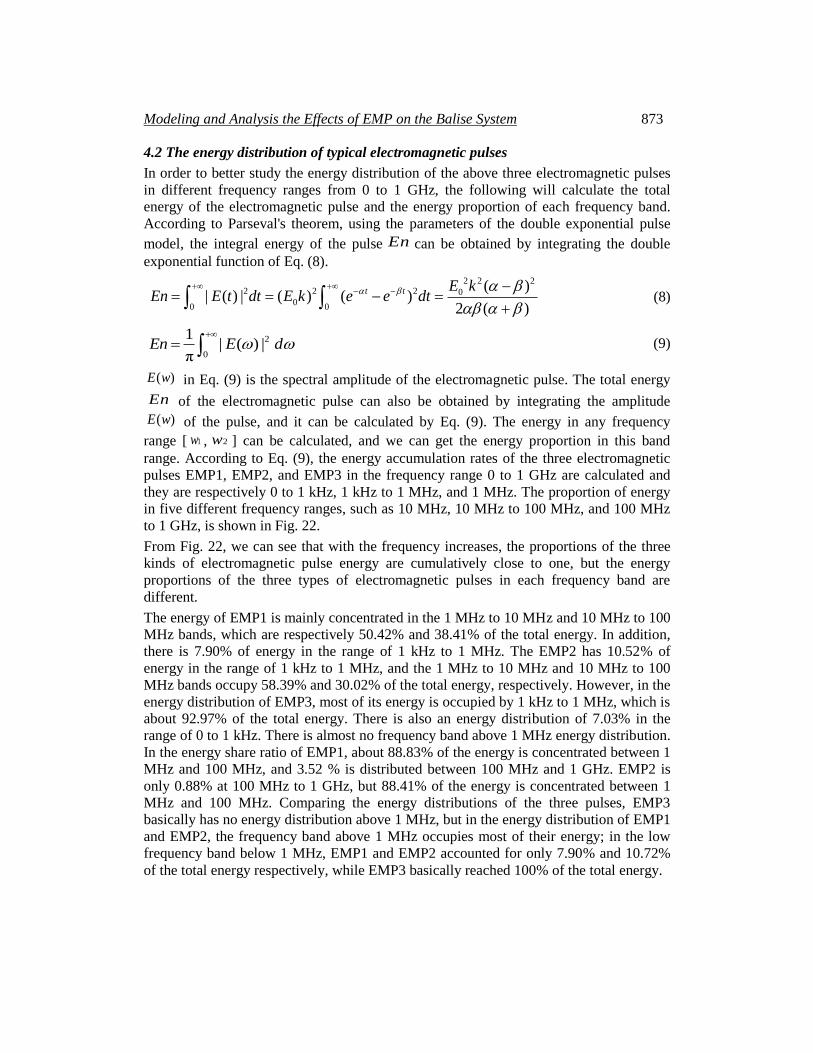
4.2 The energy distribution of typical electromagnetic pulses
In order to better study the energy distribution of the above three electromagnetic pulses
in different frequency ranges from 0 to 1 GHz, the following will calculate the total
energy of the electromagnetic pulse and the energy proportion of each frequency band.
According to Parseval's theorem, using the parameters of the double exponential pulse
model, the integral energy of the pulse En can be obtained by integrating the double
exponential function of Eq. (8).
2 2 22 2 2 0
00 0
( )| ( ) | ( ) ( )
2 ( )
t t E kEn E t dt E k e e dt
+ +− − −
= = − =+ (8)
2
0
1| ( ) |
πEn E d
+
= (9)
( )E w in Eq. (9) is the spectral amplitude of the electromagnetic pulse. The total energy
En of the electromagnetic pulse can also be obtained by integrating the amplitude
( )E w of the pulse, and it can be calculated by Eq. (9). The energy in any frequency
range [ 1w , 2w ] can be calculated, and we can get the energy proportion in this band
range. According to Eq. (9), the energy accumulation rates of the three electromagnetic
pulses EMP1, EMP2, and EMP3 in the frequency range 0 to 1 GHz are calculated and
they are respectively 0 to 1 kHz, 1 kHz to 1 MHz, and 1 MHz. The proportion of energy
in five different frequency ranges, such as 10 MHz, 10 MHz to 100 MHz, and 100 MHz
to 1 GHz, is shown in Fig. 22.
From Fig. 22, we can see that with the frequency increases, the proportions of the three
kinds of electromagnetic pulse energy are cumulatively close to one, but the energy
proportions of the three types of electromagnetic pulses in each frequency band are
different.
The energy of EMP1 is mainly concentrated in the 1 MHz to 10 MHz and 10 MHz to 100
MHz bands, which are respectively 50.42% and 38.41% of the total energy. In addition,
there is 7.90% of energy in the range of 1 kHz to 1 MHz. The EMP2 has 10.52% of
energy in the range of 1 kHz to 1 MHz, and the 1 MHz to 10 MHz and 10 MHz to 100
MHz bands occupy 58.39% and 30.02% of the total energy, respectively. However, in the
energy distribution of EMP3, most of its energy is occupied by 1 kHz to 1 MHz, which is
about 92.97% of the total energy. There is also an energy distribution of 7.03% in the
range of 0 to 1 kHz. There is almost no frequency band above 1 MHz energy distribution.
In the energy share ratio of EMP1, about 88.83% of the energy is concentrated between 1
MHz and 100 MHz, and 3.52 % is distributed between 100 MHz and 1 GHz. EMP2 is
only 0.88% at 100 MHz to 1 GHz, but 88.41% of the energy is concentrated between 1
MHz and 100 MHz. Comparing the energy distributions of the three pulses, EMP3
basically has no energy distribution above 1 MHz, but in the energy distribution of EMP1
and EMP2, the frequency band above 1 MHz occupies most of their energy; in the low
frequency band below 1 MHz, EMP1 and EMP2 accounted for only 7.90% and 10.72%
of the total energy respectively, while EMP3 basically reached 100% of the total energy.
874 Copyright © 2019 Tech Science Press CMC, vol.58, no.3, pp.859-878, 2019
(a) Energy accumulation rate
(b) Energy proportion
Figure 22: Energy accumulation rate of different electromagnetic pulses and energy
proportion of each frequency band
4.3 The coupling effects of three kinds of electromagnetic pulse on Balise up-link
According to the balise I/O characteristics, the strongest amplitude of balise up-link
signal is 116 mA, and the weakest amplitude is 37 mA. In the balise up-link, the vehicle
antenna is the receiving part of the information transmission process. Under
electromagnetic pulse interference, interference currents are easily generated through the
“Front Door” coupling. Although the duration of the electromagnetic pulse is relatively
short with respect to the up-link time, the instantaneous energy is very strong and the
spectrum distribution range is large. If there is a communication between the BTM
antenna and the balise at this time, when the amplitude of the coupled interference
current exceeds the amplitude of the balise up-link signal, a bit error will be caused in the
Frequency/Hz
Energ
y r
atio
/%
Frequency/Hz
Energ
y a
ccum
ula
tio
n r
ate
/%
Modeling and Analysis the Effects of EMP on the Balise System 875
interfered part of up-link process. Therefore, three different types of electromagnetic
pulses, namely EMP1, EMP2 and EMP3, are set in the model to simulate the irradiation
experiment in the form of plane waves.
Figure 23: The current curve of vehicle antenna coupling under two kinds of EMP
Figure 24: The current curve of vehicle antenna coupling under EMP3
In the simulation, some parameters of the three electromagnetic pulses are the same. The
elevation angle is 90° and the azimuth is 0°. The polarization modes are both vertically
polarized and the pulse peaks are both 50 kV/m.
The two pictures show that, the coupling current of the BTM antenna exceeds the current
amplitude (mA level) of the balise up-link signal under the irradiation of EMP1 and
EMP2.
The coupling current is very small caused by EMP3. Therefore, under the same
experimental conditions, EMP1 and EMP2 will interfere with the BTM antenna to accept
FSK signals.
Time/ns Time/ns
Th
e a
mp
litude o
f couplin
g c
urr
ent/A
Time/us
Th
e a
mplit
ude o
f couplin
g c
urr
ent/A
876 Copyright © 2019 Tech Science Press CMC, vol.58, no.3, pp.859-878, 2019
5 Conclusion
In this paper, we build a simulation model of the Balise up-link system in CST software
based on electromagnetic field theory. Then the correctness of the model is verified
according to the communication standard and antenna theory of the Balise system.
Finally, the simulation results of this system when it is interfered by different types of
electromagnetic pulses are analyzed. As we know we are the first to analyze the effects of
EMP on BTM, which will lay a foundation for the research of electromagnetic anti-
interference or protection to high-speed railway. The main contributions are as follows:
1. The model of the Balise up-link process was established, and the matching
capacitance and inductance of the antenna were calculated and verified based on the
principle of circuit and the technical requirements of BITS. The results of simulation
show that the vehicle and balise antenna reach resonance and the impedance reaches
the matching state when frequency is 4.23 MHz. The voltage standing wave ratio
(VSWR) of the two antennas are about 1.025 and 1.033 respectively, which have met
the antenna design standard.
2. The Balise FSK up-link-signal was analyzed. The simulation results show that the
balise antenna can send FKS signal, and the BTM antenna can receive the signal
which will not cause signal distortion. The bandwidth of the two antennas covers the
frequency band 3.9-4.5 MHz. So, the bandwith is complied with the standard of the
balise up-link communication. The near-field lobe mode of the Balise up-link is
determined by simulation, which satisfies the requirements of field strength
consistency.
3. The energy share of different frequency bands of three kinds of EMP are analyzed in
the frequency range of 0~1 GHz based on the time-frequency characteristics. The
coupling interference effect of electromagnetic pulse is simulated and analyzed
combined with the balise up-link model. It can be concluded from the simulation that
the EMP belongs to transient electromagnetic interference. Its spectral distribution is
wide, and the pulse energy is large. In-band interference occurs when the spectral
range of the electromagnetic pulse overlaps with the operating band of the Balise up-
link. At the same time, it may cause error codes in the up-link signal, which will
seriously affect the safety of high-speed railway operation. As we know we are the
first to analyze the effects of EMP on Chinese BITS, which will lay a foundation for
the research of electromagnetic anti-interference or protection to high speed railway.
References
Bai, X. W.; Zhang, Y. J. (2010): Research on automatic matching technology for
antenna impedance based on RFID. Chinese Journal of Electron Devices, vol. 33, no. 2,
pp. 205-208.
Guo, Y. H.; Zhang, J. B. (2016): Analysis of electromagnetic compatibility of EMU
onboard BTM equipment. Journal of The China Railway Society, vol. 38, no. 11, pp. 75-79.
Jia, M. Z. (2013): The analysis and anti-interferences measures of the transient pulse
interference of the railway signal equipment. Railway Signalling & Communication
Engineering, vol. 1, no. 1, pp. 87-89.
Modeling and Analysis the Effects of EMP on the Balise System 877
Li, X.; Liu, Z. T. (2017): Study on influence of balise installation angular deflection on
transmission performance. Journal of The China Railway Society, vol. 39, no. 1, pp. 83-
89.
Liang, D. (2017): Research on Electromagnetic Coupling Mechanism and Performance
Optimization of Balise Transmission System (Ph.D. Thesis). Beijing Jiaotong University,
Beijing.
Liu, S. H.; Liu, W. D. (2014): Progress of relevant research on electromagnetic
compatibility and electromagnetic protection. High Voltage Engineering, vol. 40, no. 6,
pp. 1605-1613.
Liu, P. G.; Liu, C. X.; Tan, J. F.; Dong, Y. F.; Yi, B. (2015): Analysis of the research
development on HPM/EMP protection. Chinese Journal of Ship Research, vol. 10, no. 2,
pp. 2-6.
Mao, C. G.; Sun, D. Y.; Sun, B. Y. (2015): Statistical study on response of overhead
line to electromagnetic pulse. High Power Laser and Particle Beams, vol. 27, no. 7, pp.
156-161.
Meng, Y. S. (2015): Study on influence of environmental mediums on performance of
interface ‘A’ of balise system. Journal of The China Railway Society, vol. 37, no. 3, pp.
54-58.
Pu, S.; Wang, J. H.; Zhang, Z. (2010): Estimation for small-scale fading characteristics
of RF wireless link under railway communication environment using integrative
modeling technique. Progress in Electromagnetics Research, vol. 106, no. 4, pp. 395-
417.
Qiao, Z. J.; Pan, X. C.; He, Y.; Chen, H.; Shen, J.; Ye, C. (2017): Damage of high
power electromagnetic pulse to unmanned aerial vehicles. High Power Laser and
Particle Beams, vol. 29, no. 11, pp. 61-66.
Qian, J. R. (2017): Research on The Limit of Interference Warning for BTM Antenna
Ports (Ph.D. Thesis). Beijing Jiaotong University, Beijing.
Sheng, S. L.; Bi, Z. J.; Tian, M. H. (2003): A new analytical expression of current
waveform in standard IEC 61000-4-2. High Power Laser and Particle Beams, vol. 15,
no. 5, pp. 464-466.
Xiao, T.; Zhao, H. B. (2008): Safety research of the coding strategy of euro balise.
Journal of China Railway Society, vol. 30, no. 6, pp. 127-130.
Xu, N.; Zhang, J. L.; Wang, C. J. (2010): Key technologies of the balise on-board test
equipment under high-speed conditions. China Railway Science, vol. 31, no. 4, pp. 131-
137.
Xu, N. (2017): Study on the performance of balise transmission module antenna after
adding shielding plate. China Railway Science, vol. 38, no. 3, pp. 110-115.
Zeng, J. Y.; Zhao, H. B. (2008): Research of the balise transmission module test system.
Journal of Beijing Jiaotong University, vol. 32, no. 2, pp. 80-83.
Zhang, F.; He, P. J.; Kong, L. (2018): Survey and design study of mesoband high
power electromagnetic pulse radiator. High Power Laser and Particle Beams, vol. 30, no.
1, pp. 87-92.
878 Copyright © 2019 Tech Science Press CMC, vol.58, no.3, pp.859-878, 2019
Zhao, H. B.; Tang, K. N.; Li, W. (2010): The dynamic characteristics of Balise
transmission module and the assessment on its adaptability under high speed condition.
China Railway Science, vol. 31, no. 3, pp. 93-98.
Zhao, L. H.; Shi, W. S. (2013): Induction coupling between jointless track circuits and
track-circuit-reader antenna. Progress in Electromagnetics Research, vol. 138, no. 10, pp.
173-196.