757 Journal of Chemical Engineering of Japan, Vol. 50, No. 10, pp. 757–767, 2017 Modeling and Scaling Up of Industrial Spray Dryers: A Review Ireneusz Zbicinski Faculty of Process and Environmental Engineering, Lodz University of Technology, 213 Wolczanska Str., Lodz 90-924, Poland Keywords: Industrial Spray Towers, Hydrodynamics, Agglomeration, Drying Kinetics, Wall Deposition, Scaling Up The paper presents a review of research works, experiments and simulations on spray drying in the industrial scale. The research area in the industrial spray drying process covers control of powder properties (bulk density, morphology), particles agglomeration (final PSD), residence time, wall deposition and safety of the process and the product. Limited number of literature references on spray drying in the industrial scale is due to high costs of running experiments and validation of theoretical models. Recent works on hydrodynamics in spray towers showed transient, oscillating, 3D flow of dispersed and gas phase which results from construction of inlet and exhaust ducts and swirl decay due to wall rough- ness (deposits). Applications of the most advanced and accurate empirical methods to calculate spray drying kinetics in industrial scale; the Characteristic Drying Curves (CDC) and the Reaction Engineering Approach (REA) were presented. The main obstacles denying confident scaling up of the spray drying process; lack of dynamic similarity between small and large units, gas turbulence modelling, determination of drying kinetics and neglecting of agglomeration process are highlighted. Methods of modelling of the agglomeration process in spray drying (transition functions, full scale agglom- eration) are described. Examples of modelling and measurements of hydrodynamics, wall deposition, agglomeration process and drying kinetics in the industrial towers are presented and discussed. Introduction Idea of spray drying was presented for the first time in 1865 by C. A. La Mont, (aſter Masters, 1985), whereas the first application is dated on 1872, when Samuel Percy reg- istered the first patent for production of the milk powder, (Percy, 1872). At the beginning of the XX century, drying concept based on feed atomization was called “spray con- centration”. Currently used terminology “spray drying” was introduced together with wider applications of this method of drying in food and chemical industry. 140 years of research resulted in development of different spray drying techniques and numerous applications in the industry, especially of co-current spray drying system. Counter-current systems, patented already in 1888 (J. H. Bassler, for drying of juice, milk, etc., aſter Masters, 1985) are sparsely encountered in the industry and are main- ly applied for production of detergents. Counter-current spray dryers in relation to co-current systems offer higher throughput and heat efficiency, less dust, control of product bulk density, multilevel atomization and lower production costs, Rahse and Dicoi (2001). Modelling of spray drying process is still one of the biggest challenges among all drying technologies; Oakley (1994), pointed out that dimensional analysis cannot be applied for modelling of spray dryers due to lack of dy- namic similarity between small and large chambers. Masters (1994), claims that for confident scaling up of spray drying process the new design can be scaled-up up to 20% in rela- tion capacity of a previous design. CFD technique which emerged in the 80-ties and is still developed, brought new openings for modelling of 3D, transient flow in spray drying including hindered drying, agglomeration, flow stability and wall deposition, Fletcher et al. (2006). 1.ɹ Hydrodynamics in Industrial Towers At the end of the 90ties of the last century, significant development of measuring techniques was observed. e companies like Dantec, TSI or Malvern introduced to the market sensors for non-invasive, in situ measurements of PSD and velocity of continuous and disperse phase which gave an impulse for deeper experimental analysis of spray drying process. Bayly et al. (2004) applied LDV (Laser Doppler Velocim- etry) to determine axial and tangential air velocity in 8 m tall and 5 m in diameter counter-current spray dryer (no drying process). Experimentally determined velocity profiles were used to validate CFD model of the gas flow in the dryer. e authors applied Reynold Stress Model to predict flow turbulence. e model showed good agreement with ex- perimental data and can be used for scaling up of industrial scale towers. Langrish and Fletcher (2003) reported works in the Aus- tralian dairy industry in 10 m in diameter dryer. e authors determined oscillating, transient, three dimensional flow patterns of gas and dispersed phase. Gabites at al. (2010) analysed theoretically and experi- Received on November 28, 2016; accepted on February 15, 2017 DOI: 10.1252/jcej.16we350 Presented at the 20th International Drying Symposium (IDS 2016), Gifu, August 2016 Correspondence concerning this article should be addressed to I. Zbi- cinski (E-mail address: [email protected]). Journal Review This article is published under a CC BY-NC-ND.
The paper presents a review of research works, experiments and simulations on spray drying in the industrial scale. The research area in the industrial spray drying process covers control of powder properties (bulk density, morphology), particles agglomeration (�nal PSD), residence time, wall deposition and safety of the process and the product. Limited number of literature references on spray drying in the industrial scale is due to high costs of running experiments and validation of theoretical models. Recent works on hydrodynamics in spray towers showed transient, oscillating, 3D �ow of dispersed and gas phase which results from construction of inlet and exhaust ducts and swirl decay due to wall rough-ness (deposits). Applications of the most advanced and accurate empirical methods to calculate spray drying kinetics in industrial scale; the Characteristic Drying Curves (CDC) and the Reaction Engineering Approach (REA) were presented. The main obstacles denying con�dent scaling up of the spray drying process; lack of dynamic similarity between small and large units, gas turbulence modelling, determination of drying kinetics and neglecting of agglomeration process are highlighted. Methods of modelling of the agglomeration process in spray drying (transition functions, full scale agglom-eration) are described. Examples of modelling and measurements of hydrodynamics, wall deposition, agglomeration process and drying kinetics in the industrial towers are presented and discussed.
Introduction
Idea of spray drying was presented for the first time in 1865 by C. A. La Mont, (after Masters, 1985), whereas the first application is dated on 1872, when Samuel Percy reg-istered the first patent for production of the milk powder, (Percy, 1872). At the beginning of the XX century, drying concept based on feed atomization was called “spray con-centration”. Currently used terminology “spray drying” was introduced together with wider applications of this method of drying in food and chemical industry.
140 years of research resulted in development of different spray drying techniques and numerous applications in the industry, especially of co-current spray drying system.
Counter-current systems, patented already in 1888 (J. H. Bassler, for drying of juice, milk, etc., after Masters, 1985) are sparsely encountered in the industry and are main-ly applied for production of detergents. Counter-current spray dryers in relation to co-current systems offer higher throughput and heat efficiency, less dust, control of product bulk density, multilevel atomization and lower production costs, Rahse and Dicoi (2001).
Modelling of spray drying process is still one of the biggest challenges among all drying technologies; Oakley (1994), pointed out that dimensional analysis cannot be applied for modelling of spray dryers due to lack of dy-
namic similarity between small and large chambers. Masters (1994), claims that for confident scaling up of spray drying process the new design can be scaled-up up to 20% in rela-tion capacity of a previous design.
CFD technique which emerged in the 80-ties and is still developed, brought new openings for modelling of 3D, transient flow in spray drying including hindered drying, agglomeration, flow stability and wall deposition, Fletcher et al. (2006).
1. Hydrodynamics in Industrial Towers
At the end of the 90ties of the last century, significant development of measuring techniques was observed. The companies like Dantec, TSI or Malvern introduced to the market sensors for non-invasive, in situ measurements of PSD and velocity of continuous and disperse phase which gave an impulse for deeper experimental analysis of spray drying process.
Bayly et al. (2004) applied LDV (Laser Doppler Velocim-etry) to determine axial and tangential air velocity in 8 m tall and 5 m in diameter counter-current spray dryer (no drying process). Experimentally determined velocity profiles were used to validate CFD model of the gas flow in the dryer. The authors applied Reynold Stress Model to predict flow turbulence. The model showed good agreement with ex-perimental data and can be used for scaling up of industrial scale towers.
Langrish and Fletcher (2003) reported works in the Aus-tralian dairy industry in 10 m in diameter dryer. The authors determined oscillating, transient, three dimensional flow patterns of gas and dispersed phase.
Gabites at al. (2010) analysed theoretically and experi-
Received on November 28, 2016; accepted on February 15, 2017DOI: 10.1252/jcej.16we350Presented at the 20th International Drying Symposium (IDS 2016), Gifu, August 2016Correspondence concerning this article should be addressed to I. Zbi-cinski (E-mail address: [email protected]).
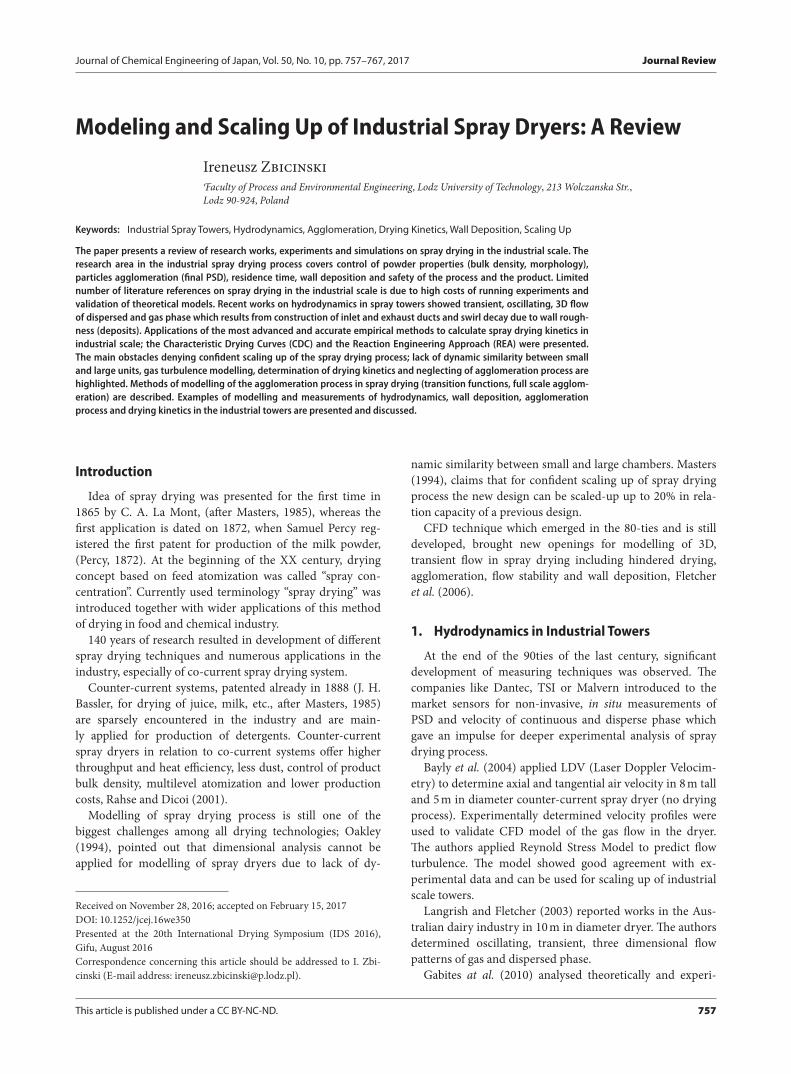
mentally air flow patterns in an industrial milk powder spray tower with internal fluid bed in isothermal conditions (no atomised liquid droplets), Figure 1. The authors de-tected oscillations and precession of the main air jet around the central axis with no apparent distinct frequency. They observed also fluctuations in size of the recirculation zones between the main jet and the chamber walls. The simula-tions were validated in simple experiments using the telltale rig (3 m high stainless steel pole with fabric tufts placed at 200 mm intervals) to measure the period of oscillation of the main air jet. Woo et al. (2012) used similar experimental technique (cotton turf and hotwire measurements) to de-scribe the highly swirl flow in a small spray dryer.
The results of the simulations allowed the authors to make suggestions important for industrial practice regarding con-struction and operation of the tower; location of outlet ducts (near the top rather than the bottom of the dryer) and keep-ing constant pressure conditions downstream to the dust collector.
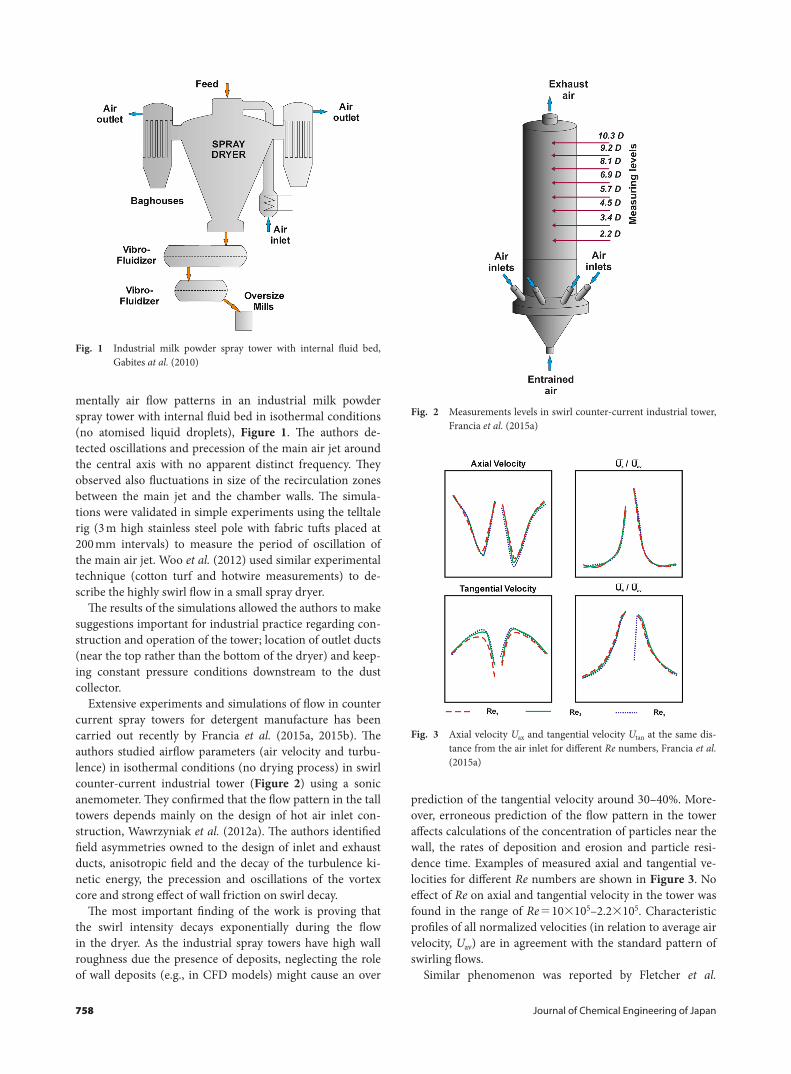
Extensive experiments and simulations of flow in counter current spray towers for detergent manufacture has been carried out recently by Francia et al. (2015a, 2015b). The authors studied airflow parameters (air velocity and turbu-lence) in isothermal conditions (no drying process) in swirl counter-current industrial tower (Figure 2) using a sonic anemometer. They confirmed that the flow pattern in the tall towers depends mainly on the design of hot air inlet con-struction, Wawrzyniak et al. (2012a). The authors identified field asymmetries owned to the design of inlet and exhaust ducts, anisotropic field and the decay of the turbulence ki-netic energy, the precession and oscillations of the vortex core and strong effect of wall friction on swirl decay.
The most important finding of the work is proving that the swirl intensity decays exponentially during the flow in the dryer. As the industrial spray towers have high wall roughness due the presence of deposits, neglecting the role of wall deposits (e.g., in CFD models) might cause an over
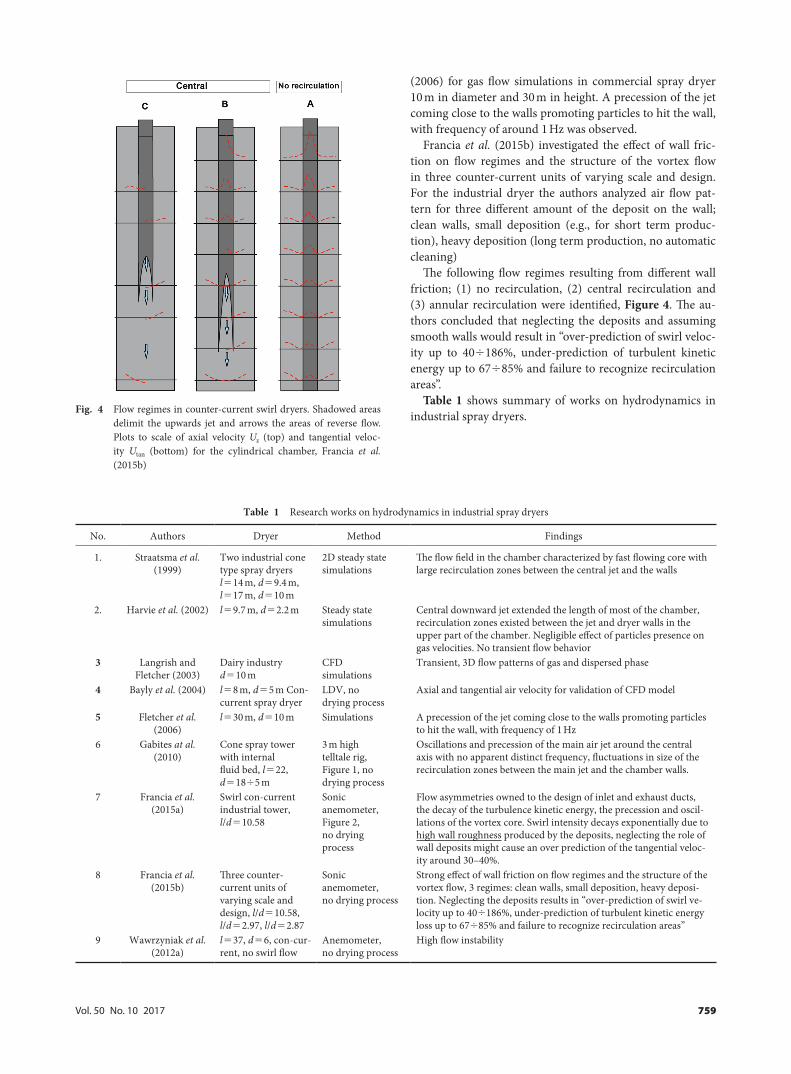
prediction of the tangential velocity around 30–40%. More-over, erroneous prediction of the flow pattern in the tower affects calculations of the concentration of particles near the wall, the rates of deposition and erosion and particle resi-dence time. Examples of measured axial and tangential ve-locities for different Re numbers are shown in Figure 3. No effect of Re on axial and tangential velocity in the tower was found in the range of Re=10×105–2.2×10⁵. Characteristic profiles of all normalized velocities (in relation to average air velocity, Uav) are in agreement with the standard pattern of swirling flows.
Similar phenomenon was reported by Fletcher et al.
Fig. 1 Industrial milk powder spray tower with internal fluid bed, Gabites at al. (2010)
Fig. 2 Measurements levels in swirl counter-current industrial tower, Francia et al. (2015a)
Fig. 3 Axial velocity Uax and tangential velocity Utan at the same dis-tance from the air inlet for different Re numbers, Francia et al. (2015a)
Vol. 50 No. 10 2017 759
(2006) for gas flow simulations in commercial spray dryer 10 m in diameter and 30 m in height. A precession of the jet coming close to the walls promoting particles to hit the wall, with frequency of around 1 Hz was observed.
Francia et al. (2015b) investigated the effect of wall fric-tion on flow regimes and the structure of the vortex flow in three counter-current units of varying scale and design. For the industrial dryer the authors analyzed air flow pat-tern for three different amount of the deposit on the wall; clean walls, small deposition (e.g., for short term produc-tion), heavy deposition (long term production, no automatic cleaning)
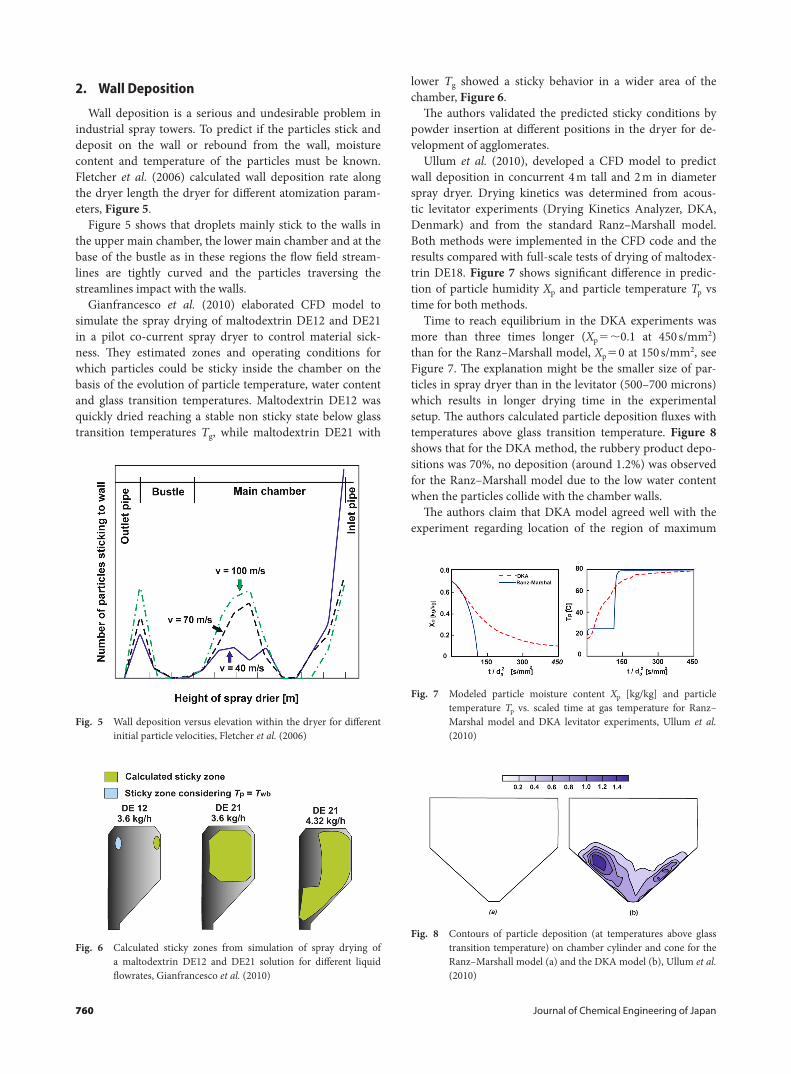
The following flow regimes resulting from different wall friction; (1) no recirculation, (2) central recirculation and (3) annular recirculation were identified, Figure 4. The au-thors concluded that neglecting the deposits and assuming smooth walls would result in “over-prediction of swirl veloc-ity up to 40÷186%, under-prediction of turbulent kinetic energy up to 67÷85% and failure to recognize recirculation areas”.
Table 1 shows summary of works on hydrodynamics in industrial spray dryers.Fig. 4 Flow regimes in counter-current swirl dryers. Shadowed areas
delimit the upwards jet and arrows the areas of reverse flow. Plots to scale of axial velocity Uz (top) and tangential veloc-ity Utan (bottom) for the cylindrical chamber, Francia et al. (2015b)
Table 1 Research works on hydrodynamics in industrial spray dryers
No. Authors Dryer Method Findings
1. Straatsma et al. (1999)
Two industrial cone type spray dryers l=14 m, d=9.4 m, l=17 m, d=10 m
2D steady state simulations
The flow field in the chamber characterized by fast flowing core with large recirculation zones between the central jet and the walls
2. Harvie et al. (2002) l=9.7 m, d=2.2 m Steady state simulations
Central downward jet extended the length of most of the chamber, recirculation zones existed between the jet and dryer walls in the upper part of the chamber. Negligible effect of particles presence on gas velocities. No transient flow behavior
3 Langrish and Fletcher (2003)
Dairy industry d=10 m
CFD simulations
Transient, 3D flow patterns of gas and dispersed phase
4 Bayly et al. (2004) l=8 m, d=5 m Con-current spray dryer
LDV, no drying process
Axial and tangential air velocity for validation of CFD model
5 Fletcher et al. (2006)
l=30 m, d=10 m Simulations A precession of the jet coming close to the walls promoting particles to hit the wall, with frequency of 1 Hz
6 Gabites at al. (2010)
Cone spray tower with internal fluid bed, l=22, d=18÷5 m
3 m high telltale rig, Figure 1, no drying process
Oscillations and precession of the main air jet around the central axis with no apparent distinct frequency, fluctuations in size of the recirculation zones between the main jet and the chamber walls.
7 Francia et al. (2015a)
Swirl con-current industrial tower, l/d=10.58
Sonic anemometer, Figure 2, no drying process
Flow asymmetries owned to the design of inlet and exhaust ducts, the decay of the turbulence kinetic energy, the precession and oscil-lations of the vortex core. Swirl intensity decays exponentially due to high wall roughness produced by the deposits, neglecting the role of wall deposits might cause an over prediction of the tangential veloc-ity around 30–40%.
8 Francia et al. (2015b)
Three counter-current units of varying scale and design, l/d=10.58, l/d=2.97, l/d=2.87
Sonic anemometer, no drying process
Strong effect of wall friction on flow regimes and the structure of the vortex flow, 3 regimes: clean walls, small deposition, heavy deposi-tion. Neglecting the deposits results in “over-prediction of swirl ve-locity up to 40÷186%, under-prediction of turbulent kinetic energy loss up to 67÷85% and failure to recognize recirculation areas”
9 Wawrzyniak et al. (2012a)
l=37, d=6, con-cur-rent, no swirl flow
Anemometer, no drying process
High flow instability
760 Journal of Chemical Engineering of Japan
2. Wall Deposition
Wall deposition is a serious and undesirable problem in industrial spray towers. To predict if the particles stick and deposit on the wall or rebound from the wall, moisture content and temperature of the particles must be known. Fletcher et al. (2006) calculated wall deposition rate along the dryer length the dryer for different atomization param-eters, Figure 5.
Figure 5 shows that droplets mainly stick to the walls in the upper main chamber, the lower main chamber and at the base of the bustle as in these regions the flow field stream-lines are tightly curved and the particles traversing the streamlines impact with the walls.
Gianfrancesco et al. (2010) elaborated CFD model to simulate the spray drying of maltodextrin DE12 and DE21 in a pilot co-current spray dryer to control material sick-ness. They estimated zones and operating conditions for which particles could be sticky inside the chamber on the basis of the evolution of particle temperature, water content and glass transition temperatures. Maltodextrin DE12 was quickly dried reaching a stable non sticky state below glass transition temperatures Tg, while maltodextrin DE21 with
lower Tg showed a sticky behavior in a wider area of the chamber, Figure 6.
The authors validated the predicted sticky conditions by powder insertion at different positions in the dryer for de-velopment of agglomerates.
Ullum et al. (2010), developed a CFD model to predict wall deposition in concurrent 4 m tall and 2 m in diameter spray dryer. Drying kinetics was determined from acous-tic levitator experiments (Drying Kinetics Analyzer, DKA, Denmark) and from the standard Ranz–Marshall model. Both methods were implemented in the CFD code and the results compared with full-scale tests of drying of maltodex-trin DE18. Figure 7 shows significant difference in predic-tion of particle humidity Xp and particle temperature Tp vs time for both methods.
Time to reach equilibrium in the DKA experiments was more than three times longer (Xp=∼0.1 at 450 s/mm2) than for the Ranz–Marshall model, Xp=0 at 150 s/mm2, see Figure 7. The explanation might be the smaller size of par-ticles in spray dryer than in the levitator (500–700 microns) which results in longer drying time in the experimental setup. The authors calculated particle deposition fluxes with temperatures above glass transition temperature. Figure 8 shows that for the DKA method, the rubbery product depo-sitions was 70%, no deposition (around 1.2%) was observed for the Ranz–Marshall model due to the low water content when the particles collide with the chamber walls.
The authors claim that DKA model agreed well with the experiment regarding location of the region of maximum
Fig. 5 Wall deposition versus elevation within the dryer for different initial particle velocities, Fletcher et al. (2006)
Fig. 6 Calculated sticky zones from simulation of spray drying of a maltodextrin DE12 and DE21 solution for different liquid flowrates, Gianfrancesco et al. (2010)
Fig. 7 Modeled particle moisture content Xp [kg/kg] and particle temperature Tp vs. scaled time at gas temperature for Ranz–Marshal model and DKA levitator experiments, Ullum et al. (2010)
Fig. 8 Contours of particle deposition (at temperatures above glass transition temperature) on chamber cylinder and cone for the Ranz–Marshall model (a) and the DKA model (b), Ullum et al. (2010)
Vol. 50 No. 10 2017 761
rubbery deposits.Birchal et al. (2006) estimated particle deposition on the
dryer wall during drying of the whole milk suspension. They applied population balance model to calculate drying kinet-ics and 3D CFD model with stochastic tracing of the par-ticle. The authors suggest that particles with high moisture content at low temperatures adhere more effectively to walls (as it follows from milk powder stick point diagram). On the basis of calculated particle trajectories they estimated that 46% of the particles hit the cylinder walls whereas only 24% will hit the conical dryer walls. To reduce wall deposit, the dryer chamber should be well insulated to increase tempera-ture of the particles near the wall.
Jin and Chen (2010) developed particle deposition model for industrial spray dryer (capacity 9 t/h of milk powder, 15 m height, 8 m in diameter). The model calculates the par-ticle deposition rate as a function of particle diameter, tem-perature, moisture content, velocity and air humidity. Three classes of particles were defined; surface tension–dominated, viscous forces dominated and dry particles, Orme (1997). Dry particles could return to the chamber after hitting the wall. The dryer wall was considered as clean at the begin-ning of the operation.
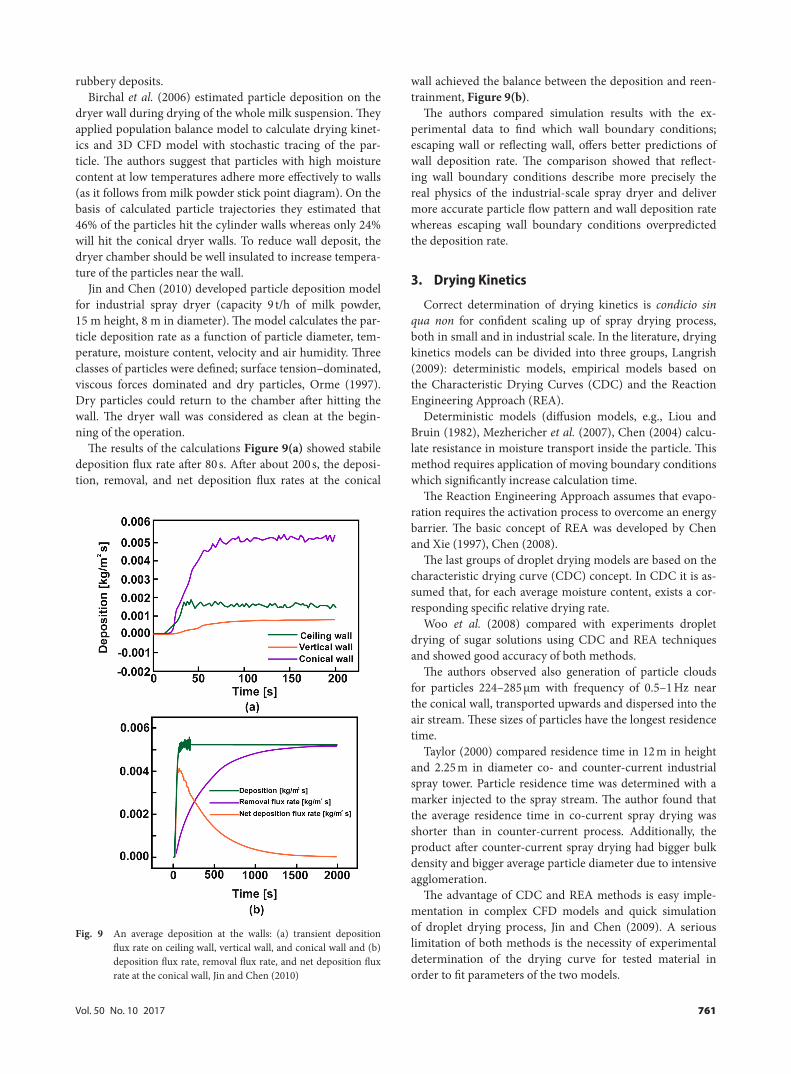
The results of the calculations Figure 9(a) showed stabile deposition flux rate after 80 s. After about 200 s, the deposi-tion, removal, and net deposition flux rates at the conical
wall achieved the balance between the deposition and reen-trainment, Figure 9(b).
The authors compared simulation results with the ex-perimental data to find which wall boundary conditions; escaping wall or reflecting wall, offers better predictions of wall deposition rate. The comparison showed that reflect-ing wall boundary conditions describe more precisely the real physics of the industrial-scale spray dryer and deliver more accurate particle flow pattern and wall deposition rate whereas escaping wall boundary conditions overpredicted the deposition rate.
3. Drying Kinetics
Correct determination of drying kinetics is condicio sin qua non for confident scaling up of spray drying process, both in small and in industrial scale. In the literature, drying kinetics models can be divided into three groups, Langrish (2009): deterministic models, empirical models based on the Characteristic Drying Curves (CDC) and the Reaction Engineering Approach (REA).
Deterministic models (diffusion models, e.g., Liou and Bruin (1982), Mezhericher et al. (2007), Chen (2004) calcu-late resistance in moisture transport inside the particle. This method requires application of moving boundary conditions which significantly increase calculation time.
The Reaction Engineering Approach assumes that evapo-ration requires the activation process to overcome an energy barrier. The basic concept of REA was developed by Chen and Xie (1997), Chen (2008).
The last groups of droplet drying models are based on the characteristic drying curve (CDC) concept. In CDC it is as-sumed that, for each average moisture content, exists a cor-responding specific relative drying rate.
Woo et al. (2008) compared with experiments droplet drying of sugar solutions using CDC and REA techniques and showed good accuracy of both methods.
The authors observed also generation of particle clouds for particles 224–285 µm with frequency of 0.5–1 Hz near the conical wall, transported upwards and dispersed into the air stream. These sizes of particles have the longest residence time.
Taylor (2000) compared residence time in 12 m in height and 2.25 m in diameter co- and counter-current industrial spray tower. Particle residence time was determined with a marker injected to the spray stream. The author found that the average residence time in co-current spray drying was shorter than in counter-current process. Additionally, the product after counter-current spray drying had bigger bulk density and bigger average particle diameter due to intensive agglomeration.
The advantage of CDC and REA methods is easy imple-mentation in complex CFD models and quick simulation of droplet drying process, Jin and Chen (2009). A serious limitation of both methods is the necessity of experimental determination of the drying curve for tested material in order to fit parameters of the two models.
Fig. 9 An average deposition at the walls: (a) transient deposition flux rate on ceiling wall, vertical wall, and conical wall and (b) deposition flux rate, removal flux rate, and net deposition flux rate at the conical wall, Jin and Chen (2010)
762 Journal of Chemical Engineering of Japan
4. Particle Agglomeration
Intensive agglomeration is observed in industrial spray towers which results in a significant increase of a particle diameter. The rate of agglomeration and size of the agglom-erates, in addition to the physicochemical properties of the atomized solution, are affected by the spray drying process parameters, geometry of the tower, the method of phase contact (co-current, counter-current or mixed) and method of feed atomization.
Changes of particle size have a significant impact on the process of drying and must be taken into account when scal-ing up spray drying process, Fletcher et al. (2006). Droplet–droplet interactions during the spray drying were analyzed by Mezhericher et al. (2007) who confirmed that droplet collisions influenced significantly the air temperature and humidity patterns in the dryer.
Huntington (2004) concluded that in counter-current spray drying, the agglomeration controls the final product properties. The author stressed the need to determine mech-anism of agglomeration process which might take place between droplets, droplet and partially dried particles and between particles.
In any case, to model agglomeration process in spray dry-ing the functions describing transition from the initial to the final PSD must be determined.
In the literature we can find several methods for model-ling of the agglomeration process: direct modelling, Hirt and Nichols (1981), Li and Fritsching (2012), stochastic models, Ho and Sommerfeld (2002), Kim et al. (2009), Taskiran and Ergeneman (2014) and particle populations balance models, Nijdam et al. (2004), Tsotsas and Mujum-dar (2007).
None of the particles agglomeration models have been fully validated due to difficulties of carrying out measure-ments in the industrial scale and lack of data on material properties (e.g., glass transition temperature or stickiness),
tower geometry, operating parameters which, in many cases are inaccessible or confidential.
In this paper two methods for modeling of agglomeration process in industrial spray towers are presented, (1) simple method based on arbitrary selected transition functions and (2) full scale agglomeration models based on modification of stochastic model which takes into account collisions of droplets, wet and dry particles and coupling with heat, mass and momentum transfer.
Presented here CFD and agglomeration models were veri-fied on the basis of measurements in the industrial spray tower for washing powder, Wawrzyniak et al. (2012b).
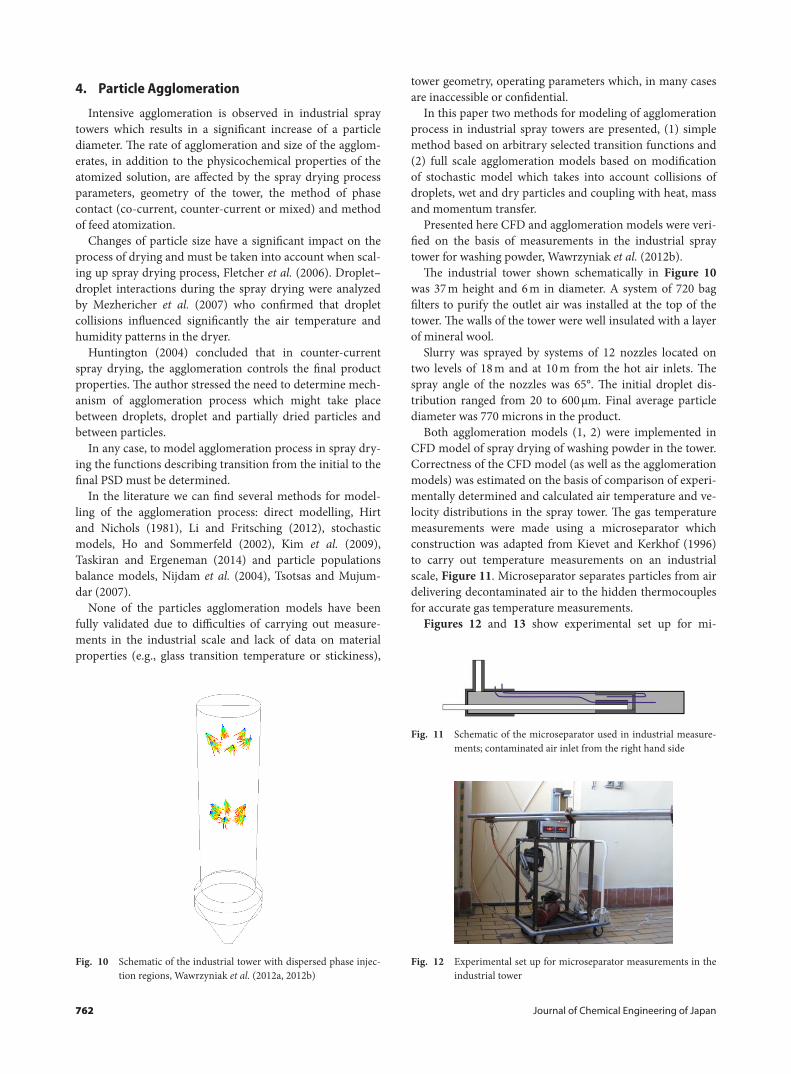
The industrial tower shown schematically in Figure 10 was 37 m height and 6 m in diameter. A system of 720 bag filters to purify the outlet air was installed at the top of the tower. The walls of the tower were well insulated with a layer of mineral wool.
Slurry was sprayed by systems of 12 nozzles located on two levels of 18 m and at 10 m from the hot air inlets. The spray angle of the nozzles was 65°. The initial droplet dis-tribution ranged from 20 to 600 µm. Final average particle diameter was 770 microns in the product.
Both agglomeration models (1, 2) were implemented in CFD model of spray drying of washing powder in the tower. Correctness of the CFD model (as well as the agglomeration models) was estimated on the basis of comparison of experi-mentally determined and calculated air temperature and ve-locity distributions in the spray tower. The gas temperature measurements were made using a microseparator which construction was adapted from Kievet and Kerkhof (1996) to carry out temperature measurements on an industrial scale, Figure 11. Microseparator separates particles from air delivering decontaminated air to the hidden thermocouples for accurate gas temperature measurements.
Figures 12 and 13 show experimental set up for mi-
Fig. 10 Schematic of the industrial tower with dispersed phase injec-tion regions, Wawrzyniak et al. (2012a, 2012b)
Fig. 11 Schematic of the microseparator used in industrial measure-ments; contaminated air inlet from the right hand side
Fig. 12 Experimental set up for microseparator measurements in the industrial tower
Vol. 50 No. 10 2017 763
croseparator gas temperature measurements during the in-dustrial spray tower operation and particles build-up on the outer tube after the measurements.
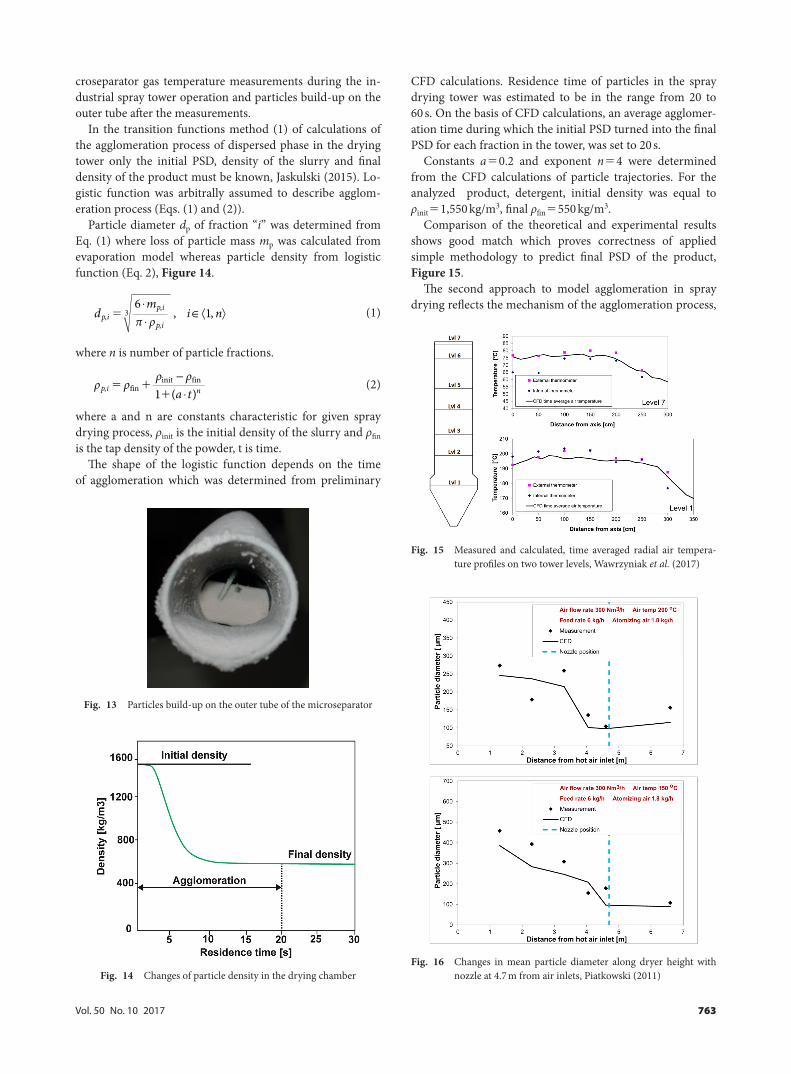
In the transition functions method (1) of calculations of the agglomeration process of dispersed phase in the drying tower only the initial PSD, density of the slurry and final density of the product must be known, Jaskulski (2015). Lo-gistic function was arbitrally assumed to describe agglom-eration process (Eqs. (1) and (2)).
Particle diameter dp of fraction “i” was determined from Eq. (1) where loss of particle mass mp was calculated from evaporation model whereas particle density from logistic function (Eq. 2), Figure 14.
⋅∈
⋅= ,3,
,
6, 1,p i
p ip i
md i nπ ρ (1)
where n is number of particle fractions.
−⋅
= ++init fin
, fin 1 ( )p i nρ ρρ ρ
a t (2)
where a and n are constants characteristic for given spray drying process, ρinit is the initial density of the slurry and ρfin is the tap density of the powder, t is time.
The shape of the logistic function depends on the time of agglomeration which was determined from preliminary
CFD calculations. Residence time of particles in the spray drying tower was estimated to be in the range from 20 to 60 s. On the basis of CFD calculations, an average agglomer-ation time during which the initial PSD turned into the final PSD for each fraction in the tower, was set to 20 s.
Constants a=0.2 and exponent n=4 were determined from the CFD calculations of particle trajectories. For the analyzed product, detergent, initial density was equal to ρinit=1,550 kg/m3, final ρfin=550 kg/m3.
Comparison of the theoretical and experimental results shows good match which proves correctness of applied simple methodology to predict final PSD of the product, Figure 15.
The second approach to model agglomeration in spray drying reflects the mechanism of the agglomeration process,
Fig. 13 Particles build-up on the outer tube of the microseparator
Fig. 14 Changes of particle density in the drying chamber
Fig. 15 Measured and calculated, time averaged radial air tempera-ture profiles on two tower levels, Wawrzyniak et al. (2017)
Fig. 16 Changes in mean particle diameter along dryer height with nozzle at 4.7 m from air inlets, Piatkowski (2011)
764 Journal of Chemical Engineering of Japan
Jaskulski et al. (2015). In this model, particle collisions were divided into three types: collisions of droplets, wet particles and dry particles. The agglomeration correction factor γ was proposed to determine a number of the collisions resulted in the agglomeration. For droplets, each collision results in coalescence and correction factor is equal to 1, γ=1. For the particles with moisture content (X) smaller than the critical moisture content (Xcr), additionally, the condition of critical velocity was checked, Ho and Sommerfeld (2002).
Agglomeration occurs when the relative velocity of col-liding particles does not exceed the critical value, then γ=1. For particles with moisture content lower and relative veloc-ity higher than critical, the agglomeration correction factor is calculated from: γ=X/Xcr. The probability of agglomera-tion increases when the dry particle returns to the atomiza-tion zone and collides with wet particles.
The mechanism of agglomeration proposed above, Jaskul-ski et al. (2015) is known, intuitive and accepted. To verify the proposed model of agglomeration, CFD model of coun-ter-current spray drying process was developed and com-pared with experimental data obtained in a pilot-plant spray drying tower, Piatkowski (2011).
Figure 16 shows a comparison of Sauter mean diameters of particles at different heights of the drying tower obtained from the CFD simulations and experimental data from PDA measurements for different initial process parameters and same distance of the nozzle from air inlets, 4.7 m. Sig-nificant increase of the average particle diameters due to agglomeration towards the air inlets is observed. Fine and dry fractions are entrained above the atomizing nozzle but do not agglomerate as the lower moisture content hampers the formation of liquid bridges between the particles during collisions.
In the next step the proposed model of coalescence and
agglomeration was applied for counter-current spray drying in the industrial tower, see Figure 10.
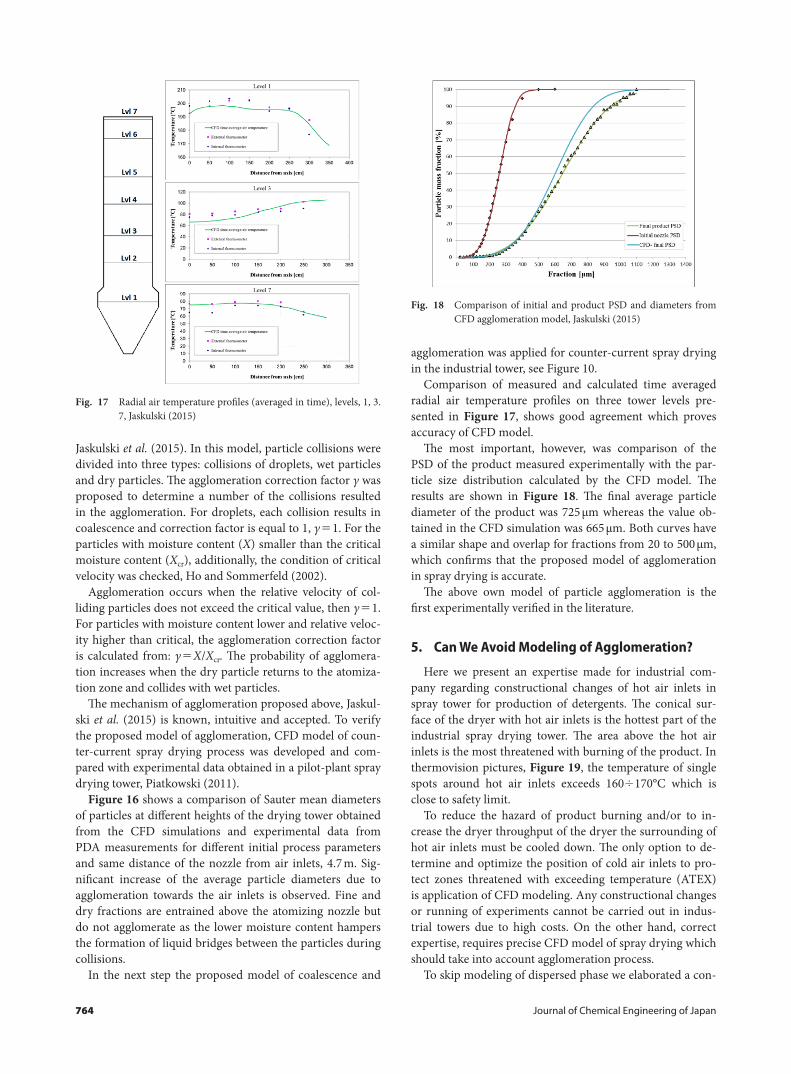
Comparison of measured and calculated time averaged radial air temperature profiles on three tower levels pre-sented in Figure 17, shows good agreement which proves accuracy of CFD model.
The most important, however, was comparison of the PSD of the product measured experimentally with the par-ticle size distribution calculated by the CFD model. The results are shown in Figure 18. The final average particle diameter of the product was 725 µm whereas the value ob-tained in the CFD simulation was 665 µm. Both curves have a similar shape and overlap for fractions from 20 to 500 µm, which confirms that the proposed model of agglomeration in spray drying is accurate.
The above own model of particle agglomeration is the first experimentally verified in the literature.
5. Can We Avoid Modeling of Agglomeration?
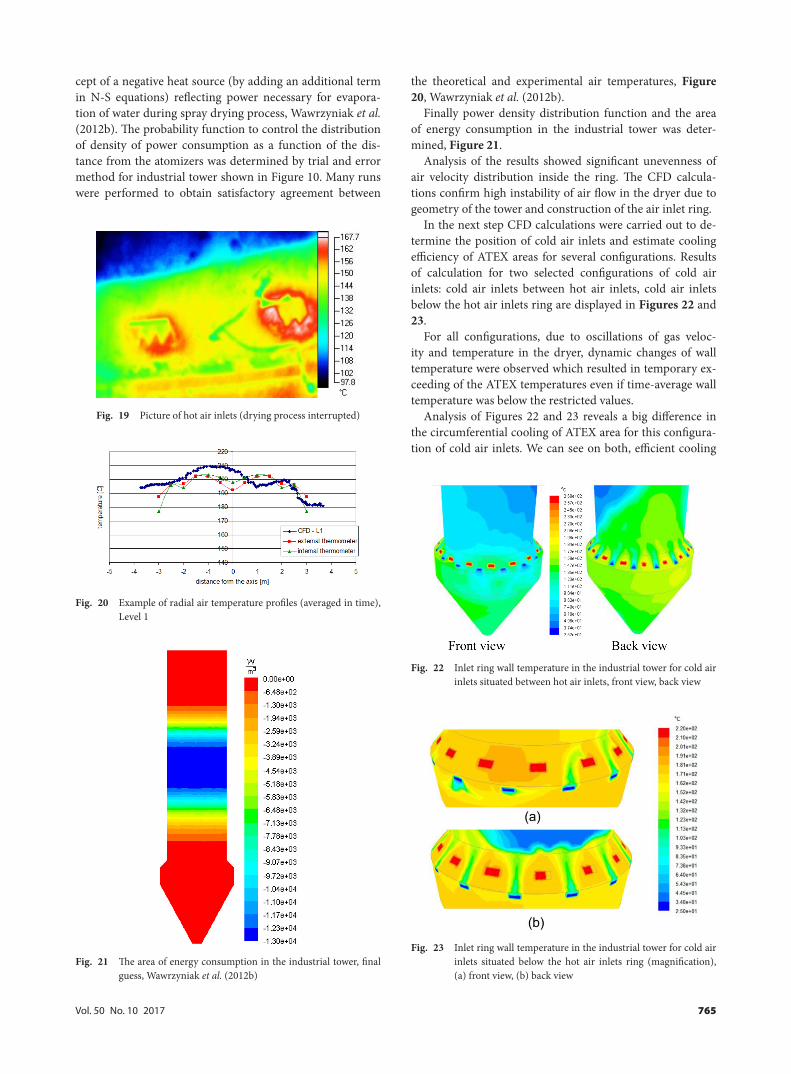
Here we present an expertise made for industrial com-pany regarding constructional changes of hot air inlets in spray tower for production of detergents. The conical sur-face of the dryer with hot air inlets is the hottest part of the industrial spray drying tower. The area above the hot air inlets is the most threatened with burning of the product. In thermovision pictures, Figure 19, the temperature of single spots around hot air inlets exceeds 160÷170°C which is close to safety limit.
To reduce the hazard of product burning and/or to in-crease the dryer throughput of the dryer the surrounding of hot air inlets must be cooled down. The only option to de-termine and optimize the position of cold air inlets to pro-tect zones threatened with exceeding temperature (ATEX) is application of CFD modeling. Any constructional changes or running of experiments cannot be carried out in indus-trial towers due to high costs. On the other hand, correct expertise, requires precise CFD model of spray drying which should take into account agglomeration process.
To skip modeling of dispersed phase we elaborated a con-
Fig. 17 Radial air temperature profiles (averaged in time), levels, 1, 3. 7, Jaskulski (2015)
Fig. 18 Comparison of initial and product PSD and diameters from CFD agglomeration model, Jaskulski (2015)
Vol. 50 No. 10 2017 765
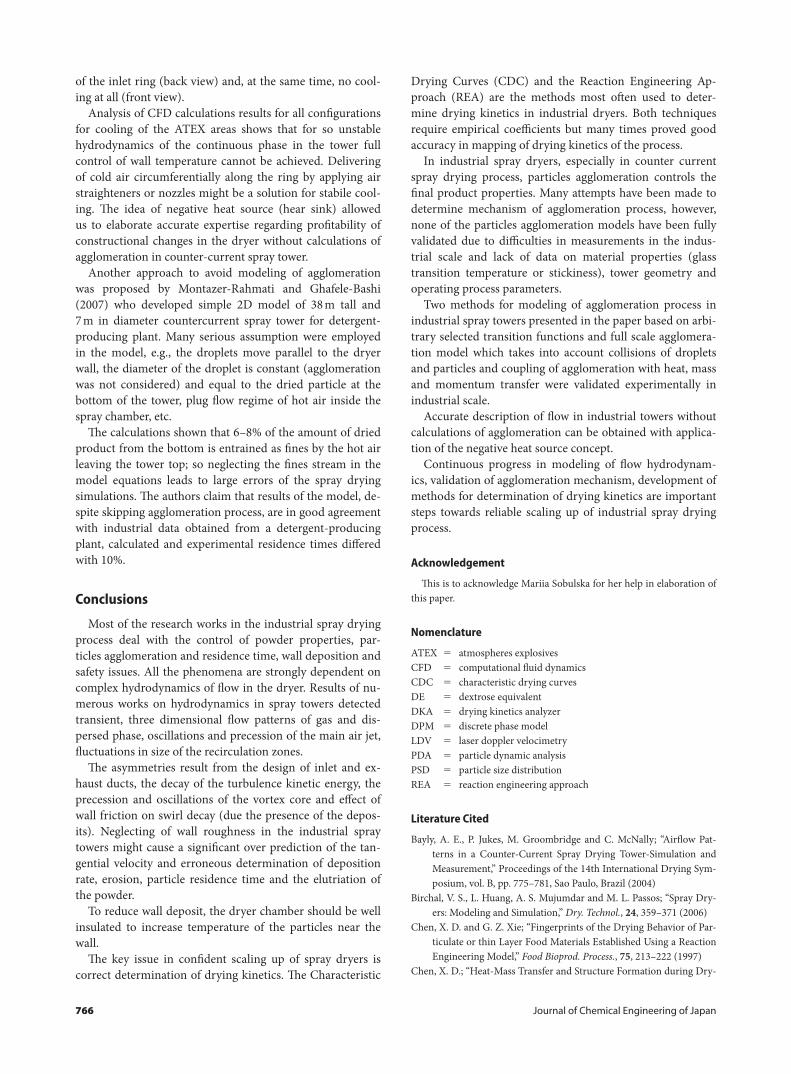
cept of a negative heat source (by adding an additional term in N-S equations) reflecting power necessary for evapora-tion of water during spray drying process, Wawrzyniak et al. (2012b). The probability function to control the distribution of density of power consumption as a function of the dis-tance from the atomizers was determined by trial and error method for industrial tower shown in Figure 10. Many runs were performed to obtain satisfactory agreement between
the theoretical and experimental air temperatures, Figure 20, Wawrzyniak et al. (2012b).
Finally power density distribution function and the area of energy consumption in the industrial tower was deter-mined, Figure 21.
Analysis of the results showed significant unevenness of air velocity distribution inside the ring. The CFD calcula-tions confirm high instability of air flow in the dryer due to geometry of the tower and construction of the air inlet ring.
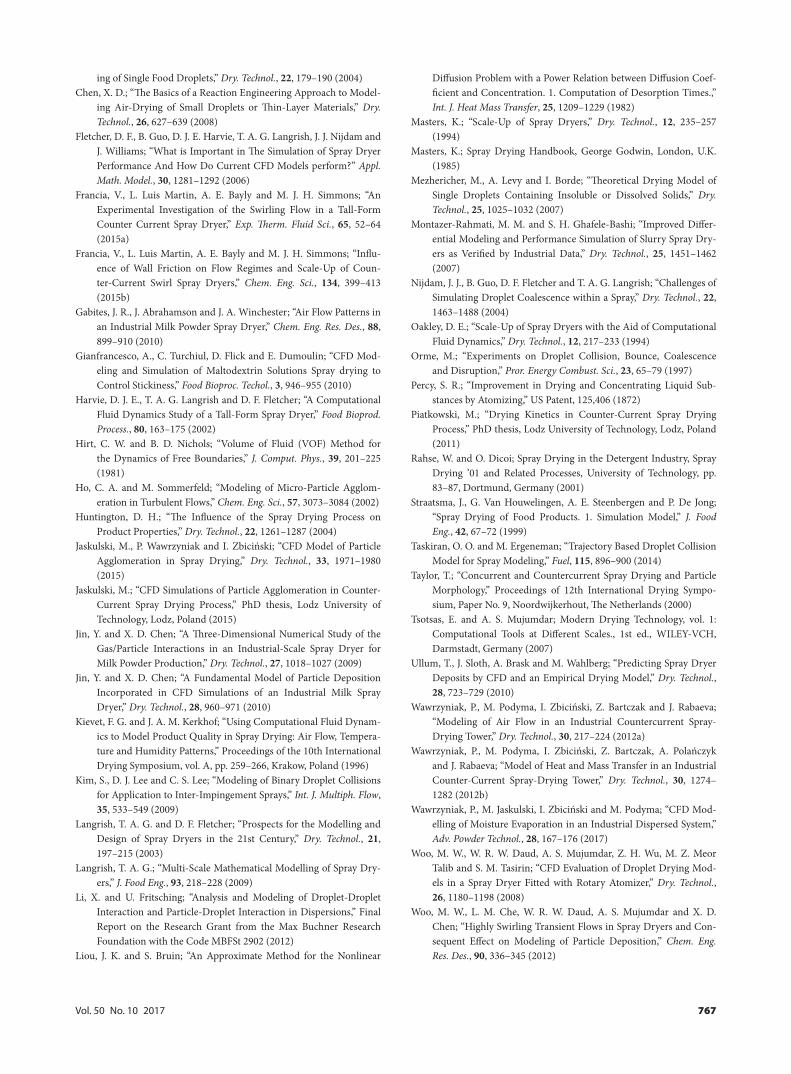
In the next step CFD calculations were carried out to de-termine the position of cold air inlets and estimate cooling efficiency of ATEX areas for several configurations. Results of calculation for two selected configurations of cold air inlets: cold air inlets between hot air inlets, cold air inlets below the hot air inlets ring are displayed in Figures 22 and 23.
For all configurations, due to oscillations of gas veloc-ity and temperature in the dryer, dynamic changes of wall temperature were observed which resulted in temporary ex-ceeding of the ATEX temperatures even if time-average wall temperature was below the restricted values.
Analysis of Figures 22 and 23 reveals a big difference in the circumferential cooling of ATEX area for this configura-tion of cold air inlets. We can see on both, efficient cooling
Fig. 19 Picture of hot air inlets (drying process interrupted)
Fig. 20 Example of radial air temperature profiles (averaged in time), Level 1
Fig. 21 The area of energy consumption in the industrial tower, final guess, Wawrzyniak et al. (2012b)
Fig. 22 Inlet ring wall temperature in the industrial tower for cold air inlets situated between hot air inlets, front view, back view
Fig. 23 Inlet ring wall temperature in the industrial tower for cold air inlets situated below the hot air inlets ring (magnification), (a) front view, (b) back view
766 Journal of Chemical Engineering of Japan
of the inlet ring (back view) and, at the same time, no cool-ing at all (front view).
Analysis of CFD calculations results for all configurations for cooling of the ATEX areas shows that for so unstable hydrodynamics of the continuous phase in the tower full control of wall temperature cannot be achieved. Delivering of cold air circumferentially along the ring by applying air straighteners or nozzles might be a solution for stabile cool-ing. The idea of negative heat source (hear sink) allowed us to elaborate accurate expertise regarding profitability of constructional changes in the dryer without calculations of agglomeration in counter-current spray tower.
Another approach to avoid modeling of agglomeration was proposed by Montazer-Rahmati and Ghafele-Bashi (2007) who developed simple 2D model of 38 m tall and 7 m in diameter countercurrent spray tower for detergent-producing plant. Many serious assumption were employed in the model, e.g., the droplets move parallel to the dryer wall, the diameter of the droplet is constant (agglomeration was not considered) and equal to the dried particle at the bottom of the tower, plug flow regime of hot air inside the spray chamber, etc.
The calculations shown that 6–8% of the amount of dried product from the bottom is entrained as fines by the hot air leaving the tower top; so neglecting the fines stream in the model equations leads to large errors of the spray drying simulations. The authors claim that results of the model, de-spite skipping agglomeration process, are in good agreement with industrial data obtained from a detergent-producing plant, calculated and experimental residence times differed with 10%.
Conclusions
Most of the research works in the industrial spray drying process deal with the control of powder properties, par-ticles agglomeration and residence time, wall deposition and safety issues. All the phenomena are strongly dependent on complex hydrodynamics of flow in the dryer. Results of nu-merous works on hydrodynamics in spray towers detected transient, three dimensional flow patterns of gas and dis-persed phase, oscillations and precession of the main air jet, fluctuations in size of the recirculation zones.
The asymmetries result from the design of inlet and ex-haust ducts, the decay of the turbulence kinetic energy, the precession and oscillations of the vortex core and effect of wall friction on swirl decay (due the presence of the depos-its). Neglecting of wall roughness in the industrial spray towers might cause a significant over prediction of the tan-gential velocity and erroneous determination of deposition rate, erosion, particle residence time and the elutriation of the powder.
To reduce wall deposit, the dryer chamber should be well insulated to increase temperature of the particles near the wall.
The key issue in confident scaling up of spray dryers is correct determination of drying kinetics. The Characteristic
Drying Curves (CDC) and the Reaction Engineering Ap-proach (REA) are the methods most often used to deter-mine drying kinetics in industrial dryers. Both techniques require empirical coefficients but many times proved good accuracy in mapping of drying kinetics of the process.
In industrial spray dryers, especially in counter current spray drying process, particles agglomeration controls the final product properties. Many attempts have been made to determine mechanism of agglomeration process, however, none of the particles agglomeration models have been fully validated due to difficulties in measurements in the indus-trial scale and lack of data on material properties (glass transition temperature or stickiness), tower geometry and operating process parameters.
Two methods for modeling of agglomeration process in industrial spray towers presented in the paper based on arbi-trary selected transition functions and full scale agglomera-tion model which takes into account collisions of droplets and particles and coupling of agglomeration with heat, mass and momentum transfer were validated experimentally in industrial scale.
Accurate description of flow in industrial towers without calculations of agglomeration can be obtained with applica-tion of the negative heat source concept.
Continuous progress in modeling of flow hydrodynam-ics, validation of agglomeration mechanism, development of methods for determination of drying kinetics are important steps towards reliable scaling up of industrial spray drying process.
Acknowledgement
This is to acknowledge Mariia Sobulska for her help in elaboration of this paper.
Bayly, A. E., P. Jukes, M. Groombridge and C. McNally; “Airflow Pat-terns in a Counter-Current Spray Drying Tower-Simulation and Measurement,” Proceedings of the 14th International Drying Sym-posium, vol. B, pp. 775–781, Sao Paulo, Brazil (2004)
Birchal, V. S., L. Huang, A. S. Mujumdar and M. L. Passos; “Spray Dry-ers: Modeling and Simulation,” Dry. Technol., 24, 359–371 (2006)
Chen, X. D. and G. Z. Xie; “Fingerprints of the Drying Behavior of Par-ticulate or thin Layer Food Materials Established Using a Reaction Engineering Model,” Food Bioprod. Process., 75, 213–222 (1997)
Chen, X. D.; “Heat-Mass Transfer and Structure Formation during Dry-
ing of Single Food Droplets,” Dry. Technol., 22, 179–190 (2004)Chen, X. D.; “The Basics of a Reaction Engineering Approach to Model-
ing Air-Drying of Small Droplets or Thin-Layer Materials,” Dry. Technol., 26, 627–639 (2008)
Fletcher, D. F., B. Guo, D. J. E. Harvie, T. A. G. Langrish, J. J. Nijdam and J. Williams; “What is Important in The Simulation of Spray Dryer Performance And How Do Current CFD Models perform?” Appl. Math. Model., 30, 1281–1292 (2006)
Francia, V., L. Luis Martin, A. E. Bayly and M. J. H. Simmons; “An Experimental Investigation of the Swirling Flow in a Tall-Form Counter Current Spray Dryer,” Exp. �erm. Fluid Sci., 65, 52–64 (2015a)
Francia, V., L. Luis Martin, A. E. Bayly and M. J. H. Simmons; “Influ-ence of Wall Friction on Flow Regimes and Scale-Up of Coun-ter-Current Swirl Spray Dryers,” Chem. Eng. Sci., 134, 399–413 (2015b)
Gabites, J. R., J. Abrahamson and J. A. Winchester; “Air Flow Patterns in an Industrial Milk Powder Spray Dryer,” Chem. Eng. Res. Des., 88, 899–910 (2010)
Gianfrancesco, A., C. Turchiul, D. Flick and E. Dumoulin; “CFD Mod-eling and Simulation of Maltodextrin Solutions Spray drying to Control Stickiness,” Food Bioproc. Techol., 3, 946–955 (2010)
Harvie, D. J. E., T. A. G. Langrish and D. F. Fletcher; “A Computational Fluid Dynamics Study of a Tall-Form Spray Dryer,” Food Bioprod. Process., 80, 163–175 (2002)
Hirt, C. W. and B. D. Nichols; “Volume of Fluid (VOF) Method for the Dynamics of Free Boundaries,” J. Comput. Phys., 39, 201–225 (1981)
Ho, C. A. and M. Sommerfeld; “Modeling of Micro-Particle Agglom-eration in Turbulent Flows,” Chem. Eng. Sci., 57, 3073–3084 (2002)
Huntington, D. H.; “The Influence of the Spray Drying Process on Product Properties,” Dry. Technol., 22, 1261–1287 (2004)
Jaskulski, M., P. Wawrzyniak and I. Zbiciński; “CFD Model of Particle Agglomeration in Spray Drying,” Dry. Technol., 33, 1971–1980 (2015)
Jaskulski, M.; “CFD Simulations of Particle Agglomeration in Counter-Current Spray Drying Process,” PhD thesis, Lodz University of Technology, Lodz, Poland (2015)
Jin, Y. and X. D. Chen; “A Three-Dimensional Numerical Study of the Gas/Particle Interactions in an Industrial-Scale Spray Dryer for Milk Powder Production,” Dry. Technol., 27, 1018–1027 (2009)
Jin, Y. and X. D. Chen; “A Fundamental Model of Particle Deposition Incorporated in CFD Simulations of an Industrial Milk Spray Dryer,” Dry. Technol., 28, 960–971 (2010)
Kievet, F. G. and J. A. M. Kerkhof; “Using Computational Fluid Dynam-ics to Model Product Quality in Spray Drying: Air Flow, Tempera-ture and Humidity Patterns,” Proceedings of the 10th International Drying Symposium, vol. A, pp. 259–266, Krakow, Poland (1996)
Kim, S., D. J. Lee and C. S. Lee; “Modeling of Binary Droplet Collisions for Application to Inter-Impingement Sprays,” Int. J. Multiph. Flow, 35, 533–549 (2009)
Langrish, T. A. G. and D. F. Fletcher; “Prospects for the Modelling and Design of Spray Dryers in the 21st Century,” Dry. Technol., 21, 197–215 (2003)
Langrish, T. A. G.; “Multi-Scale Mathematical Modelling of Spray Dry-ers,” J. Food Eng., 93, 218–228 (2009)
Li, X. and U. Fritsching; “Analysis and Modeling of Droplet-Droplet Interaction and Particle-Droplet Interaction in Dispersions,” Final Report on the Research Grant from the Max Buchner Research Foundation with the Code MBFSt 2902 (2012)
Liou, J. K. and S. Bruin; “An Approximate Method for the Nonlinear
Diffusion Problem with a Power Relation between Diffusion Coef-ficient and Concentration. 1. Computation of Desorption Times.,” Int. J. Heat Mass Transfer, 25, 1209–1229 (1982)
Masters, K.; Spray Drying Handbook, George Godwin, London, U.K. (1985)
Mezhericher, M., A. Levy and I. Borde; “Theoretical Drying Model of Single Droplets Containing Insoluble or Dissolved Solids,” Dry. Technol., 25, 1025–1032 (2007)
Montazer-Rahmati, M. M. and S. H. Ghafele-Bashi; “Improved Differ-ential Modeling and Performance Simulation of Slurry Spray Dry-ers as Verified by Industrial Data,” Dry. Technol., 25, 1451–1462 (2007)
Nijdam, J. J., B. Guo, D. F. Fletcher and T. A. G. Langrish; “Challenges of Simulating Droplet Coalescence within a Spray,” Dry. Technol., 22, 1463–1488 (2004)
Oakley, D. E.; “Scale-Up of Spray Dryers with the Aid of Computational Fluid Dynamics,” Dry. Technol., 12, 217–233 (1994)
Orme, M.; “Experiments on Droplet Collision, Bounce, Coalescence and Disruption,” Pror. Energy Combust. Sci., 23, 65–79 (1997)
Percy, S. R.; “Improvement in Drying and Concentrating Liquid Sub-stances by Atomizing,” US Patent, 125,406 (1872)
Piatkowski, M.; “Drying Kinetics in Counter-Current Spray Drying Process,” PhD thesis, Lodz University of Technology, Lodz, Poland (2011)
Rahse, W. and O. Dicoi; Spray Drying in the Detergent Industry, Spray Drying ’01 and Related Processes, University of Technology, pp. 83–87, Dortmund, Germany (2001)
Straatsma, J., G. Van Houwelingen, A. E. Steenbergen and P. De Jong; “Spray Drying of Food Products. 1. Simulation Model,” J. Food Eng., 42, 67–72 (1999)
Taskiran, O. O. and M. Ergeneman; “Trajectory Based Droplet Collision Model for Spray Modeling,” Fuel, 115, 896–900 (2014)
Taylor, T.; “Concurrent and Countercurrent Spray Drying and Particle Morphology,” Proceedings of 12th International Drying Sympo-sium, Paper No. 9, Noordwijkerhout, The Netherlands (2000)
Tsotsas, E. and A. S. Mujumdar; Modern Drying Technology, vol. 1: Computational Tools at Different Scales., 1st ed., WILEY-VCH, Darmstadt, Germany (2007)
Ullum, T., J. Sloth, A. Brask and M. Wahlberg; “Predicting Spray Dryer Deposits by CFD and an Empirical Drying Model,” Dry. Technol., 28, 723–729 (2010)
Wawrzyniak, P., M. Podyma, I. Zbiciński, Z. Bartczak and J. Rabaeva; “Modeling of Air Flow in an Industrial Countercurrent Spray-Drying Tower,” Dry. Technol., 30, 217–224 (2012a)
Wawrzyniak, P., M. Podyma, I. Zbiciński, Z. Bartczak, A. Polańczyk and J. Rabaeva; “Model of Heat and Mass Transfer in an Industrial Counter-Current Spray-Drying Tower,” Dry. Technol., 30, 1274–1282 (2012b)
Wawrzyniak, P., M. Jaskulski, I. Zbiciński and M. Podyma; “CFD Mod-elling of Moisture Evaporation in an Industrial Dispersed System,” Adv. Powder Technol., 28, 167–176 (2017)
Woo, M. W., W. R. W. Daud, A. S. Mujumdar, Z. H. Wu, M. Z. Meor Talib and S. M. Tasirin; “CFD Evaluation of Droplet Drying Mod-els in a Spray Dryer Fitted with Rotary Atomizer,” Dry. Technol., 26, 1180–1198 (2008)
Woo, M. W., L. M. Che, W. R. W. Daud, A. S. Mujumdar and X. D. Chen; “Highly Swirling Transient Flows in Spray Dryers and Con-sequent Effect on Modeling of Particle Deposition,” Chem. Eng. Res. Des., 90, 336–345 (2012)