MODELING AND SIMULATION EVAPORATION OF SILICON AS THE BASIS FOR ITS SUBLIMATION PURIFICATION 1 V.P. Malyshev, 2 N.S. Bekturganov, 3 AM. Turdukozhayeva, 3 M.Zh. Tolymbekov, 3 S.V. Kim 1 Abishev Chemical-Metallurgical Institute, Karaganda, Republic of Kazakhstan 2 JSC ''National Scientific and Technological Holding "Parasat", Astana, Republic of Kazakhstan 3 Abishev Chemical-Metallurgical Institute, Karaganda, Republic of Kazakhstan e-mails: eia _ [email protected], [email protected]kz ABSTRACT The best way to deep-clean impurities from the silicon can he sublimated into its elementary form. This is an urgent need for a detailed analysis of available data on the volatility of this element. On the basis of harmonized data on the heat and the boiling temperature to the temperature dependence of saturated vapor pressure patterns are evaporation of silicon, iron, aluminum, calcium, titanium and boron in the range from the melting point to the boiling point of silicon. Conversion of the saturated vapor pressure on the partial pressure in line with the mole fractions of all elements of the melt revealed a range of temperatures and residual pressure, at which a preferential stripping of calcium and aluminum, to a lesser extent as compared to silicon. The remaining impurities - iron, titanium and boron - can not be removed by sublimation with a decrease in their content in the melt under any circumstances. Refining silicon sublimation it is possible at temperatures above 2600 °C at a residual pressure of not less than I 00 mm Hg. by the highest partial vapor pressure of silicon in comparison with all the impurities in the range of temperatures and pressures, and the excess pressure of vapor over the residual given by, in view of what conditions will he created by boiling evaporation priority. 1. INTRODUCTION The best way to deep-clean silicon from the impurities can be sublimated into its elementary form. However, this is quite an expensive operation, since silicon is a refractory and high-boiling substances with the achievement of the atmospheric vapor pressure at a temperature of about 3500 K. In this regard the prospect of receiving the vacuum sublimation method under which the process temperature can be significantly reduced. In turn, this raises the urgent need for a detailed analysis of available data on the volatility of this element, which, unfortunately, different contradictions. In this case it is advisable to use separate data on evaporation of silicon not by themselves, but on the basis of their agreement with the closely related thermal characteristics, such as heat and the melting temperature (Mfm and Tm), heat and the boiling temperature (Mfb and Tb)· This method was developed by the authors of the concept of randomized particles [1-3]. With sufficient accuracy it takes into account only the relationship of heat and the boiling temperature to the temperature dependence of the equilibrium vapor pressure ofp = j{T). 1.1. Approval AHb, Th and p = f(T) for silicon The analytical review An.N. Nesmeyanov [4] noted that of the five works on the measurement of vapor pressure of silicon [5-9] only one [5] is recognized as a reliable implementation of the The thirteenth International Ferroalloys Congress Efficient technologies in ferroalloy industry 833 June 9 - 13, 2013 Almaty, Kazakhstan
Transcript
MODELING AND SIMULATION
EVAPORATION OF SILICON AS THE BASIS FOR ITS SUBLIMATION PURIFICATION
1 Abishev Chemical-Metallurgical Institute, Karaganda, Republic of Kazakhstan 2 JSC ''National Scientific and Technological Holding "Parasat", Astana, Republic of Kazakhstan
The best way to deep-clean impurities from the silicon can he sublimated into its elementary form. This is an urgent need for a detailed analysis of available data on the volatility of this element.
On the basis of harmonized data on the heat and the boiling temperature to the temperature dependence of saturated vapor pressure patterns are evaporation of silicon, iron, aluminum, calcium, titanium and boron in the range from the melting point to the boiling point of silicon.
Conversion of the saturated vapor pressure on the partial pressure in line with the mole fractions of all elements of the melt revealed a range of temperatures and residual pressure, at which a preferential stripping of calcium and aluminum, to a lesser extent as compared to silicon. The remaining impurities - iron, titanium and boron - can not be removed by sublimation with a decrease in their content in the melt under any circumstances.
Refining silicon sublimation it is possible at temperatures above 2600 °C at a residual pressure of not less than I 00 mm Hg. by the highest partial vapor pressure of silicon in comparison with all the impurities in the range of temperatures and pressures, and the excess pressure of vapor over the residual given by, in view of what conditions will he created by boiling evaporation priority.
1. INTRODUCTION
The best way to deep-clean silicon from the impurities can be sublimated into its elementary form. However, this is quite an expensive operation, since silicon is a refractory and high-boiling substances with the achievement of the atmospheric vapor pressure at a temperature of about 3500 K. In this regard the prospect of receiving the vacuum sublimation method under which the process temperature can be significantly reduced. In turn, this raises the urgent need for a detailed analysis of available data on the volatility of this element, which, unfortunately, different contradictions.
In this case it is advisable to use separate data on evaporation of silicon not by themselves, but on the basis of their agreement with the closely related thermal characteristics, such as heat and the melting temperature (Mfm and Tm), heat and the boiling temperature (Mfb and Tb)· This method was developed by the authors of the concept of randomized particles [1-3]. With sufficient accuracy it takes into account only the relationship of heat and the boiling temperature to the temperature dependence of the equilibrium vapor pressure ofp = j{T).
1.1. Approval AHb, Th and p = f(T) for silicon
The analytical review An.N. Nesmeyanov [4] noted that of the five works on the measurement of vapor pressure of silicon [5-9] only one [5] is recognized as a reliable implementation of the
The thirteenth International Ferroalloys Congress Efficient technologies in ferroalloy industry
833
June 9 - 13, 2013 Almaty, Kazakhstan
MODELING AND SIMULATION
most modern version of the integral effusion method, and only for the solid state. It is important to specify in [8], which used mass spectrometric identification of the vapor of silicon, the fact that in a vapour of silicon monatomic molecules contain two orders of magnitude larger than the molecules Si2-Sh On this basis, all further calculations treat of silicon monatomic vapour.
In reference [10] in 2003 with the publication of data [5] for silicon are Tm = 1688 K, Tb =
3522 K, Mlb = 385 031 J/mol According to these characteristics in an earlier reference [11] (1965 ed.) Shows the values of Tm = 1683 K, Tb = 2750 K, Mlb = 297 OOO J/mol, indicating a large difference of temperature and heat of boiling. In modem ruPAC table of the periodic table contains the values for silicon, Tm= 1685 K, Tb= 2628 K [12]. The book V.A. Kireev [13] devoted to the particular mutual agreement of the thermodynamic data, recommended values of Tm= 1685 K, Tb= 3540 K. Finally, in most major chemical handbook 2005 edition [14] the melting and boiling points of silicon 1687 and 3538 K, confirming the reliability of the determination of the melting temperature, but not boiling, requiring, as the heat of boiling, clarification and agreement with the data on the vapor pressure of silicon at various temperatures. However, these data are given in reference [10] with full borrowing from the first edition in 1985, causing some doubts:
T,K
p,Pa
1000 1200 1400 1600 1800
181·10-12 205·10"8 1 59·10"5 2 31·10"3 0 8·10"3
' ' ' ' '
2000 1,4
2400
13,1·10
2400 2600 2800
8,4·10 4,02·102 15,3·103
As for the two repeated temperature 2400 K, it is an obvious typographical error, since the early edition instead of the first specified temperature of 2200 K as an intermediate between 2000 and 2400 K. However, even with the correction of typographical data on the vapor pressure with increasing temperature show a violation of the laws necessary for their increase. Thus, the transition temperature from 1600 to 1800 K is obtained by reducing the pressure of 2,31-10-3 to 0,8·10-3 Pa. Strange looks and recording the second number when providing it with an indication of the order (should have been 8·104 ?). This applies to the strangeness of the pressure at 2200 K (instead of 2400 K) as 13,1·10 (would have to l,31-la2?). In addition, the transition to 2400 K, the pressure decreases again (?). Finally, the last recorded pressure again is incorrect. This is caused by the need for prior identification of false positives by placing them in the coordinates lnp - 1/T with the approximation to the straight-line relationship (figure 1 ).
It also presents data from [9]:
T,K p,Pa
1485 0,191
1493 0,200
1513 0,280
1523 0,350
1533 0,352
1555 0,579
1575 0,891
1593 1,344
The figure clearly noticeable separation of the data [10] and [9], and if the second change monotonically, but very crowded, the first, following the general rectilinear layout, in its hightemperature part (in the liquid state) show a strong scatter of points with a violation monotony of their change with temperature variations. This violation is particularly true for two points, T = 2400 K,p = 84 Pa and T= 1800 K,p = 8·104 Pa, but it also is true for others. Based on this data [10] can not be considered reliable in the liquid state, except for the point at 2000 K, since it is least likely to deviate from the linear dependence in the coordinates hyJ - 1/T. This point data for the solid state [10] for the same reason we use for the approval procedure Mlb, Tb and p = fl..1), described in detail in [3].
The basis of this procedure on the relationship, which is obtained by identifying the functions of the normalized to the saturated vapor pressure, and the share ofvapor-mobile particles, which are a source of steam in the condensed state, as established in the concept of randomized particles on the basis of the Boltzmann distribution:
The thirteenth International Ferroalloys Congress Efficient technologies in ferroalloy industry
834
June 9 - 13, 2013 Almaty, Kazakhstan
MODELING AND SIMULATION
where 101325 -the standard atmospheric pressure, Pa (1 atm); R - universal gas constant.
10 x
lnp '\I!·-~<. .. ,
0
03
-10
-20
-30
0,9
p-vapor pressure, Pa, T-temperature, K. The points- according to [9], crosses - at [10]. The dashed line - linear approximation of graphical data [10]
Figure 1: Dependence of the reference data for the saturated vapor pressure of silicon on the temperature
(1)
Treatment variables Mlb and Tb with respect to p can be achieved by solving two equations with two unknowns for each pair of values of Ti, Pi and Ti+ I, Pi+ I to find the corresponding values Mlbjand Tb/
(2)
T. = T. 1 + R~ 1n P; ( J-1
cy I Mlcy 101325 (3)
with subsequent averaging. The results of the negotiation procedures are given in table 1. The average value of the boiling heat with the rules of rounding was Mlb=(455 OOO± 19 300)
J/mol and the relative error± 4.2 %, while the average boiling point Tb= (3304 ± 165) K with an error of 5.0 %, what is acceptable for high-definition. It should be noted that direct calorimetric studies of heat boiling at temperatures above 3000 K is almost impossible, and all received so far Mlb values were estimated for silicon.
The obtained value of Mlb within the proposed model, based on consultation with a boiling point Tb ensures strict achieve atmospheric pressure boiling point. This value is Mlb is much higher
The thirteenth International Ferroalloys Congress Efficient technologies in ferroalloy industry
835
June 9 - 13, 2013 Almaty, Kazakhstan
MODELING AND SIMULATION
given previously in the literature and, of course, subject to review based on a more rigorous experimental data on the temperature dependence of vapor pressure in the region close to the boiling point. However, the available data is obtained is a value of Mlb.
Table 1: Determination of heat and the boiling point of silicon to the negotiation procedures of the data on the vapor pressure [10]
j 1), K Pi, Pa j -(i + 1) Mlb1' J/mol Tbj,K
1 1000 1,81·10"12 1-2 465683 3210
2 1200 2,05·10..c! 2-3 464698 3222
3 1400 1,59·10-s 3-4 463622 3232
4 1600 2 31·10"3
' 4-5 426162 3550
5 2000 1,4
With regard to the boiling point, determined in the experiment is always more strictly than the boiling heat, then its value is found (3304 K) is intermediate between the known (3522 K [10], 2750 K [11], 2628 K [12], 3540 K [ 13], and 3538 K [14]), which confirms the validity of agreed with her boiling heat 455000 J/mol. This allows us to introduce the obtained values of Mlb and Tb in the proposed model (1):
=101325ex 455000{l- 3304/ T) =101325ex [16 563(1-3304/T)~ p p 831441·3304 p ' ~ (4)
'
For comparison, we give approximated in [4] and duplicated in [11] (with a little typo in the third coefficient of the second equation, are eliminated) dependence of the equilibrium vapor pressure on temperature for the solid and liquid states:
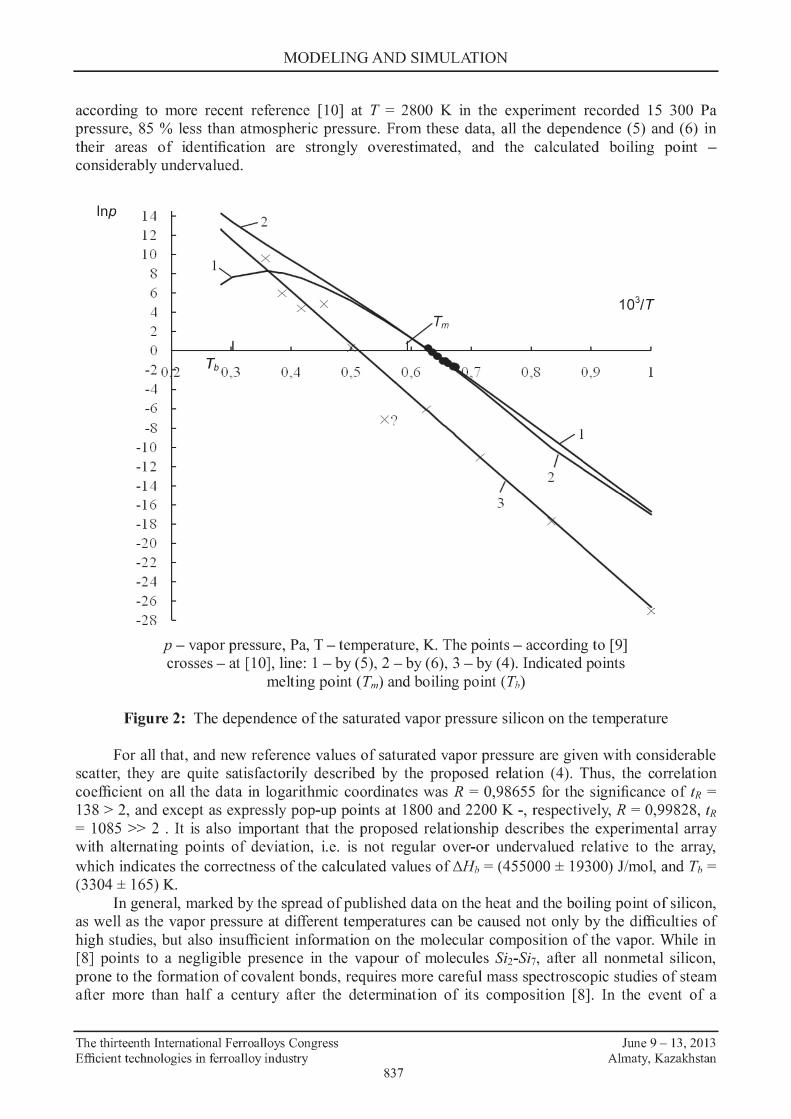
The results of comparative calculations in comparison with reference data given in table 2 and figure 2.
The table and figure should be the closeness smoothing relationships (5) and (6) for solid and liquid silicon data [9], for which they are likely to, and forming. But this proximity applies only to a narrow interval of the experimentally investigated temperature range, below and above which they diverge markedly depending.
Thus, the dependence of the solid state (5) when extrapolated to the region of the liquid state up to the boiling temperature does not exceed 4000 Pa (0,04 atm) and even undergoing extremity at 2800 K with a further decrease absurd. This is generally a negative dependency property, expressed as a transcendental polynomials with adjustable coefficients of arbitrary sign.
The dependence of the liquid state ( 6), on the contrary, in the boiling point of rushes in the improbably high value of the equilibrium vapor pressure, reaching at Tb = 3304 K p = 631 120 Pa (- 6 atm) and at T= 3540 Kp = 1643000 Pa (- 16 atm). Characteristically, in reference [11], which are equations (5) and (6), indicated the boiling point Tb = 2750 K, is not consistent with the dependence (6) with p = 101325 Pa (1 atm). Numerical solution of (6) found for the standard pressure value of Tb = 2891 K, which is 141 K higher than given in reference [ 11]. Moreover,
The thirteenth International Ferroalloys Congress Efficient technologies in ferroalloy industry
836
June 9 - 13, 2013 Almaty, Kazakhstan
MODELING AND SIMULATION
according to more recent reference [10] at T = 2800 K in the experiment recorded 15 300 Pa pressure, 85 % less than atmospheric pressure. From these data, all the dependence (5) and (6) in their areas of identification are strongly overestimated, and the calculated boiling point -considerably undervalued.
lnp 14 12
10
8 1
6 4 2 0
-2 0 2 -4 -6
-8 -1 0 -1 2 -1 4 -1 6 -1 8 -20 -22 -24 -26 -28
p - vapor pressure, Pa, T - temperature, K. The points - according to [9] crosses- at [10], line: 1 - by (5), 2 - by (6), 3-by (4). Indicated points
melting point (Tm) and boiling point (Tb)
Figure 2: The dependence of the saturated vapor pressure silicon on the temperature
For all that, and new reference values of saturated vapor pressure are given with considerable scatter, they are quite satisfactorily described by the proposed relation ( 4). Thus, the correlation coefficient on all the data in logarithmic coordinates was R = 0,98655 for the significance of IR = 138 > 2, and except as expressly pop-up points at 1800 and 2200 K -, respectively, R = 0,99828, IR = 1085 >> 2 . It is also important that the proposed relationship describes the experimental array with alternating points of deviation, ie. is not regular over-or undervalued relative to the array, which indicates the correctness of the calculated values of Aflb = (455000 ± 19300) J/mo~ and Tb= (3304 ± 165) K.
In genera~ marked by the spread of published data on the heat and the boiling point of silicon, as well as the vapor pressure at different temperatures can be caused not only by the difficulties of high studies, but also insufficient information on the molecular composition of the vapor. While in [8] points to a negligible presence in the vapour of molecules Sii-Si7, after all nonmetal silicon, prone to the formation of covalent bonds, requires more careful mass spectroscopic studies of steam after more than half a century after the determination of its composition [8]. In the event of a
The thirteenth International Ferroalloys Congress Efficient technologies in ferroalloy industry
837
June 9 - 13, 2013 Almaty, Kazakhstan
MODELING AND SIMULATION
significant content of polyatomic molecules in a vapour of conversion or other calorimetric results per mole of the mass of the test substance will inevitably be underestimated due to inclusion of the condensed state only to the mass of monatomic element. Accounting for a vapour of the same composition, with such a mass of the sample is difficult due to the change of composition with increasing temperature, especially in inaccessible areas of boiling under standard conditions. In addition, the vapor composition is strongly dependent on the kinetic conditions of the experiment and requires an approximate extrapolation to an equilibrium state.
Table 2: Comparison of experimental [9, 10] and calculated according to equations (4), (5), (6) the values of the saturated vapor pressure of silicon, Pa
T,K Pr:n. P..,1, (5} Pia (6) p (4) 1000 l,81·10-12 flOl 5,50·10-8 4,03·10-8 2,71·10-12
One way or another, but data on the vapor pressure of silicon [10], and hence of our proposed model (4) apply to the gross composition of the vapor and in this respect may be useful in solving practical problems in terms of direct sublimation treatment and refining to obtain high grades of silicon.
1.2. Initial data for the sublimation purification of silicon under vacuum or vapor in the pumping current of inert gas
For this purpose, the dependence (4), as well as the data in table 2 to this equation can be used directly with the release of the interval of acceptable temperature and pressure of saturated vapor of silicon, the temperature should not be too high, and the vapor pressure is not too low. The most
The thirteenth International Ferroalloys Congress Efficient technologies in ferroalloy industry
838
June 9 - 13, 2013 Almaty, Kazakhstan
MODELING AND SIMULATION
technically and technologically realistic enough to practice effective sublimation in vacuum or in inert gas are difficult to sublimate the vapor pressure of substances ranging from 1 to 100 mm Hg, capturing the range of sufficiently high vacuum to low pressure [15], which correspond to the pressure of 133.32 to 13332 Pa.
To calculate the required temperature in order to ensure a given equilibrium vapor pressure and, consequently, for the operation and installation of vacuum condensate chamber is sufficient to use the calculated dependence ( 1) with respect to its treatment temperature
where P - in Pasca~ T - in Kelvin.
( RT p )-
1
T=Tb l--bln--AHb 101325
(7)
For silicon, using the same data to construct the calculated dependence (4), we obtain
T = 3304(1 8•31441' 3304tn p )-
1
= 3304 (1-603754·10-2 ln p )-1
(8) 455000 101325 ' 101325
Table 3 and figure 3 shows the extended version of the above-mentioned range of operating pressures and temperatures calculated for silicon.
Table 3: Baseline data for the selection of the residual pressure in the sublimation cleaning of silicon
Underpressure Temperature Underpressure Temperature mm Pa atm K oc mm Pa atm K oc H2 H2 10-:> 1,33·10-3 1,32·10-8 1577 1304 15 2000 1,97·10-2 2671 2398 10-4 1,33·10-2 1,32·10-7 1689 1416 20 2666 2,63·10-2 2709 2436 10-3 0,133 1,32·10~ 1818 1545 25 3333 3,29·10-2 2739 2466 10-2 1,33 1 32·10·5
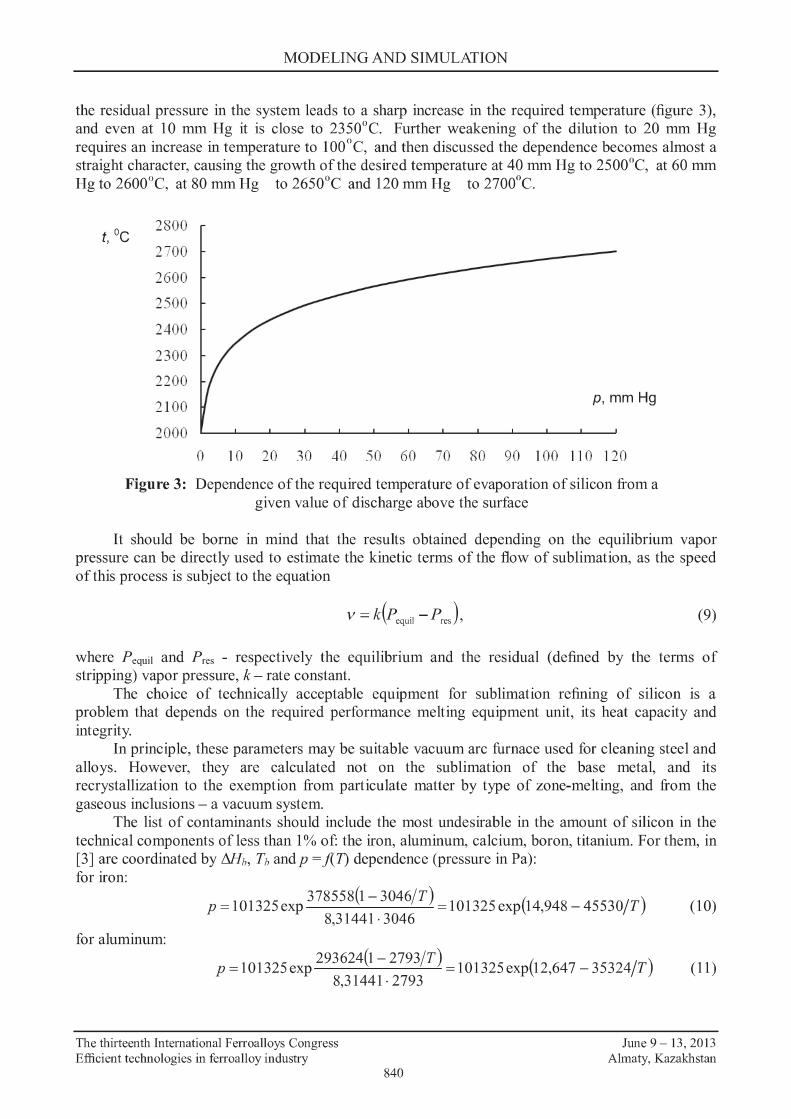
The table shows that the sublimation of silicon from the solid state are possible only in the pre-melting (Tm = 1414 °C) for p = 10-5-104 mm Hg, i.e. under high vacuum conditions. Increasing
The thirteenth International Ferroalloys Congress Efficient technologies in ferroalloy industry
839
June 9 - 13, 2013 Almaty, Kazakhstan
MODELING AND SIMULATION
the residual pressure in the system leads to a sharp increase in the required temperature (figure 3), and even at 10 mm Hg it is close to 2350°C. Further weakening of the dilution to 20 mm Hg requires an increase in temperature to I 00 ° C, and then discussed the dependence becomes almost a straight character, causing the growth of the desired temperature at 40 mm Hg to 2500°C, at 60 mm Hg to 2600°C, at 80 mm Hg to 2650°C and 120 mm Hg to 2700°C.
t 0c 2800 ' 2700
2600
2500
2400
2300
2200
2100 p, mm Hg
2000 0 l 0 20 ~O 40 :50 60 70 80 90 100 I I 0 120
Figure 3: Dependence of the required temperature of evaporation of silicon from a given value of discharge above the surface
It should be borne in mind that the results obtained depending on the equilibrium vapor pressure can be directly used to estimate the kinetic terms of the flow of sublimation, as the speed of this process is subject to the equation
(9)
where Pequil and Pres - respectively the equilibrium and the residual (defined by the terms of stripping) vapor pressure, k- rate constant.
The choice of technically acceptable equipment for sublimation refining of silicon is a problem that depends on the required performance melting equipment unit, its heat capacity and integrity.
In principle, these parameters may be suitable vacuum arc furnace used for cleaning steel and alloys. However, they are calculated not on the sublimation of the base metai and its recrystallization to the exemption from particulate matter by type of zone-melting, and from the gaseous inclusions - a vacuum system
The list of contaminants should include the most undesirable in the amount of silicon in the technical components of less than 1 % of: the iron, aluminum, calcium, boron, titanium. For them. in [3] are coordinated by Mlb, Tb and p = ./(1) dependence (pressure in Pa): for iron:
=101325ex 378558(1- 3046/ T) =101325ex (14948-45530/T) (10) p p 8,31441·3046 p '
for aluminum:
=101325ex 293624(1
- 2793/T) =101325ex (12 647-35324/T) p p 831441·2793 p '
(11)
The thirteenth International Ferroalloys Congress Efficient technologies in ferroalloy industry
'
840
June 9 - 13, 2013 Almaty, Kazakhstan
MODELING AND SIMULATION
for calcium:
= 101325ex 159946(l-l 757/T) = 101325ex {10 949-19237/T) (12) p p 8,31441·1757 p'
for boron:
= 101325ex 536060
(1
-376
1/T) = 101325ex {17143-64474/T) (13) p p 8,31441·3761 p '
for titanium:
= 101325ex 435733
(1
- 3578/ T) = 101325ex {14 647 -52407/T) p p 831441·3578 p'
' (14)
The results of calculations for these dependencies in comparison with the analogous silicon (4) are shown in table 4 (with conversion Pa to mm Hg).
From the data in the table should be a pretty strong contrast to the volatility of the compared elements, which can be compared with the temperature of their boiling point by referring to the same heating temperature, for example, in 1500 and 3000 °e:
Element lb, De
P1soo, mmHg
P3000, mmHg
B 3488
3,41 ·10-{j
59,0
1i 3305
3,20·104
208
Si 3031
4,67·104
650
Fe 2773
1 66·10-2
' 2144
Al 2520 0,526
4855
Ca 1484 839
121156
From this summary reveals a regular opposite dependence of the vapor pressure of the boiling point components, and the total vapor pressure of the boiling point of silicon is 129 072 mm Hg, i.e. 167 times greater than atmospheric (760 mm Hg). But in fact, the total pressure is determined on the basis ofRaoult's law mole fraction of each substance in the melt, so the calculation of the partial pressures should be carried out taking into account the composition of the melt.
For example, consider a typical composition of silicon, smelted in the present conditions, %: Si- 99,50, Fe - 0,21, Al- 0,094, Ca - 0,17, Ti- 0,024, B - 0,002 (total- 100,000). The atomic mass number of moles of 1,000 kg of the melt and the mole fractions, respectively, amount to:
Element Si Fe Al Ca 1i B l: M,g 28,9 55,85 26,98 40,08 47,88 10,81 nM 35422 37,60 34,84 42,42 5,01 1,85 35543,72
In 1000 kg mole
fraction, 0,99658 1 058·10-3
' 9,802·104 1193.10-3
' 1,410·104 5 21·10-5 , 1,00000
df.
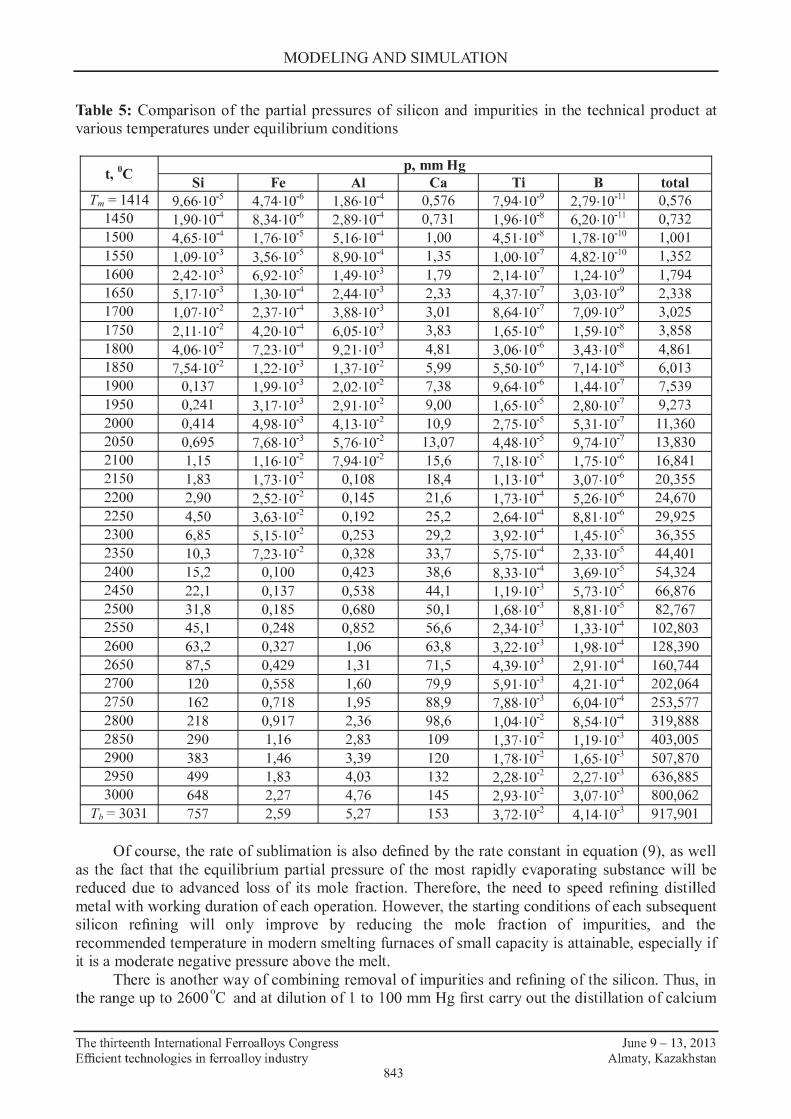
On that basis, needs to recalculate the data of table 4 in order to identify the real priorities in the volatility of the elements being considered for the selection of a suitable residual pressure based on the basic element of boiling or impurities (table 5). For clarity, the same data in a logarithmic representation of the pressure are shown in figure 4.
Pending the results relate to the equilibrium conditions, when the total vapor pressure is equal to the sum of all the substances of their partial pressures. This is a unique starting positions for the sublimation, which is determined by a given temperature and residual pressure (vacuum) above the surface of evaporation according to the kinetic equation (9). With priority given to those on the
The thirteenth International Ferroalloys Congress Efficient technologies in ferroalloy industry
841
June 9 - 13, 2013 Almaty, Kazakhstan
MODELING AND SIMULATION
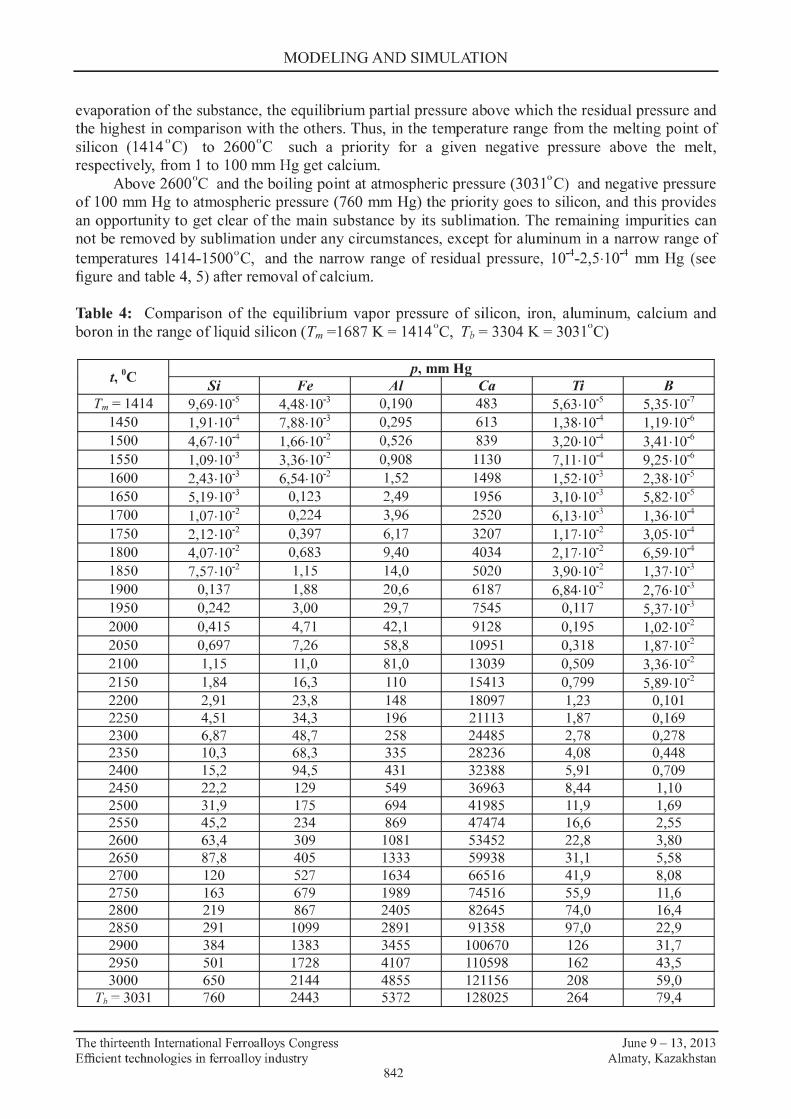
evaporation of the substance, the equilibrium partial pressure above which the residual pressure and the highest in comparison with the others. Thus, in the temperature range from the melting point of silicon (1414 °C) to 2600°C such a priority for a given negative pressure above the melt, respectively, from 1 to 100 mm Hg get calcium
Above 2600°C and the boiling point at atmospheric pressure (3031° C) and negative pressure of 100 mm Hg to atmospheric pressure (760 mm Hg) the priority goes to silicon, and this provides an opportunity to get clear of the main substance by its sublimation. The remaining impurities can not be removed by sublimation under any circumstances, except for aluminum in a narrow range of temperatures 1414-1500°C, and the narrow range of residual pressure, 104 -2,5·104 mm Hg (see figure and table 4, 5) after removal of calcium.
Table 4: Comparison of the equilibrium vapor pressure of silicon, iron, aluminum, calcium and boron in the range ofliquid silicon (T,,, =1687 K = 1414 °C, Tb= 3304 K = 3031°C)
Of course, the rate of sublimation is also defined by the rate constant in equation (9), as well as the fact that the equilibrium partial pressure of the most rapidly evaporating substance will be reduced due to advanced loss of its mole fraction. Therefore, the need to speed refining distilled metal with working duration of each operation. However, the starting conditions of each subsequent silicon refining will only improve by reducing the mole fraction of impurities, and the recommended temperature in modern smelting furnaces of small capacity is attainable, especially if it is a moderate negative pressure above the melt.
There is another way of combining removal of impurities and refining of the silicon. Thus, in the range up to 2600 °C and at dilution of 1 to 100 mm Hg first carry out the distillation of calcium
The thirteenth International Ferroalloys Congress Efficient technologies in ferroalloy industry
843
June 9 - 13, 2013 Almaty, Kazakhstan
MODELING AND SIMULATION
in accordance with its priority vapor pressure, and then go above 2600°C for priority sublimation of silicon at negative pressure is not below 100 mm Hg, we get better utilization of thermal capacity of the system for more than pure silicon.
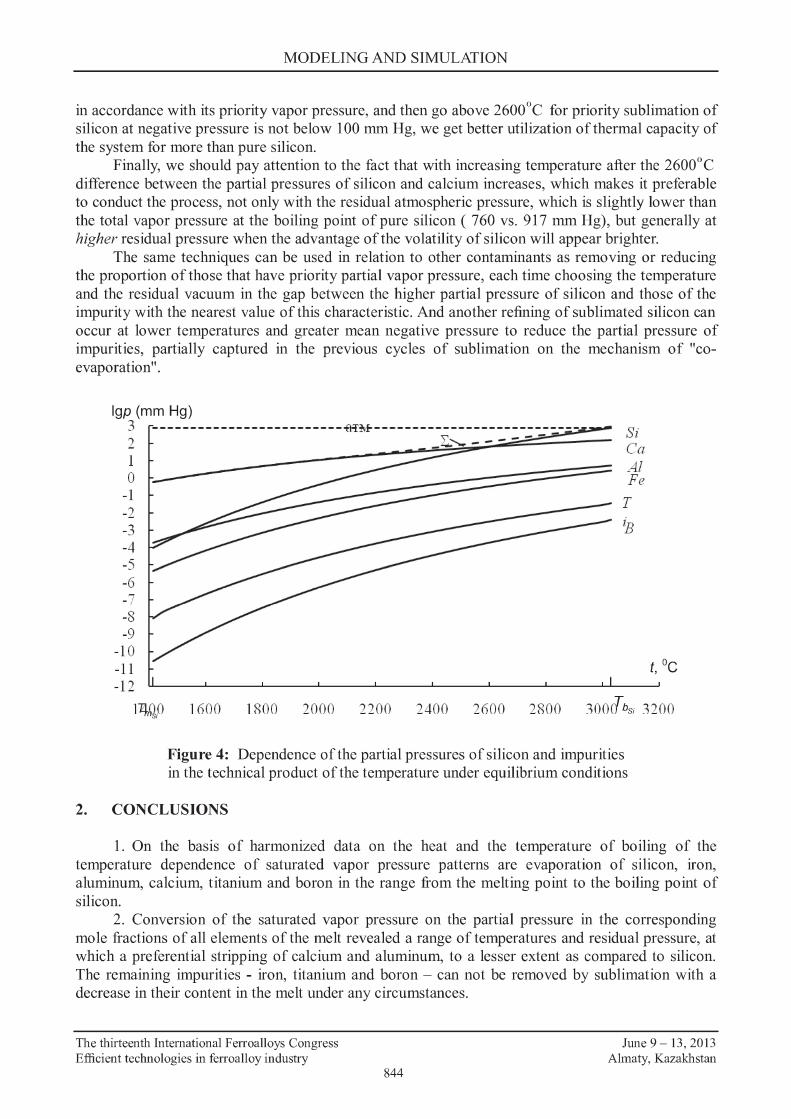
Finally, we should pay attention to the fact that with increasing temperature after the 2600°C difference between the partial pressures of silicon and calcium increases, which makes it preferable to conduct the process, not only with the residual atmospheric pressure, which is slightly lower than the total vapor pressure at the boiling point of pure silicon ( 760 vs. 917 mm Hg), but generally at higher residual pressure when the advantage of the volatility of silicon will appear brighter.
The same techniques can be used in relation to other contaminants as removing or reducing the proportion of those that have priority partial vapor pressure, each time choosing the temperature and the residual vacuum in the gap between the higher partial pressure of silicon and those of the impurity with the nearest value of this characteristic. And another refining of sublimated silicon can occur at lower temperatures and greater mean negative pressure to reduce the partial pressure of impurities, partially captured in the previous cycles of sublimation on the mechanism of "coevaporation".
Figure 4: Dependence of the partial pressures of silicon and impurities in the technical product of the temperature under equilibrium conditions
2. CONCLUSIONS
1. On the basis of harmonized data on the heat and the temperature of boiling of the temperature dependence of saturated vapor pressure patterns are evaporation of silicon, iron, aluminum, calcium, titanium and boron in the range from the melting point to the boiling point of silicon.
2. Conversion of the saturated vapor pressure on the partial pressure in the corresponding mole fractions of all elements of the melt revealed a range of temperatures and residual pressure, at which a preferential stripping of calcium and aluminum, to a lesser extent as compared to silicon. The remaining impurities - iron, titanium and boron - can not be removed by sublimation with a decrease in their content in the melt under any circumstances.
The thirteenth International Ferroalloys Congress Efficient technologies in ferroalloy industry
844
June 9 - 13, 2013 Almaty, Kazakhstan
MODELING AND SIMULATION
3. Refining silicon sublimation it is possible at temperatures above 2600°C at a residual pressure of not less than 100 mm Hg by the highest partial vapor pressure of silicon in comparison with all the impurities in the range of temperatures and pressures, and the excess pressure of vapor over the residual given by, in view of what conditions will be created by boiling evaporation priority.
3. REFERENCES
[1] Malyshev, V., Bekturganov, N., Nurmagambetova (Turdukozhaeva), A., Development of a unified theory of chaotical particles of solid, liquid and gaseous states and its application to improve technology, increase production and improve the quality of blister copper and copper rods. Bulletin of Al-farabi Kaz.akh National University, 2007, N!! 2, pp. 55-66.
[2] Malyshev, V., Bekturganov, N., Turduk.ozhaeva, A., Suleimenov, T., Concepts and according to the concept of the chaotical particles. Bulletin of the National Academy of Engineering, 2009, N2 1, pp. 71-85.
[3] Malyshev, V., Turdukozhaeva, A., Ospanov, E., Sarkenov, B., "Evaporation and boil simple substances", Scientific World, 2010.
[4] Nesmeyanov, An., ''The vapor pressure of the chemical elements", USSR Academy of Science publishers, 1961.
[5] Rufl: 0., Konschak, M., Methods manufacture of silicon. Zs. f. Electrochem, 1926, Bd. 32, ss. 515.
[6] Baur, E., Brunner, K., Silicon. Helv. Chem. Acta, 1934, Bd. 17, ss. 958. [7] Wartenberg, H., Preparation, properties and technology of silicon. Zs. f. Electrochem, 1913,
Bd. 19, SS. 482. [8] Honig, R., Technology of silicon. J. Chem. Phys., 1954, v. 22, pp. 1610. [9] Ceplyayeva, A., Priselkov, Y., Karelin, V., Chemistry of silicon. Bulletin of the Moscow State
University, 1960, N!! 5, pp. 36. [10] Properties of elements: Ref. ed. In the 2 books., ed. Drits, M.E., Publishing House "Ore and
Metals", 2003. [11] Veryatin, U., Mashirev, V., Ryabcev, N., and other, ''Thermodynamic properties of inorganic
substances. Directory", Atomizdat, 1965. [12] Saifullin, R., Saifullin, A., The modern form of the periodic table. Science and life, 2004, N!!
7, pp. 2-7. [13] Kireev, V., "Methods for practical calculations in thermodynamics of chemical reactions",
Chemistry, 1970. [14] Volk:ov, A., Zharsky, I., "Large chemical handbook", Modern School, 2005. [15] .Kbrapunov, V., Isakova, R., Abramov, A., Volodin, V., ''Recycling of mercury-containing
mineral and technogenic raw materials at reduced pressure", Almaty, 2004.
The thirteenth International Ferroalloys Congress Efficient technologies in ferroalloy industry
845
June 9 - 13, 2013 Almaty, Kazakhstan
MODELING AND SIMULATION
The thirteenth International Ferroalloys Congress Efficient technologies in ferroalloy industry


![Highly textured silicon [111 ... - Solar-Tectic LLC · Highly textured silicon [111] crystalline thin-film on buffered soda-lime glass by e-beam evaporation Shane McMahona, Ashok](https://static.documents.pub/doc/80x56/600fc27a2a567a149c76fd98/highly-textured-silicon-111-solar-tectic-highly-textured-silicon-111-crystalline.jpg)


