Modeling Crosslinking Polymerization in Batch and Continuous Reactors Ivan Kryven, Arjen Berkenbos, Priamo Melo, Dong-Min Kim, Piet D. Iedema* 1. Introduction Crosslinking polymerization occurs when a mixture of vinyl and divinyl monomers polymerizes by radical polymeriza- tion. The incorporation of divinyl units in the polymer chains creates free pending double bonds (FPDB) that may react with other growing chains to form crosslinks. The crosslinked poly- mer has interesting industrial properties in view of its rheologi- cal and processing characteristics. For instance, the influence of a cross-linking agent (divinyl benzene) on new polystyrene– polyethylene, interpenetrating-like networks has been inves- tigated by Greco et al. [1] Higher divinyl content easily leads to the formation of a gel network (Zhu and Hamielec [2] ). However, the present paper does not focus on the gel regime, but intends to describe the process under pre-gelation conditions. A key mathematical feature of the crosslinking polymer- ization problem is the fact that there is no rigorous solution of the chain length population balance equation in that particular dimension only. This is caused by the fact that it is a second dimension, the number of FPDB that determines the reactivity of the chain backbones rather than the length of the chains themselves. This is unlike some other non-linear polymerizations as, for instance, radical polymerization with long-chain branching by transfer to polymer, where basically all monomer units on a chain backbone may in principle react. The mathematical modeling of crosslinking polymer- ization has received attention in several studies, among which are the interesting series by Tobita et al., [3–7] They treat the polymerization under batch reactor conditions by Monte Carlo sampling of primary polymers being coupled by probability rules based on the ‘‘pseudo-kinetic’’ approach. Cyclization and gel formation is taken into account by these authors. More recently, Costas and Dias [8,9] have applied a generating functions approach to the problem, both in the pregel- and postgel-regimes, also for batch reactors only. Their method is comprehensive and rigorous, but requires a complex implementation. No explicit solutions for the chain length distribution are given in their publications. Finally, Kizilel et al. [10] present a model for crosslinking polymeriza- tion with Methyl Methacrylate (MMA) and Ethylene Glycol Dimethacrylate (EGDMA) for the sol and gel regime using the ‘‘numerical fractionation (NF)’’ technique. They check their model with experimental data by Li et al. [11] We will apply our method to MMA/EGDMA as well and compare the results to those of these authors. In the present paper, we aim at solving the crosslinking polymerization problem for both batch reactor and Full Paper I. Kryven, D.-M. Kim, P. D. Iedema Van ’t Hoff Institute for Molecular Sciences, Universiteit van Amsterdam, The Netherlands E-mail: [email protected]A. Berkenbos Vattenfall-Nuon, Amsterdam, The Netherlands P. Melo Escola de Quı ´mica and Programa de Engenharia Quı ´mica da COPPE, Universidade Federal do Rio de Janeiro, Brazil A new pseudo-distribution approach is applied to the modeling of crosslinking copolymer- ization of vinyl and divinyl monomer and compared to Monte Carlo (MC) simulations. With the number of free pending double bonds as the main distribution variable, a rigorous solution of the three leading moments of the molecular size distribution becomes possible. Validation takes place with data of methyl methacrylate with ethylene glycol dimethacrylate. Well within the sol regime perfect agree- ment is found, but near the gelpoint larger discrepancies do appear. This is probably due to the existence of multi- radicals that are not taken into account in the population balance approaches. ß 2013 WILEY-VCH Verlag GmbH & Co. KGaA, Weinheim wileyonlinelibrary.com Macromol. React. Eng. 2013, DOI: 10.1002/mren.201200073 1 Early View Publication; these are NOT the final page numbers, use DOI for citation !! R
Transcript
Full Paper
Modeling Crosslinking Polymerizationin Batch and Continuous Reactors
Ivan Kryven, Arjen Berkenbos, Priamo Melo, Dong-Min Kim, Piet D. Iedema*
A new pseudo-distribution approach is applied to the modeling of crosslinking copolymer-ization of vinyl and divinyl monomer and compared to Monte Carlo (MC) simulations. Withthe number of free pending double bonds as the main distribution variable, a rigoroussolution of the three leading moments of the molecularsize distribution becomes possible. Validation takes placewith data of methyl methacrylate with ethylene glycoldimethacrylate. Well within the sol regime perfect agree-ment is found, but near the gelpoint larger discrepanciesdo appear. This is probably due to the existence of multi-radicals that are not taken into account in the populationbalance approaches.
1. Introduction
Crosslinking polymerization occurs when a mixture of vinyl
and divinyl monomers polymerizes by radical polymeriza-
tion. The incorporation of divinyl units in the polymer chains
creates free pending double bonds (FPDB) that may react with
other growing chains to form crosslinks. The crosslinked poly-
mer has interesting industrial properties in view of its rheologi-
cal and processing characteristics. For instance, the influence of
a cross-linking agent (divinyl benzene) on new polystyrene–
polyethylene, interpenetrating-like networks has been inves-
tigated by Greco et al.[1] Higher divinyl content easily leads to
the formation of a gel network (Zhu and Hamielec[2]). However,
the present paper does not focus on the gel regime, but intends
to describe the process under pre-gelation conditions.
A key mathematical feature of the crosslinking polymer-
ization problem is the fact that there is no rigorous solution of
the chain length population balance equation in that
particular dimension only. This is caused by the fact that it
I. Kryven, D.-M. Kim, P. D. IedemaVan ’t Hoff Institute for Molecular Sciences, Universiteit vanAmsterdam, The NetherlandsE-mail: [email protected]. BerkenbosVattenfall-Nuon, Amsterdam, The NetherlandsP. MeloEscola de Quı́mica and Programa de Engenharia Quı́mica daCOPPE, Universidade Federal do Rio de Janeiro, Brazil
In the case of recombination termination, a primary
polymer may be connected with another primary polymer
with the same birth time. This happens with a probability Pc
that follows as the ratio of the rate of combination to the
overall termination rate (denominator of Equation (41)):
PcðuÞ ¼ktcl00
ðktd þ ktcÞl00 þ kf T� � (42)
If a connection occurs, the first sampled primary polymer
is connected to a second one, whose length is sampled from
the number distribution:
dra
d
pnnðuÞ ¼
1� 1=nðuÞf gn�1
nðuÞ (43)
The lengths are added and the two primary polymers,
having identical birth time, henceforth act as one in the MC
algorithm.
Now, the key feature of the Monte Carlo scheme for
crosslinking polymerization is, for the linear primary
polymers, to view the crosslinking process from two
perspectives, as shown in Figure 1. From the perspective
of the still growing primary polymer 1 an instantaneous
crosslink is formed by a propagation reaction with an
already formed FPDB at primary polymer 2. Since this
reaction is in competition with the propagation by reaction
with M1 and M2, the instantaneous crosslink fraction, ri,
equals the following ratio between instantaneous rates
2
ure 1. Instantaneous and additional crosslinking. Primary poly-r 1 gets an instantaneous crosslink as its radical site propagatesrough’’ an FPDB on primary polymer 2. Primary polymer 2eives an additional crosslink (arrow at RHS) as one of its FPDB‘consumed’’ by a growing radical chain.
aterialsViews.com
Macromol. React. Eng. 2013, DOI
� 2013 WILEY-VCH Verlag Gmb
Early View Publication; these are NOT
at conversion u (0< u<w, where w is the batch end
conversion):
: 10.100
H & Co
the
riðuÞ ¼kp � l00m01
ðkp1M1l00 þ kp2M2l00 þ kp � l00m01Þ(44)
Since all the concentrations in Equation (44) are functions
of conversion (time), ri is a function of conversion (time).
Thus, we see that the primary polymer formed at
conversion birth time u possessing instantaneous cross-
links right from the start and FPDB between u and batch
end conversion w may undergo a crosslinking reaction with
radical chains, thus producing additional crosslinks. The
fraction of divinyl inserted at u is given by a similar
expression as Equation (40):
F2ðuÞ ¼kp2M2l00
kp1M1l00 þ kp2M2l00 þ kp � l00m01
(45)
The part of this fraction F2(u) being converted into
crosslinks is called ‘‘additional crosslink density’’, ra. The
rate of this reaction is proportional to the decaying fraction
of unconverted FPDB as expressed by F2ðuÞ � raðu; tÞ. This
raðu; tÞ increases from 0 at t¼ u to raðu;’Þ at the end of
the batch, w, which is calculated by integration between u
and w of the differential equation:
ðu; tÞt¼ d F2ðuÞ � raðu; tÞf g
dt¼ kp � l00ðtÞ F2ðuÞ � raðu; tÞf g; raðu; uÞ ¼ 0
(46)
The actual numbers of instantaneous and additional
crosslinks then follow by a sampling procedure using riðuÞand raðu; tÞ, as calculated from Equation (44) and (46), and the
length n, sampled from Equation (41) and, evt., Equation (43).
The number of instantaneous crosslinks, ni, is directly
sampled from a binomial distribution, representing the
probability distribution of the number of instantaneous
crosslinks on a primary polymer of length n:
pðnijn; riÞ ¼nni
� �ri
nið1� riÞn�ni (47)
Sampling the number of additional crosslinks, na,
proceeds in two steps. First, the sum of unconverted and
converted FPDB on a chain of sampled length n, n2,
follows from F2(u) as given by Equation (45), also by
sampling from a binomial distribution:
pðn2jn; F2Þ ¼nn2
� �F2
n2ð1� F2Þn�n2 (48)
The sampling of the number of additional crosslinks,
na, proceeds by a binomial distribution, containing
2/mren.201200073
. KGaA, Weinheim7
final page numbers, use DOI for citation !! R
8
REa
www.mre-journal.de
I. Kryven, A. Berkenbos, P. Melo, D.-M. Kim, P. D. Iedema
n2, and the fraction FPDB turned into crosslinks,
r0a¼ ra/F2(u):
rly V
pðnajn2; r0aÞ ¼
n2
na
� �ðr0aÞ
nað1� r0aÞn2�na (49)
The number of unconverted FPDB then finally becomes
i¼n2–na. Note that the total number of these FPDB on
all primary polymers in a molecule generated with MC
sampling represents the distribution variable in the
pseudo-distribution approach, i.
Once the numbers of instantaneous and additional
crosslinks has been determined, the primary polymer
containing them is known to be connected to the same
number of other primary polymers. The next step is then to
determine the conversion birth times of these primary
polymers. In the case of instantaneous crosslinking,
the sampled primary polymer becomes attached, at
conversion time u, to the FPDB on primary polymers that
were already present before that time, in the conversion
interval between 0 and u. Now, the probability to find it at
a certain conversion time depends on the distribution
over time of the production rate of FPDB, but – since the
FPDB should still be available at u – also on the consumption
rate of FPDB. This implies that the desired distribution over
time of the crosslinking rate rcl is given by:
rclðu; tÞ ¼ kp � l00ðtÞf1� r0aðu; tÞg (50)
The probability distribution of finding an FPDB created at
conversion birth time u in an infinitesimal conversion
interval Dz at z thus becomes:
piðzjuÞDz ¼ r0clðu; zÞDzR u
0 r0clðu; zÞdz(51)
0
Here, r cl is the conversion based rate, which is related to
the time based rate of Equation (50) by rcl¼ (dx/dt)r0cl,
where dx/dt is given by Equation (40).
In the case of additional crosslinking, the primary
polymer becomes attached to further primary polymers
that were reacting with the FPDB formed at u at the
conversion interval between u and w. Therefore, the birth
times of those primary polymers should again follow
from the crosslinking intensity distribution given by
Equation (50), but now in the interval between u and w:
paðujuÞDu ¼ r0clðuÞDuR f
ur0clðxÞdx
(52)
0
dra
dt
The conversion based rate rclðu;uÞ is again related to the
time based rate in Equation (50), rcl, by rcl¼ (dx/dt)r0cl,
where dx/dt is given by Equation (40).
Macromol. React. Eng. 2013, DO
� 2013 WILEY-VCH Verlag Gmb
iew Publication; these are NOT the final pag
Thus, the conversion birth times are determined of
the primary polymers instantaneously and additionally
becoming attached to the first primary polymer, in
generation 0. Then the algorithm continues with the
determination of the properties of these primary polymers
in generation 1: lengths and further connectivity. Note that
the lengths of the new primary polymers, both instanta-
neously and additionally crosslinked, are sampled from
the weighted distribution. As regards instantaneously
coupled chains, this is the case since they are connected
by a FPDB along their backbones and more FPDB are
found on longer backbones. This holds also for additionally
crosslinked primary polymers, since the probability of
being connected is proportional to their length. The
algorithm proceeds to determine the further connectivity
for every new primary polymer with identified length and
conversion birth time until no new primary polymers are
found.
A flow chart of the MC algorithm is shown in Figure 2.
4.2. CSTR
The sampling procedure for the CSTR in steady state
resembles that for the batch reactor. The main difference is
the fact that the instantaneous properties in the CSTR are
constant, whereas the properties of the primary polymers
depend on their residence time in the CSTR, t. In the batch
reactor, we had to sample the birth conversion time of
primary polymers, while in the CSTR, we need to sample
their residence time. Consequently, the rate expressions
that determine the distribution over residence time of the
crosslinking rate at individual primary polymers remain
time-dependent. We assume that the CSTR follows the ideal
exponential residence time distribution with average t.
The weighted length distribution of the primary polymer
is now Flory distributed around a constant number average
n and is given by exactly the same expressions as in
Equation (41) and, if recombination termination is occur-
ring, Equation (43). Similarly, the instantaneous cross-
linking density, ri, as well as the instantaneous fraction
divinyl incorporated in chains, F2, are given by the same
equations as for the batch case, Equation (44) and (45),
respectively, but now with constant concentrations. The
situation is different for the additional crosslinking, which
depends on the residence time, t, of the primary polymer in
the CSTR. Every primary polymer possesses the same
fraction F2 and FPDB upon its creation. However, a part of
these FPDB is converted into crosslinks and evidently this
part increases with residence time. Therefore, a similar
differential equation as for the batch reactor, Equation (46),
holds for this case:
I: 10.100
H & Co
e nu
¼ �dðF2 � raÞdt
¼ kp � l00ðF2 � raÞ; rað0Þ ¼ 0 (53)
2/mren.201200073
. KGaA, Weinheim www.MaterialsViews.com
mbers, use DOI for citation !!
i+1
i+1
τi+1 > τi (batch)
τi+1 < τi (CSTR)
i+1
i+1
i+1
i+1
i+1
i
i
rand(1) < Pc
rand(1) > Pc
i+1
i+1
i
τi+1 < τi (batch)
τi+1 > τi (CSTR)
Sampling of:• Length pp’s gen. i, Eq. (41)• Connections, Pc, Eq. (42)• Nr of instantaneous cl’s, ni• Nr of FPDB, nFPDB• Birth times of new pp’s, τi+1
Sampling of:• Nr of additional cl’s, ni• Birth times of new pp’s, τi+1
Instantaneous cl loop Additional cl loop
nFPDB
stopni
na
= 0
> 0
= 0ni + na
Generation i = 01 pp
start
> 0
i = i + 1
Figure 2. Flow chart of the Monte Carlo simulations. It starts in generation i¼0 with one primary polymer (pp). In the instantaneouscrosslinking loop the numbers of FPDBs (nFPDB) and instantaneous crosslinks (ni) is determined. If nFPDB>0, the additional cl loop is entered,eventually producing na additional crosslinks. By sampling a random number, rand1, and requiring that it is< Pc, a recombination point isfound present (left hand structures). In subsequent cycles, the instantaneous loop is entered with niþ na pp0s. The algorithm stops if no newcrosslinks are formed.
Modeling Crosslinking Polymerization in Batch and Continuous Reactors
www.mre-journal.de
Since F2 and l00 are constant in the CSTR this is a simple
first-order differential equation with an exponential
function in residence time, t, as the solution for ra:
www.M
raðtÞ ¼ F2 1� ekp�l00t� �
(54)
In order to determine the residence time for the first
sampled primary polymer, we select randomly from the
exponential residence distribution:
pðtÞ ¼ e�t=t (55)
piðz
Once the fraction FPDB, F2, and the instantaneous and
addition crosslink densities, ri and ra are known, the
actual numbers of crosslinks and unconverted FPDB are
obtained from the sampled primary polymer chain length
(Equation 41 and 43) and the binomial distributions as
given for the batch case, Equation (47)–(49).
For the new series of primary polymers connected to the
first one at the identical number of crosslink points, the
residence time has to be determined as well, in order to
find the additional crosslinking density, ra. As similar as
to the batch case this proceeds differently for primary
polymers connected by instantaneous crosslinks than
for those connected by additional crosslinks. An instanta-
neous crosslink forming at a primary polymer with
residence time t does so by reacting with an FPDB on
another primary polymer. The latter primary polymer
aterialsViews.com
Macromol. React. Eng. 2013, DOI
� 2013 WILEY-VCH Verlag Gmb
Early View Publication; these are NOT
exits the reactor at the same time as the first one, so the
residence time of the latter should be equal or longer than t.
Now, the probability of finding an unreacted FPDB on a
new chain in a certain residence time interval depends on:
a. T
: 10
H &
t
he residence time distribution of the chain,
Equation (55).
b. T
he decaying amount of FPDB on the chain. This is
expressed by Equation (53) describing the decay of the
fraction non-converted FPDB, F2–ra(t).
The probability distribution of finding a primary polymer
with residence time z is thus given by:
.100
Co
he
jtÞDz ¼ F2 � raðzÞf gexpð�z=tÞDzR1t
F2 � raðzÞf gexpð�z=tÞdz
¼ exp � kp � l00 þ1
t
� �zþ kp � l00t
� Dz
(56)
The second equality in Equation (51) easily follows from
the expression for ra of Equation (54).
If an additional crosslink is formed at a primary
polymer with residence time t by a reaction of a FPDB on
that chain with a newly growing radical chain, then the
latter chain must have been growing and reacting during
the residence time of the first chain, while it leaves at the
same time. This implies that the residence time of the
new primary polymer attached by an additional crosslink
2/mren.201200073
. KGaA, Weinheim9
final page numbers, use DOI for citation !! R
0.8
1
1.2 x 10⁻³
Fraction divinyl in chains, F2 = 1.12 × 10⁻³
10
REa
www.mre-journal.de
I. Kryven, A. Berkenbos, P. Melo, D.-M. Kim, P. D. Iedema
should be between 0 and t. The probability distribution of
finding this residence time, u, 0<u� t, is again given by the
function F2–ra(t) of Equation (54), describing the decay of
the FPDB on the first chain during that interval. Thus,
version (x) dependent gel effect was modeled using the empiri
ients Ai (dependent on CTA-concentration) taken from ref.[11].
Macromol. React. Eng. 2013, DO
� 2013 WILEY-VCH Verlag Gmb
iew Publication; these are NOT the final pag
tional crosslinking is rather flat, implying a mild preference
for the smaller times.
5. Results
We started simulations to validate the pseudo-distribution
model and MC simulations with data for the crosslinking
Batch[3–7] CSTR Units
0.015
1.73� 10�9 kmole �m�3
9.9 9.995 kmole �m�3
0.1 0.005 kmole �m�3
5.45� 10�6 kmole �m�3
60 s
30 s
0.45 –
5000 5000 m3 � kmole�1 � s�1
10 000 10 000 m3 � kmole�1 � s�1
0 0
1.97� 106 108 m3 � kmole�1 � s�1
0 0
500 500 m3 � kmole�1 � s�1
140–320 2900 –
cal formula (Li et al.[11]): ktðxÞ ¼ ktð0Þexp � A1xþ A2x2 þ A3x3ð Þf g;
I: 10.1002/mren.201200073
H & Co. KGaA, Weinheim www.MaterialsViews.com
e numbers, use DOI for citation !!
Figure 4. Residence time probability distributions for primarypolymers in CSTR connected by instantaneous and additionalcrosslinks to a primary polymer with average residence timet ¼ t ¼ 30 s. Residence time of instantaneously coupled chains,u, between t and 1, but with higher probability close to t.Residence time probability of additionally coupled chains moreevenly distributed over time between 0 and t.
Modeling Crosslinking Polymerization in Batch and Continuous Reactors
www.mre-journal.de
polymerization of MMA and EGDMA from Li et al.[11] and
Kizilel et al.[10] All the kinetic data, based on experiments,[11]
have been listed in Table 2. Note that a small gel effect
reducing the termination rate has been accounted for.[11]
The population size for the MC simulations was always
500 000, requiring typically between 1 min and 1 h CPU-
time. For a batch end time of 632 s and a conversion of
h¼ 0.054 and a weight percentage of divinyl (EGDMA)
of 0.1 the system is still in a sol regime. The rigorous
pseudo-distribution solution for the concentration distri-
bution of FPDBs is compared to MC simulation results
in Figure 5. The concentration is plotted as d log(w)/di,
which scales as i2Pi, to better highlight the tail of the
Figure 5. Distribution of number of FPDBs scaling with i2Pi (GPC-distriution) from MC simulations and pseudo-distributions, forbatch end time 632 s, conversion x¼0.054, 0.1 weight fractionEGDMA and kinetic data from Table 2.
www.MaterialsViews.com
Macromol. React. Eng. 2013, DOI
� 2013 WILEY-VCH Verlag Gmb
Early View Publication; these are NOT
distribution. In order to obtain the FPDB distribution, Pi,
from the MC simulations, the following procedure has
been applied. First, one should realize that the MC
When collecting the numbers of molecules with a certain
number of FPDB in certain FPDB-bins, those numbers have
to be corrected for the number average weight of all the
molecules collected in a bin. This is achieved by construct-
ing the chain length distribution for the molecules of each
FPDB-bin. Regarding Figure 5, it is obvious that perfect
agreement exists between the new pseudo-distribution
model and the MC simulations. A second set of results is
obtained for a batch end time of 875 s and a conversion of
h¼ 0.075 (0.1 wt% EGDMA) and the resulting chain length
weight fraction distributions are shown in the double-log
plot of Figure 6. At these conditions our MC simulations
reveal a small gel weight fraction of 0.00019 (number of
molecules having more than 10 000 generations[3–7]), hence
we assume that the distribution shown represents weight
distribution at the gelpoint of the sol. The chain length
distribution based on the pseudo-distribution model is
approximated using the two-parameter distribution,
Equation (37–39). We compare the pseudo-distribution
(Piþ Ri) and MC results at conversion h¼ 0.075 to a
distribution obtained by NF by Kizilel et al.,[10] also at the
gelpoint. However, latter authors find the gelpoint at
h¼ 0.09. There is global agreement between the three
curves, but more closely regarding one observes small
differences. The pseudo-distribution runs until n � 106
since the maximum number of FPDB in the model was set
to 2� 104. At high n the pseudo-distribution curve is
slightly higher than the MC. This is probably due to the
fact that the pseudo-distribution model does not account
for multiradicals that may become important already near
Figure 6. Weight fraction distribution of chain lengths, n, forbatch end time 875 s, conversion x¼0.075, 0.1 weight fractionEGDMA and further kinetic data from Table 2. From pseudo-distributions, MC simulations and NF-method.[10] At the tail of thedistributions small discrepancies are seen.
: 10.1002/mren.201200073
H & Co. KGaA, Weinheim11
the final page numbers, use DOI for citation !! R
10-3 10-2
10-1 100
101 102
100 101
102 Number of FPDB, i
x 10-6
0
2
4
6
Con
cent
ratio
n, R
i( t) (km
ole/
m3 )
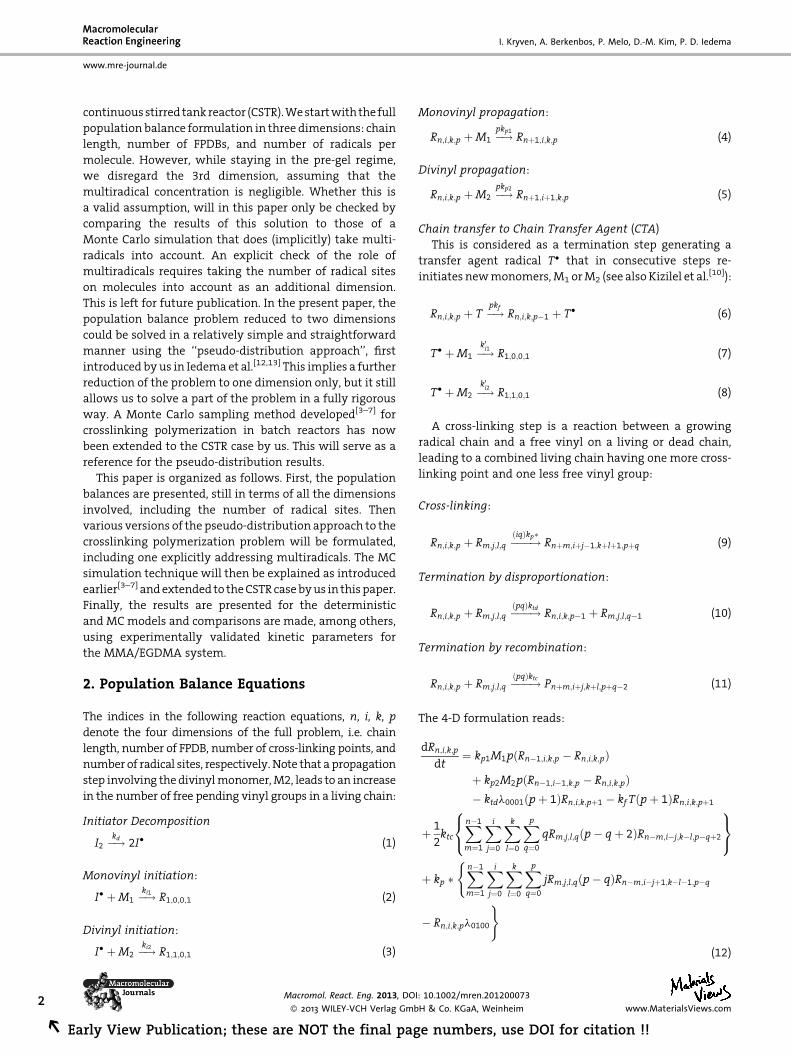
Figure 8. Development of living chain FPDB distribution over timeas computed for the batch reactor from the pseudo-distributionmodel. Kinetic data according to Table 2 and Figure 7.
100 101
102
100
0.03
Con
cent
ratio
n, P
i(t) (km
ole/
m3 )
0.02
0.01
0
12
REa
www.mre-journal.de
I. Kryven, A. Berkenbos, P. Melo, D.-M. Kim, P. D. Iedema
the gel-regime. Apart from predicting the gelpoint at a
slightly higher conversion, h¼ 0.09 than the MC simula-
tions (�0.075), the NF-model shows higher concentrations
in the tail of the distribution. These differences may be
attributed to the inaccuracy introduced by taking moments
in the NF-method and/or to multi-radicals, also not taken
into account in the NF-method. Summarizing this part we
conclude that good agreement exists between the earlier
results, based on experiments,[11] and our models.
Using the same kinetic parameter set as Tobita et al.[3–7]
(see Table 2 and caption of Figure 7) further calculations
were made for the batch reactor. The results from both
the pseudo-distribution model and the Monte Carlo
simulations are presented in Figures 7 through 12.
Figure 7 presents the time profiles of the monomer
concentrations, M1 and M2, the total radical concentration,
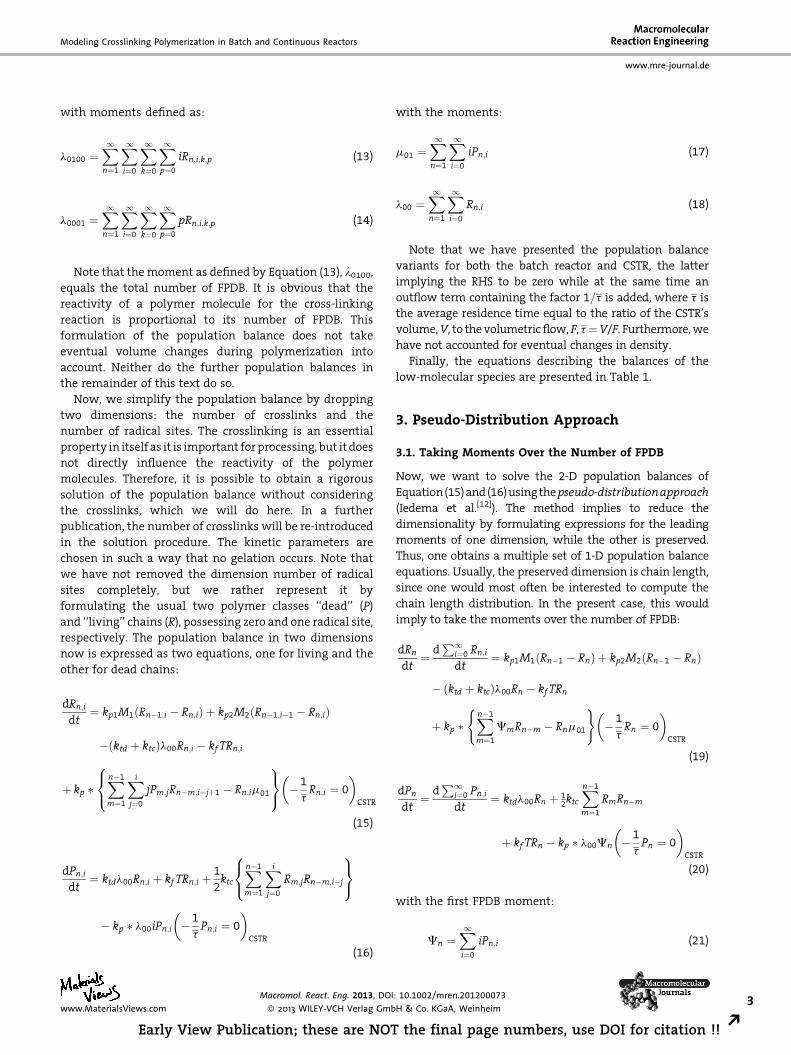
l00, and the total number of FPDB, m01. The development
over time of the FPDB distributions for living and dead
chains is shown in Figure 8 and 9. The former plot, Ri,
reveals a relatively narrow distribution at short times that
gradually changes and then broadens after appreciable
conversion. It remains at a relatively high concentration
over the whole time interval, which reflects the profile of
l00 in Figure 7. The plot of the dead chains, Pi, is more
gradually increasing over time, as is the case with the
overall FPDB in Figure 7.
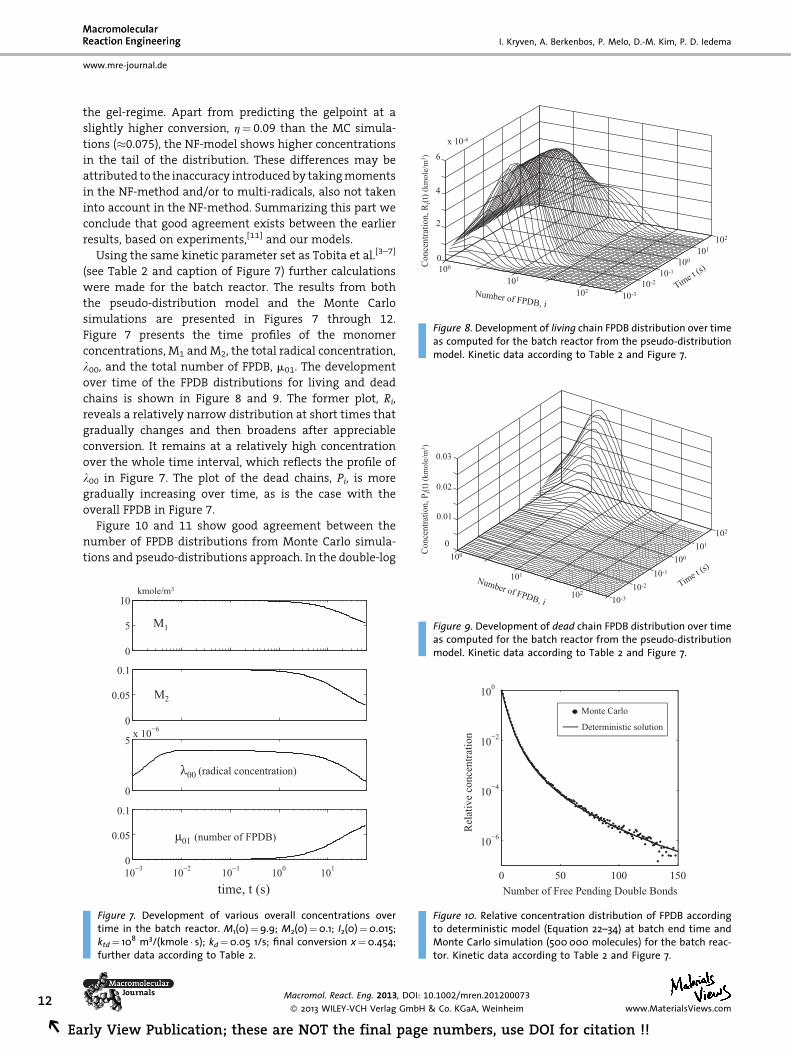
Figure 10 and 11 show good agreement between the
number of FPDB distributions from Monte Carlo simula-
tions and pseudo-distributions approach. In the double-log
0
5
10
0
0.05
0.1
0
5 x 10⁻⁶
10−3 10−2 10−1 100 1010
0.05
0.1
M1
M2
λ00 (radical concentration)
μ01 (number of FPDB)
kmole/m3
time, t (s)
Figure 7. Development of various overall concentrations overtime in the batch reactor. M1(0)¼9.9; M2(0)¼0.1; I2(0)¼0.015;ktd¼ 108 m3/(kmole � s); kd¼0.05 1/s; final conversion x¼0.454;further data according to Table 2.
10-3 10-2
10-1 101
102 Number of FPDB, i
Figure 9. Development of dead chain FPDB distribution over timeas computed for the batch reactor from the pseudo-distributionmodel. Kinetic data according to Table 2 and Figure 7.
0 50 100 150
10−6
10−4
10−2
100
Number of Free Pending Double Bonds
Rel
ativ
e co
ncen
tratio
n
Monte Carlo
Deterministic solution
Figure 10. Relative concentration distribution of FPDB accordingto deterministic model (Equation 22–34) at batch end time andMonte Carlo simulation (500 000 molecules) for the batch reac-tor. Kinetic data according to Table 2 and Figure 7.
rly View Publication; these are NOT the final page numbers, use DOI for citation !!
100 101 102
102
103
104
Number of Free Pending Double Bonds, i
Ave
rage
cha
in le
ngth
=
=
Monte Carlo
Deterministic solutions
Λψ
ψ
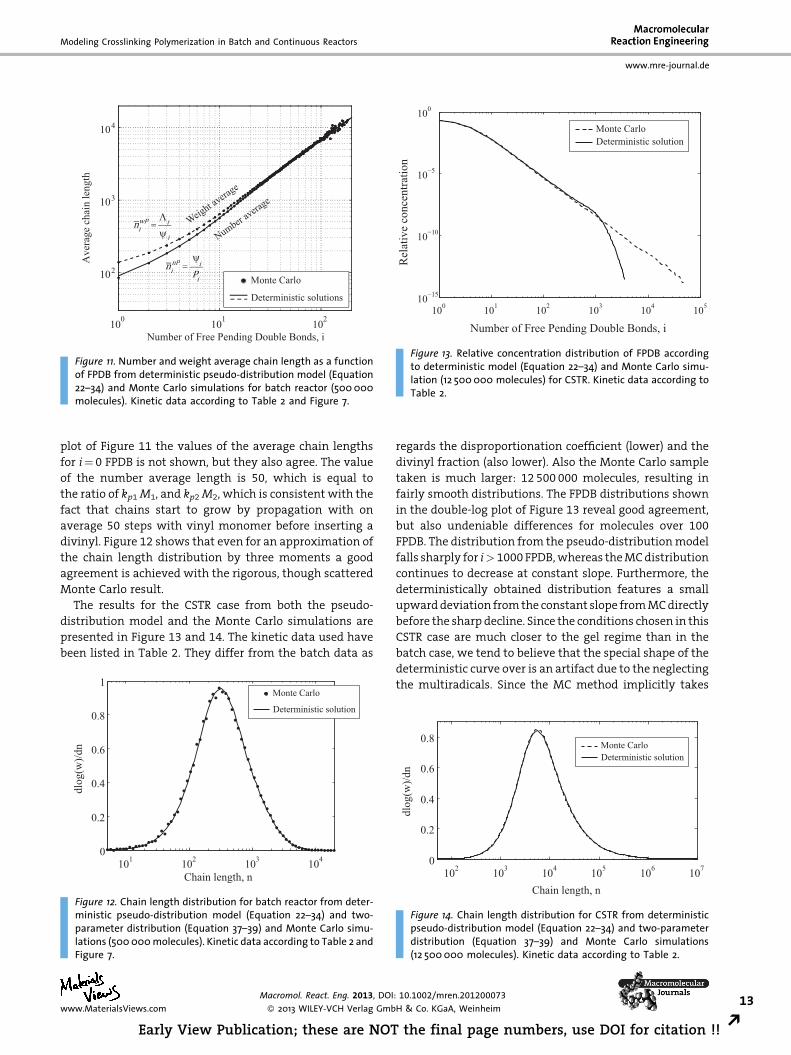
Figure 11. Number and weight average chain length as a functionof FPDB from deterministic pseudo-distribution model (Equation22–34) and Monte Carlo simulations for batch reactor (500 000molecules). Kinetic data according to Table 2 and Figure 7.
100 101 102 103 104 10510−15
10−10
10−5
100
Number of Free Pending Double Bonds, i
Rel
ativ
e co
ncen
tratio
n
Monte Carlo Deterministic solution
Figure 13. Relative concentration distribution of FPDB accordingto deterministic model (Equation 22–34) and Monte Carlo simu-lation (12 500 000 molecules) for CSTR. Kinetic data according toTable 2.
Modeling Crosslinking Polymerization in Batch and Continuous Reactors
www.mre-journal.de
plot of Figure 11 the values of the average chain lengths
for i¼ 0 FPDB is not shown, but they also agree. The value
of the number average length is 50, which is equal to
the ratio of kp1 M1, and kp2 M2, which is consistent with the
fact that chains start to grow by propagation with on
average 50 steps with vinyl monomer before inserting a
divinyl. Figure 12 shows that even for an approximation of
the chain length distribution by three moments a good
agreement is achieved with the rigorous, though scattered
Monte Carlo result.
The results for the CSTR case from both the pseudo-
distribution model and the Monte Carlo simulations are
presented in Figure 13 and 14. The kinetic data used have
been listed in Table 2. They differ from the batch data as
101 102 103 1040
0.2
0.4
0.6
0.8
1
Chain length, n
dlog
(w)/d
n
Monte Carlo
Deterministic solution
Figure 12. Chain length distribution for batch reactor from deter-ministic pseudo-distribution model (Equation 22–34) and two-parameter distribution (Equation 37–39) and Monte Carlo simu-lations (500 000 molecules). Kinetic data according to Table 2 andFigure 7.
www.MaterialsViews.com
Macromol. React. Eng. 2013, DOI
� 2013 WILEY-VCH Verlag Gmb
Early View Publication; these are NOT
regards the disproportionation coefficient (lower) and the
divinyl fraction (also lower). Also the Monte Carlo sample
taken is much larger: 12 500 000 molecules, resulting in
fairly smooth distributions. The FPDB distributions shown
in the double-log plot of Figure 13 reveal good agreement,
but also undeniable differences for molecules over 100
FPDB. The distribution from the pseudo-distribution model
falls sharply for i> 1000 FPDB, whereas the MC distribution
continues to decrease at constant slope. Furthermore, the
deterministically obtained distribution features a small
upward deviation from the constant slope from MC directly
before the sharp decline. Since the conditions chosen in this
CSTR case are much closer to the gel regime than in the
batch case, we tend to believe that the special shape of the
deterministic curve over is an artifact due to the neglecting
the multiradicals. Since the MC method implicitly takes
102 103 104 105 106 1070
0.2
0.4
0.6
0.8
Chain length, n
dlog
(w)/d
n
Monte Carlo Deterministic solution
Figure 14. Chain length distribution for CSTR from deterministicpseudo-distribution model (Equation 22–34) and two-parameterdistribution (Equation 37–39) and Monte Carlo simulations(12 500 000 molecules). Kinetic data according to Table 2.
: 10.1002/mren.201200073
H & Co. KGaA, Weinheim13
the final page numbers, use DOI for citation !! R
14
REa
www.mre-journal.de
I. Kryven, A. Berkenbos, P. Melo, D.-M. Kim, P. D. Iedema
multiradicals into account, it is expected that a straight
form of the FPDB distribution over 100 FPDB is closer to the
truth. We will discuss this phenomenon in a publication to
follow, where the number of radical sites is explicitly taken
into account as an additional dimension. Figure 14 shows
the molecular size distribution directly obtained from the
MC simulations and indirectly, using the two-parameter
distribution shape approximation after Equation (37)–(39),
from the pseudo-distribution approach. Being represented
as weighted distributions, in terms of n2Pn, the distribu-
tions feature quite good although no perfect agreement.
The aforementioned reasons may cause the small dis-
crepancy, apart from the approximate character of the
deterministic distribution.
6. Conclusion
A new pseudo-distribution approach has been applied to
the modeling problem of crosslinking copolymerization of
vinyl and divinyl monomer, both for batch and continuous
reactors. The usual formulation of the pseudo-distribution
balance equations in terms of molecular size, while taking
the moment over the number of FPDBs as the second
distribution variable, was shown to lead to a closure
problem. This is caused by the fact that it is rather the
number of FPDB that determines the reactivity of a
molecule than its number of monomer units. Therefore,
it was decided to construct a pseudo-distribution model
with the number of FPDB as the main distribution variable
and taking moments over the chain length distribution.
This model does not contain a closure problem and it allows
a fully rigorous solution of the three leading molecular size
moments. A Monte Carlo simulation model developed by
Tobita et al.[3–7] has been employed as a reference for our
model. This MC model is based on primary polymers that
are crosslinked by a reaction between the radical sites on
one molecule and the FPDB on another. It utilizes concepts
of instantaneous and addition crosslinking to connect the
primary polymers.
The pseudo-distribution model has been validated with,
in part experimental, data from literature[10,11] for the
crosslinking copolymerization of MMA with EGDMA in a
Nomenclature
(Note that the terms ‘‘chain length’’, ‘‘number of monomer un
Symbol Description
F Volumetric flow rate
F2 Fraction divinyl monomer in primary polym
I2; I� Concentration Initiator, Initiator radical
Macromol. React. Eng. 2013, DO
� 2013 WILEY-VCH Verlag Gmb
rly View Publication; these are NOT the final pag
batch reactor. Good agreement with the weight fraction
distribution obtained by NF[10] was observed. Under
conditions near the gelpoint a small discrepancy was
found at longer chain lengths between the deterministic
methods (NF and pseudo-distribution) on the one hand and
the MC simulations at the other. This may be attributed to
the fact that multiradicals in the deterministic methods are
not taken into account, whereas in the MC simulations they
(implicitly) are. In the case of a batch reactor under non-
gelling conditions and relatively short primary polymer
lengths (�140), perfect agreement was found (Figure 9
and 11) between the model outcomes for the leading
moments (FPDB distributions) and those from the Monte
Carlo simulation model. Even a complete molecular size
distribution obtained by an assumed two-parameter shape
distribution based on the three leading moment features
very good agreement with the MC simulations (Figure 12).
In the CSTR case, we again ventured closer to a gel-
forming regime by choosing different conditions like a
longer linear chain length. The original pseudo-distribution
model, Equation (22)–(34), was formulated for the living
and dead molecules only, as usual in radical polymerization
modeling. The outcomes from this model under these CSTR
conditions have been compared with a MC simulation
model that we developed for this purpose. This MC model is
based on the same principles as the original batch
version,[3–7] but it allows for residence time dependent
properties of the linear primary polymers, assuming the
usual exponential residence time distribution shape of a
CSTR. Comparing the results of the deterministic and MC
model showed fair but not perfect agreement (Figure 13
and 14). Again, one should realize that the MC simulation
implicitly takes multiradicals into account, whereas the
pseudo-distribution model does not. From these results, we
conclude that the pseudo-distribution model is well
applicable within the sol regime. The small differences
observed under conditions near the gelpoint, however,
should be explored further with respect to the role of
multiradicals. This is especially so, if one desires the models
to be valid until or even beyond the gelpoint. In a future
publication, we will address the multiradical issue in
population balance modeling by explicitly taking this into
account as an additional dimension.
its’’, and ‘‘molecular size’’ have been used as synonyms.)
Early View Publication; these are NOT the final page numbers, use DOI for citation !! R
Modeling Crosslinking Polymerization in Batch and Continuous Reactors
www.mre-journal.de
Greek letters
Symbol Description Units Location
Li 2nd chain length moment dead chains
(i number of FPDB)
m3 � (kmol�1 � s�1) Equation (22)–(34)
Fi 1st chain length moment living chains
(i number of FPDB)
m3 � (kmol�1 � s�1) Equation (22)–(34)
Cn 1st FPDB moment dead chains
(n chain length)
m3 � (kmol�1 � s�1) Equation (19)–(21)
Ci 1st chain length moment dead chains
(i number of FPDB)
m3 � (kmol�1 � s�1) Equation 22–34
Vi 2nd chain length moment living chains
(i number of FPDB)
m3 � (kmol�1 � s�1) Equation (22)–(34)
a(i), b(i) Parameters in two-parameter distribution – Equation (37)–(39)
l0100, l0001 Moments in 4D population balance
(l0100 number of FPDB)
kmol �m�3 Equation (12)–(14)
m01, l00 Moments in 2D population balance
(m01 number of FPDB)
kmol �m�3 Equation (16)–(18)
mP0;i;m
P1;i;m
P2;i
mR0;i:m
R1;i;m
R2;i
Moments used in two-parameter distribution kmol �m�3 Equation (37)–(39)
u Conversion birth time primary polymer – Par. 4.1
w End conversion batch reactor – Par. 4.1
ri, ra Instantaneous and additional crosslink fraction – Equation (44)–(46)
t, t Residence time CSTR (average) s Population balances
x Number of crosslinks Table 1
16
REa
www.mre-journal.de
I. Kryven, A. Berkenbos, P. Melo, D.-M. Kim, P. D. Iedema
Received: October 23, 2012; Revised: November 29, 2012;Published online: DOI: 10.1002/mren.201200073
Keywords: copolymerization; crosslinking; modeling; molarmass distribution; Monte Carlo simulation
[1] R. Greco, M. F. Astarita, A. Fiedlerova, E. Borsig, Adv. Polym.Technol. 1994, 18, 65.
[2] S. P. Zhu, A. E. Hamielec, Makromol. Chem. Macromol. Symp.1992, 63, 135.
[3] H. Tobita, A. E. Hamielec, Macromolecules 1989, 22, 3098.[4] H. Tobita, A. E. Hamielec, Polymer 1990, 31, 1546.[5] H. Tobita, Macromolecules 1993, 26, 836.
Macromol. React. Eng. 2013, DO
� 2013 WILEY-VCH Verlag Gmb
rly View Publication; these are NOT the final pag
[6] H. Tobita, Macromolecules 1993, 26, 5427.[7] H. Tobita, K. Ito, Polym. Gels Networks 1994, 2, 191.[8] R. C. S. Dias, M. R. P. Costa, Polymer 2005, 46, 6163.[9] R. C. S. Dias, M. R. P. F. N. Costa, Macromol. Theory Simul. 2010,
19, 323.[10] S. Kizilel, G. Papavasiliou, J. Gossage, F. Teymour, Macromol.
React. Eng. 2007, 1, 587.[11] W. H. Li, A. E. Hamielec, C. M. Crowe, Polymer 1989, 30, 1518.[12] P. D. Iedema, M. Wulkow, H. C. J. Hoefsloot, Macromolecules
2000, 33, 7173.[13] P. D. Iedema, H. C. J. Hoefsloot, Macromol. Theory Simul. 2001,
10, 855.[14] H. M. Hulburt, S. Katz, Chem. Eng. 1964, 19, 555.[15] P. D. Iedema, Macromol. Theory Simul. 2012, 21, 166.[16] M. Wulkow, Macromol. Theory Simul. 1996, 5, 393.