Modeling Customer Reactions to Sales Attempts: If Cross- Selling Backfires Evrim D. Güneş 1 *, O. Zeynep Akşin 2 , E. Lerzan Örmeci 3 , S. Hazal Özden 4 Keywords: customer relationship management, customer behavior modeling, Markov decision model, call center, quasi-experiment, random-coefficient logit estimation 1*: Corresponding author: Koç University, College of Administrative Sciences and Economics, Rumeli Feneri Yolu, 34450 Sarıyer, Istanbul, Turkey. Tel:+90 212 338 16 39, Fax:+90 212 338 16 53, [email protected]2: Koç University, College of Administrative Sciences and Economics, Rumeli Feneri Yolu, 34450 Sarıyer, Istanbul, Turkey. [email protected]3: Koç University, College of Engineering, Rumeli Feneri Yolu, 34450 Sarıyer, Istanbul, Turkey, [email protected]4: KoçSistem Information and Communication Services, Üsküdar 34700 İstanbul, [email protected]We acknowledge Tingliang Huang’s technical assistance in the random coefficient logit estimation and thank the bank for providing us with the data. We thank Serdar Sayman, Zeynep Gurhan Canli, Lerzan Aksoy and Skander Esseghaier for their comments on an earlier version. Zeynep Aksin would like to acknowledge financial support from TUBITAK, The Scientific & Technological Research Council of Turkey and thank the MEDS Department at the Kellogg School of Management, Northwestern University, where part of this research was conducted.
Transcript
Modeling Customer Reactions to Sales Attempts: If Cross-
Selling Backfires
Evrim D. Güneş1*, O. Zeynep Akşin2, E. Lerzan Örmeci3, S. Hazal Özden4
We acknowledge Tingliang Huang’s technical assistance in the random coefficient logit estimation and thank the bank for providing us with the data. We thank Serdar Sayman, Zeynep Gurhan Canli, Lerzan Aksoy and Skander Esseghaier for their comments on an earlier version. Zeynep Aksin would like to acknowledge financial support from TUBITAK, The Scientific & Technological Research Council of Turkey and thank the MEDS Department at the Kellogg School of Management, Northwestern University, where part of this research was conducted.
2
Modeling Customer Reactions to Sales Attempts: If Cross-
Selling Backfires
Abstract
Cross-selling attempts, based on estimated purchase probabilities, are not guaranteed to
succeed and such failed attempts may annoy customers. There is a general belief that cross-
selling may backfire if not implemented cautiously, however there is not a good
understanding of the nature and impact of this negative reaction or appropriate policies to
counter-balance it. This paper focuses on this issue and develops a modeling framework that
makes use of a Markov decision model to account for negative customer reactions to failed
sales attempts, and the effect of past contacts in managing cross-selling initiatives. Three
models are analyzed, where purchase probabilities are affected from customer maturity or the
number of failed attempts since the last purchase, or both. The analysis shows that customer
reactions to cross-sell attempts make the purchase probabilities endogenous to the firm’s
cross-selling decisions; hence the optimal cross-selling policy becomes a function of customer
state. The results highlight the role the cost of excessive cross-selling (direct as well as in the
form of customer reactions) plays in optimal policies. Cross-sell data from a retail bank
illustrates in what context the modeling framework can be applied and underlines the
importance of customizing cross-sell policies to individual customers.
3
INTRODUCTION
Customer relationship management, which consists of acquiring, retaining and
growing or expanding customer relationships with a firm, is an important endeavor for
modern service organizations. This paper is related to the growth or expansion dimension,
which typically is achieved through cross-selling (Winer 2001; Gupta et al. 2006). Cross-
selling aims to increase revenues generated by the sale of additional products and services to
existing customers and is one of the most important practices in customer relationship
management (Kamakura et al. 2003). A McKinsey Report estimates that cross-selling can
generate revenues of as much as 10% of the revenues through a bank’s branch network
(Eichfeld, Morse and Scott 2006).
Successful cross-selling requires a decision on the right product and the right time to
attempt a sale for each customer. In an effort to identify these, researchers have analyzed data
in different contexts. One relationship that has been explored is between customer tenure and
cross-buying. It is believed that successful cross-selling can increase customer retention
(Marple and Zimmerman 1999) and reduce customer churn (Kamakura et al. 2003;
Balachander and Ghosh 2006). Although no causality claim is made, Kamakura et al. (2003)
show a positive relationship between customer tenure and the number of a bank’s services
used. Combined with the well known result that financial services are typically acquired
sequentially (Paas and Kuijlen 2001; Li, Sun, and Wilcox 2005; Kamakura, Ramaswami, and
Srivastava 1991), Li, Sun, and Wilcox (2005) and Kamakura et al. (1991) are able to relate
customer demand for a particular product next in the sequence to a customer’s maturity. This
maturity is said to change over time as a function of many factors like life stage changes,
consumption experience, financial resource availability, etc. (Li, Sun, and Wilcox 2005) and
4
is shown to be a good predictor for the most likely product purchase by a customer at a certain
time. In the authors’ words, “maturity represents an individual customer’s readiness for a
particular product at a certain time.” We refer to this phenomenon as customer maturity in
what follows.
Even though marketing research has made progress in estimating purchase
probabilities making use of transactional data, augmented by survey data in some cases, by
nature these are not perfect and a cross-selling attempt made based on these predictions is not
guaranteed to succeed. Thus, it is possible that a firm that adopts cross-selling as a growth
tactic will make sales attempts that fail and potentially may make too many of such attempts.
Indeed, Kamakura et al. (2003) argue that excessive cross-selling may irritate customers and
cause switching. Intuitively, if a customer is turned off by an inappropriate cross-sell attempt,
that customer would likely have a negative feeling against another sales pitch, and would
probably not accept it. If the annoyance continues, he/she may try to avoid contacting the
company, and even switch. Eichfeld, Morse and Scott (2006) claim that firms do not benefit
from cross selling as much as they should, because of this fear of annoying customers. There
is a general belief that cross-selling may backfire if not implemented cautiously, however
there is not a good understanding of the nature and impact of this negative reaction or
appropriate policies to counter-balance it. It is this issue that motivates the research herein.
The link between satisfaction and behavioral intentions like retention, repeat purchase
and switching has been investigated in the marketing literature (for example see Bolton and
Lemon 1999; Gustafsson, Johnson, and Roos 2005; van Doorn and Verhoef 2008). According
to Li, Sun, and Wilcox (2005) “customer satisfaction or service quality has a significant
influence on a customer's future purchase decisions, especially for more advanced financial
products (e.g., brokerage)”. Van Doorn and Verhoef (2008) explore the role that negative
critical incidences, i.e. events during interaction that are perceived as being negative, play on
5
customer satisfaction and resulting customer share. Using a model where current satisfaction
is affected by past satisfaction as well as attribute evaluations, the authors show that negative
critical incidences have a moderating effect on how these two are weighted. An unsuccessful
cross-sell attempt can be seen as a negative critical incidence; therefore failed cross-sell
attempts may affect customer behavior in a similar manner. A different analogy can be made
between a service failure and a failed cross-sell attempt. There is evidence in the literature
that in many cases it is not the first failure, but repeated failures of the same kind that lead to
dissatisfaction (Smith and Bolton 1998). In some cases, successful service recovery can
compensate for some of the negative effects of prior failures (Smith and Bolton, 1998). A
successful cross-sell attempt following earlier failures could be interpreted as a form of
successful service recovery, potentially erasing the effect of earlier failures. Nevertheless,
there is no specific result on the form of negative reactions to failed cross-sell attempts in the
literature.
If customers react to failed cross-sell attempts, this implies that customer propensities
change dynamically depending on the firm’s decisions of whether to attempt a sale or not. In
return, the firm’s decision should take this effect into account and consider the history of the
customer in decision making. The main objective herein is to illustrate a modeling framework
that makes use of a Markov decision model to account for negative customer reactions to
failed sales attempts in managing cross-selling initiatives. The customer’s state is
characterized either by their maturity since the last purchase (i.e. the number of contacts since
the last purchase), or by the number of failed attempts since the last purchase, or both. In this
framework, customer maturity progression and reactions are reflected on state-dependent
parameters in a control model. We focus on reactions in the sense of reduction in sales
potential after unsuccessful cross-sell attempts, captured by a potentially decreasing
probability of success for a cross-sell attempt as a function of previous failures (i.e. attempts
6
rejected by the customer). The basic research questions we seek to answer are: Does customer
history pertaining to earlier cross-selling matter in choosing future cross-selling policies?
What is the structure of resulting policies? When are resulting policies a function of customer
history? Would negative reactions to failed cross-sell attempts by customers influence cross-
selling decisions of a firm, and if so, how?
We illustrate that reactions that influence purchase probabilities change the optimal
cross-selling policy from one that does not depend on customer history to one that is a
function of customer state. Furthermore, ignoring customer reactions in cross-selling
decisions can result in significant value loss compared to policies that explicitly take such a
reaction into account. The rest of the paper is organized as follows. The following section
reviews related literature. Then the modeling framework is introduced and a Markov decision
model is formulated. The modeling framework is illustrated through the formulation of four
specific models in the following section. Analysis of these models yields structural properties
of optimal cross-selling policies. Most importantly, we show that in settings where customer
dynamics affect purchase probabilities, optimal cross-sell policies take the form of thresholds
that depend on the customer state. Afterwards, cross-sell data from a retail bank is used to
illustrate cross-selling in practice, and to demonstrate how the modeling framework can be
used in such a context. The paper ends with an overview of managerial implications.
7
LITERATURE
There is a vast and rapidly growing literature on customer relationship management.
We point the reader to some excellent overview articles by Winer (2001), Kamakura et al.
(2005), Rust and Chung (2006), as well as articles that focus on customer lifetime value
(CLV) models in the marketing literature (Berger and Nasr 1998; Jain and Singh 2002; Gupta
et al. 2006), and articles that show the positive impact of improving customer satisfaction on
financial performance (Rust, Moorman and Dickson 2002; Mittal et al. 2005).
An important stream focuses on descriptive modeling of the customer base, with the
objective of measuring (Mulhern 1999) and understanding existing customer characteristics.
Within this stream, we only mention some articles that have directly motivated our modeling:
Rust, Zeithaml and Lemon (2000), Pfeifer and Carraway (2000) suggest Markov Chains as a
tool for modeling customer relationships and Netzer et al. (2008) consider hidden Markov
Chains to model the dynamics of customer relationships. We similarly model customer
dynamics using a Markovian model. Schmittlein et al. (1987) and Schmittlein and Peterson
(1994), who model the probability that a customer’s relationship continues with the firm,
motivate our assumptions for Poisson contacts and exponential life time of customers.
Subsequent research builds on the descriptive models and tries to not only measure but
also improve customer equity through optimization. Ho et al. (2006) extend the model of
Schmittlein et al. (1987) to include satisfaction and optimize investment on customer
satisfaction. Rust et al. (2004) find the optimal marketing interventions by calculating their
impact on customer lifetime value. This is done by estimating a Markov switching matrix to
model customer behavior for different marketing interventions. Venkatesan and Kumar
(2004) predict CLV and use it to optimize resource allocation for marketing contacts with the
customer. Most of this literature adopts a static optimization approach. The paper by Ching et
8
al. (2004) considers optimization of promotion budget allocation to maximize CLV, and is
one of the few that use dynamic optimization.
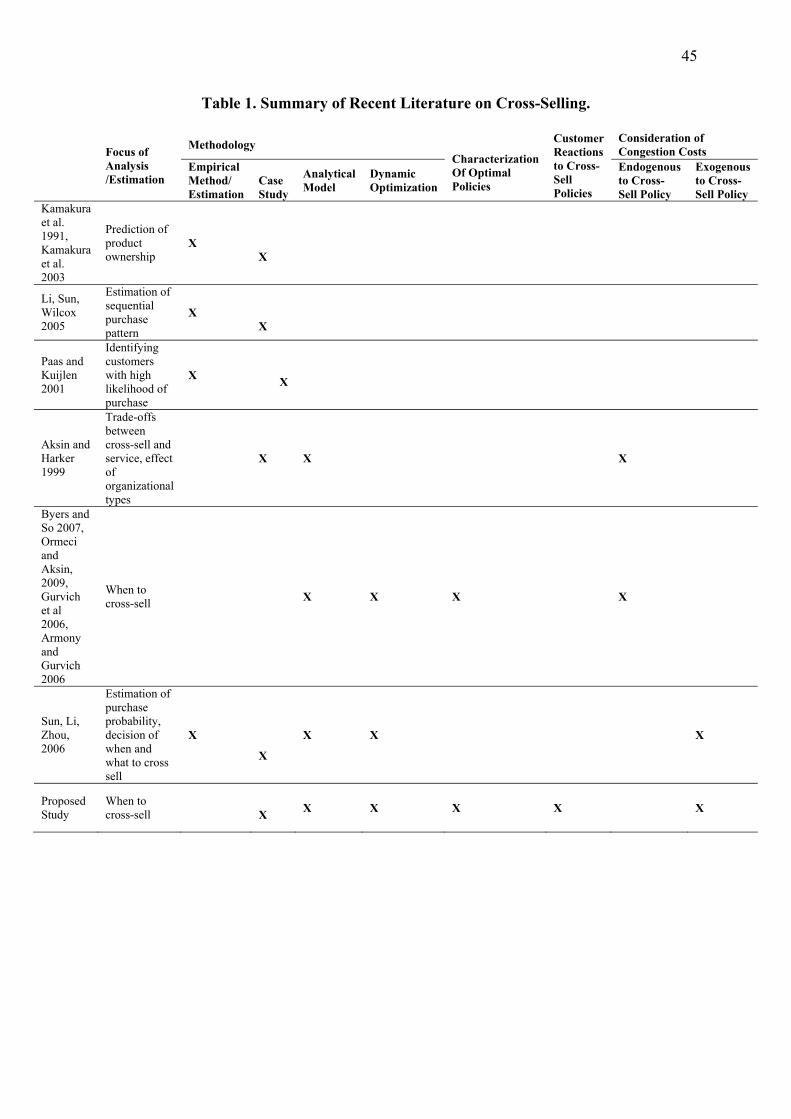
Research related to cross-selling is classified in Table 1, based on the focus of
analysis, the methodology used, whether the cross-selling reactions are modeled and whether
the structure of the optimal policies are characterized. Kamakura et al. (1991, 2003) predict
consumption of products by customers who do not use them yet, and use it to identify cross-
selling opportunities in a customer database. Paas and Kuijlen (2001) identify customers with
high likelihood of purchase of the next product given an acquisition pattern. These papers use
database marketing techniques, and infer cross-selling opportunities from one-time
measurements of current customer state while customer state may change dynamically in
response to firms’ actions. Li, Sun and Wilcox (2005) model the development of customer
demand for multiple products over time and derive a product acquisition sequence based on
customers’ individual level of demand maturity. They acknowledge the effect of previous
purchases on the purchase patterns using panel data over one year, however there is no
estimation of future reactions to marketing interventions.
There is some research on cross-selling in call centers, typically formulated as
queueing optimization problems (Aksin and Harker 1999, Ormeci and Aksin 2009, Byers and
So 2007, Armony and Gurvich 2006, Gurvich et al. 2006). While we do not consider
queueing dynamics herein, we assume that each cross-sell attempt has an exogenously
specified cost.
As Rust and Chung (2006) also note, most of the existing papers in the literature on
CLV measurement and optimization suffer from the endogeneity problem, i.e. the fact that
marketing interventions affect future profitability, however this is not taken into account in
measurement and modeling. One exception is the paper by Sun, Li, and Zhou (2006), where
the authors formulate CRM interventions as stochastic dynamic programming problems,
9
which learn from the customer history about customer characteristics and consider the future
impacts of interventions on customer characteristics while optimizing CRM intervention
decisions. That paper is more general and decision support oriented than ours, in that it
employs a general adaptive learning model with Bayesian updating on beliefs about customer
states, and numerically solves a dynamic optimization problem. The more stylized nature of
our models allows us to provide analytical results on the structural properties of the optimal
policies. Specifically, the main contribution of our paper is to propose an analytical model
that endogenously considers customer reactions to cross-selling offers when setting cross-sell
policies, provide an understanding of the change in policy structures due to these reactions
and to help understand the value of keeping this information.
10
TOWARDS A MODELING FRAMEWORK
We start this section with a discussion of customer relationship features that we wish
to model, and specific choices that we make pertaining to these features. We then formalize
these features in a Markov Decision model.
Features of a Customer Relationship
We model a single customer’s relationship with the firm, with the objective of finding
cross-selling policies that maximize the total expected discounted lifetime value for that
customer. Since the customer population is heterogeneous, such a model should be
implemented for each customer separately to find individualized cross-selling policies. We
focus on a setting where cross-selling attempts are made during customer initiated contacts
with the firm. This focus, which does not consider outbound cross-selling attempts by the
firm, enables us to restrict cross-selling related decisions to customer arrival epochs as
opposed to considering any point in time a possibility for a cross-sell attempt. An example for
such a setting would be an inbound call center with no outbound sales calls. It is assumed that
each contact with the firm generates some revenue and a successful cross-sell attempt will
result in additional revenue for that contact. Customer contacts are modeled as a random
demand arrival process. The relationship is assumed to continue as long as the customer
initiates contacts with the firm. The customer may decide to end the relationship at a random
time.
We define a customer’s maturity as his/her proximity to the point in time at which a
particular product will be desirable. We assume that each contact increases the customer’s so
called maturity, or equivalently readiness for a particular product, implying that we take the
number of contacts as a proxy for maturity. As the customer contacts the firm, their
11
relationship is considered to evolve towards the next point of purchase, which is an uncertain
point in time. This progression is the increase in customer maturity. In particular, we assume
that the sequence of the products to be offered to a customer has already been fixed, i.e. there
is a natural order (Paas and Kuijlen 2001, Li et al. 2005, Kamakura et al. 1991) to products
that will be offered to a customer. Thus, all cross-sell attempts between two purchase epochs
are made for the same product. In line with for example Li, Sun and Wilcox (2005) we can
expect the probability of purchase on a cross-sell attempt to increase as maturity is increasing.
Once a cross-selling attempt results in success, i.e. once a good or service has been bought by
the customer, the relationship moves on to the next product to be cross-sold. At such a point,
we can envisage maturity to start afresh and proceed in an increasing manner at each contact
towards the next point of purchase. In the models that we present later, whenever such a
setting is appropriate, we use a state variable representing customer maturity to track the
customer’s progression between two purchase points.
At each contact with the customer, the firm decides whether to attempt a cross-sell or
not. The decision trades off the additional revenue to be obtained with a certain probability,
representing the event that the attempt is successful, with the immediate attempt cost and
potential future value loss resulting from customer reactions in the case of failure.
Consecutive failed sales attempts are assumed to have a cumulative negative effect and are
not forgotten. However once a product has been purchased by a customer, earlier failures and
dissatisfaction resulting from them, are assumed to be forgotten. In other words, each
purchase represents a renewal point for accumulated failure related dissatisfaction. This
assumes that the most recent contact which has resulted in a positive outcome for the
customer (a purchase) dominates and allows the customer to erase earlier negative feelings.
Loosely interpreted, this assumption could be motivated by a service recovery subsequent to
repeated failures argument. Clearly, allowing for irritation effects to persist beyond the
12
purchase point would enable capturing a richer setting, though modeling this additional
feature would require tracking more state variables and would significantly affect the
tractability of the resulting models. In summary, to model reactions to failed sales attempts,
we will employ a state variable that keeps track of the number of failures since the last
purchase.
That repeated service failures or negative critical incidents decrease customer
satisfaction, which may change customer purchasing behavior, has been argued before (Smith
and Bolton, 1998; Bitner, Booms, Tetrault 1990; Bowman and Narayandas 2001). Following
these arguments, we propose to model customer reactions to failed cross-sell attempts through
model parameters that change as a function of the state variable measuring the number of
failures since the last purchase. In this paper, we focus on reactions that manifest themselves
in an increased probability of turning down the next sales offer. This is also consistent with
the utility model presented by Li, Sun and Wilcox (2005). That model estimates the utility of
a customer for a financial product as a function of financial maturity of the customer (similar
to maturity in our setting), switching costs, whether the customer owns that product from the
competitors or not, and overall satisfaction of the customer with the bank. If failed cross-sell
attempts are indeed like service failures or negative critical incidents, previous failures would
decrease customer utility by decreasing overall satisfaction. Therefore, if the number of
previous failures increases, ceteris paribus, the probability of accepting the offer is expected
to decrease. Since prior empirical evidence of such a negative effect of failed attempts
specific to cross-selling is not available, we use the following assumption in the analysis of
the specific models: The probability of success of a cross-sell attempt for an individual
decreases with an increase in the number of previous failed attempts.
A quasi-experiment provides support for this assumption. We have performed a
survey-based in-class experiment with undergraduate students as participants. The context
13
was chosen as a retail banking call center, since it is an industry where cross-selling is
pursued regularly. The session lasted about one hour for each group of respondents. In each
session three cross-sell offer scenarios were presented, interspersed among other unrelated
surveys to create a longitudinal experience effect, and the likelihood of purchase was
compared for each respondent using a repeated measures analysis.
The results support the decreasing effect of the number of previous failures on the
likelihood of purchase. However the study has its limitations because of the difficulty of
replicating cross-sell experience in a lab environment. Interested readers can refer to the
Appendix for the details of this study.
Two other forms of customer reaction to failed cross-sell attempts can be envisaged: a
reaction in the form of a lower contact rate, or an increased rate of quitting the firm. A
customer reaction in the form of a lower contact rate implies a customer that reduces their
utilization of existing services, thereby leading to a loss in revenues obtained from service-
based contacts for the firm, as well as fewer opportunities to cross-sell new products. A
reaction in the form of an increased rate of quitting implies a customer with a shorter lifetime
relative to the case without reactions, again affecting both service-based revenues and
opportunities for further sales. The modeling framework we propose allows considering both
of these forms of customer reactions, however this analysis is not pursued herein.
A Markov Decision Model
The state space is defined for the most general case, where both customer maturity and
reactions to sales attempts may be present. The system has a two-dimensional infinite state
space defined as {( ) 0 }S i j i j= , : ≤ ≤ , where i is the number of failed cross sell attempts
since the last successful cross-sell, and j is the number of contacts since the last successful
cross-sell which we take as a proxy for customer maturity. Note that j will increase with
14
each contact, whereas i may increase if there is a cross-sell attempt that is unsuccessful, but
will remain the same if there is no cross-sell attempt. Thus, i will always be less than or
equal to j . As explained before, we assume that success allows the firm to start fresh, while
failures between successes have a cumulative effect on the system. Formally, state (0 0), is a
renewal point for the system, visited when there is a successful cross-sell.
We assume that an individual customer initiates contacts with the firm according to a
Poisson process of rateλ . Depending on the nature of the firm and its products λ can be once
a month, 5 times a year, etc. When the customer ends the relationship, we call this a “death”,
and the system state is denoted by “D” with zero expected profit. The customer lifetime with
the firm is exponential with mean1 µ/ . These assumptions are supported by Schmittlein et al.
(1987). In practice, estimating the contact rate is relatively straightforward, whereas even
observing that a customer has ended the relationship may be difficult in a non-contractual
setting. We assume that a procedure to estimate the duration of the customer’s lifetime as in
Reinartz and Kumar (2003) is available.
Each contact produces expected revenue of R . Moreover, at each contact point, the
firm may attempt to cross-sell to the customer, which will bring an additional revenue of r if
the attempt is successful. An attempt fails with probability fP , while a cross-sell occurs with
probability1 fP− . Every attempt has a cost ac , which reflects the operational burden of an
attempt. Each failure reduces the overall revenue by incurring a cost of fc , where this cost
can be interpreted as a one time loss of goodwill, or simply a decrease in R , the expected
revenue of each contact. Whileλ , µ and fP can be functions of the state of a customer
( )i j, , for the base model we denote them independent of ( )i j, .
The firm aims to maximize expected discounted profits over an infinite time horizon.
The discount factor is denoted byα . The exponentiality of the customer contacts and lifetime
15
allows us to use uniformization (Lippman 1975) with normalization. Hence, we can assume
that the system observes an event only when an exponential clock with mean 1 runs out.
Then, this event is either a customer contact with probability λ or the death of the customer
with probabilityµ , where 1=+ µλ . Now let ( )v i j, be the total expected maximal α -
discounted profit of the system starting in state ( )i j, over an infinite horizon. In other words,
we observe the interaction of the customer with the firm until the customer ends the
relationship, while collecting the corresponding revenues and incurring the appropriate costs
at each contact by discounting them with a factor ofα . Then ( )v i j, is the expected value of
the total profit resulting from this process. Note that ( )v i j, is generally referred to as the
value function.
At each customer contact point, the firm decides whether to cross-sell or not
considering the perceived probability of failure fP . As a result, the firm faces two choices in
all states ( )i j, : attempting a cross-sell or not attempting. If the firm decides not to cross-sell,
then the system will earn a revenue of R, and the next event will be either a customer contact,
where the customer will be in state (i, j+1), or the end of the relationship. Hence, the
corresponding expected return will be:
)()1,( DvjivR αµαλ +++ ,
where λ denotes the probability that the customer contacts the firm again, µ is the
probability that the customer ends the relationship and the expected future return is discounted
by a factor of α. Note that since we do not earn from customers who leave the system, we set
0)( =Dv . If the firm decides to cross-sell, the expected return will be given by:
Our conjecture is that there exists a positive relation between the probability of
failure, fP , and the number of previous failures, i . That motivates one of our models (Model
1 in the following section) where a previous failed attempt increases the probability of failure,
and we use the notation ( )fP i .
The second state dimension, j , models the relationship of the customer with the firm
since the last successful cross-sell and represents customer maturity which was shown to have
a positive relation with the probability of purchase in earlier studies. We consider another
model (Model 2 in the following section) that assumes a decreasing probability of failure with
an increase in the number of contacts, where we use the notation ( )fP j .
Finally, a model in which the probability of failure is a function of both the number of
17
previous failures and the number of contacts will be analyzed (Model 3 in the following
section). This model represents the direct negative effect of a past failure as well as the
moderating effect of past contacts in the function of fP , and we use the notation ( )fP i j, .
18
ANALYSIS AND RESULTS
We propose and analyze four models starting with a model that has no state-dependent
parameters, and proceeding to models that depend either on the number of failed attempts
state ( )i , or on the customer maturity state ( )j , or both state variables. We present the models
in an order of increasing complexity; we start from the ones where the structure of optimal
policies can be characterized and proceed to the most general one, where an analytical
characterization is not possible.
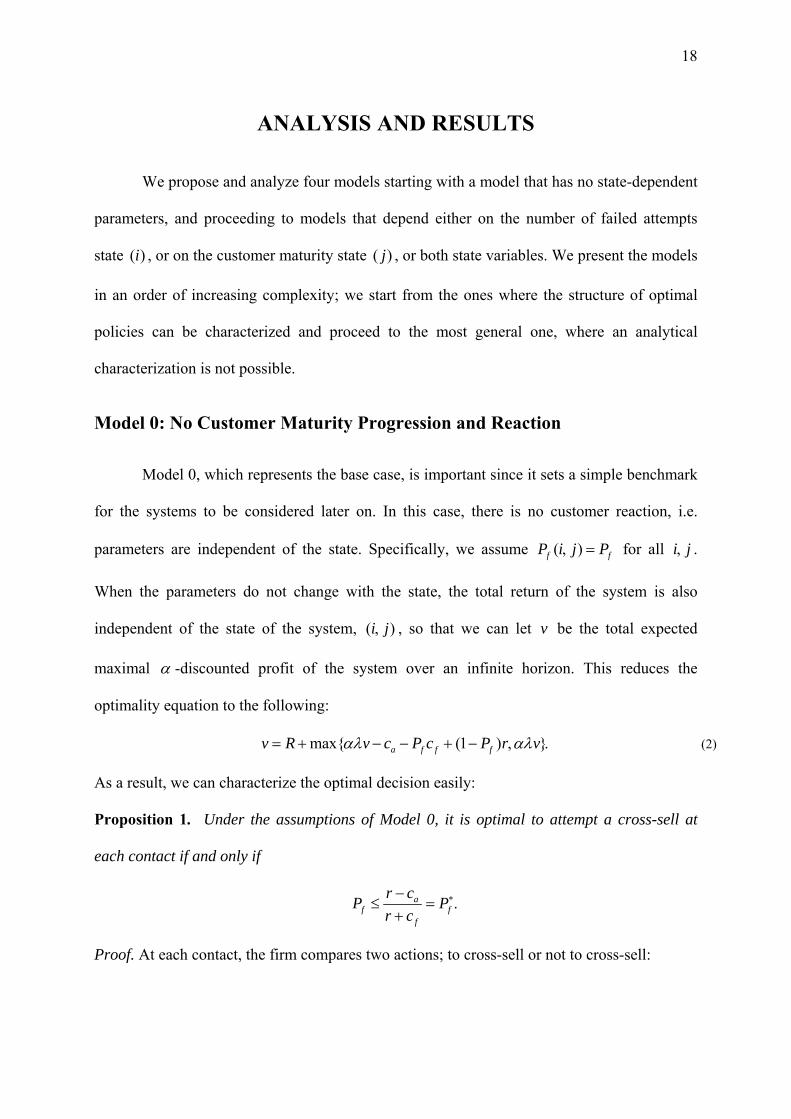
Model 0: No Customer Maturity Progression and Reaction
Model 0, which represents the base case, is important since it sets a simple benchmark
for the systems to be considered later on. In this case, there is no customer reaction, i.e.
parameters are independent of the state. Specifically, we assume ( )f fP i j P, = for all i j, .
When the parameters do not change with the state, the total return of the system is also
independent of the state of the system, ( )i j, , so that we can let v be the total expected
maximal α -discounted profit of the system over an infinite horizon. This reduces the
optimality equation to the following:
max{ (1 ) }a f f fv R v c P c P r vαλ αλ= + − − + − , . (2)
As a result, we can characterize the optimal decision easily:
Proposition 1. Under the assumptions of Model 0, it is optimal to attempt a cross-sell at
each contact if and only if
af f
f
r cP Pr c
∗−≤ = .
+
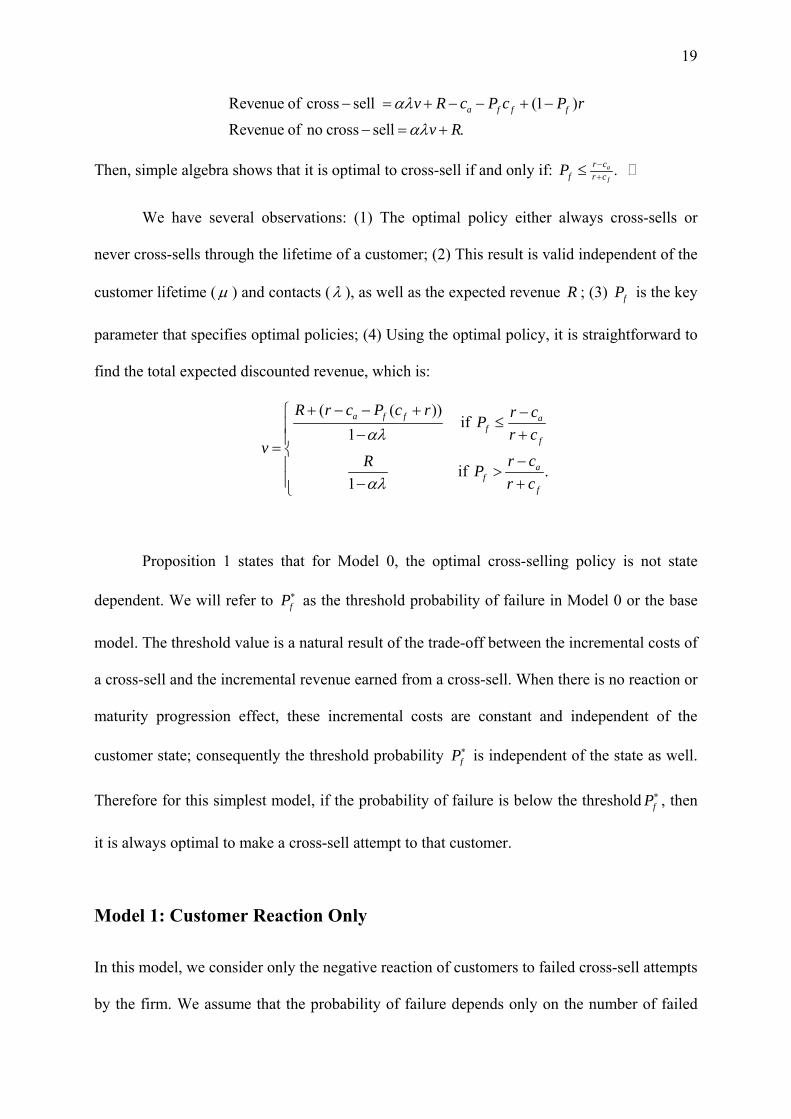
Proof. At each contact, the firm compares two actions; to cross-sell or not to cross-sell:
19
Revenue of cross sell (1 )
Revenue of no cross sella f f fv R c P c P r
v Rαλ
αλ
− = + − − + −
− = + .
Then, simple algebra shows that it is optimal to cross-sell if and only if: a
f
r cf r cP −
+≤ .
We have several observations: (1) The optimal policy either always cross-sells or
never cross-sells through the lifetime of a customer; (2) This result is valid independent of the
customer lifetime (µ ) and contacts (λ ), as well as the expected revenue R ; (3) fP is the key
parameter that specifies optimal policies; (4) Using the optimal policy, it is straightforward to
find the total expected discounted revenue, which is:
( ( ))if
1
if1
a f f af
f
af
f
R r c P c r r cPr c
vr cR Pr c
αλ
αλ
+ − − +⎧ −≤⎪ − +⎪= ⎨
−⎪ > .⎪ − +⎩
Proposition 1 states that for Model 0, the optimal cross-selling policy is not state
dependent. We will refer to fP∗ as the threshold probability of failure in Model 0 or the base
model. The threshold value is a natural result of the trade-off between the incremental costs of
a cross-sell and the incremental revenue earned from a cross-sell. When there is no reaction or
maturity progression effect, these incremental costs are constant and independent of the
customer state; consequently the threshold probability fP∗ is independent of the state as well.
Therefore for this simplest model, if the probability of failure is below the threshold fP∗ , then
it is always optimal to make a cross-sell attempt to that customer.
Model 1: Customer Reaction Only
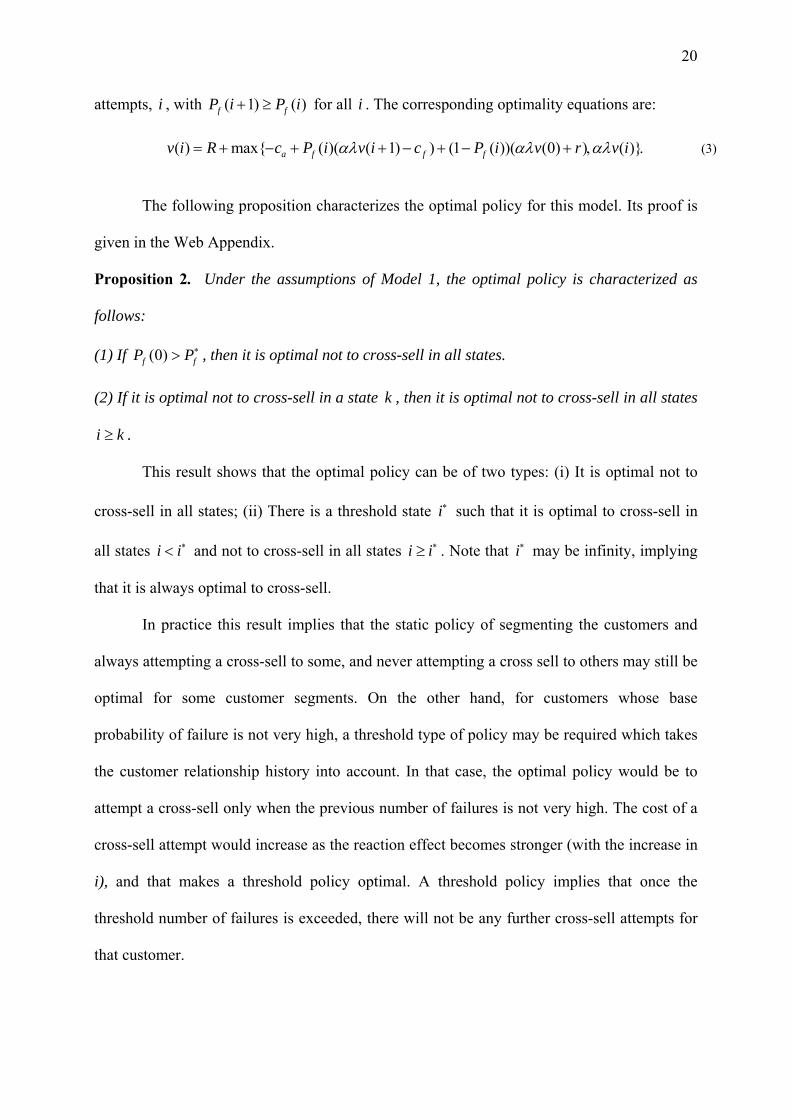
In this model, we consider only the negative reaction of customers to failed cross-sell attempts
by the firm. We assume that the probability of failure depends only on the number of failed
20
attempts, i , with ( 1) ( )f fP i P i+ ≥ for all i . The corresponding optimality equations are:
( ) max{ ( )( ( 1) ) (1 ( ))( (0) ) ( )}a f f fv i R c P i v i c P i v r v iαλ αλ αλ= + − + + − + − + , . (3)
The following proposition characterizes the optimal policy for this model. Its proof is
given in the Web Appendix.
Proposition 2. Under the assumptions of Model 1, the optimal policy is characterized as
follows:
(1) If (0)f fP P∗> , then it is optimal not to cross-sell in all states.
(2) If it is optimal not to cross-sell in a state k , then it is optimal not to cross-sell in all states
i k≥ .
This result shows that the optimal policy can be of two types: (i) It is optimal not to
cross-sell in all states; (ii) There is a threshold state i∗ such that it is optimal to cross-sell in
all states i i∗< and not to cross-sell in all states i i∗≥ . Note that i∗ may be infinity, implying
that it is always optimal to cross-sell.
In practice this result implies that the static policy of segmenting the customers and
always attempting a cross-sell to some, and never attempting a cross sell to others may still be
optimal for some customer segments. On the other hand, for customers whose base
probability of failure is not very high, a threshold type of policy may be required which takes
the customer relationship history into account. In that case, the optimal policy would be to
attempt a cross-sell only when the previous number of failures is not very high. The cost of a
cross-sell attempt would increase as the reaction effect becomes stronger (with the increase in
i), and that makes a threshold policy optimal. A threshold policy implies that once the
threshold number of failures is exceeded, there will not be any further cross-sell attempts for
that customer.
21
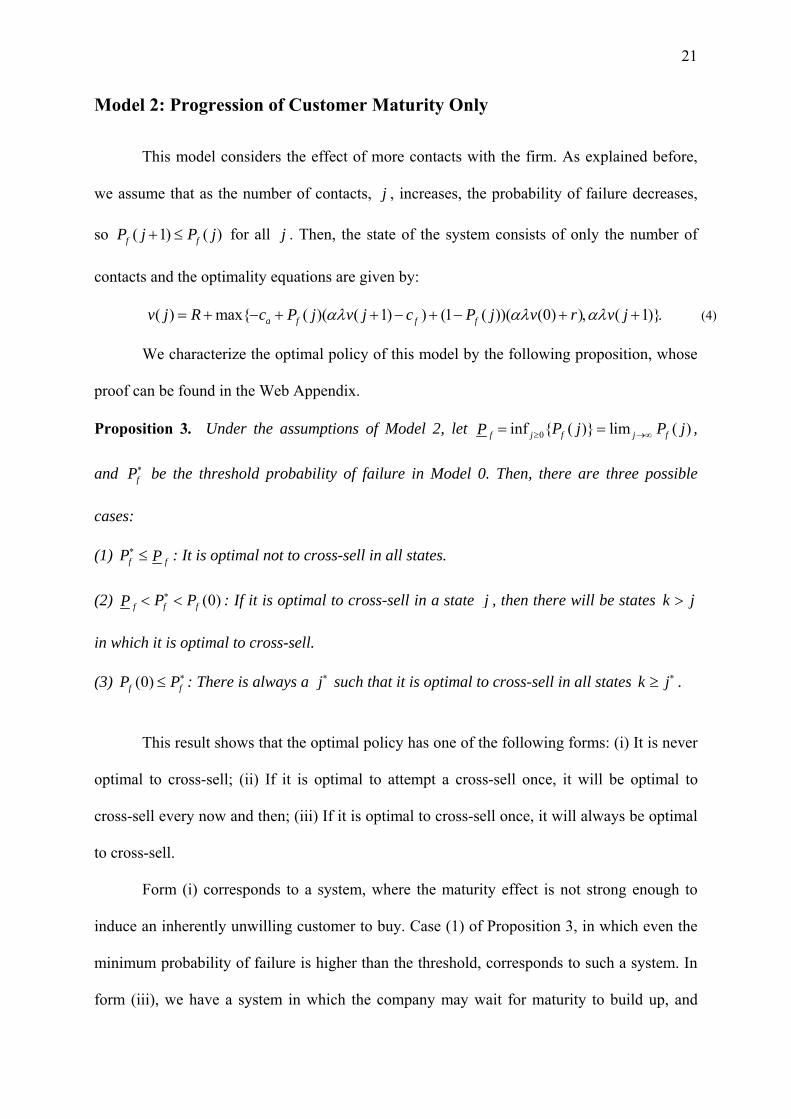
Model 2: Progression of Customer Maturity Only
This model considers the effect of more contacts with the firm. As explained before,
we assume that as the number of contacts, j , increases, the probability of failure decreases,
so ( 1) ( )f fP j P j+ ≤ for all j . Then, the state of the system consists of only the number of
contacts and the optimality equations are given by:
( ) max{ ( )( ( 1) ) (1 ( ))( (0) ) ( 1)}a f f fv j R c P j v j c P j v r v jαλ αλ αλ= + − + + − + − + , + . (4)
We characterize the optimal policy of this model by the following proposition, whose
proof can be found in the Web Appendix.
Proposition 3. Under the assumptions of Model 2, let 0inf { ( )} lim ( )j f j ff P j P jP ≥ →∞= = ,
and fP∗ be the threshold probability of failure in Model 0. Then, there are three possible
cases:
(1) f fP P∗ ≤ : It is optimal not to cross-sell in all states.
(2) (0)f ff P PP ∗< < : If it is optimal to cross-sell in a state j , then there will be states k j>
in which it is optimal to cross-sell.
(3) (0)f fP P∗≤ : There is always a j∗ such that it is optimal to cross-sell in all states k j∗≥ .
This result shows that the optimal policy has one of the following forms: (i) It is never
optimal to cross-sell; (ii) If it is optimal to attempt a cross-sell once, it will be optimal to
cross-sell every now and then; (iii) If it is optimal to cross-sell once, it will always be optimal
to cross-sell.
Form (i) corresponds to a system, where the maturity effect is not strong enough to
induce an inherently unwilling customer to buy. Case (1) of Proposition 3, in which even the
minimum probability of failure is higher than the threshold, corresponds to such a system. In
form (iii), we have a system in which the company may wait for maturity to build up, and
22
once it has, it is always possible to try to cross-sell. This happens when the maximum
probability of failure, i.e., initial probability of failure (0)fP is less than the threshold fP∗ , as
in Case (3). In form (ii), we have a weaker characterization: If maturity becomes strong
enough to try cross-selling at some point, it will be strong enough again after a while. This
corresponds to systems such as Case (2) of Proposition 3, where the initial probability of
failure has a moderate value. In numerical experiments, not reported herein for brevity,
when (0)f fP P∗≤ , the optimal policy cross-sells in all states, whereas when (0)f ff P PP ∗< < ,
there exists a state j∗ such that it is optimal to cross-sell in all states k j∗≥ .
Model 3: Both Progression of Customer Maturity and Reaction
In practice, as the relationship continues, customer maturity increases, and in addition
to that, as there are failed cross-sell attempts, customers may react. Settings where both
effects are present can be modeled by a probability of failure that depends on both state
variables i and j . The system starts with a given probability of failure, Pf(0,0). Every contact
between two purchase points will lead to an increase in the state j , which implies a steady
decreasing effect on ( )fP i j, . This decrease in ( )fP i j, will occur irrespective of the cross-
sell policy. On the other hand, the state variable i will at times be increasing and at others
remain the same, depending on the cross-sell decisions and outcomes at each contact. This
implies that there will at times be an opposing effect of reaction, to that of maturity,
increasing ( )fP i j, . Whenever the maturity effect is not strong enough to dominate throughout,
( )fP i j, will exhibit a non-monotone structure. The optimality equations for this model are
given by:
)}.1,( ),)0,0())(,(1())1,1()(,(max{),(
+
+−+−+++−+=
jivrvjiPcjivjiPcRjiv fffa
αλ
αλαλ
23
When the form of ( )fP i j, and all the parameter values are specified, the solutions of these
equations can always be computed numerically by using one of the standard methods, such as
the value or the policy iteration algorithms (Puterman 1994). As before, for cases when the
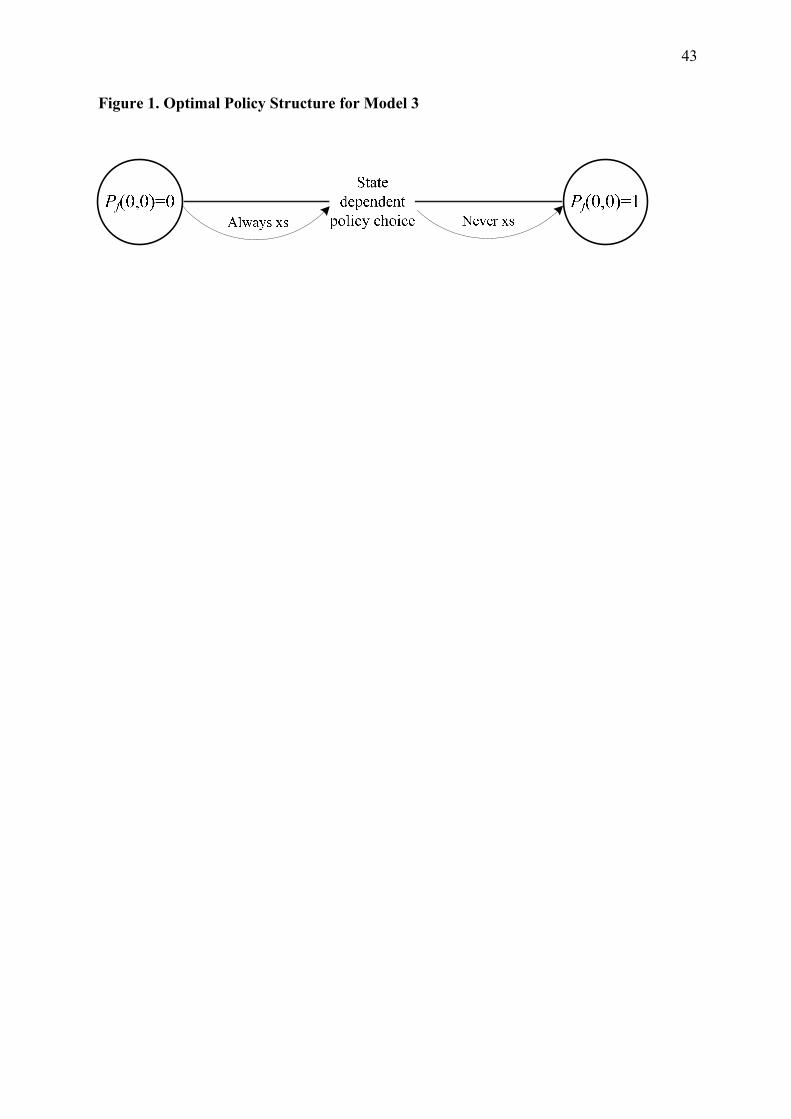
initial probability of failure, Pf(0,0), is sufficiently high or low, optimal policies will be of the
type never cross-sell or always cross-sell respectively. For the values of Pf (0,0) in between
these values, the optimal policy shows a dynamic behavior (see Figure 1). In Model 3, unlike
Model 1 and 2, the optimal policy structure cannot be characterized by a single threshold,
when it is dynamic, mainly due to the non-monotonic form of ( )fP i j, . Rather, for each i
value there will be a threshold on j , and for each j value there will be a threshold on i ,
resulting in an on-off type dynamic policy that alternates between attempting a cross-sell on
some contacts (on) and not attempting to cross-sell on others (off).
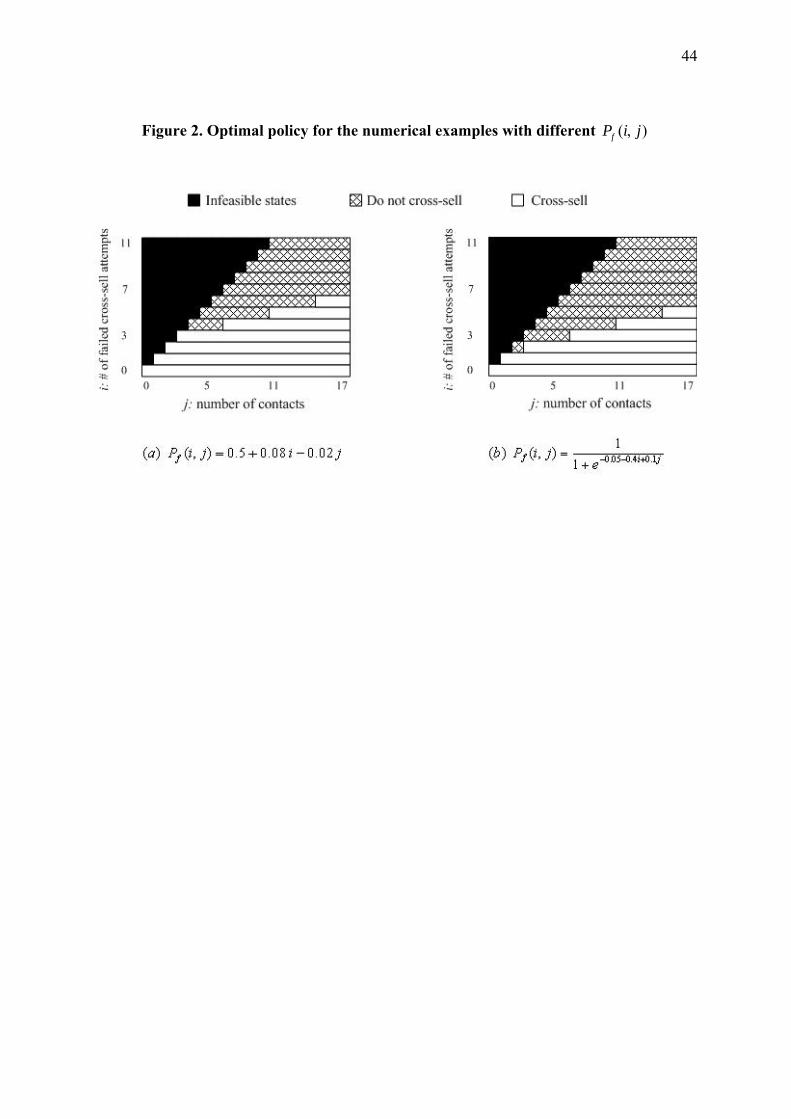
We illustrate this behavior of the optimal cross-selling policy through two numerical
examples. For these examples, the cost of a cross-sell attempt is set as 1ac = , and the one
time cost of cross-sell attempt failure is set to 2fc = . The other parameters are specified as
R = 1, r = 7, 111=µ , 11
10=λ , where the mean time between any two transitions is 11 time
units. Finally, we note that the computational methods for evaluating the value functions and
the optimal policy need a finite state space, which can be obtained by bounding the number of
contacts, j . For the example, the number of contacts is bounded by 100. We can verify that
the probability of reaching the boundary states (i.e., the states with j = 100) is very low for
these examples.
Example 1
This example considers the simplest possible form for ( )fP i j, , which is a linear function of
the reaction effect and the customer maturity effect. This form ignores any dependency
between i and j and treats them as linear effects on the base probability of failure:
24
))1,min(,0max(),( 210 jaiaajiPf ++=
The max() and min() functions ensure that ),( jiPf is between 0 and 1. Figure 2 (a)
illustrates the optimal policy for 0a =0.5, 1a =0.08 and 2a =-0.02. In the figure, for each state,
when the action is “do not cross-sell”, the next state is reached with a horizontal move to the
right, and when the action is “cross-sell”, the next state is reached with an upwards diagonal
move if it is a failure, while the system is renewed and goes to state (0,0) if it is a success.
Consider the case when the relationship starts at state (0,0). Clearly the actions chosen do not
demonstrate a specific pattern and after the first failure occurs, we observe an on-off pattern
for cross-sell attempts. From this figure, we also observe the thresholds for each i and j. For
example, when i=4, the threshold on j is 7 so that it is optimal to cross-sell for j≥7, and it is
optimal not to cross-sell for 4≤j≤6 (recall that by definition, j cannot take values that are less
than i). In words, with four prior failed attempts, making another cross-selling attempt will
not be optimal until the customer’s maturity reaches or exceeds seven contacts. Similarly, if
for e.g., j=17, the threshold on i is 6, implying that it is optimal to cross-sell for i≤6, and not to
cross-sell otherwise. In other words, when the number of contacts has reached 17, the
negative effect of failed attempts up to six failed attempts can be absorbed however a seventh
failed attempt’s costs will exceed its potential benefits.
Example 2
In this example, we use the well-known logit model to represent ( )fP i j, , the probability that
a certain cross-sell attempt fails, where the underlying utility function is assumed to be linear
in both the reaction and the customer maturity effects. More explicitly, for a customer
exposed to a cross-sell attempt, the relative utility of not buying the proposed product when
compared to buying is denoted by ),( jiU and given as:
,),( 210 εβββ +++= jijiU
25
where ε is the random component of this utility and follows a logistic distribution. Then the
probability of failure is derived as:
.1
1),( ),( jiUf ejiP −+=
We expect that the relative utility of not buying ),( jiU , as well as the probability of
failure ),( jiPf , increases in the reaction effect i, and decreases in the customer maturity
effect j. For the numerical example the parameters are set as 0β = 0.05, 1β = 0.4 and 2β = -
0.1. The resulting dynamic policy is demonstrated in Figure 2 (b). We observe that the failure
effect is stronger in this example and thus the thresholds on i are lower.
A related question is how much value would be lost if negative reactions were present
but ignored in planning? The case when a manager does not consider customer state dynamics
leads to a static policy which never cross-sells or which always cross-sells irrespective of the
system state. The best static policy for the numerical examples we consider is the always
cross-sell policy for both functional forms. We compare (0 0)v , for Model 3 when using the
always cross-sell policy, with (0 0)v , under an optimization of Model 3 to calculate the
percent value loss from ignoring reactions. The value loss is found as 12.5% and 15.2%
respectively for Example 1 and Example 2. The magnitude of this loss depends on problem
parameters, and can be quite significant. For example it can go up to 30.8% for Example 1
(for 0a = 0.6, 1a = 0.08, 2a = -0.04) and up to 58.1 % for Example 2 (for 0β = 0.05, 1β = 0.1
and 2β = -0.1).
26
AN EXAMPLE FROM THE FIELD
In this section we describe cross-selling at the inbound call center of a European retail
bank, based on a limited cross-sell-attempts-and-results-by-date data set, and follow-up with
managers at the call center. The purpose is to illustrate a setting where cross-selling is pursued
as an important sales tactic through a descriptive analysis of the data, and to demonstrate how
the probability of failure can be estimated in this setting.
The Data
The data set included dates and outcomes (i.e. customers’ responses to each offer) of
cross-sell attempts at the bank’s inbound call center for 149 randomly selected customers,
over a two year period (2006-2007). All attempts were made on inbound calls or customer
initiated contacts. Each response was one of three alternatives: “Customer does not want to
buy: Reject”, “Customer wants to buy in the future: Maybe Later”, or “Sales closed: Accept”.
Managers stated that a cross-sell attempt only occurred when a customer indicated willingness
to hear an offer and when call center congestion was deemed sufficiently low. Thus the data
reflects the case of attempts where the customer has indicated a willingness to listen upfront
and waiting times on hold (if any) were relatively low.
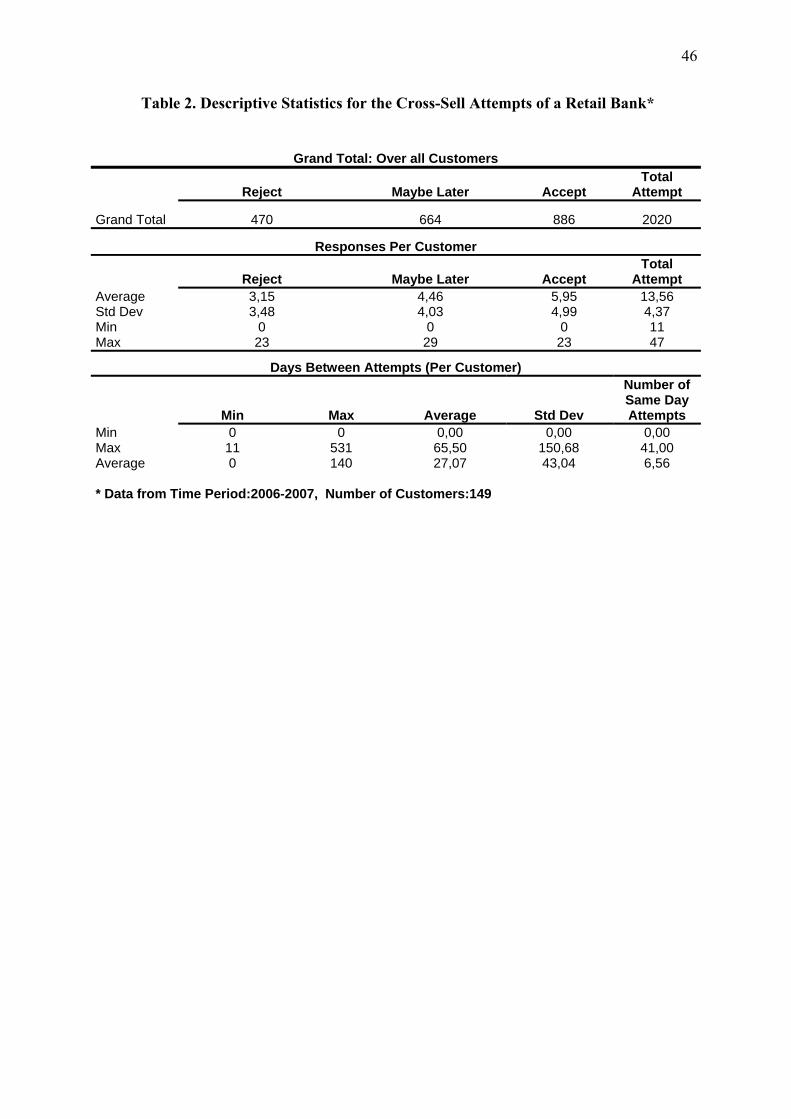
The data set includes a total of 2020 cross-sell attempts. Out of the 2020 attempts, 978
were made on the same date with another offer; therefore there are 1042 distinct attempt days
for 149 customers. The data only specified the date of the contact; hence it is not clear
whether two attempts on a single day were made during the same call or during different calls
on the same day, and whether the products being offered were related in any way. A summary
of descriptive statistics is given in Table 2.
Cross-Selling as a Prevalent Practice at the Call Center
44% of all attempts resulted in success, while 33% of the time, the customers stated
that they could buy at another time. On average, the number of products sold per customer
27
was 5.95 (SD=4.99). A customer faced on average 13.55 cross-sell attempts, and rejected 3.15
of them, while postponing the decision in 4.46 of the cases. We were not provided with
information regarding the products that were offered in these cross-sell attempts; however
were informed that the product portfolio consisted of 20-30 products. The numbers regarding
attempts and sales indicate that this bank pursues cross-selling in its inbound call center
channel widely, regularly, and with success.
Descriptive Analysis of Cross-Sell Attempt Patterns
An analysis of time between cross-sell attempts reveals that the mean time between
attempts is 25.31 days, with a large standard deviation of 54.28 days. Each customer
experiences a large dispersion between minimum days and maximum days between two
attempts. While part of the variation in time between attempts can be attributed to random
calling patterns by customers, skipped attempts due to unwillingness expressed by customers,
and congestion related controls at the call center, these are not the only factors. We are
informed that on average a customer calls the bank several times a month. Follow-up with
managers at the bank indicates that whenever a customer rejects an offer, a new offer for the
same product is not made until a fixed number of days later. We explore the combined effect
of all factors with the data next.
The effect of customer response on the time until the next attempt is analyzed using
the One-Way ANOVA feature of SPSS 16, with three samples of time data, derived from 149
customers’ 1872 responses after which there was another attempt (last data point for each
customer was thus discarded). The means are found to be different for the three responses
(F(2,1869)=27.29, p<0.0001). The next cross-sell attempt was made 15.85 days after a
successful cross-sell, while this time increased to 29.12 days after a “maybe later” response,
and it further increased to a mean time of 38.22 days after a failed attempt. In addition,
multiple comparisons showed that all pairwise differences are also significant.
28
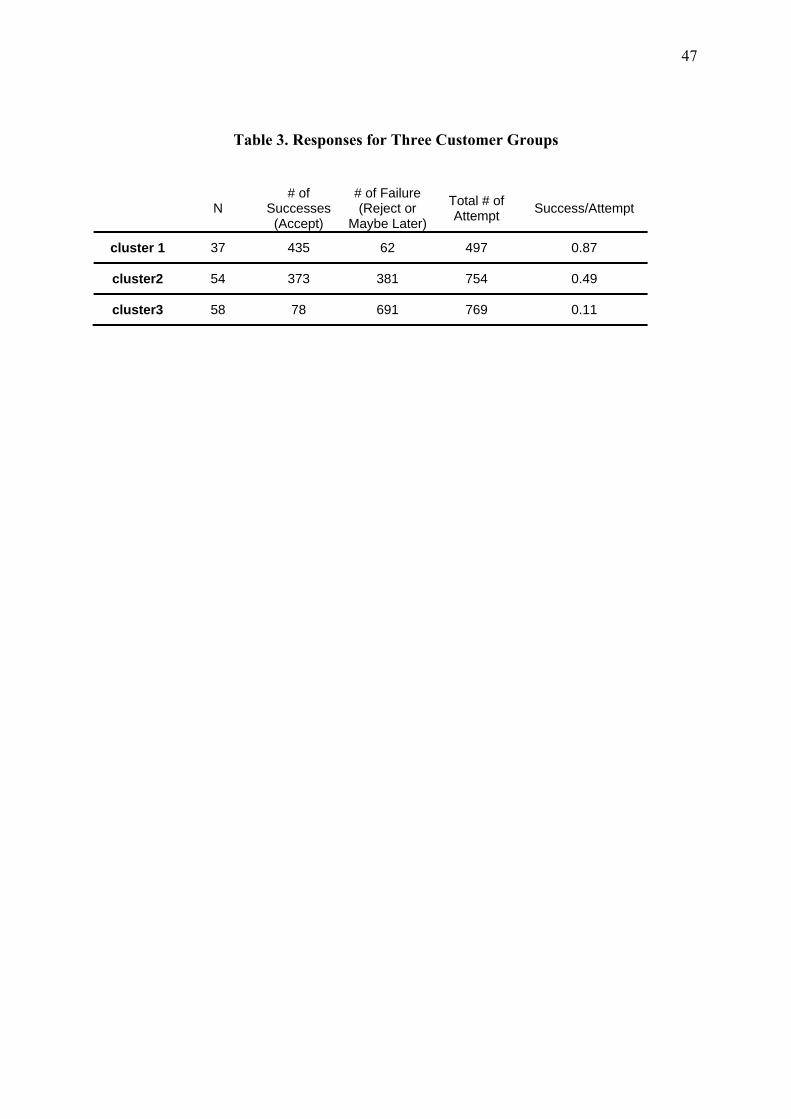
Cross-selling at the call center does not appear to be individualized by customer or
segment. For example 21 customers or 14% of the pool of 149 never bought a product and
293 attempts (14% of the total) were made to these customers without success. To explore
this further, we performed a cluster analysis using the K-Means Cluster feature of SPSS 16.
Accordingly, customers can be clustered in 3 groups based on their success/attempt ratio, with
a significant number of customers in each group (See Table 3). The number of cross-sell
attempts for these clusters were not found to be significantly different.
On Estimating the Probability of Failure
Our collaboration with the bank did not include a model implementation phase,
however in this section we illustrate how the data could be used to estimate the probability of
failure as a function of previous contacts and failures, for eventual use within the dynamic
optimization model. We point out limitations of our current dataset, which when removed
would lead to a superior empirical analysis. The current estimation should be viewed as an
approximate one.
As presented in Example 2, we consider a random utility model for the cross-selling
related choice a customer faces. The observable factors that affect this choice are the number
of failures and the number of contacts. We consider both the reject and maybe later responses
by customers as failures and assume renewal (i.e. the i state variable is set to zero) as in the
model, subsequent to a purchase decision. Recall that the current dataset does not include the
number of contacts by customers. Only attempt dates and their outcomes are available. In
terms of our earlier notation, this implies that we do not have data for the state variable j. To
overcome this shortcoming, we take time in days as a proxy for the j variable. No renewal of
this is assumed after purchase decisions. We take the first day of our dataset as time zero for
each customer, even though this is not ensured in the data. Clearly, a richer dataset with
additional information like the type of product being offered or customer demographics would
29
enable capturing more observable factors that affect purchase.
In the random utility model, unobservable (to the researcher) factors are accounted for
through a random component. Assuming an extreme value distribution for this random
component would give us the well known logit model. However the clustering portion of our
descriptive analysis suggests the presence of heterogeneity. In our setting, we expect factors
like the customer attitude towards impulse purchase to vary randomly, and as these are not
accounted for by the observable portion of the model, the logit model will be a
misspecification. To account for this, rather than estimating a standard logit model, we
consider a random coefficients logit formulation, where the coefficients of the observable
variables are assumed to be normally distributed. Our implementation follows Chapter 6.7 of
Train (2003). Results of this analysis are presented in Table 4. We observe that the means of
the coefficients for the number of failures and the number of contacts (days) have signs that
are consistent with our assumptions in the modeling part of the paper. Thus, the number of
failures has a positive coefficient, and the number of days has a negative coefficient. The
standard deviation of each random coefficient (including the constant) is significant,
indicating that there is heterogeneity with respect to these in the sample. The Share < 0
column indicates that all of the customers in the dataset have a positive coefficient for i, while
53% have an estimated coefficient that is negative for j, as assumed in the models. For the
constant, 57% have a positive estimated value, implying that higher values for the base
probability of failure are prevalent in the sample. These results provide support to our
modeling premise, that failed cross-sell attempts may have a negative effect on customer’s
purchase probabilities. They further highlight the importance of considering customer
heterogeneity in such an analysis.
An important issue that our current illustrative analysis ignores is endogeneity. In
particular, it is possible that the observable variables which reflect the firm’s cross-sell policy
30
are correlated with the unobservable shocks captured by the random component. For example,
we know that congestion in the call center affects cross-sell decisions and it is not unlikely
that long waits created by this congestion will affect the customer’s purchase probability. The
firm’s managers may take some of the unobservable factors into account in setting their cross-
sell policies, thus inducing a correlation between the observable variables and the random
shock. Ignoring this correlation may result in a bias (Villas-Boas and Winer 1999), however
we defer such an analysis to future research.
Recommendations
The analysis of the cross-sell data indicates that both previous failed attempts and contacts
may be playing a role in determining customer purchase probabilities. The importance of
customizing cross-sell policies is underlined by the demonstrated heterogeneity. Based on the
proposed modeling framework, we can qualitatively state that the bank could further enhance
their cross-selling performance by customizing cross-sell policies to identify segments where
cross-selling can be pursued more aggressively (always cross-sell), those where resources are
not wasted on cross-selling (never cross-sell), and where cross-sell attempts are threshold
based with the possibility of state dependent thresholds (on-off structure). Such a
segmentation would require additional demographic or customer purchase history data to
further explain some of the heterogeneity. An implementation of the model would also require
data on revenues and costs. With such data, it would be possible to numerically compute the
threshold value as well as the precise form of the on-off policy.
31
MANAGERIAL IMPLICATIONS
This paper draws attention to possible negative reactions by customers to failed cross-
sell attempts. It presents a modeling framework that allows the endogenization of reactions to
cross-selling in a forward-looking optimization model. Employing stochastic dynamic
programming methodology enables characterizing the structural properties of optimal policies
under different assumptions about customer purchase behavior in response to sales attempts.
The analysis indicates that whenever the probability of failure is not dependent on customer
history (as modeled by Model 0), cross-sell policies will take one of two forms: always cross-
sell or never cross-sell. Once monotonic dynamic effects, as those modeled by Model 1 or 2
are introduced, optimal cross-sell policies take on a threshold type structure. The value of the
threshold depends on the base probability of failure, and for very high or low values these
threshold policies may reduce to always cross-sell or never cross-sell. Finally, if the
probability of failure as a function of customer history is non-monotonically dynamic as in
Model 3, for certain values of the base probability of failure, optimal policies will be of the
on-off type (representing state dependent thresholds).
In Model 1 and Model 2 we were able to characterize some structural properties of the
optimal cross-selling policies. These results were obtained under very general conditions,
assuming no specific forms for the probability of failure functions, only requiring
monotonicity of these. If future empirical research reveals additional characteristics of these
functions, the structural properties of the optimal policies may also be strengthened further.
Both the threshold based and on-off structures highlight the role the cost of excessive
cross-selling (direct as well as in the form of customer reactions) plays in optimal policies.
Managers need to be aware of this cost, and take it into account in their cross-selling
decisions. Cross-selling to all customers, at every possibility will result in important value
loss for firms.
32
APPENDIX Quasi-Experiment
1: Design and Procedure
The context was chosen as a retail banking call center, which is a context with which all of the
respondents are familiar. An interview with the branch manager on campus indicated that a
credit card offer during a contact with their bank is a realistic cross-selling scenario for the
students. Pilot tests with other students from the same business school confirmed that the
respondents could identify themselves with the situation. In addition, follow-up questions
verified that respondents were familiar with call centers and cross-selling: 91% percent of the
respondents called a call center before, and 70% of them faced a cross-sell offer before. The
respondents were presented with a scenario, which they were asked to assume while
answering the questions that followed (See Part 3). The scenario presented in the experiment
described an initial situation with a given financial maturity, satisfaction level, switching
costs, and products owned at competitors, as can be seen in part I of the survey. No
information was given about additional credit cards that they may be using in order to allow
the respondents to consider their real situation while responding to thecross-sell offer.
The session lasted about one hour for each group of respondents. After the first question (M=
3.39 SD=1.55 N=94), respondents answered a 19 page survey for an unrelated study.
Subsequently, a second scenario was presented with a repeated credit-card offer. Respondents
were asked to respond only if they had not accepted the previous offer (M=2.56 SD=1.39
N=66). The study continued with a 10 page unrelated survey. Finally, the third part of the
study was presented, repeating the cross-sell attempt if they had not declared that they
accepted the offer in the earlier attempts (M=1.84 SD=1.03 N=62). Such a design enabled us
33
to let each respondent create their own history of contacts (with rejected or accepted offers)
and to respond given that history, thus minimizing potential demand effects which would be
present if we had just told them the outcome of prior attempts. Finally, right after the third
cross-sell scenario, a follow-up questionnaire was presented (see Part 3). 33% of all
respondents (47% of those who rejected all three offers) stated their primary reason for
rejecting the offer as the fact that they did not like receiving repeated credit card offers. Mean
response for the feeling scale among these respondents was 2.71, which confirmed their
statement of dislike (M= 3.08 among respondents who rejected the offers for other reasons,
M=3.85 among respondent who accepted an offer, and M=3.22 among all respondents). This
suggests the possibility of a “reaction” effect underlying the results that will be presented
next.
2: Results
Hypothesis 1 considers whether failed cross-sell attempts affect the probability of accepting a
cross-sell offer for an individual. Since the relative probability of success for each individual
was the main interest, a repeated measures within-subject analysis was chosen (Girden 1992).
We performed an analysis of variance of the responses of respondents to credit-card offers
using the Generalized Linear Model with Repeated Measures feature of SPSS 16, with the
number of previous failures (i=0,1,2) as a within-subject factor. The sphericity assumption
was met, and the main effect of number of previous failures was significant, (F(2,122)=20.33,
p<0.001, ηp 2 =0.25) for all respondents. When we narrowed down the analysis focusing on
only those respondents who stated their irritation as the primary reason for rejecting the third
offer, the effect became stronger (F(2,60)=18.50, p<0.001, ηp2 =0.381). The significant effect
of the number of failures was analyzed by single degree of freedom, repeated contrasts. The
likelihood of accepting the offer decreased from first offer (M=2.71, SD=1.16) to second offer
(M=2.35, SD=1.25, F(1,61)=4.92, p<0.03), and from second offer to third offer (M=1.48,
34
SD=0.8, F(1,61),=19.83, p<0.001) . In summary, survey results fail to reject Hypothesis 1.
This lends support for a model in which the probability of failure increases in i.
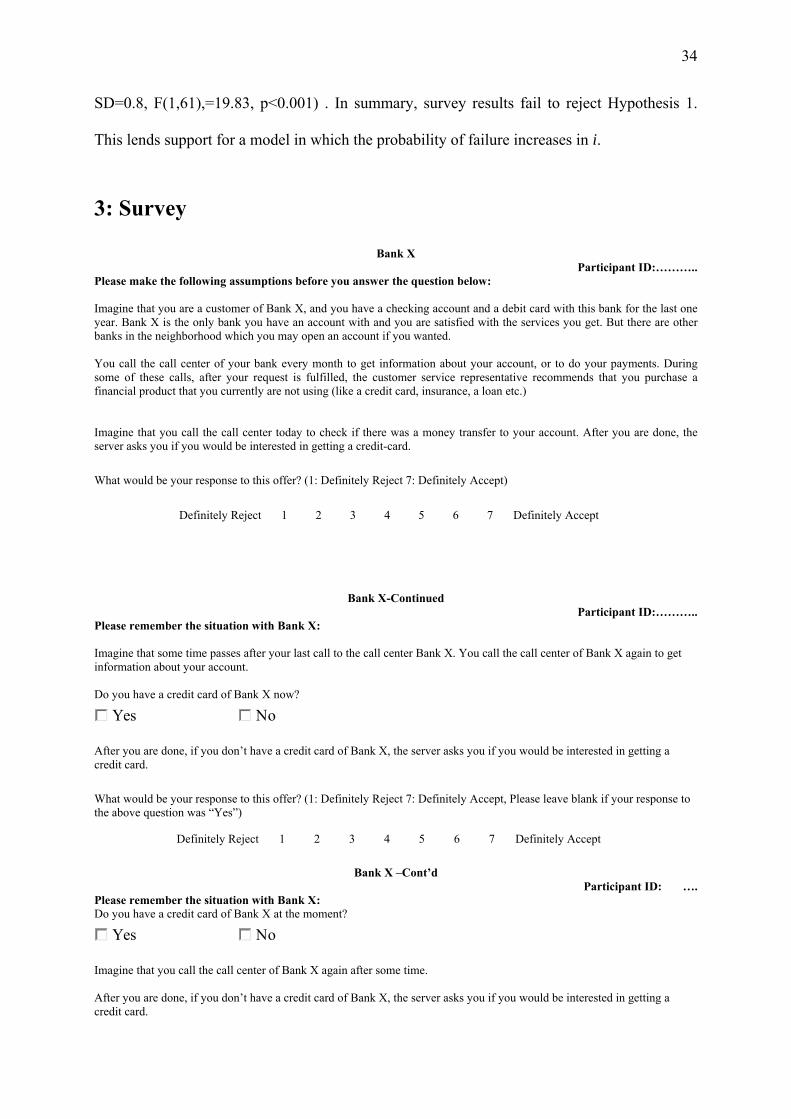
3: Survey
Bank X Participant ID:………..
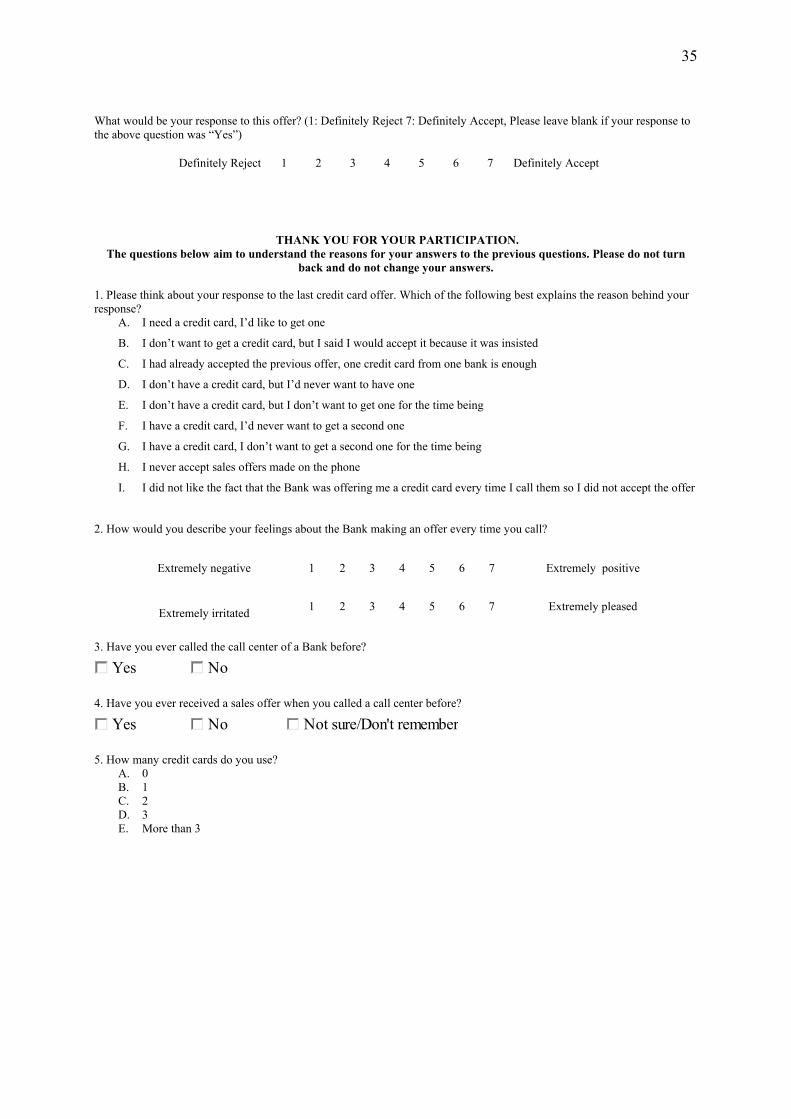
Please make the following assumptions before you answer the question below: Imagine that you are a customer of Bank X, and you have a checking account and a debit card with this bank for the last one year. Bank X is the only bank you have an account with and you are satisfied with the services you get. But there are other banks in the neighborhood which you may open an account if you wanted. You call the call center of your bank every month to get information about your account, or to do your payments. During some of these calls, after your request is fulfilled, the customer service representative recommends that you purchase a financial product that you currently are not using (like a credit card, insurance, a loan etc.) Imagine that you call the call center today to check if there was a money transfer to your account. After you are done, the server asks you if you would be interested in getting a credit-card.
What would be your response to this offer? (1: Definitely Reject 7: Definitely Accept)
Definitely Reject 1 2 3 4 5 6 7 Definitely Accept
Bank X-Continued Participant ID:………..
Please remember the situation with Bank X: Imagine that some time passes after your last call to the call center Bank X. You call the call center of Bank X again to get information about your account. Do you have a credit card of Bank X now?
Yes No
After you are done, if you don’t have a credit card of Bank X, the server asks you if you would be interested in getting a credit card.
What would be your response to this offer? (1: Definitely Reject 7: Definitely Accept, Please leave blank if your response to the above question was “Yes”)
Definitely Reject 1 2 3 4 5 6 7 Definitely Accept
Bank X –Cont’d
Participant ID: …. Please remember the situation with Bank X: Do you have a credit card of Bank X at the moment?
Yes No
Imagine that you call the call center of Bank X again after some time. After you are done, if you don’t have a credit card of Bank X, the server asks you if you would be interested in getting a credit card.
35
What would be your response to this offer? (1: Definitely Reject 7: Definitely Accept, Please leave blank if your response to the above question was “Yes”)
Definitely Reject 1 2 3 4 5 6 7 Definitely Accept
THANK YOU FOR YOUR PARTICIPATION. The questions below aim to understand the reasons for your answers to the previous questions. Please do not turn
back and do not change your answers. 1. Please think about your response to the last credit card offer. Which of the following best explains the reason behind your response?
A. I need a credit card, I’d like to get one
B. I don’t want to get a credit card, but I said I would accept it because it was insisted
C. I had already accepted the previous offer, one credit card from one bank is enough
D. I don’t have a credit card, but I’d never want to have one
E. I don’t have a credit card, but I don’t want to get one for the time being
F. I have a credit card, I’d never want to get a second one
G. I have a credit card, I don’t want to get a second one for the time being
H. I never accept sales offers made on the phone
I. I did not like the fact that the Bank was offering me a credit card every time I call them so I did not accept the offer
2. How would you describe your feelings about the Bank making an offer every time you call?