44
Modeling decisions: influence diagrams Modeling decisions: influence diagrams and probabilistic networks and probabilistic networks James Peterson, OR CFWRU James Peterson, OR CFWRU
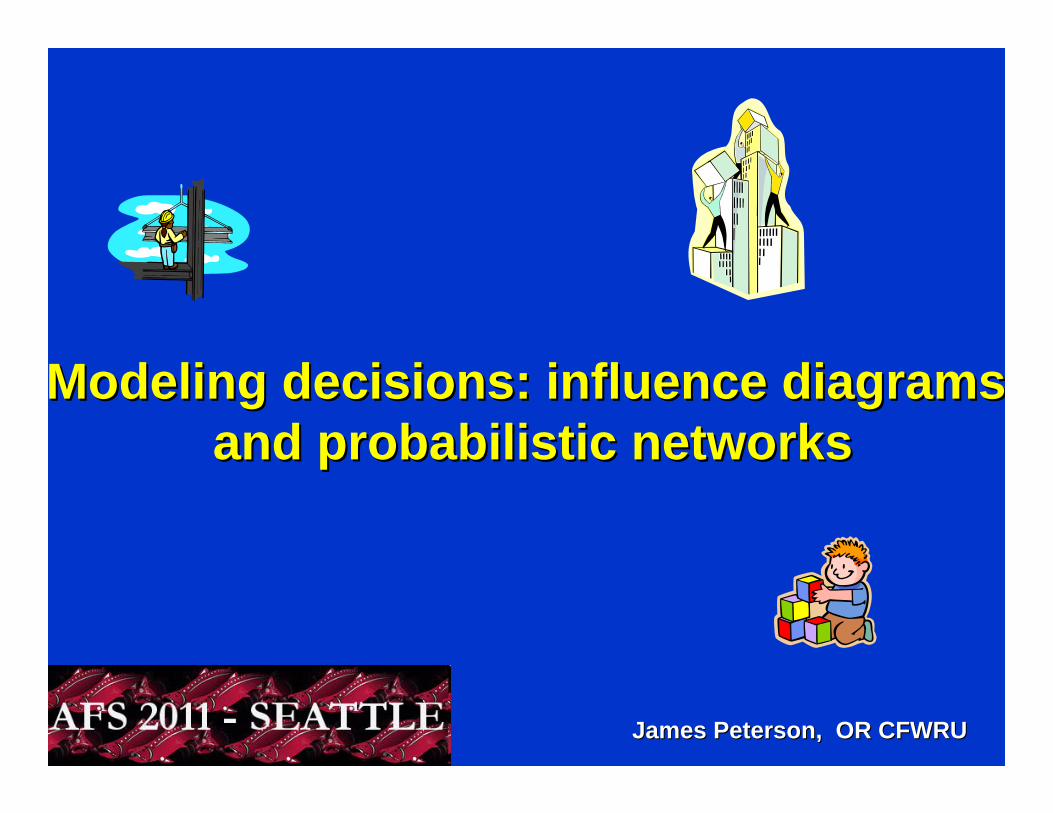
Modeling decisions: influence diagramsModeling decisions: influence diagramsand probabilistic networksand probabilistic networks
James Peterson, OR CFWRUJames Peterson, OR CFWRU

You You are hereare here
The The
Identify the decision Identify the decision situation and objectivessituation and objectives
Identify the management alternativesIdentify the management alternatives
Decompose and model the problemDecompose and model the problem
Identify the best alternativeIdentify the best alternative
Perform sensitivity analysisPerform sensitivity analysis
Is further Is further analysis needed?analysis needed?
Implement the best alternativeImplement the best alternative
NONO
YESYES
From From ClemenClemen and Reilly 2001and Reilly 2001
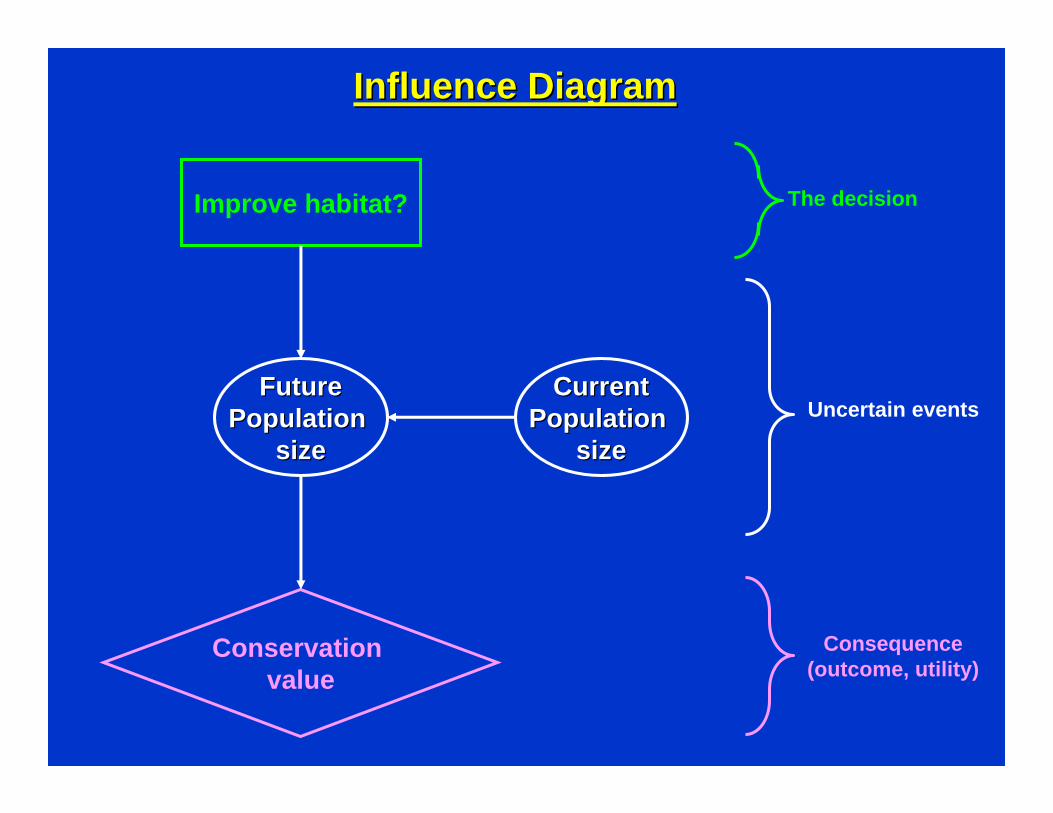
Influence DiagramInfluence Diagram
The decision
Uncertain events
Consequence(outcome, utility)
Improve habitat?
FutureFuturePopulation Population
sizesize
Conservation value
CurrentCurrentPopulation Population
sizesize
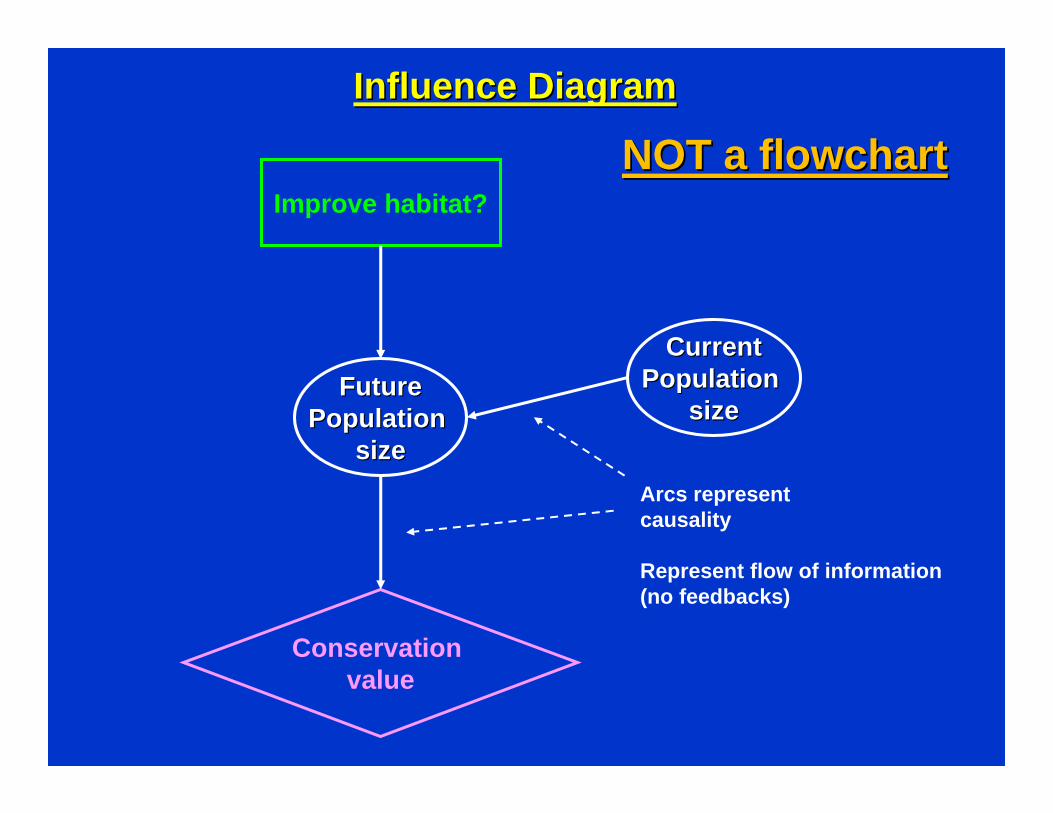
Influence DiagramInfluence Diagram
Arcs represent causality
Represent flow of information(no feedbacks)
NOT a flowchartNOT a flowchartImprove habitat?
FutureFuturePopulation Population
sizesize
Conservation value
CurrentCurrentPopulation Population
sizesize
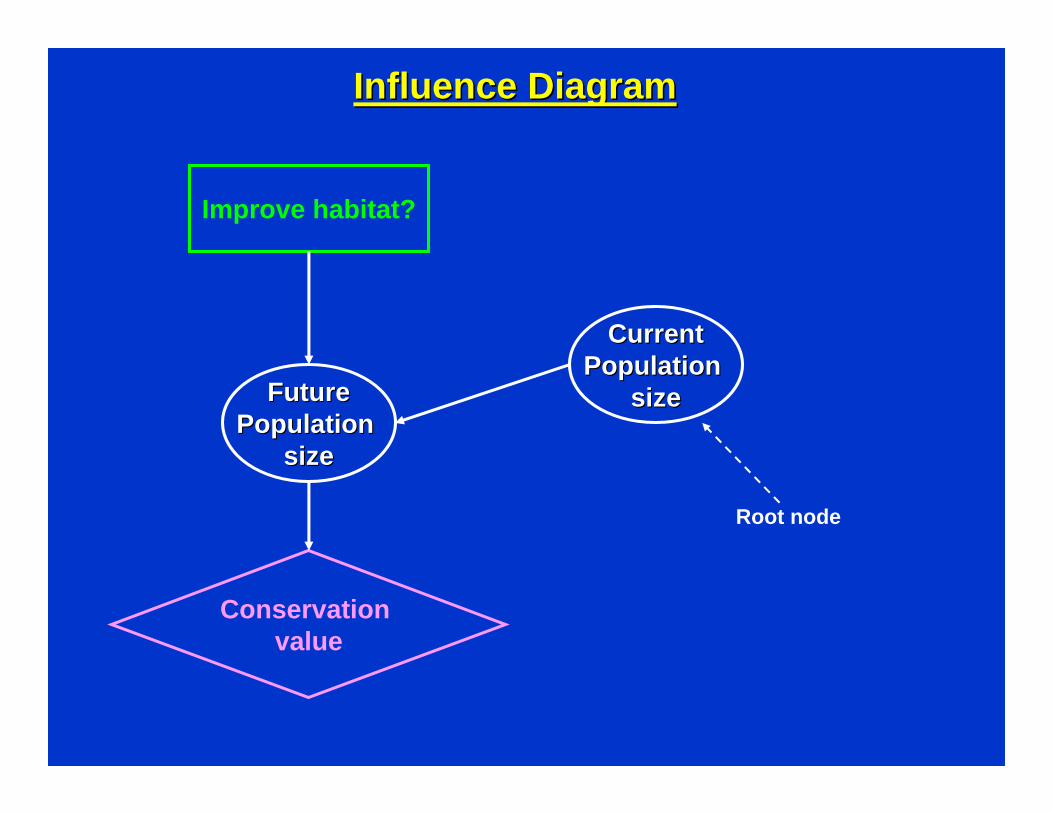
Influence DiagramInfluence Diagram
Improve habitat?
FutureFuturePopulation Population
sizesize
Conservation value
CurrentCurrentPopulation Population
sizesize
Root node
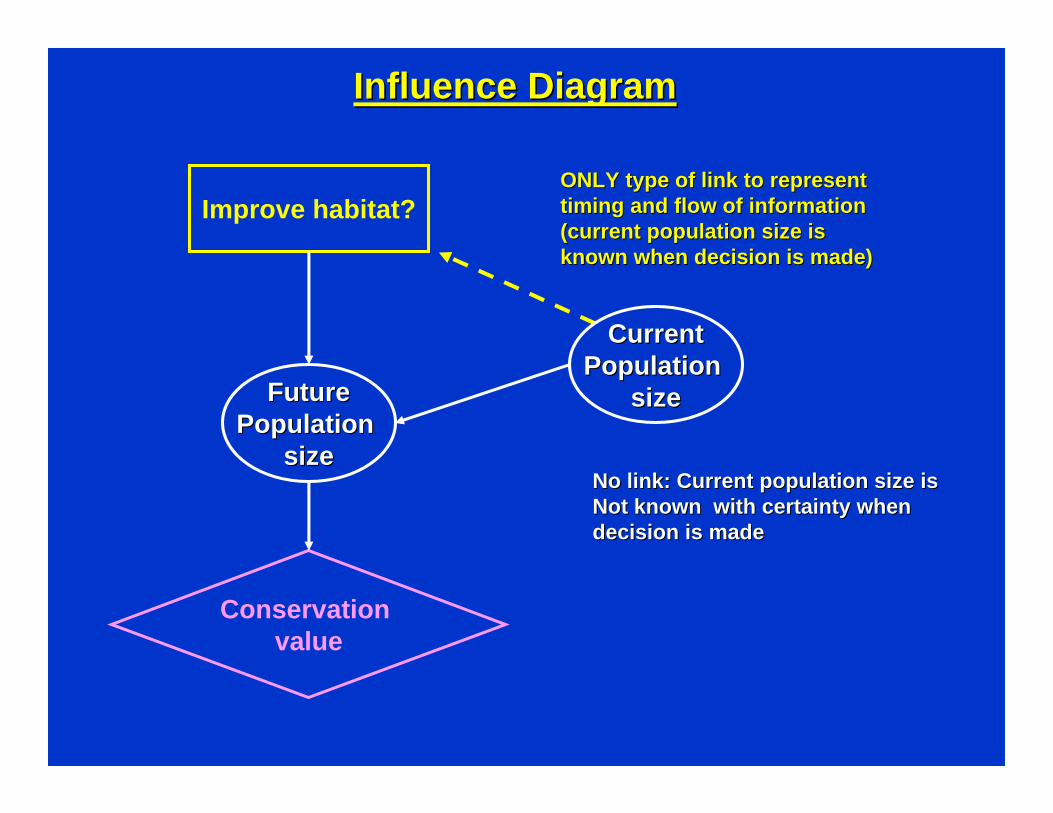
Influence DiagramInfluence Diagram
ONLY type of link to representONLY type of link to representtiming timing and flow and flow of of informationinformation(current population size is (current population size is known when decision is made)known when decision is made)
Improve habitat?
FutureFuturePopulation Population
sizesize
Conservation value
CurrentCurrentPopulation Population
sizesize
No link: Current population size is No link: Current population size is Not known with certainty when Not known with certainty when decision is madedecision is made

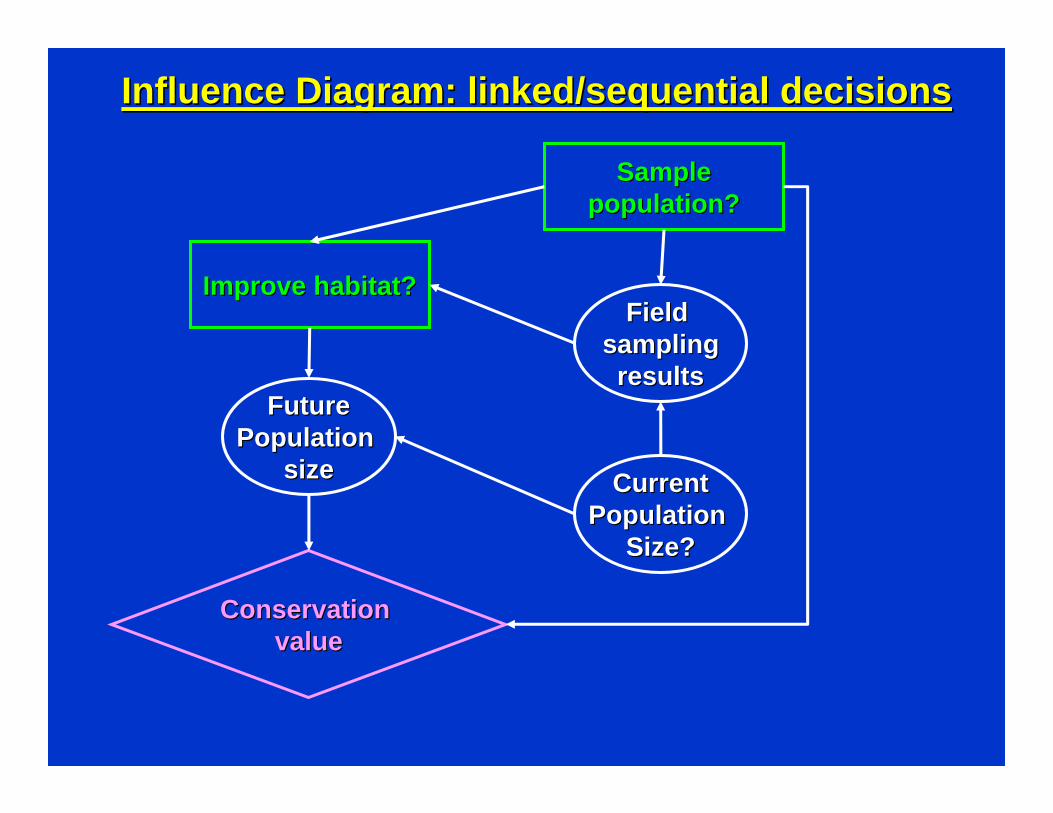
Influence Influence Diagram: imperfect informationDiagram: imperfect information
Improve habitat?Improve habitat?
FutureFuturePopulation Population
sizesize
Conservation Conservation valuevalue
CurrentCurrentPopulation Population
Size?Size?
Field Field SamplingSampling
resultsresults
Improve habitat?Improve habitat?
FutureFuturePopulation Population
sizesize
Conservation Conservation valuevalue
CurrentCurrentPopulation Population
Size?Size?
Field Field ssamplingamplingresultsresults
Influence Influence Diagram: linked/sequential decisionsDiagram: linked/sequential decisions
SampleSamplepopulation?population?

Reintroduce species?
Species Species persistencepersistence
Conservation Conservation valuevalue
Future Future habitathabitat
Influence Influence Diagram: linked/sequential decisionsDiagram: linked/sequential decisionsRestoringhabitat?
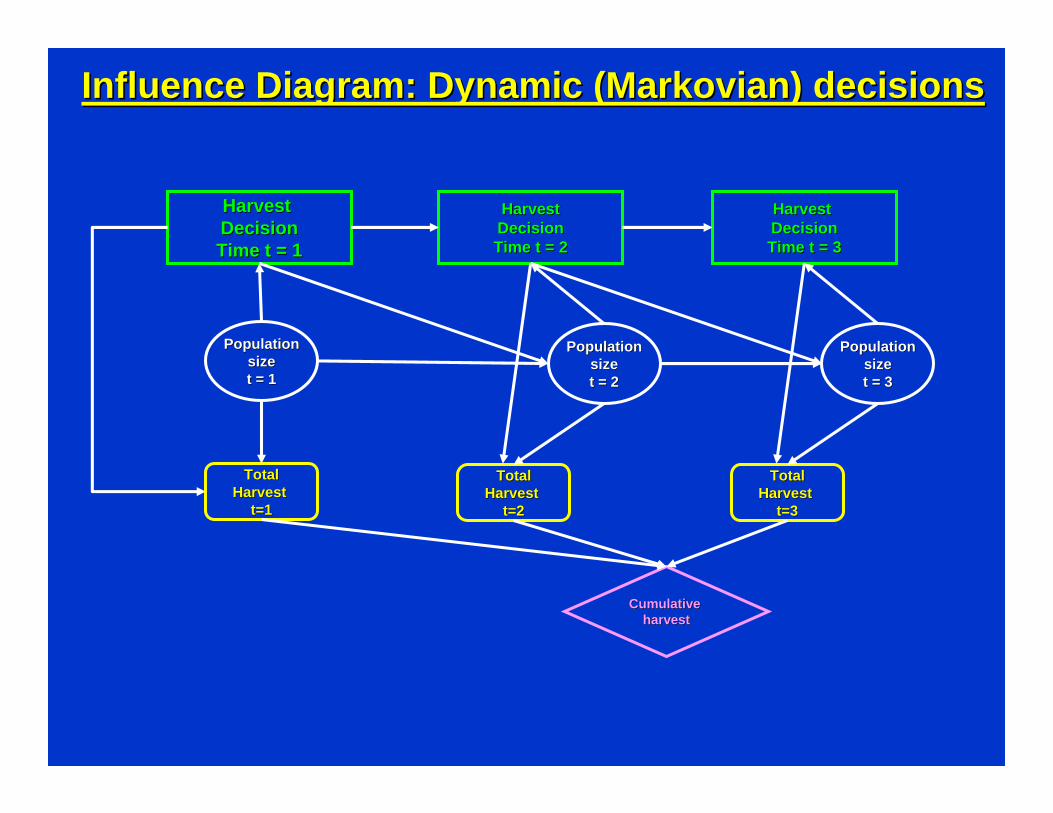
Influence Influence Diagram: Diagram: Dynamic (Dynamic (MarkovianMarkovian) ) decisionsdecisions
PopulationPopulationsizesizet = t = 22
Harvest Harvest DecisionDecisionTime t = 1Time t = 1
Harvest Harvest DecisionDecisionTime t = Time t = 22
Cumulative Cumulative harvestharvest
TotalTotalHarvest Harvest
t=1t=1
TotalTotalHarvest Harvest
t=2t=2
PopulationPopulationsizesizett = 1= 1
PopulationPopulationsizesizet = t = 33
Harvest Harvest DecisionDecisionTime t = Time t = 33
TotalTotalHarvest Harvest
t=3t=3

Common problemsCommon problemsFailing to account for direct effects of decisions on consequencFailing to account for direct effects of decisions on consequenceses
Cost of action = freeCost of action = freeImprove habitat?
FutureFuturePopulation Population
sizesize
Conservation value
CurrentCurrentPopulation Population
sizesize
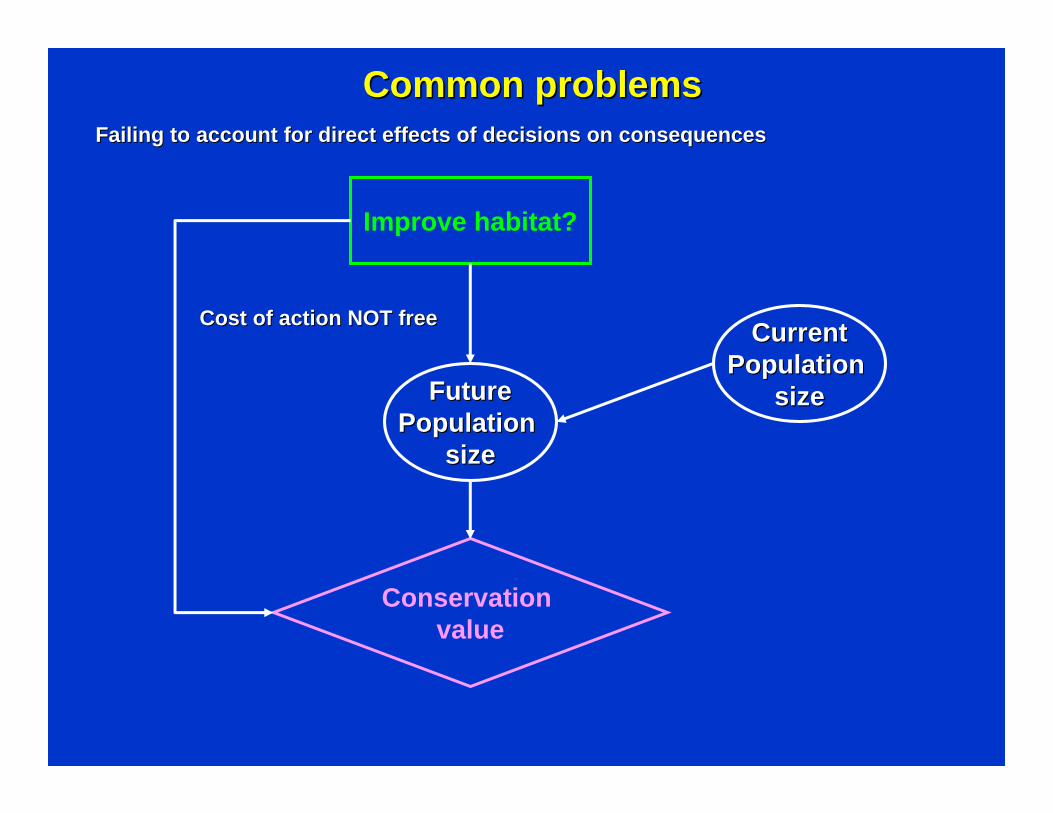
Common problemsCommon problemsFailing to account for direct effects of decisions on consequencFailing to account for direct effects of decisions on consequenceses
Improve habitat?
FutureFuturePopulation Population
sizesize
Conservation value
CurrentCurrentPopulation Population
sizesize
Cost of action NOT freeCost of action NOT free
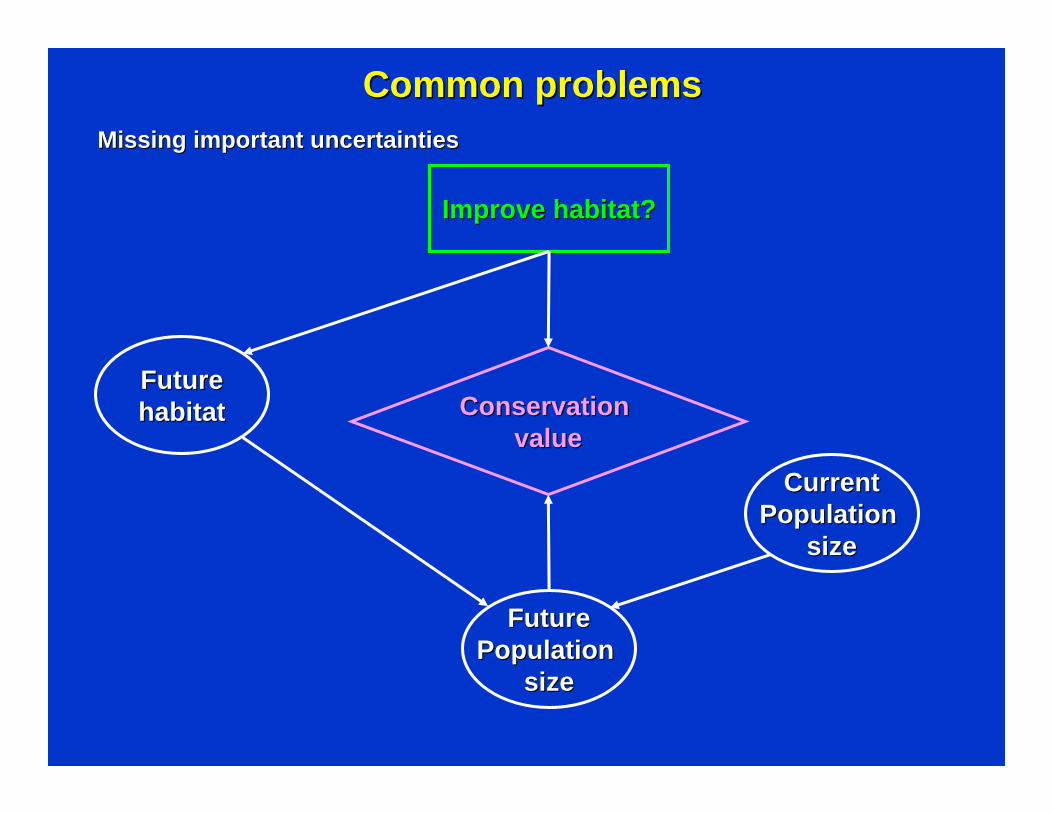
Common problemsCommon problemsMissing important uncertaintiesMissing important uncertainties
Improve habitat?Improve habitat?
FutureFuturePopulation Population
sizesize
Conservation Conservation valuevalue
CurrentCurrentPopulation Population
sizesize
FutureFuturehabitathabitat

Common problemsCommon problemsFailing to consider the current state of the systemFailing to consider the current state of the system
Improve habitat?Improve habitat?
FutureFuturePopulation Population
sizesize
Conservation Conservation valuevalue
CurrentCurrentPopulation Population
sizesize
FutureFuturehabitathabitat
CurrentCurrenthabitathabitat

Common problemsCommon problemsMissMiss--specifying the relationships specifying the relationships
BB
AA
CC
BB AA
CC
OROR
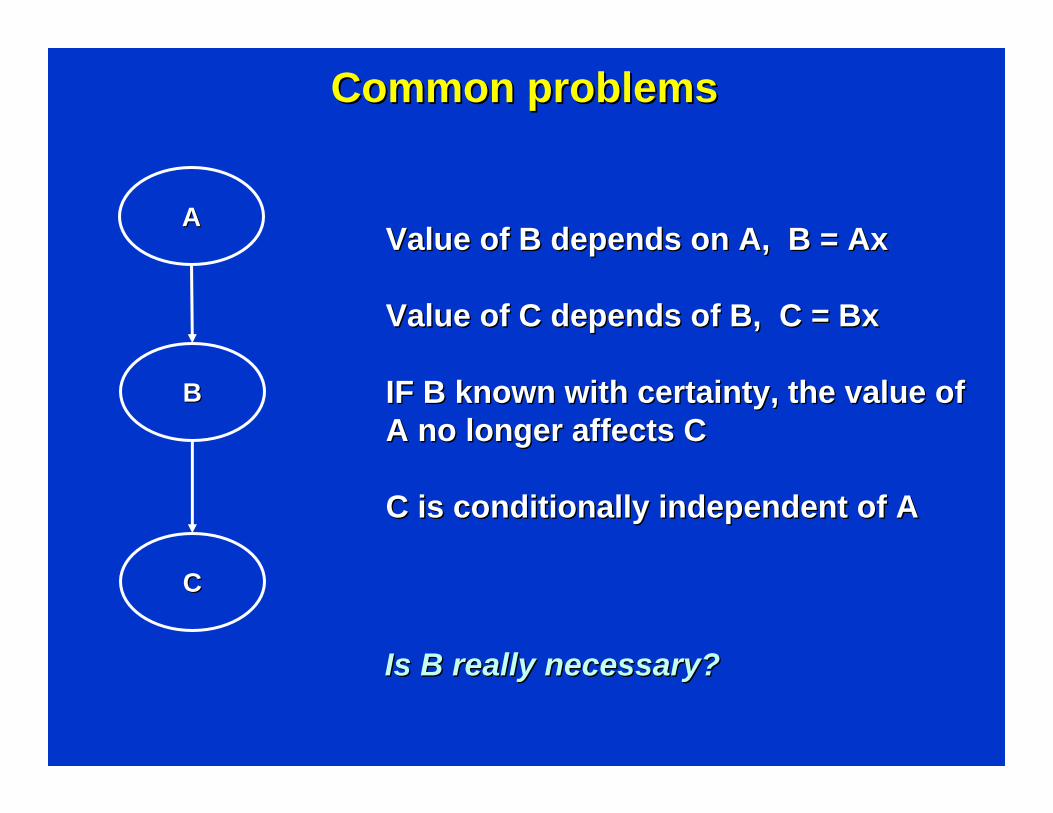
Common problemsCommon problems
BB
AA
CC
Is B really necessary?Is B really necessary?
Value of B depends on A, B = AxValue of B depends on A, B = Ax
Value of C depends of B, C = Value of C depends of B, C = BxBx
IF B known with certainty, the value ofIF B known with certainty, the value ofA no longer affects CA no longer affects C
C is conditionally independent of AC is conditionally independent of A
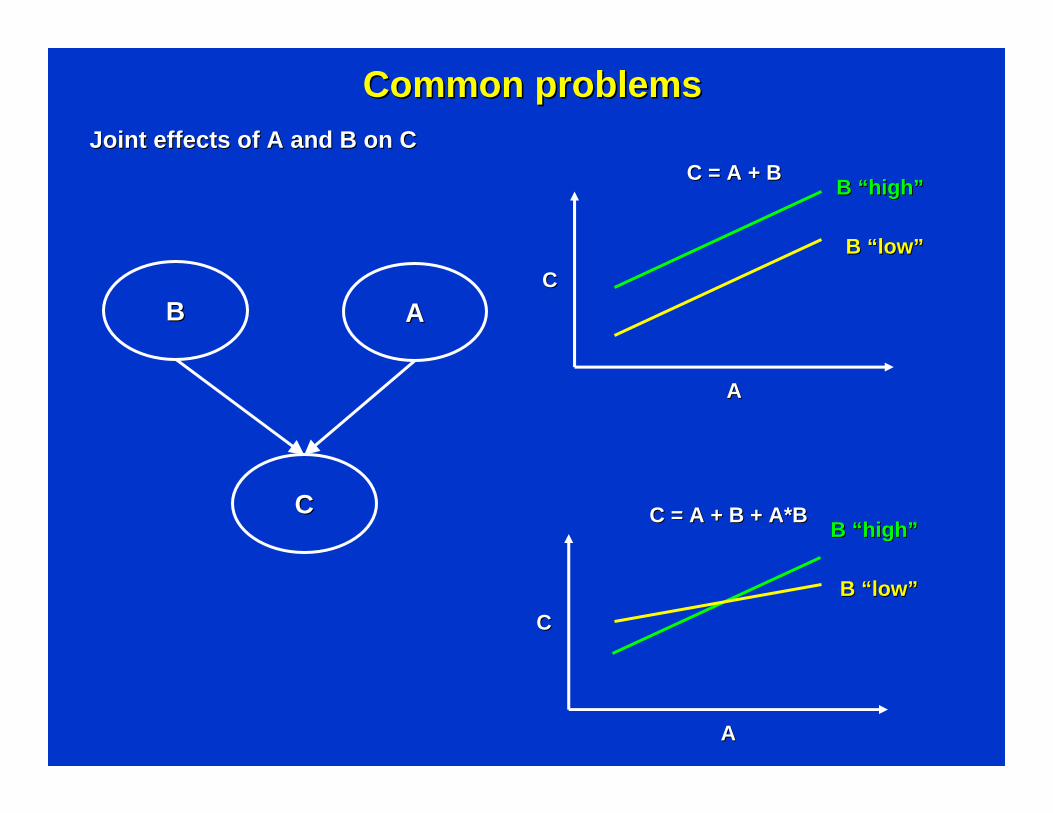
Common problemsCommon problemsJoint effects of A and B on CJoint effects of A and B on C
BB AA
CC
C = A + BC = A + B
CC
AA
B B ““highhigh””
B B ““lowlow””
C = A + B + A*BC = A + B + A*B
CC
AA
B B ““highhigh””
B B ““lowlow””
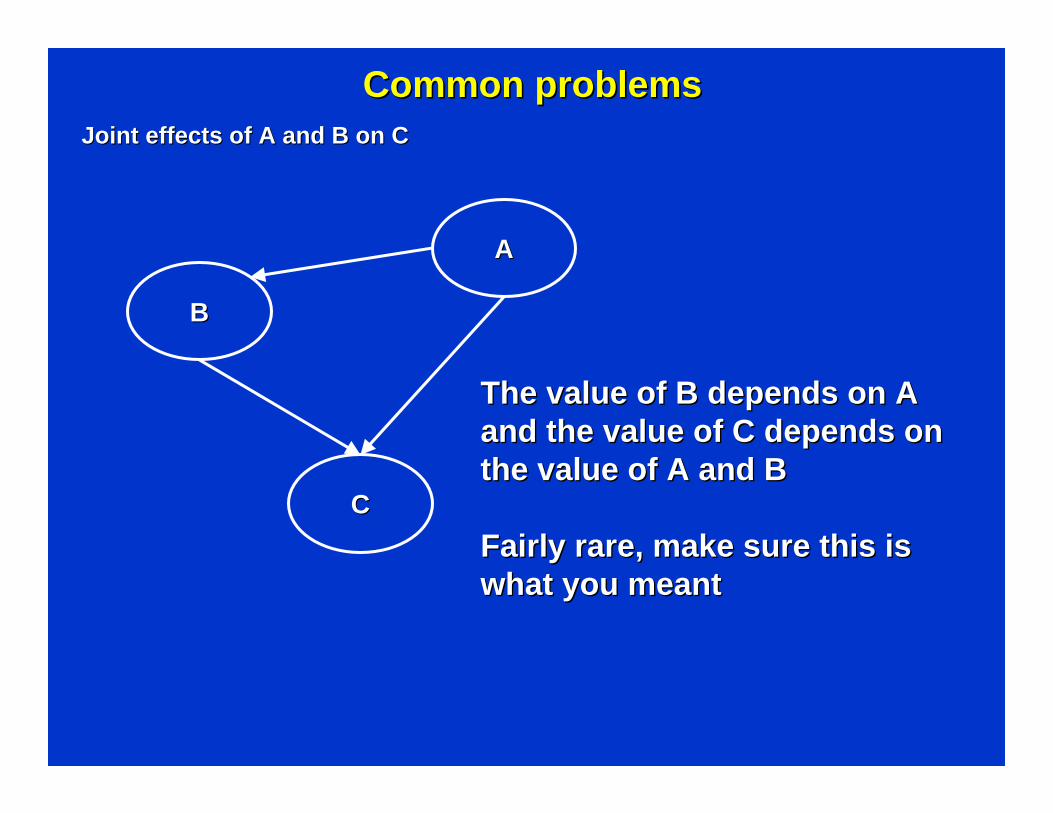
Common problemsCommon problemsJoint effects of A and B on CJoint effects of A and B on C
BB
AA
CC
The value of B depends on AThe value of B depends on Aand the value of C depends on and the value of C depends on the value of A and Bthe value of A and B
Fairly rare, make sure this is Fairly rare, make sure this is what you meantwhat you meant

Interpret the relationships Interpret the relationships forfortimber harvest timber harvest Influence DiagramInfluence Diagram
Timber harvestdecision
Stream Habitat
CurrentPopulation
Size
SocioeconomicSocioeconomicvaluevalue
Future Population
Size

Interpret the relationships Interpret the relationships forfortimber harvest timber harvest Influence DiagramInfluence Diagram
Timber harvestdecision
Stream Habitat
CurrentPopulation
Size
SocioeconomicSocioeconomicvaluevalue
Future Population
Size

Defining NodesDefining Nodes
Stream Habitat
Timber harvestdecision
CurrentPopulation
Size
Potential StatesPotential States
No, YesNo, Yes Low, Medium, HighLow, Medium, High 0, 10ha, 100ha0, 10ha, 100ha
Good, BadGood, Bad Excellent, Good, Poor, BadExcellent, Good, Poor, Bad
Low, Medium, HighLow, Medium, High 00, 1, 1--10, 1010, 10--2020
States are mutually exclusive and collectively exhaustiveStates are mutually exclusive and collectively exhaustive
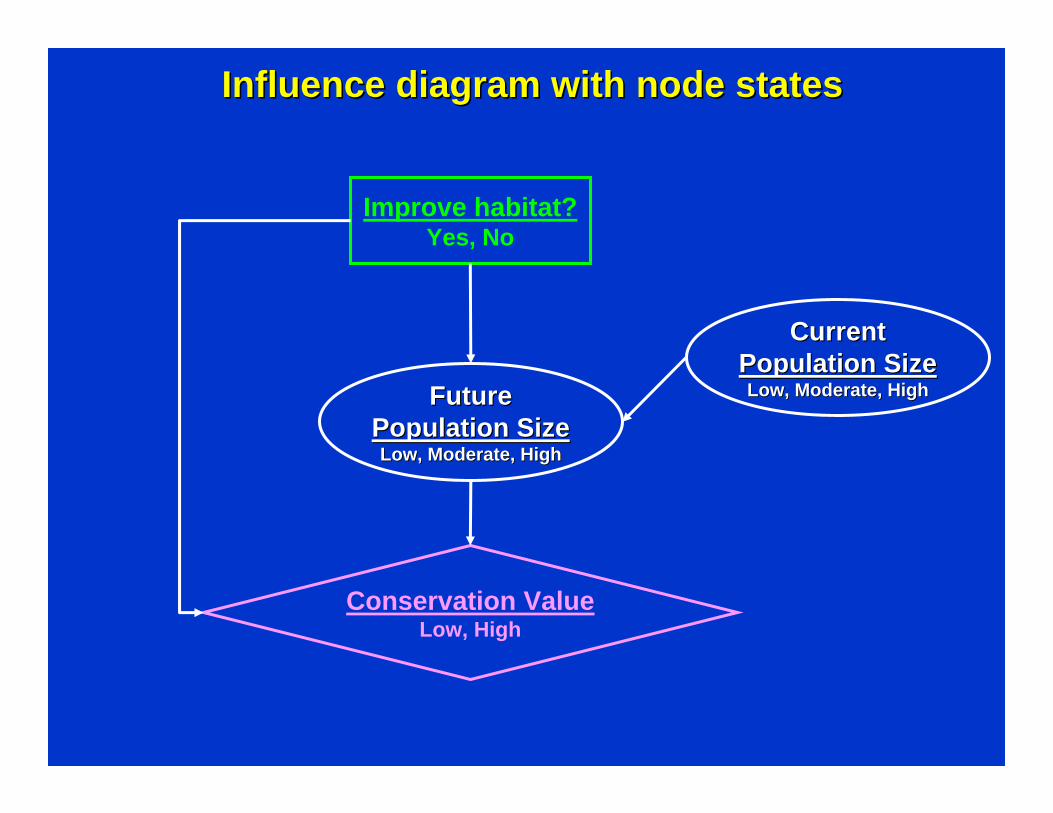
Influence diagram with node statesInfluence diagram with node states
Improve habitat?Yes, No
FutureFuturePopulation SizePopulation SizeLow, Moderate, HighLow, Moderate, High
Conservation ValueLow, High
CurrentCurrentPopulation SizePopulation SizeLow, Moderate, HighLow, Moderate, High
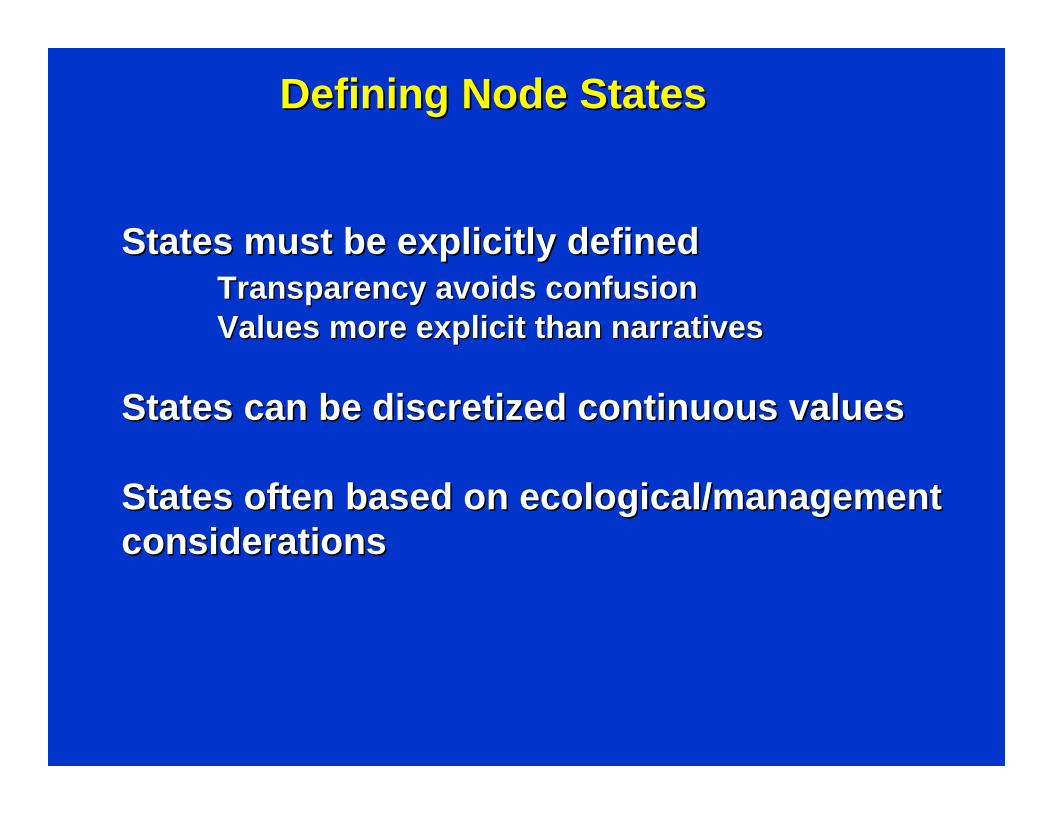
Defining Node StatesDefining Node States
States must be explicitly definedStates must be explicitly definedTransparency avoids confusionTransparency avoids confusionValues more explicit than narrativesValues more explicit than narratives
States can be discretized continuous valuesStates can be discretized continuous values
States often based on ecological/management States often based on ecological/management considerationsconsiderations

Timber Timber HHarvest arvest Influence DiagramInfluence Diagram
Timber harvestTimber harvestddecisionecision
yes, noyes, no
Stream Stream hhabitatabitatggood, poorood, poor
Current Current ppopulation sizeopulation size
ssmall, largemall, large
SocioeconomicSocioeconomicvaluevalue
Uncertain Uncertain eventsevents
FutureFutureppopulation sizeopulation size
ssmall, largemall, large
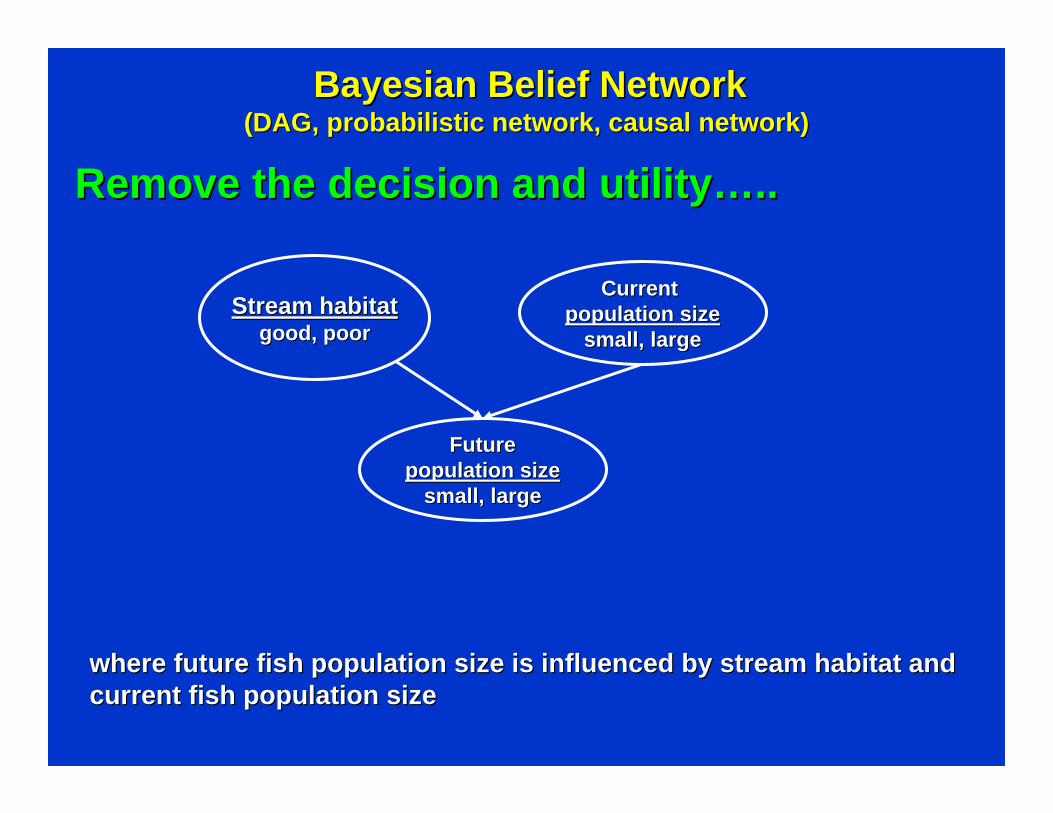
Remove the decision and utilityRemove the decision and utility……....
where where future fish population size future fish population size is influenced by is influenced by stream habitat and stream habitat and current fish population sizecurrent fish population size
Stream Stream hhabitatabitatggood, poorood, poor
Current Current ppopulation sizeopulation size
ssmall, largemall, large
FutureFutureppopulation sizeopulation size
ssmall, largemall, large
Bayesian Belief NetworkBayesian Belief Network(DAG, probabilistic network, causal network) (DAG, probabilistic network, causal network)

Conditional ProbabilitiesConditional Probabilities
Stream Stream hhabitatabitatggood, poorood, poor
Current Current ppopulation sizeopulation size
ssmall, largemall, large
FutureFutureppopulation sizeopulation size
ssmall, largemall, large
FutureFutureCurrentCurrent population sizepopulation size
Stream habitatStream habitat population sizepopulation size smallsmall largelargegoodgood smallsmall 0.30.3 0.70.7goodgood largelarge 0.10.1 0.90.9poorpoor smallsmall 0.60.6 0.40.4poor poor largelarge 0.50.5 0.50.5
Sums to 1Sums to 1
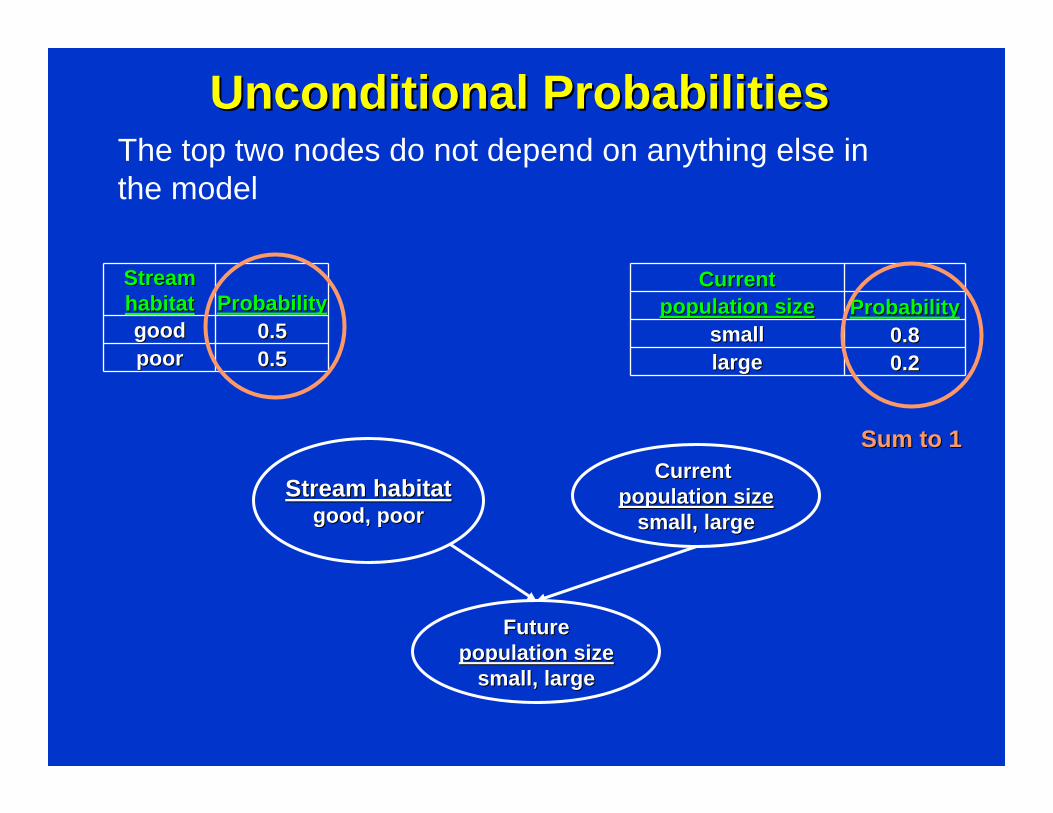
Unconditional Unconditional ProbabilitiesProbabilities
Stream Stream hhabitatabitatggood, poorood, poor
Current Current ppopulation sizeopulation size
ssmall, largemall, large
FutureFutureppopulation sizeopulation size
ssmall, largemall, large
CurrentCurrentpopulation sizepopulation size ProbabilityProbability
smallsmall 0.80.8largelarge 0.20.2
StreamStreamhabitathabitat ProbabilityProbabilitygoodgood 0.50.5poorpoor 0.50.5
The top two nodes do not depend on anything else inthe model
Sum to 1Sum to 1

Current Current ppopulation sizeopulation size
StreamStreamhabitathabitat
goodgood
smallsmall
smallsmall
smallsmall
smallsmallpoorpoor
largelarge
largelarge
largelarge
largelarge
largelarge
largelarge
0.300.30
0.700.70
0.100.10
0.900.90
0.600.60
0.400.40
0.500.50
0.500.50
0.800.80
0.200.20
0.800.80
0.200.20
0.500.50
0.500.50
Decision TreeDecision Tree
smallsmall
smallsmall
FutureFutureppopulation sizeopulation size

Current Current ppopulation sizeopulation size
StreamStreamhabitathabitat
goodgood
smallsmall
smallsmall
smallsmall
smallsmallpoorpoor
largelarge
largelarge
largelarge
largelarge
largelarge
largelarge
0.300.30
0.700.70
0.100.10
0.900.90
0.600.60
0.400.40
0.500.50
0.500.50
0.800.80
0.200.20
0.800.80
0.200.20
0.500.50
0.500.50
Estimating probability future population is smallEstimating probability future population is small
smallsmall
smallsmall
FutureFutureppopulation sizeopulation size
0.300.300.800.80
0.500.50
0.50*0.80*0.300.50*0.80*0.30
CalculationCalculation
+ 0.50*0.20*0.10+ 0.50*0.20*0.10 + 0.50*0.80*0.60+ 0.50*0.80*0.60 + 0.50*0.20*0.50+ 0.50*0.20*0.50
0.100.100.200.20
0.600.600.800.80
0.500.50
0.500.500.200.20
= 0.42= 0.42

Bayesian Bayesian Belief NetworkBelief Network
StreamStreamhabitathabitat ProbabilityProbabilitygoodgood 0.50.5poorpoor 0.50.5
CurrentCurrentpopulation sizepopulation size ProbabilityProbability
smallsmall 0.80.8largelarge 0.20.2
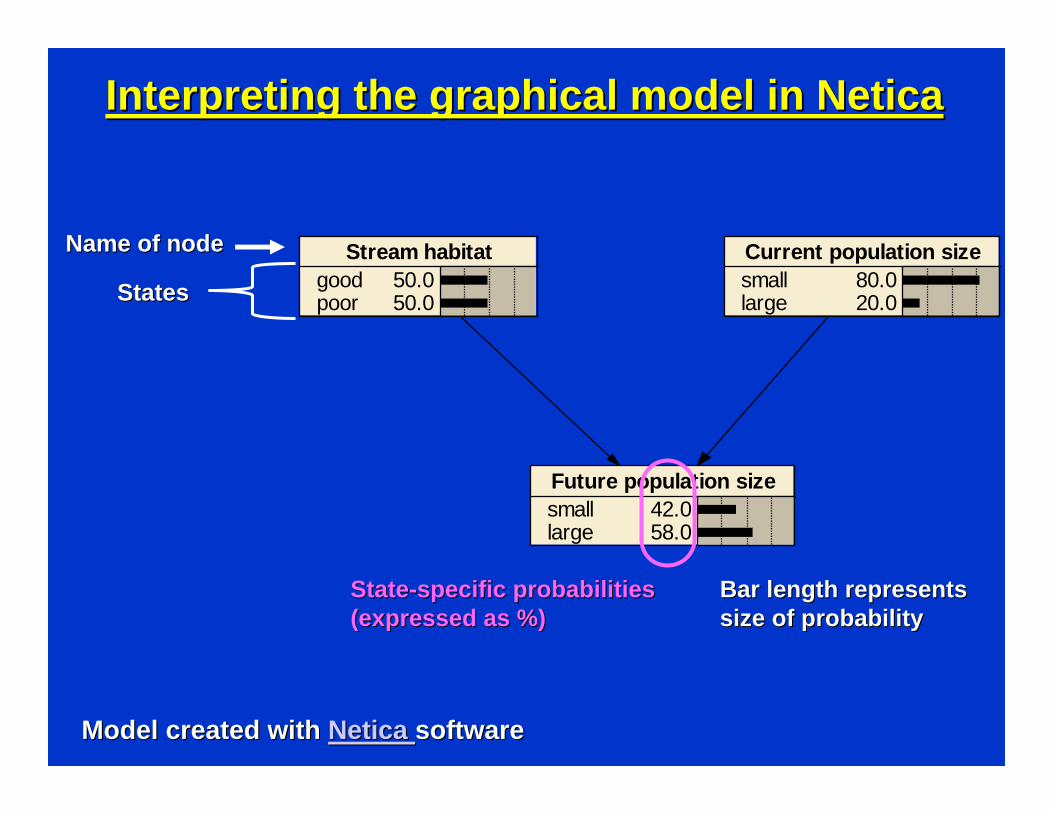
Future population sizesmalllarge
42.058.0
Current population sizesmalllarge
80.020.0
Stream habitatgoodpoor
50.050.0
Future population sizesmalllarge
42.058.0
Current population sizesmalllarge
80.020.0
Stream habitatgoodpoor
50.050.0
Interpreting the graphical model in Interpreting the graphical model in NeticaNetica
Model created with Model created with NeticaNetica softwaresoftware
Name of nodeName of node
StatesStates
StateState--specific probabilitiesspecific probabilities(expressed as %)(expressed as %)
Bar length representsBar length representsssize of probabilityize of probability
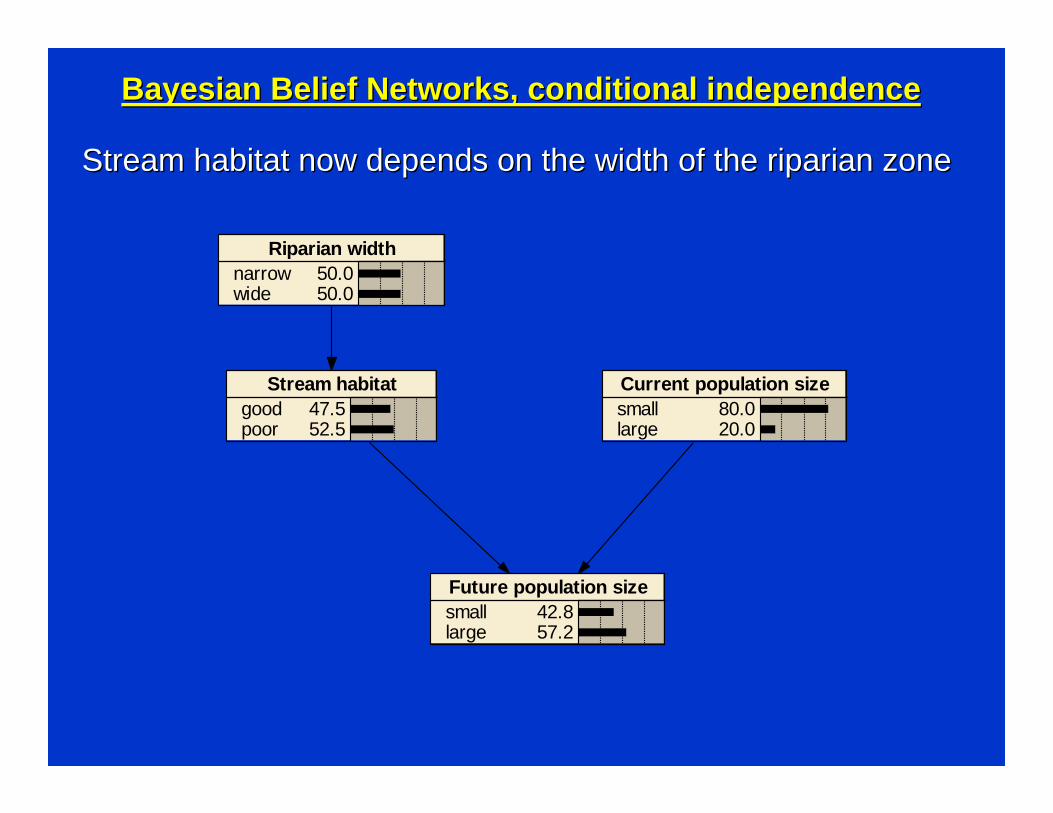
Bayesian Bayesian Belief Networks, conditional independenceBelief Networks, conditional independence
Stream habitat now depends on the width of the riparian zoneStream habitat now depends on the width of the riparian zone
Future population sizesmalllarge
42.857.2
Current population sizesmalllarge
80.020.0
Stream habitatgoodpoor
47.552.5
Riparian widthnarrowwide
50.050.0

Bayesian Bayesian Belief Networks, conditional independenceBelief Networks, conditional independence
Riparian Riparian Stream Stream habitathabitat
widthwidth goodgood poorpoornarrownarrow 0.200.20 0.800.80
widewide 0.750.75 0.250.25
Predicted probabilitiesPredicted probabilitieswwhen riparian is narrowhen riparian is narrow
Future population sizesmalllarge
51.648.4
Current population sizesmalllarge
80.020.0
Stream habitatgoodpoor
20.080.0
Riparian widthnarrowwide
100 0

Bayesian Bayesian Belief Networks, conditional independenceBelief Networks, conditional independence
Riparian Riparian Stream Stream habitathabitat
widthwidth goodgood poorpoornarrownarrow 0.200.20 0.800.80widewide 0.750.75 0.250.25
Predicted probabilitiesPredicted probabilitieswwhen riparian is widehen riparian is wide
Future population sizesmalllarge
34.066.0
Current population sizesmalllarge
80.020.0
Stream habitatgoodpoor
75.025.0
Riparian widthnarrowwide
0 100
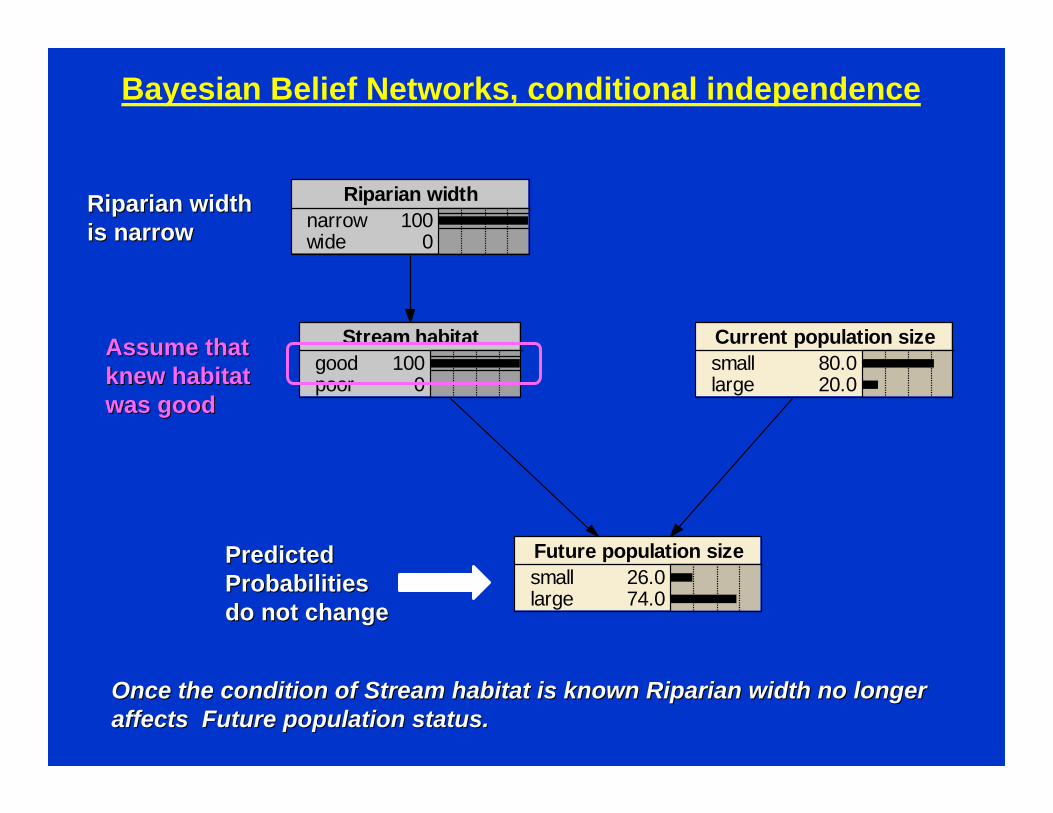
Future population sizesmalllarge
26.074.0
Current population sizesmalllarge
80.020.0
Stream habitatgoodpoor
100 0
Riparian widthnarrowwide
0 100
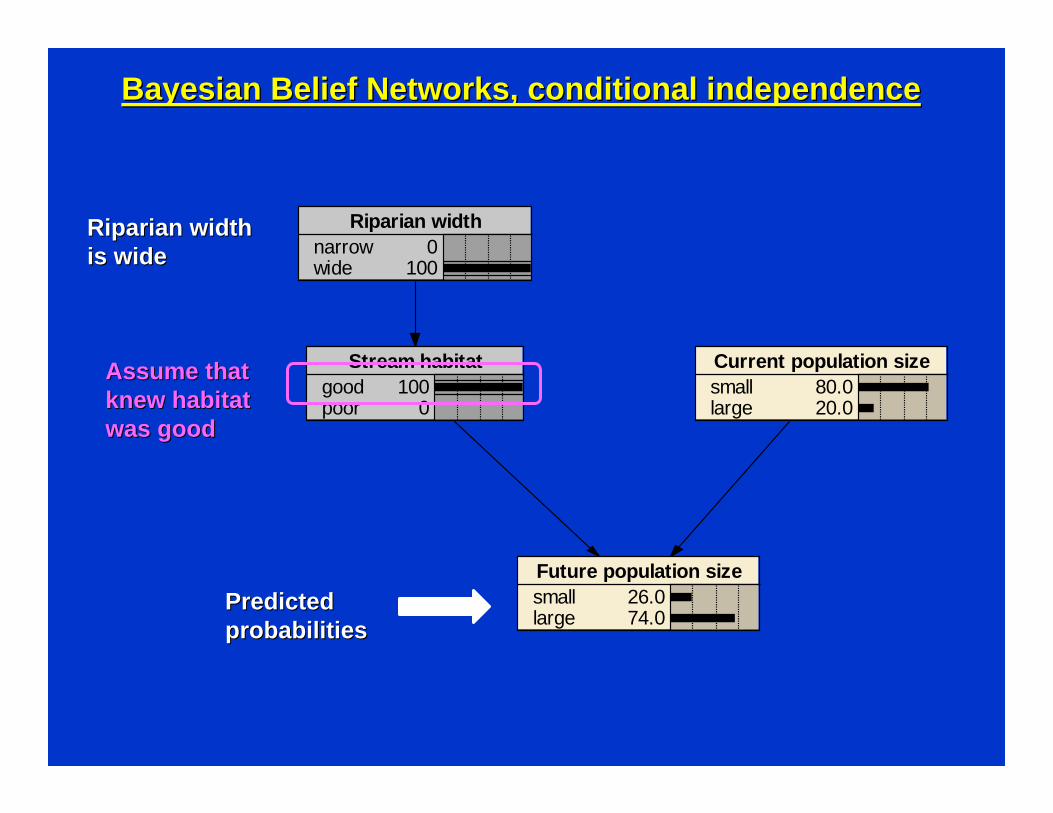
Bayesian Bayesian Belief Networks, conditional independenceBelief Networks, conditional independence
Assume that Assume that kknew habitatnew habitatwwas goodas good
Predicted Predicted probabilitiesprobabilities
Riparian widthRiparian widthiis wides wide
Future population sizesmalllarge
26.074.0
Current population sizesmalllarge
80.020.0
Stream habitatgoodpoor
100 0
Riparian widthnarrowwide
100 0
Bayesian Belief Networks, conditional independence
Assume that Assume that kknew habitatnew habitatwwas goodas good
Predicted Predicted ProbabilitiesProbabilitiesddo not changeo not change
Riparian widthRiparian widthiis narrows narrow
Once the condition of Stream habitat is known Riparian width no Once the condition of Stream habitat is known Riparian width no longerlongeraffects Future population status.affects Future population status.
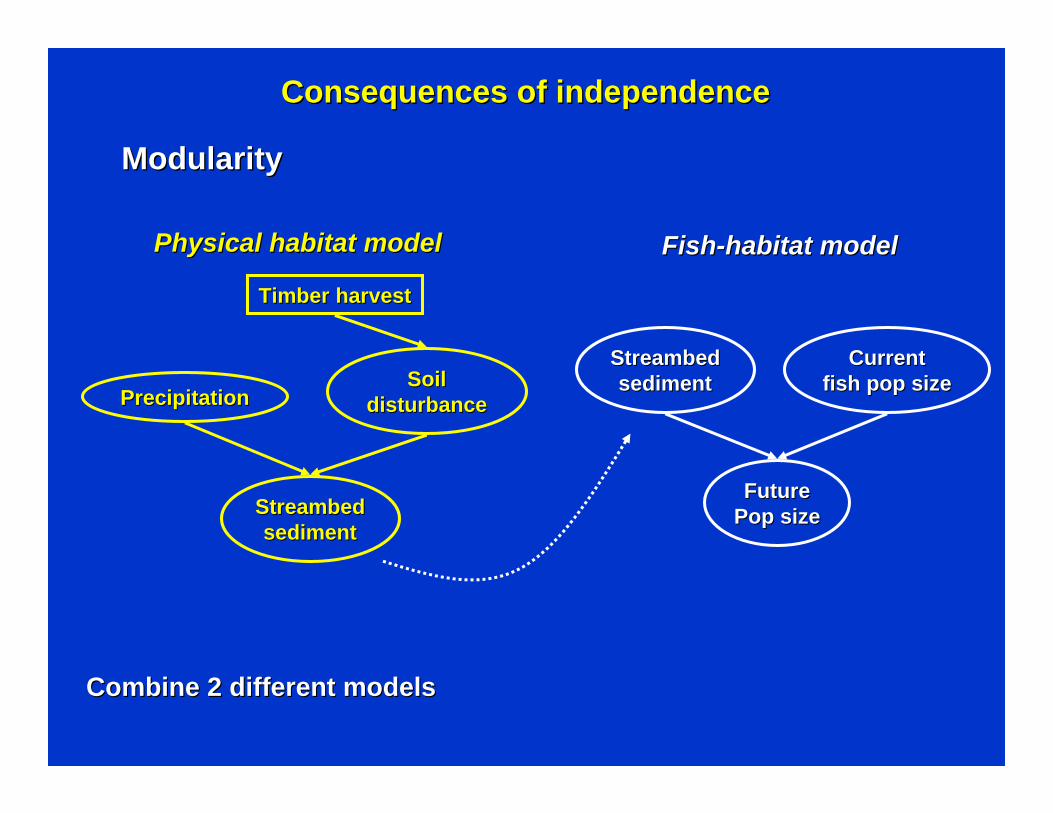
Consequences of independenceConsequences of independence
StreambedStreambedsedimentsediment
ModularityModularity
PrecipitationPrecipitationSoil Soil
disturbancedisturbance
Timber harvestTimber harvest
StreambedStreambedsedimentsediment
FutureFuturePop sizePop size
CurrentCurrentfish pop sizefish pop size
Physical habitat modelPhysical habitat model FishFish--habitat modelhabitat model
Combine 2 different models Combine 2 different models
Representing time in a BBN
Time is difficult to represent in an BBN because they cannot Time is difficult to represent in an BBN because they cannot contain feedback loopscontain feedback loops
There are, however, 2 basic way to represent timeThere are, however, 2 basic way to represent time
To examine the effects of a single decision at various points inTo examine the effects of a single decision at various points in time:time:
Represent time as a node, usually a constant or decision nodeRepresent time as a node, usually a constant or decision node
To examine the effects of sequential decisions at various pointsTo examine the effects of sequential decisions at various points in time:in time:
Design influence diagram as a sequence of decisionsDesign influence diagram as a sequence of decisions

At 100 yearsAt 100 years
At 10 yearsAt 10 years
Representing time with a Representing time with a constant node constant node
BBN of riparian corridor condition at 10 and 100 years from cessBBN of riparian corridor condition at 10 and 100 years from cessation of cattle ation of cattle grazinggrazing(from (from ReimanReiman et al. 2001) et al. 2001)
Riparian conditionIntactMod DegradedHi Degraded
42.237.220.7
MitigationHi MitigationMod MitigationLow Mitigation
33.333.333.3
Prior Riparian ConditionIntact low damagMod High
50.050.0
Time = t+100
Riparian conditionIntactMod DegradedHi Degraded
33.540.825.7
MitigationHi MitigationMod MitigationLow Mitigation
33.333.333.3
Prior Riparian ConditionIntact low damagMod High
50.050.0
Time = t+10
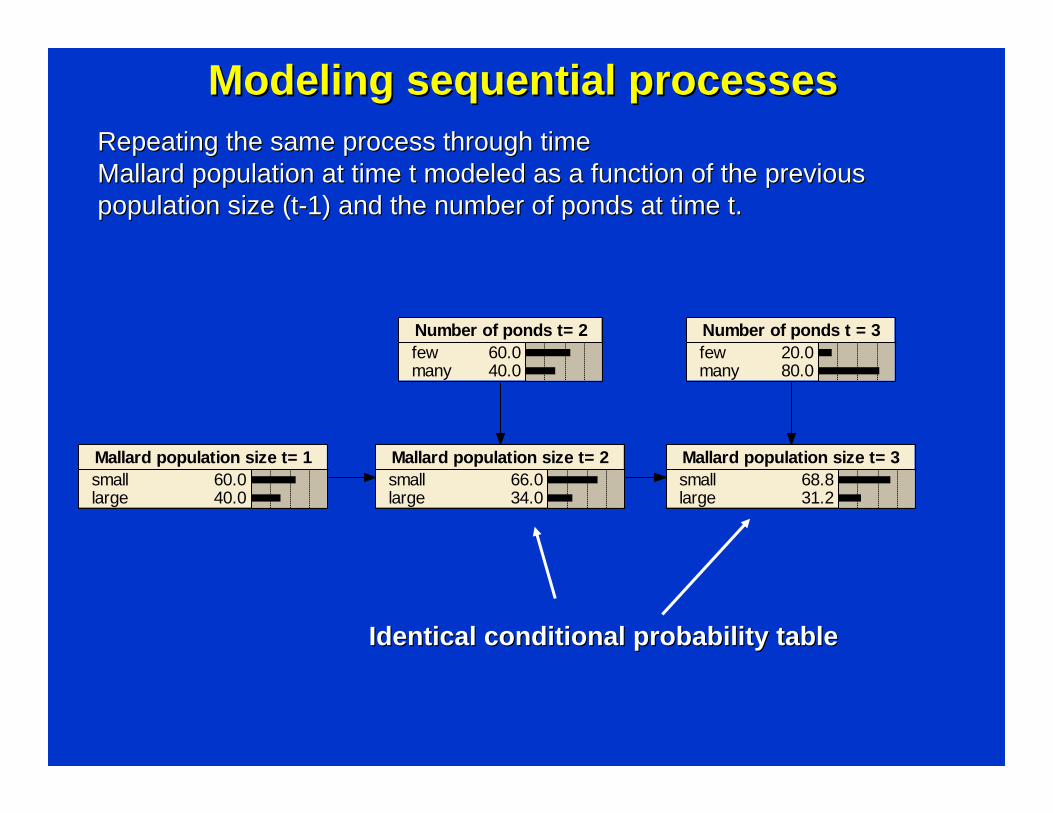
Modeling sequential processesModeling sequential processesRepeating the same process through Repeating the same process through timetimeMallard population at time t modeled as a function of the previoMallard population at time t modeled as a function of the previous us population size (tpopulation size (t--1) and the number of ponds at time t. 1) and the number of ponds at time t.
Mallard population size t= 2smalllarge
66.034.0
Mallard population size t= 1smalllarge
60.040.0
Mallard population size t= 3smalllarge
68.831.2
Number of ponds t = 3fewmany
20.080.0
Number of ponds t= 2fewmany
60.040.0
Identical conditional probability tableIdentical conditional probability table

Model relationships directly from dataModel relationships directly from data
ParameterizingParameterizing Bayesian Bayesian Belief NetworksBelief Networks
Hardwood density (no/ha)LowModerateHigh
33.333.333.3
10 ± 8.2
Snag density (no/ha)LowMediumHigh
33.333.333.3
4.33 ± 2.7
Woodpecker abundanceAbsentLowModerate
33.333.333.3
2.33 ± 1.8
Woodpecker data fileWoodpecker data fileWoodpecker modelWoodpecker modelNo data (uniform probabilities)No data (uniform probabilities)
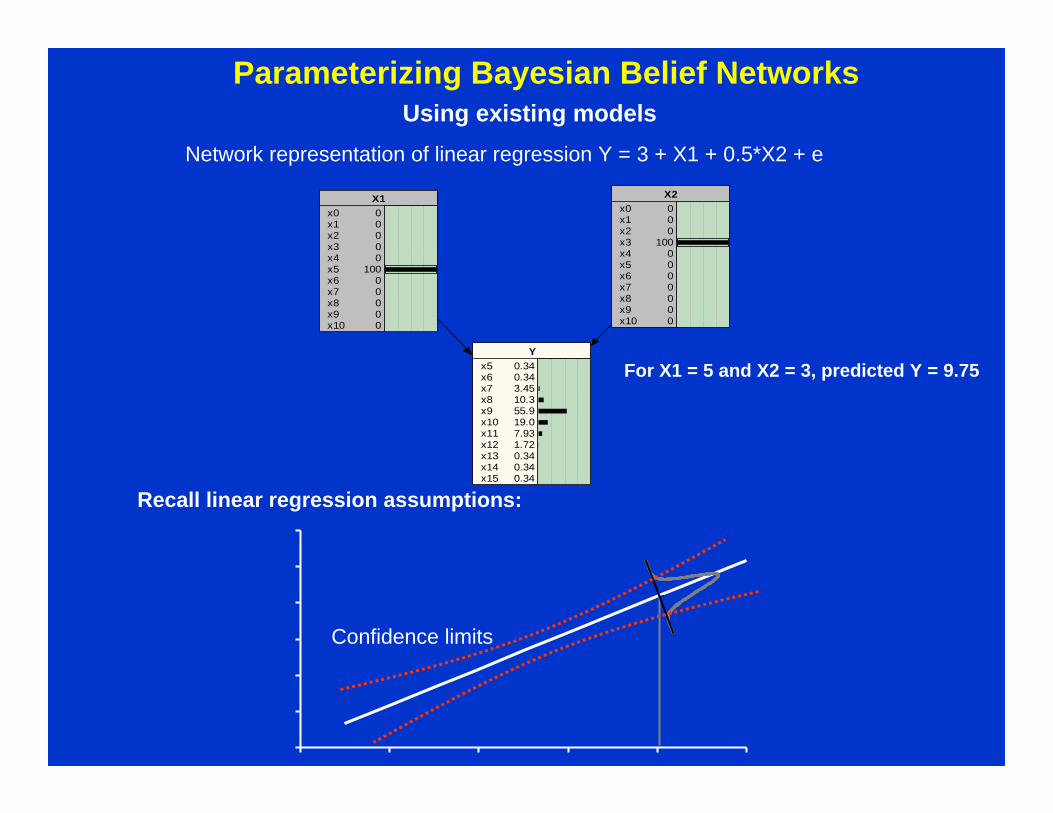
Yx5x6x7x8x9x10x11x12x13x14x15
0.340.343.4510.355.919.07.931.720.340.340.34
X1x0x1x2x3x4x5x6x7x8x9x10
0 0 0 0 0
100 0 0 0 0 0
X2x0x1x2x3x4x5x6x7x8x9x10
0 0 0
100 0 0 0 0 0 0 0
For X1 = 5 and X2 = 3, predicted Y = 9.75
Network representation of linear regression Y = 3 + X1 + 0.5*X2 + e
Recall linear regression assumptions:
Confidence limits
Parameterizing Bayesian Belief NetworksUsing existing models
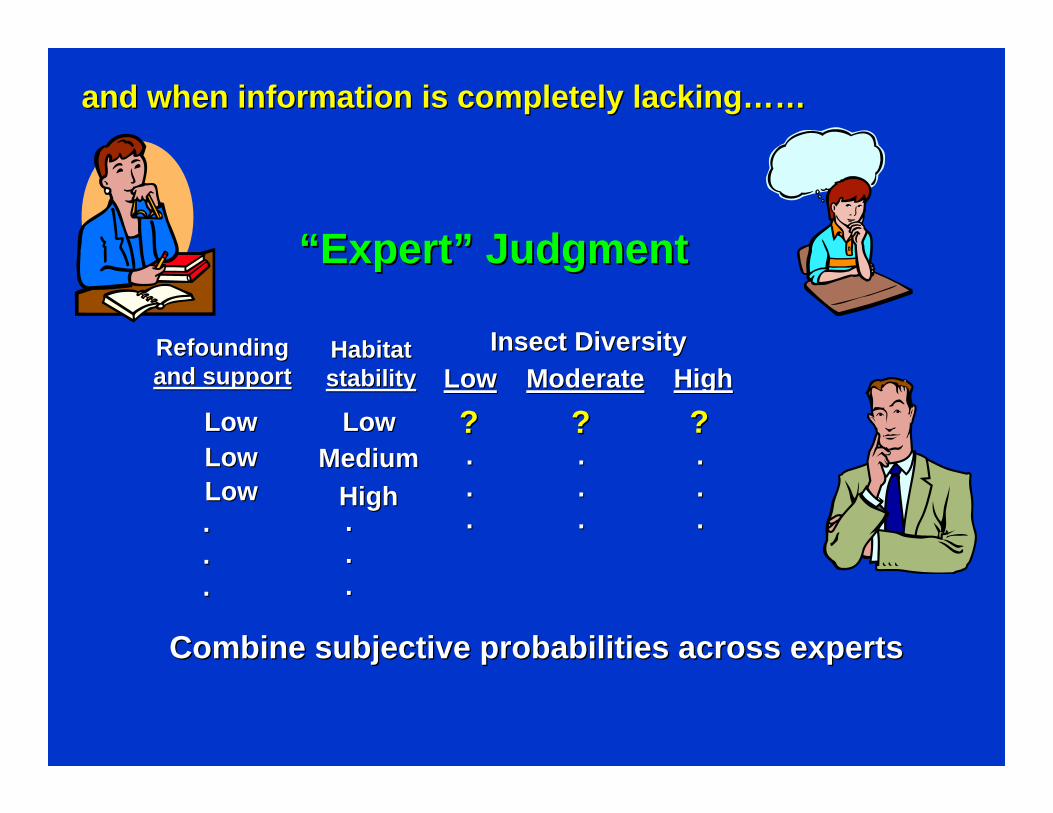
““ExpertExpert”” JudgmentJudgment
Combine subjective probabilities across expertsCombine subjective probabilities across experts
and when information is completely lackingand when information is completely lacking…………
Insect DiversityInsect DiversityLowLow ModerateModerate HighHigh
HabitatHabitatstabilitystability
RefoundingRefoundingand supportand support
LowLowMediumMedium
HighHigh
?? ?? ??LowLow
..
..
..
..
..
..
..
..
..
..
..
..
..
..
..
LowLowLowLow

On to the case studyOn to the case study……..


