Page 1
MODELING DRYING KINETICS OF GRAPE SEEDS AND SKINS FROM
TURKISH CULTIVARS
A THESIS SUBMITTED TO
THE GRADUATE SCHOOL OF NATURAL AND APPLIED SCIENCES
OF
MIDDLE EAST TECHNICAL UNIVERSITY
BY
PERVĠN GĠZEM GEZER
IN PARTIAL FULFILLMENT OF THE REQUIREMENTS
FOR
THE DEGREE OF MASTER OF SCIENCE
IN
FOOD ENGINEERING
JULY 2011
Page 2
Approval of the thesis:
MODELING DRYING KINETICS OF GRAPE SEEDS AND SKINS FROM
TURKISH CULTIVARS
submitted by PERVİN GİZEM GEZER in partial fulfillment of the requirements
for the degree of Master of Science in Food Engineering Department, Middle
East Technical University by,
Prof. Dr. Canan Özgen ___________________
Dean, Graduate School of Natural and Applied Sciences
Prof. Dr. Alev Bayındırlı ___________________
Head of Department, Food Engineering
Prof. Dr. Ali Esin ___________________
Supervisor, Food Engineering Dept., METU
Examining Committee Members:
Prof. Dr. Ferhunde Us ___________________
Food Engineering Dept., Hacettepe University
Prof. Dr. Ali Esin ___________________
Food Engineering Dept., METU
Prof. Dr. Alev Bayındırlı ___________________
Food Engineering Dept., METU
Assist. Prof. Dr. Deniz Çekmecelioğlu ___________________
Food Engineering Dept., METU
Assist. Prof. Dr. Ġlkay ġensoy ___________________
Food Engineering Dept., METU
Date: 07.07.2011
Page 3
iii
I hereby declare that all information in this document has been obtained and
presented in accordance with academic rules and ethical conduct. I also
declare that, as required by these rules and conduct, I have fully cited and
referenced all material and results that are not original to this work.
Name, Last name: Pervin Gizem Gezer
Signature:
Page 4
iv
ABSTRACT
MODELING DRYING KINETICS OF GRAPE SEEDS AND SKINS FROM
TURKISH CULTIVARS
GEZER, Pervin Gizem
M.Sc., Department of Food Engineering
Supervisor: Prof. Dr. Ali ESĠN
July 2011, 107 pages
Grape pomace is a valuable waste product and various end-products have been
obtained after treatments. Recently, these have been commercialized due to their
health-promoting effects. Drying is a crucial part of these treatments. This study
aimed to analyze the drying kinetics of grape pomace parts, which are seeds and
skins.
Two grape types were used in this study, namely Emir and Bogazkere varieties of
Vitis Vinifera species. Seeds and skins of each variety were dried in a tray dryer at
an air velocity of 1 m/s with four different air temperatures; 40, 50, 55 and 60°C.
The drying curves showed that the drying rate increased with the air temperature.
Six different drying models were selected from the literature and the best fitted
model was determined by application of appropriate statistical methods. It was
found that for Bogazkere seeds; Modified Two Term Model, for Bogazkere and
Page 5
v
Emir skins; Modified Page Model and for Emir skins; Logarithmic Model gave the
best fit.
The effective moisture diffusivities of each type were found for each temperature
and were determined by two different approaches, experimental and estimation. The
values and variation of Deff / L2 with temperature were calculated and were found
to be increasing with temperature and that the Deff / L2 values were larger for grape
skins than grape seeds. Arrhenius type equation was used in order to explain the
temperature dependency of Deff / L2.
Keywords: Drying, grape seed, grape skin, modeling, effective moisture diffusivity
Page 6
vi
ÖZ
TÜRK ÜZÜMLERĠNĠN KABUK VE ÇEKĠRDEKLERĠNĠN KURUTMA
KĠNETĠĞĠNĠN MODELLENMESĠ
GEZER, Pervin Gizem
Yüksek Lisans, Gıda Mühendisligi
Tez Yöneticisi : Prof. Dr. Ali ESĠN
Temmuz 2011, 107 sayfa
Üzüm posası değerli bir atık ürünüdür ve iĢlendikten sonra bir çok farklı son ürün
elde edilmektedir. Son zamanlarda, bu ürünler sağlığa yararlı etkilerinden ötürü
ticarileĢtirilmiĢtir. Kurutma, bu iĢlemlerin çok önemli bir safhasıdır. Bu çalıĢma
üzüm posasının içeriğindeki kabuk ve çekirdeklerinin kuruma kinetiklerinin
incelenmesini amaçlamıĢtır.
ÇalıĢmada Vitis Vinifera türüne ait Emir ve Bogazkere çeĢitleri olmak üzere iki
farklı üzüm kullanılmıĢtır. Her bir çeĢidin çekirdeği ve kabukları tepsili kurutucu
içerisinde 1 m/s hava hızı ve 40, 50, 55 ve 60°C olmak üzere 4 farklı hava
sıcaklığında kurutulmuĢtur. Kurutma eğrileri göstermiĢtir ki kurutma hızı hava
sıcaklığı ile artmaktadır.
Altı farklı kurutma modeli literatürden seçilmiĢ ve en iyi uyan model gerekli
istatistiksel analiz metotları uygulanarak belirlenmiĢtir. Bogazkere çekirdekleri için
Modifiye Ġki Terim modelinin, Bogazkere ve Emir kabukları için Modifiye Page
Page 7
vii
modelinin ve Emir çekirdekleri için ise Logaritmik Modelin en uygun olduğu
bulunmuĢtur.
Tüm çeĢitlerin her bir sıcaklıktaki etkin nem yayınma katsayıları bulunmuĢtur.
Bunlar iki farklı yaklaĢımla hesaplanmıĢtır. Deff / L2 değerlerinin kabuklarda
çekirdeklerden daha yüksek olduğu gözlemlenmiĢtir. Deff / L2 katsayısının
sıcaklıkla olan iliĢkisini açıklamak amacı ile Arrhenius tipi denklem kullanılmıĢtır.
Anahtar kelimeler: Kurutma, üzüm çekirdeği, üzüm kabuğu, modelleme, etkin nem
yayınma katsayıları
Page 8
viii
To my family,
Page 9
ix
ACKNOWLEDGEMENT
I would like to express my deepest gratitude and respect to my supervisor, Prof. Dr.
Ali Esin for his encouragement, guidance, supports and kindly attitude without
which this thesis could not come to a successful end. It was great honor for me to
gather the chance to be his last graduate student.
I would like to thank my examining comitee members, Assist. Prof. Dr. Deniz
Çekmecelioğlu and Prof. Dr. Ferhunde Us for their valuable comments.
Cem Baltacıoğlu always helped me in every stages of this study. His contributions
for solving technical issues were invaluable to me and I would like to thank him
also for his relieving attitude.
I would like to thank Nalan Uysal for her helpful suggestions on modeling
procedure, encouragement throughout my academic career and her warm friendship.
Destan Aytekin has always been supportive in every means. I feel myself really
lucky for being roommate with her. She was always there for me. I would like to
thank her for the endless patience and love.
I would like to express my appreciation to Gizem Aygün and Gülçin Kültür for their
great support and lovely friendship. I value their contributions to this study and their
effort to make me feel always motivated and happy.
I extent my special thanks to Sinem Yavas who was there for me to solve the
struggles of this study and Ezgi Sahin for her friendship and support during the
writing period of this thesis.
Page 10
x
My thanks are also attended to Hande Baltacıoğlu, Burak Batur, Sezen Dinçel,
Bekir Gökçen Mazı, IĢıl Barutçu Mazı, Oya Nihan Uncu, Miray Gülbiter, Burcu
Dede, Özge Aktukan, Eda Demir, Ġlkem Demirkesen Mert, Sibel Uzuner for their
friendship and help during this study.
I feel grateful to Deniz Onay and Burcu Beller. They always supported me in the
hard times of this study. I always felt their love, friendship and trust in me.
The last but never the least, my deepest appreciation goes to my family. I am
incapable of expressing my thankfulness to my brother R. Berk Gezer for his help
and encouragement not only throughout my academic studies but also in my
lifetime. Without him, it would be impossible to finish this work in this squeezed
time. My parents Öznur Gezer and Turgay Gezer have always faith in me and they
were always there for me. I wish to express my deepest love to all of them and
thank them for the endless encouragement, patience and love.
I would like to thank The Scientific and Technological Research Center for the
financial support it provided during my graduate education.
Page 11
xi
TABLE OF CONTENTS
ABSTRACT .................................................................................................................. iv
ÖZ ................................................................................................................................... vi
ACKNOWLEDGEMENT ............................................................................................ ix
TABLE OF CONTENTS.............................................................................................. xi
LIST OF TABLES ...................................................................................................... xiii
LIST OF FIGURES..................................................................................................... xvi
CHAPTERS .................................................................................................................... 1
1.INTRODUCTION ................................................................................................... 1
1.1 Grape Pomace ................................................................................................... 1
1.1.1 Contents of Grape Pomace ........................................................................ 2
1.1.2. Health Aspects of Grape Pomace ............................................................ 5
1.1.3 Processing of Grape Pomace .................................................................... 6
1.2 Drying................................................................................................................ 7
1.2.1 Types of Water and Equilibrium Moisture Content ................................ 8
1.2.2 Principles of Drying ................................................................................ 10
1.2.3 Mathematical Modeling .......................................................................... 12
1.2.4 Effective Moisture Diffusivity and Activation Energy ......................... 15
1.2.5 Drying and Quality .................................................................................. 16
1.3 Objectives of the study ................................................................................... 17
2.MATERIALS AND METHODS ......................................................................... 19
2.1 Grape Pomace ................................................................................................. 19
2.2 Sample Preparation......................................................................................... 20
2.3 Dryer................................................................................................................ 21
2.4 Mathematical Modeling ................................................................................. 23
2.5. Estimation of Effective Moisture Diffusivity .............................................. 24
2.6. Estimation of Activation Energy .................................................................. 25
3.RESULTS AND DISCUSSION .......................................................................... 26
3.2 Hot Air Drying ................................................................................................ 29
Page 12
xii
3.3 Modeling ......................................................................................................... 31
3.3.1 Emir type grape seeds.............................................................................. 32
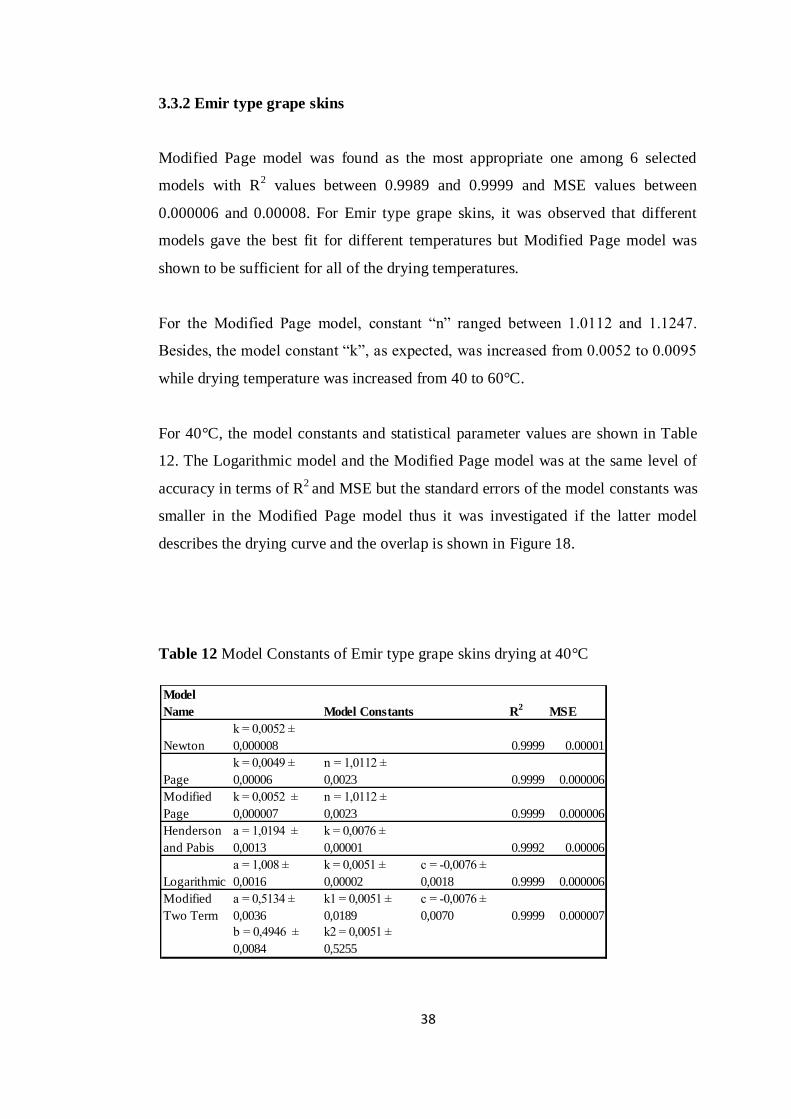
3.3.2 Emir type grape skins .............................................................................. 38
3.3.3 Bogazkere type grape seeds .................................................................... 44
3.3.4 Bogazkere type grape skins..................................................................... 49
3.4. Effective Moisture Diffusivity...................................................................... 54
4.CONCLUSION AND RECOMMENDATIONS ................................................ 58
REFERENCES ............................................................................................................. 59
APPENDICES .............................................................................................................. 69
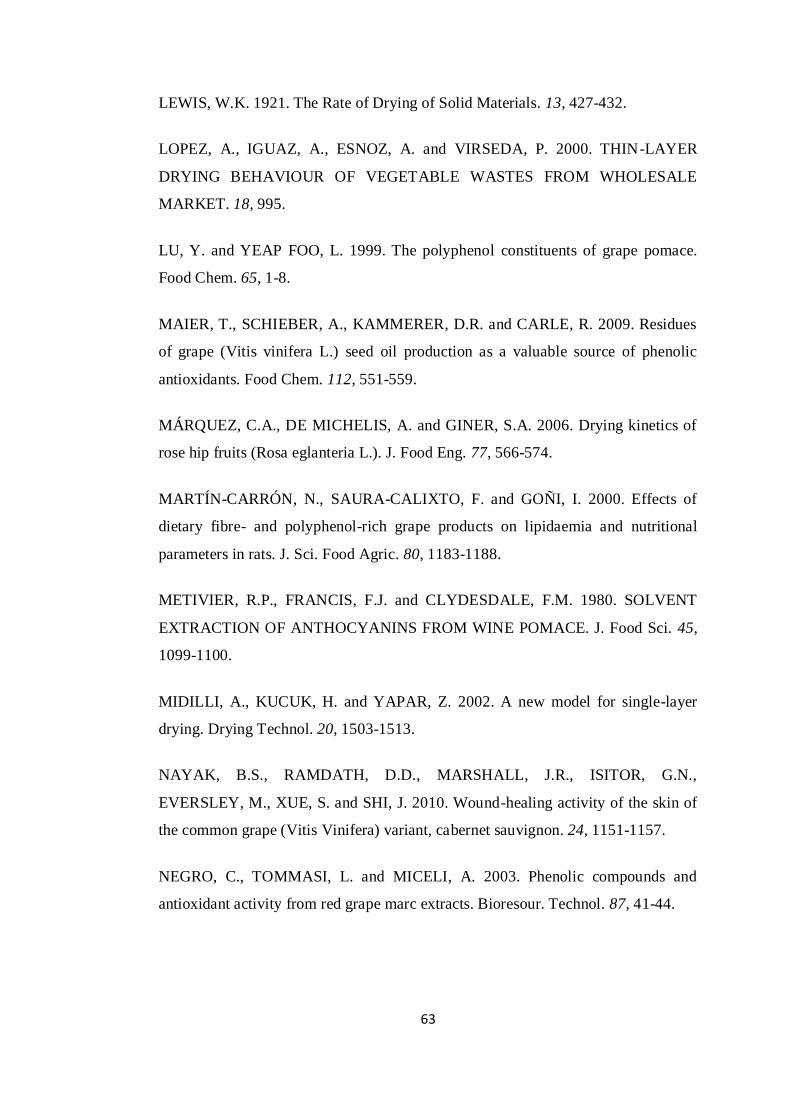
A.DRYING CONDITIONS ........................................................................................ 69
B.INITIAL MOISTURE CONTENT DATA ............................................................. 70
C.SEED DIMENSIONS .............................................................................................. 73
D.EQUILIBRIUM MOISTURE CONTENT DATA ................................................ 74
E.DRYING DATA ....................................................................................................... 76
Page 13
xiii
LIST OF TABLES
TABLES
Table 1 Grape production in Turkey. ............................................................................ 1
Table 2 Phenolic acid contents (mg/ kg DM) of the seeds and skins of a white grape
cultivar (Merzling,2001) ............................................................................................... 4
Table 3 Anthocyanin contents (mg/ kg DM) of the peels separated from the pomace
of a red grape cultivar (Cabernet Minot, 2002) ............................................................ 4
Table 4 Health Promoting Effects of Grape Pomace Products ................................... 6
Table 5 Grape Seed dimensions .................................................................................. 19
Table 6 Initial moisture contents of Grape seeds and skins....................................... 21
Table 7 Mathematical Models selected for drying curves ......................................... 23
Table 8 Model constants of Emir type grape seeds drying at 40°C .......................... 33
Table 9 Model constants of Emir type grape seeds drying at 50°C .......................... 34
Table 10 Model Constants of Emir type grape seeds drying at 55°C ....................... 36
Table 11 Model Constants of Emir type grape seeds drying at 60°C ....................... 37
Table 12 Model Constants of Emir type grape skins drying at 40°C ....................... 38
Table 13 Model Constants of Emir type grape skins drying at 50°C ....................... 40
Table 14 Model Constants of Emir type grape skins drying at 55°C ....................... 41
Table 15 Model Constants of Emir type grape skins drying at 60°C ....................... 43
Table 16 Model Constants of Bogazkere type grape seeds drying at 40°C.............. 44
Table 17 Model Constants of Bogazkere type grape seeds drying at 50°C.............. 45
Table 18 Model Constants of Bogazkere type grape seeds drying at 55°C.............. 46
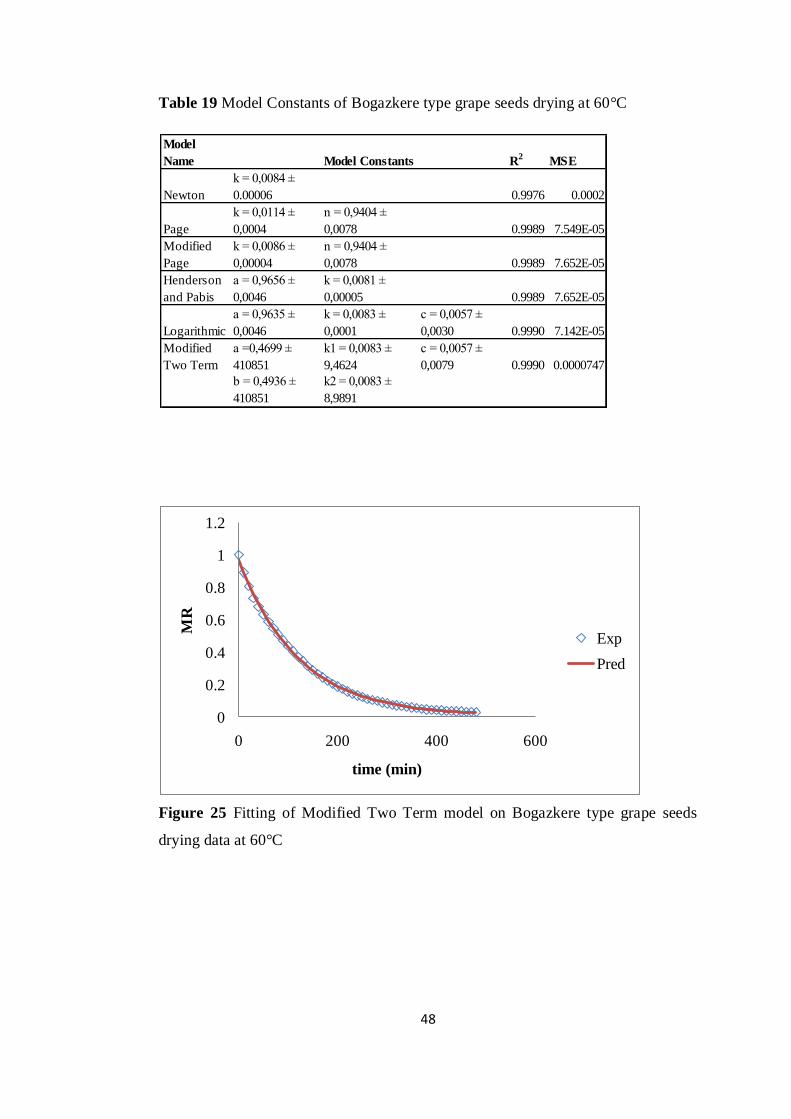
Table 19 Model Constants of Bogazkere type grape seeds drying at 60°C.............. 48
Table 20 Model Constants of Bogazkere type grape skins drying at 40°C .............. 49
Table 21 Model Constants of Bogazkere type grape skins drying at 50°C .............. 51
Table 22 Model Constants of Bogazkere type grape skins drying at 55°C .............. 51
Table 23 Model Constants of Bogazkere type grape skins drying at 60°C .............. 52
Table 24 Effective moisture Diffusivities according to the first approach ............... 54
Page 14
xiv
Table 25 Effective moisture diffusivities according to the second approach ........... 55
Table 26 Activation Energies (first approach) ........................................................... 56
Table 27 Activation Energies (second approach)....................................................... 56
Table 28 Drying conditions of grape pomace varieties ............................................. 69
Table 29 Initial moisture content data for Emir type grape seeds ............................. 70
Table 30 Initial moisture content data for Emir type grape skins ............................. 71
Table 31 Initial moisture content data for Bogazkere type grape seeds ................... 71
Table 32 Initial moisture content data for Bogazkere type grape skins .................... 72
Table 33 Emir type grape seed dimensions ................................................................ 73
Table 34 Bogazkere type grape seed dimensions ....................................................... 73
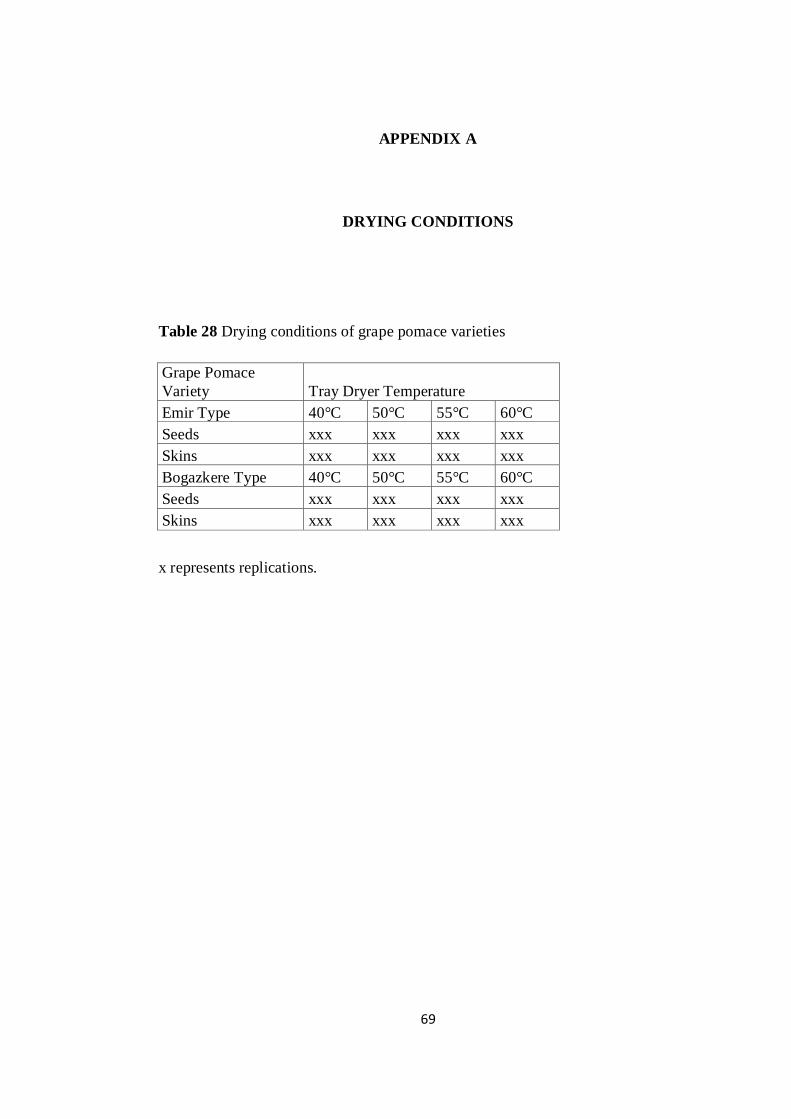
Table 35 Equilibrium moisture contents of Emir type grape seeds .......................... 74
Table 36 Equilibrium moisture contents of Emir type grape skins ........................... 74
Table 37 Equilibrium moisture contents of Bogazkere type grape seeds ................. 75
Table 38 Equilibrium moisture contents of Bogazkere type grape skins ................. 75
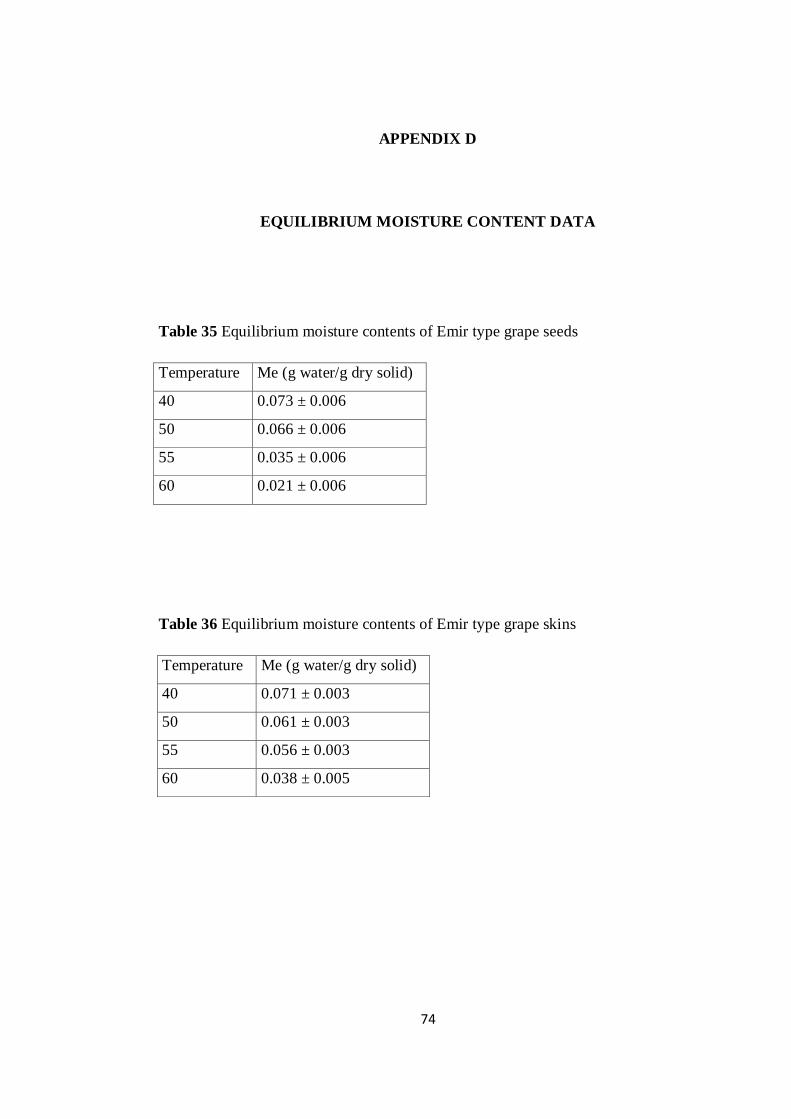
Table 39 Drying data of Emir type grape seeds at 40 ºC at air velocity of 1 m/s. ... 76
Table 40 Drying data of Emir type grape seeds at 50 ºC at air velocity of 1 m/s. ... 78
Table 41 Drying data of Emir type grape seeds at 55 ºC at air velocity of 1 m/s. ... 80
Table 42 Drying data of Emir type grape seeds at 60 ºC at air velocity of 1 m/s. ... 82
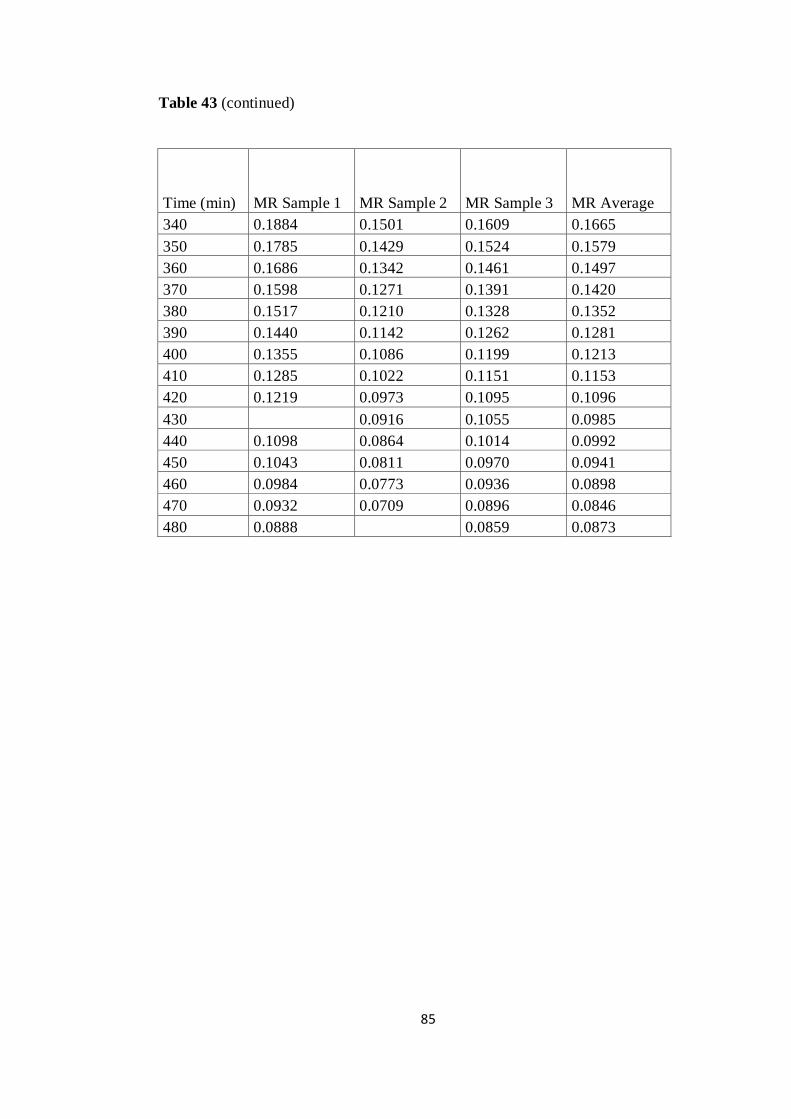
Table 43 Drying data of Emir type grape skins at 40 ºC at air velocity of 1 m/s..... 84
Table 44 Drying data of Emir type grape skins at 50 ºC at air velocity of 1 m/s..... 86
Table 45 Drying data of Emir type grape skins at 55 ºC at air velocity of 1 m/s..... 88
Table 46 Drying data of Emir type grape skins at 60 ºC at air velocity of 1 m/s..... 90
Table 47 Drying data of Bogazkere type grape seeds at 40 ºC at air velocity of 1 m/s.
....................................................................................................................................... 92
Table 48 Drying data of Bogazkere type grape seeds at 50 ºC at air velocity of 1 m/s.
....................................................................................................................................... 94
Table 49 Drying data of Bogazkere type grape seeds at 55 ºC at air velocity of 1 m/s.
....................................................................................................................................... 96
Table 50 Drying data of Bogazkere type grape skins at 60 ºC at air velocity of 1 m/s.
....................................................................................................................................... 98
Table 51 Drying data of Bogazkere type grape skins at 40 ºC at air velocity of 1 m/s.
..................................................................................................................................... 100
Page 15
xv
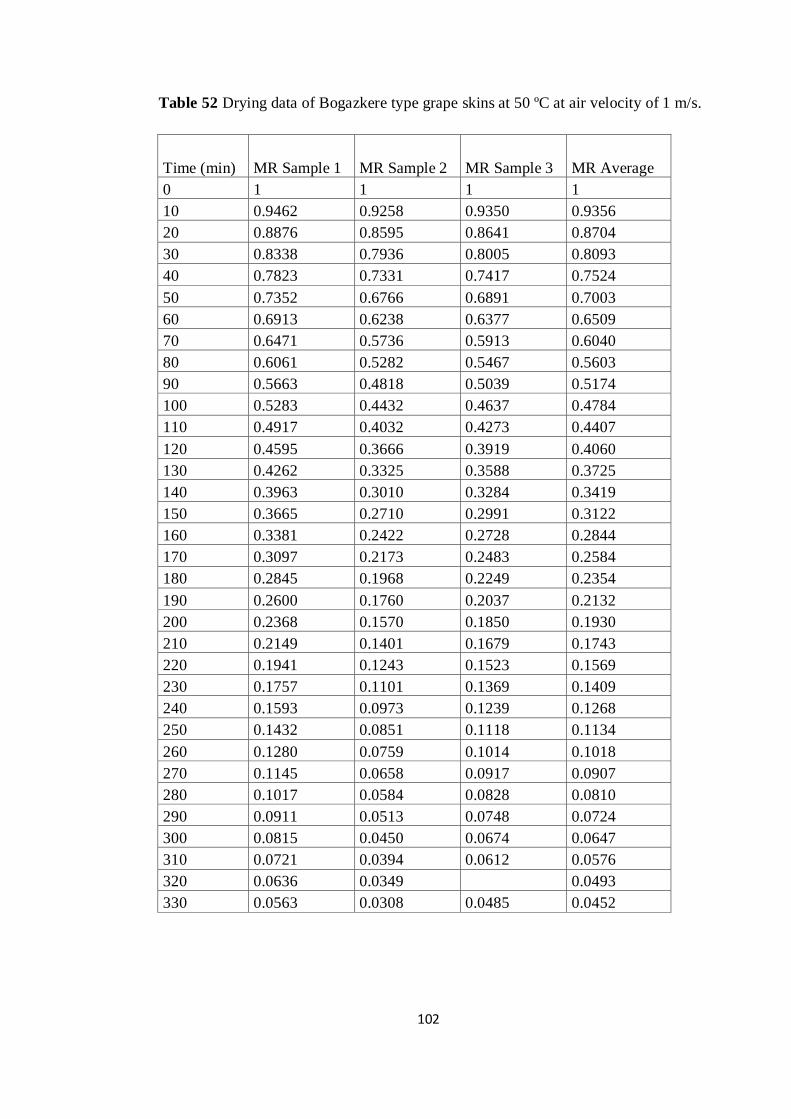
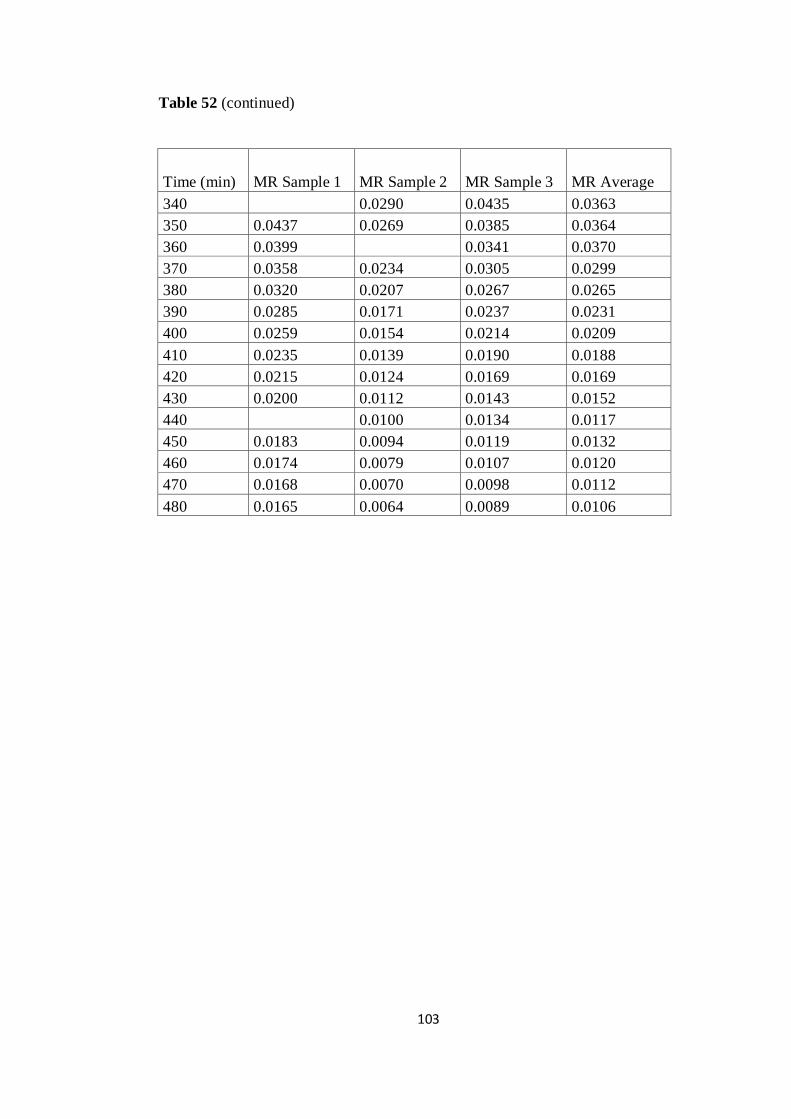
Table 52 Drying data of Bogazkere type grape skins at 50 ºC at air velocity of 1 m/s.
..................................................................................................................................... 102
Table 53 Drying data of Bogazkere type grape skins at 55 ºC at air velocity of 1 m/s.
..................................................................................................................................... 104
Table 54 Drying data of Bogazkere type grape seeds at 60 ºC at air velocity of 1 m/s.
..................................................................................................................................... 106
Page 16
xvi
LIST OF FIGURES
FIGURES
Figure 1 Water vapor sorption hysteresis isotherm representation ............................ 9
Figure 2 Typical drying rate curve under constant external conditions.................... 11
Figure 3 Representation of grape seed ........................................................................ 20
Figure 4 Laboratory scale tray dryer ........................................................................... 21
Figure 5 Position of the mesh basket inside the dryer ............................................... 22
Figure 6 Drying Rate Plot of Emir Type Grape Seed at different temperatures ...... 27
Figure 7 Drying Rate Plot of Emir Type Grape Skin at different temperatures....... 27
Figure 8 Drying Rate Plot of Bogazkere Type Grape Seed at different temperatures
....................................................................................................................................... 28
Figure 9 Drying Rate Plot of Bogazkere Type Grape Skin at different temperatures
....................................................................................................................................... 28
Figure 10 Drying curve of Emir type grape seed at different temperatures ............. 29
Figure 11 Drying curve of Emir type grape skin at different temperatures.............. 30
Figure 12 Drying curve of Bogazkere type grape seed at different temperatures .... 30
Figure 13 Drying curve Bogazkere type grape skin at different temperatures ......... 31
Figure 14 Fitting of Logarithmic model on Emir type grape seeds drying data at
40°C............................................................................................................................... 33
Figure 15 Fitting of Logarithmic model on Emir type grape seeds drying data at
50°C............................................................................................................................... 35
Figure 16 Fitting of Modified Two Term model on Emir type grape seeds drying
data at 55°C................................................................................................................... 36
Figure 17 Fitting of Modified Two Term model on Emir type grape seeds drying
data at 60°C................................................................................................................... 37
Figure 18 Fitting of Modified Page model on Emir type grape skins drying data at
40°C............................................................................................................................... 39
Page 17
xvii
Figure 19 Fitting of Modified Page model on Emir type grape skins drying data at
50°C............................................................................................................................... 40
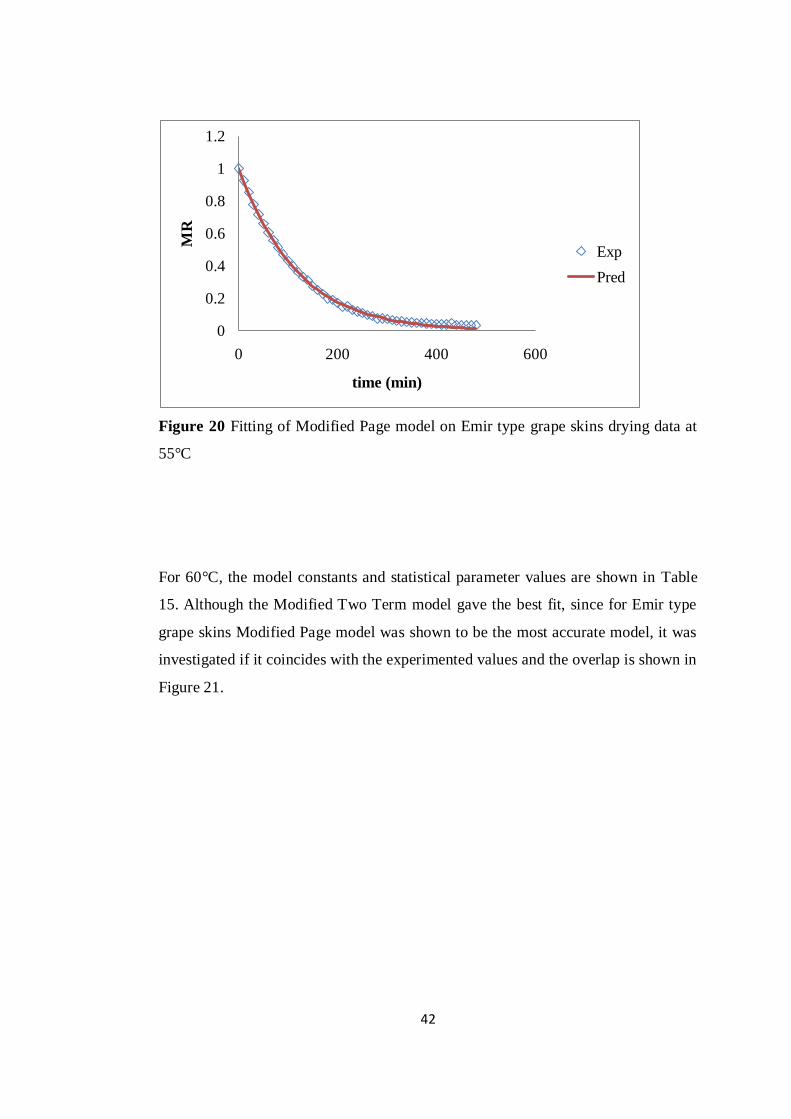
Figure 20 Fitting of Modified Page model on Emir type grape skins drying data at
55°C............................................................................................................................... 42
Figure 21 Fitting of Modified Page model on Emir type grape skins drying data at
60°C............................................................................................................................... 43
Figure 22 Fitting of Modified Two Term model on Bogazkere type grape seeds
drying data at 40°C ....................................................................................................... 45
Figure 23 Fitting of Modified Two Term model on Bogazkere type grape seeds
drying data at 50°C ....................................................................................................... 46
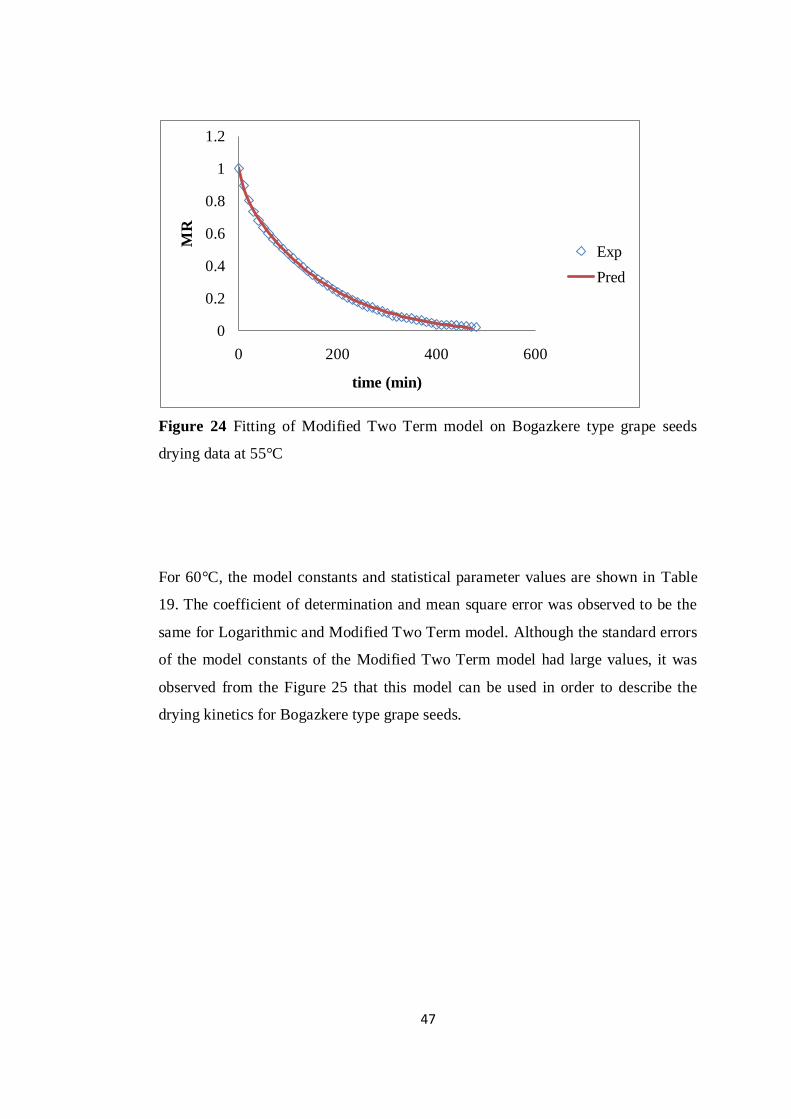
Figure 24 Fitting of Modified Two Term model on Bogazkere type grape seeds
drying data at 55°C ....................................................................................................... 47
Figure 25 Fitting of Modified Two Term model on Bogazkere type grape seeds
drying data at 60°C ....................................................................................................... 48
Figure 26 Fitting of Modified Two Term model on Bogazkere type grape skins
drying data at 40°C ....................................................................................................... 50
Figure 27 Fitting of Modified Two Term model on Bogazkere type grape skins
drying data at 50°C ....................................................................................................... 52
Figure 28 Fitting of Modified Two Term model on Bogazkere type grape skins
drying data at 55°C ....................................................................................................... 53
Figure 29 Fitting of Modified Two Term model on Bogazkere type grape skins
drying data at 60°C ....................................................................................................... 53
Page 18
1
CHAPTER 1
INTRODUCTION
1.1 Grape Pomace
Turkey processed more than 4 million tons of grapes in 2009. About 10 per cent of
the produce is used in the wine industry. The increase in the production can be seen
in Table 1
Table 1 Grape production in Turkey. (Retrieved from Turkish Statistical Institute)
Total Total Grape
Area Production
(Decare) (Tons) For table Raisins For
wine use
2004 5 200 000 3 500 000 1 900 000 1 230 000 370 000
2005 5 160 000 3 850 000 2 000 000 1 400 000 450 000
2006 5 138 351 4 000 063 2 060 167 1 495 697 444 199
2007 4 846 097 3 612 781 1 912 539 1 217 950 482 292
2008 4 827 887 3 918 442 1 970 686 1 477 471 470 285
2009 4 790 239 4 264 720 2 256 845 1 531 987 475 888
Grape pomace is a waste product of the wine factories, thus viticulture industry
faces a disposal problem for this by-product. It is commonly discharged to back
vineyard. (Doymaz, 2009; Ferrer, 2001) Generally 13.5 – 14.5% of the grapes after
crushing results in grape pomace, in extreme cases it may increase up to 20% (Russ,
Page 19
2
2004). Since it brings about a big disposal problem, their utilization in alternative
areas is investigated.
Grape pomace is re-valued by several different applications. It may be utilized as a
soil conditioner or for fertilizer production (Doymaz, 2009; Ferrer, 2001; Özkan,
2004; Arvanitoyannis, 2006) , as a feed stock for animals (Sanchez, 2002) or it may
be converted into renewable energy source (Encinar, 1998; Celma, 2007). Most
importantly, the end-products of grape pomace after various treatments serves as a
potential source of numerous health-promoting compounds and these are generally
used as dietary supplements. Production of citric acid (Soccol, 2006), food colorants
from the anthocyanins of grape skins (Francis, 1992}, laccase production by use of
grape seeds (Rodríguez Couto, 2006) are other ways of benefiting from this waste
product.
1.1.1 Contents of Grape Pomace
Grape pomace is composed of skins, seeds and stems, which is also referred as
grape marc. It is a highly valuable waste product of wine processing due to its
contents while the composition of each may significantly vary according to the
vinification technique and grape variety (Schieber, 2001). The percentage of grape
seeds in the grape pomace is generally 26, whereas depending on the type it may be
as high as 50 (Doymaz, 2009; Roberts, 2008).
The fact that wine is a very important source of phenolic compounds, leads to the
question that if grape pomace also consists of these phenols and various researchers
studied this topic. It is found that due to the low efficiency of the extraction process
during winemaking, grape pomace generally consists of phenols at high amounts of
the type anyhocyanins, catechins, flavanol glycosides, phenolic acids and alcohols,
and stilbenes as the main constituents (Schieber, 2001).
Page 20
3
In addition to phenolic compounds, grape pomace is also a good source of
numerous other valuable constituents like ethanol, tartrates and malates, citric acid,
grape seed oil, hydrocolloids and dietary fiber(Kammerer, 2004; Lu 1999).
Distinctive studies have been conducted for treated or untreated grape pomace in
order to determine the composition of phenolic compounds. A study about grape
marc revealed that polyphenols of gallic acid, furfural, catechin, vanillic acid,
epicatechin in amounts between 0.27 and 9.66 mg/L depending on the type of the
phenol are present in the marc (Alonso, 2002). Another study about grape seed flour
declared that it contains a wide variety of proanthocyanidins, which is a complex
mixture of monomers, oligomers and polymers of (+)-catechin, (−)-epicatechin, (+)-
gallocatechin, (−)-epigallocatechin and their 3-O-gallic acid esters. Besides its high
antioxidant content, grape seed flour contains high dietary fiber up to 40% (Özvural,
2011).
The difference between grape pomace fractions of seeds and skins or peels in terms
of polyphenol contents is studied by some researchers. Grape seed extract of a red
grape variety, is richer in phenolic content than that of skin (Negro, 2003). A
similar case is observed in comparison with white grapes (Martín-Carrón, 2000).
On the other hand, the antioxidant activity of these phenolic compounds is found to
be higher in grape peel extracts (Shaker, 2006). Besides, grape skins possess a
compound named resveratrol, which is not present in other parts of the grape.
Resveratrol is a phytoestragen that takes preventive action against cardiovascular
diseases (Frémont, 2000).
The phenolic acid contents of the seeds and skins of a white grape cultivar is given
in Table 2 and the anthocyanin content of red grape peels is tabulated in Table 3.
Page 21
4
Table 2 Phenolic acid contents (mg/ kg DM) of the seeds and skins of a white grape
cultivar (Merzling,2001) (retrieved from (Kammerer, 2004))
Phenolic Acid Types Skins Seeds
gallic acid 15.0 ± 0.2 106.5 ± 8.8
protocatechuic acid 42.8 ± 0.5 102.8 ± 25.5
caftaric acid 61.0 ± 2.8 9.3 ± 3.4
p-hydroxybenzoic acid 31.1 ± 0.1 13.8 ± 0.9
coutaric acid 54.5 ± 1.4 30.2 ± 16.3
caffeic acid 1.7 ± 0.2 1.9 ± 0.6
fertaric acid 17.3 ± 1.1 3.0 ± 0.1
syringic acid 1.0 ± 1.2 1.1 ± 0.1
p-coumaric acid Not detected 7.2 ± 0.7
ferulic acid 2.6 ± 0.0 3.9 ± 0.4
sinapic acid Not detected 1.0 ± 0.1
Table 3 Anthocyanin contents (mg/ kg DM) of the peels separated from the pomace
of a red grape cultivar (Cabernet Minot, 2002) (retrieved from(Kammerer, 2004))
Anthocyanin name* Content
del 3-O-glc 2213 ± 38
cya 3-O-glc 759 ± 35
pet 3-O-glc 2643 ± 18
peo 3-O-glc 4960 ± 16
mal 3-O-glc 20533 ± 92
del 3-O-acglc 392 ± 26
pet 3-O-acglc 545 ± 32
peo 3-O-acglc 1371 ± 82
mal 3-O-acglc 3110 ± 106
cya 3-O-pcmglc 374 ± 8
pet 3-O-pcmglc 974 ± 26
peo 3-O-pcmglc 2151 ± 94
mal 3-O-pcmglc 10591 ± 201
total AC content 50616 ± 774
* Abbreviations: del, delphinidin; cya, cyanidin; pet, petunidin; peo, peonidin; mal,
malvidin; glc, glucose; ac, acetyl; pcm, p-coumaroyl; AC, anthocyanin.
Page 22
5
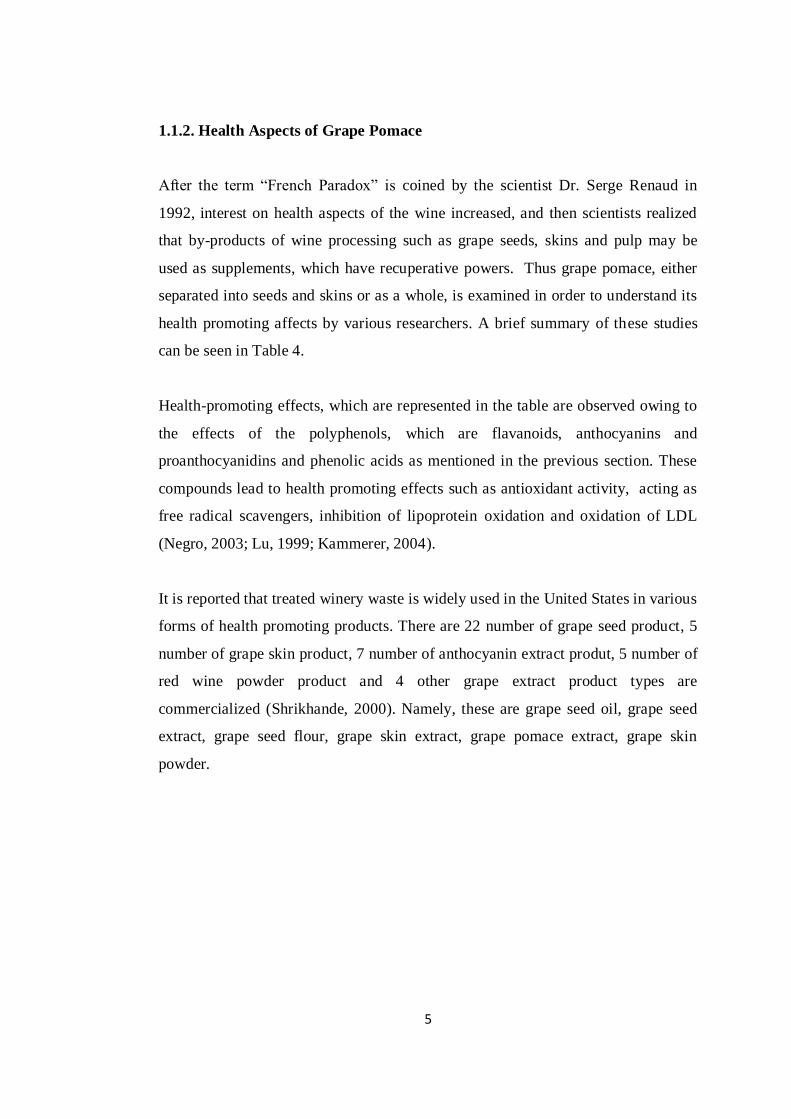
1.1.2. Health Aspects of Grape Pomace
After the term ―French Paradox‖ is coined by the scientist Dr. Serge Renaud in
1992, interest on health aspects of the wine increased, and then scientists realized
that by-products of wine processing such as grape seeds, skins and pulp may be
used as supplements, which have recuperative powers. Thus grape pomace, either
separated into seeds and skins or as a whole, is examined in order to understand its
health promoting affects by various researchers. A brief summary of these studies
can be seen in Table 4.
Health-promoting effects, which are represented in the table are observed owing to
the effects of the polyphenols, which are flavanoids, anthocyanins and
proanthocyanidins and phenolic acids as mentioned in the previous section. These
compounds lead to health promoting effects such as antioxidant activity, acting as
free radical scavengers, inhibition of lipoprotein oxidation and oxidation of LDL
(Negro, 2003; Lu, 1999; Kammerer, 2004).
It is reported that treated winery waste is widely used in the United States in various
forms of health promoting products. There are 22 number of grape seed product, 5
number of grape skin product, 7 number of anthocyanin extract produt, 5 number of
red wine powder product and 4 other grape extract product types are
commercialized (Shrikhande, 2000). Namely, these are grape seed oil, grape seed
extract, grape seed flour, grape skin extract, grape pomace extract, grape skin
powder.
Page 23
6
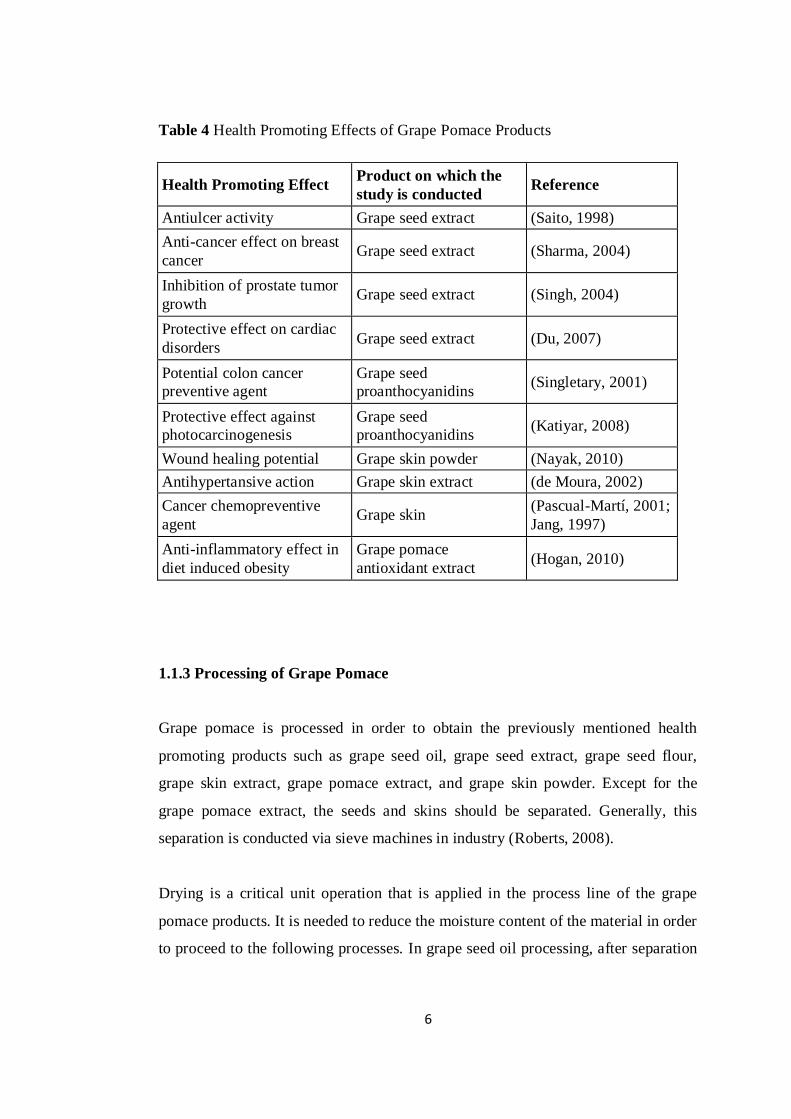
Table 4 Health Promoting Effects of Grape Pomace Products
Health Promoting Effect Product on which the
study is conducted Reference
Antiulcer activity Grape seed extract (Saito, 1998)
Anti-cancer effect on breast
cancer Grape seed extract (Sharma, 2004)
Inhibition of prostate tumor
growth Grape seed extract (Singh, 2004)
Protective effect on cardiac
disorders Grape seed extract (Du, 2007)
Potential colon cancer
preventive agent
Grape seed
proanthocyanidins (Singletary, 2001)
Protective effect against
photocarcinogenesis
Grape seed
proanthocyanidins (Katiyar, 2008)
Wound healing potential Grape skin powder (Nayak, 2010)
Antihypertansive action Grape skin extract (de Moura, 2002)
Cancer chemopreventive
agent Grape skin
(Pascual-Martí, 2001;
Jang, 1997)
Anti-inflammatory effect in
diet induced obesity
Grape pomace
antioxidant extract (Hogan, 2010)
1.1.3 Processing of Grape Pomace
Grape pomace is processed in order to obtain the previously mentioned health
promoting products such as grape seed oil, grape seed extract, grape seed flour,
grape skin extract, grape pomace extract, and grape skin powder. Except for the
grape pomace extract, the seeds and skins should be separated. Generally, this
separation is conducted via sieve machines in industry (Roberts, 2008).
Drying is a critical unit operation that is applied in the process line of the grape
pomace products. It is needed to reduce the moisture content of the material in order
to proceed to the following processes. In grape seed oil processing, after separation
Page 24
7
of the seeds, oil is produced by pressing with a screw extrusion press (Maier, 2009)
or alternatively with cold mechanical pressing and in these processes having
moisture content below 0.10 g/g dry solids is needed (Roberts, 2008).
Separation of seed and skin fractions of the grape pomace is also an essential part of
the production since they can form products which have distinctive properties. It is
claimed (Roberts, 2008) that drying the seed together with the pomace is not a
practical approach not only because it is energy inefficient but also separating
afterwards demands more effort and re-wetting process unless grape pomace extract
is to be produced.
In grape seed flour and grape skin powder production stages, milling of the material
required. For grape skin or seed extracts, extraction of nutritious compounds is the
most important part of the production line and it can be conducted via various
solvents such as water, ethanol, methanol and acids such as hydrochloric, citric,
tartaric, formic, acetic and propionic acids (Metivier, 1980).
1.2 Drying
Drying is defined as the removal of volatile substances by energy application from a
mixture that in the end yields a solid product. In general, the volatile substance is
water. (Keey, 1972) Drying is one of the oldest methods used for preservation of
foods and it is still widely used in today‘s food industry.
Whereas the main aim of the drying is to preserve food materials by prolonging the
shelf life, there may be other objectives in applying this unit operation. These
objectives are generally one or combination of the followings:
Attaining demanded color, texture or flavor
Reducing the size and weight of the material for ease of transportation
Obtaining a specific physical form of a food material
Page 25
8
In food industry, various types of drying techniques such as solar, freeze, hot-air,
spray drying, osmotic dehydration, microwave, impregnation and vacuum drying
are applied alone or in combinations (Vega, 2007). Only around 20 types of dryer
are used generally in practice from about 200 diverse types of dryer designed and
used in industry so far (Baker, 1997). The key factors of selecting a suitable dryer
can be expressed as optimizing energy requirements and cost, beholding
environmental and safety concerns and acquiring the desired product quality.
Generally, drying methods can be classified by two approaches, one is according to
the mode of operation which is continuous or batch, the other is in relation to
method of supplying heat which are conduction, convection, radiation or dielectric
heating (Keey, 1972). About 90% of the production of dehydrated food products is
carried by means of convective method of heating. Although convective dryers may
be at times thermally inefficient, they ensure protection of the material from
overheating (Baker, 1997).
1.2.1 Types of Water and Equilibrium Moisture Content
Drying must be approached from the side of equilibrium relationships between the
material being dried and air-water vapor mixture. When the solid material is
contacted with air having a constant humidity for a sufficiently long period,
ultimately the solid will reach definite moisture content. This is regarded as
equilibrium moisture content (Geankoplis, 2003).
The value of the equilibrium moisture content relies on the direction from which the
equilibrium is attained. In fact, it depends on if the solid is dried (desorption) or
wetted (adsorption). There is an observed closed-loop relation, called hysteresis and
desorption isotherm always shows a larger value of equilibrium moisture content. In
Figure 1, this phenomenon is shown (Keey, 1972).
Page 26
9
Figure 1 Water vapor sorption hysteresis isotherm representation (Wolf, 1972).
The relationship between equilibrium moisture content and temperature can be
described as inversely proportional. The equilibrium moisture content of a solid
material decreases with an increase in temperature. Moreover, up to date, it has not
been possible to find equilibrium moisture contents of various substances via
theoretical understanding. It is needed to find empirical relationships for each of the
material while these relationships may differ from sample to sample of the same
type of substance (Geankoplis, 2003).
If the equilibrium moisture content of a given material is continued to its
intersection with the hundred percent humidity line, the moisture is called bound or
interdependent water. The bound water may exist in cell or fiber walls in a
dissolved state or in very thin concaved capillaries in liquid state or in adsorbed
form onto surfaces. This type of water is in interaction with solid material by
Page 27
10
forming mono or multi-layer water molecules. Arising from any of the mentioned
mechanisms, this water has a lower vapor pressure than the liquid water at the same
temperature. Another type of water is unbound or so-called free water. Free
moisture amount is the moisture above the equilibrium moisture content and it has
the same vapor pressure as the liquid water at the same temperature. This type of
water is present in the interstitial places or inside the pores of a material and is
grasped by physical force linked to surface tension (Geankoplis, 2003; Keey, 1972).
1.2.2 Principles of Drying
When food is exposed to a hot air stream, heat, which is sufficient for latent heat of
vaporization, is supplied to the surface and the water starts to evaporate. This water
vapor is transported away by means of air flow. A low water vapor pressure at the
surface occurs due to the water removal and a vapor pressure gradient is created
between the inner parts of the food which has high amount of moisture and the
outer part of the food which is in contact with air. This gradient results in the
movement of water molecules to the surface via the following mechanisms
(Geankoplis, 2003; Keey, 1972):
Capillary action due to surface tension
Capillary action due to interfacial tension (Capillary forces)
Diffusion of water vapor
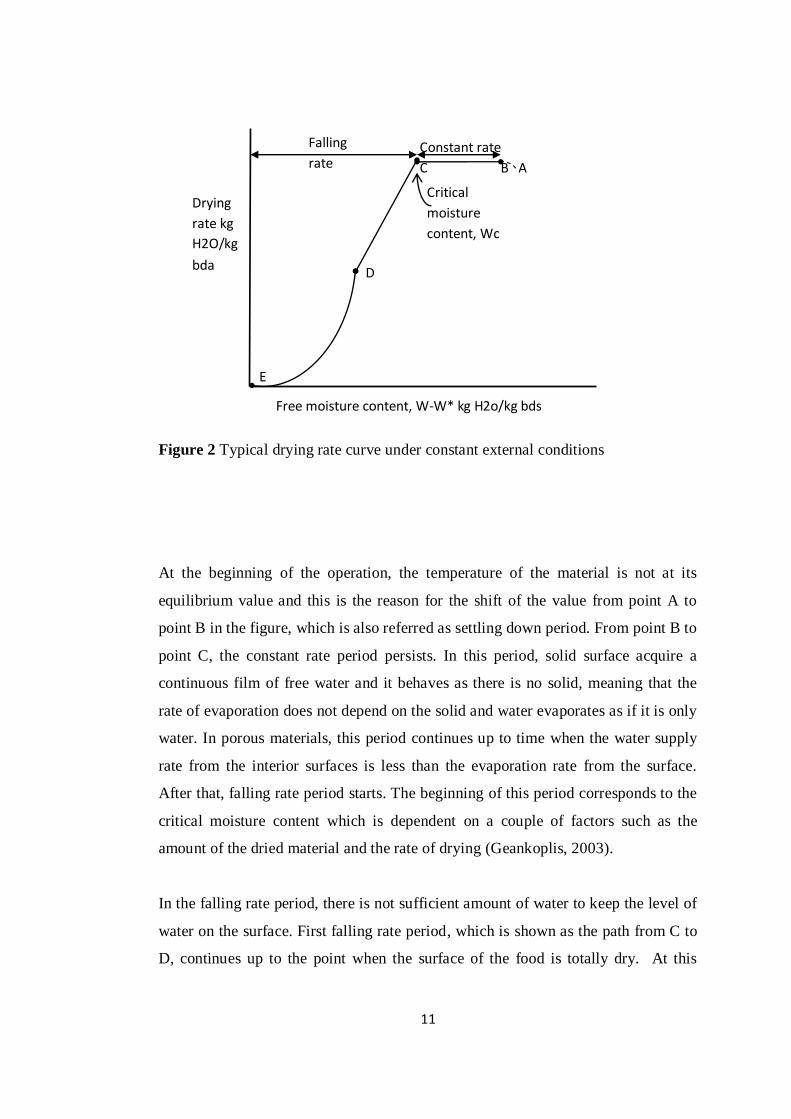
Drying behavior of a material, which is exposed to a constant temperature and
relative humidity has been generally explained in three characteristic steps: a
settling down period, a constant rate period and a falling rate period (Chen, 2008;
Geankoplis, 2003; Keey, 1972). This behavior is shown in Figure 2 for drying under
constant temperature and humidity.
Page 28
11
Figure 2 Typical drying rate curve under constant external conditions
At the beginning of the operation, the temperature of the material is not at its
equilibrium value and this is the reason for the shift of the value from point A to
point B in the figure, which is also referred as settling down period. From point B to
point C, the constant rate period persists. In this period, solid surface acquire a
continuous film of free water and it behaves as there is no solid, meaning that the
rate of evaporation does not depend on the solid and water evaporates as if it is only
water. In porous materials, this period continues up to time when the water supply
rate from the interior surfaces is less than the evaporation rate from the surface.
After that, falling rate period starts. The beginning of this period corresponds to the
critical moisture content which is dependent on a couple of factors such as the
amount of the dried material and the rate of drying (Geankoplis, 2003).
In the falling rate period, there is not sufficient amount of water to keep the level of
water on the surface. First falling rate period, which is shown as the path from C to
D, continues up to the point when the surface of the food is totally dry. At this
Falling
rate Constant rate
C B A
D
E
Critical
moisture
content, Wc
Drying
rate kg
H2O/kg
bda
Free moisture content, W-W* kg H2o/kg bds
Page 29
12
point the second falling rate period starts. Heat needed for evaporation is transferred
through the surface to the vaporization regions and water vapor is moved by means
of air in the solid. At some cases, no sharp shift occurs at point D due to very low
drying rate, this shift is not detectable. The falling rate period is the longest stage of
drying and in some foods, if the initial moisture content is less than the critical
moisture content, only falling rate period is monitored (Geankoplis, 2003). The
researchers reported that there is only falling rate drying period in grape marc and
pulp drying (Doymaz, 2009) and grape seed drying ( Roberts, 2008).
1.2.3 Mathematical Modeling
Mathematical modeling is the most essential part of drying technology. It is
required for the decision on the optimum operating conditions and then designing
the drying equipment complying with the desired operating conditions. (Gunhan,
2005) The theory of modeling is based on having a bunch of mathematical
equations that can effectively describe the system. Particularly, by applying these
equations the operation parameters can be predicted as a function of time only with
the knowledge of initial conditions of the process. (Hawlader, 1997; Strumillo,
1986) The mathematical representation of water removal during the unit operation
is also recognized as drying kinetics.
Since drying is a very complex process including simultaneous heat and mass
transfer, the governing equations are almost impossible to solve without using
numerical methods. Thus, making use of following assumptions, simplified models
that can be solved by analytical approach are obtained;
1. Negligible shrinkage
2. Uniform initial moisture distribution
3. Constant diffusivity coefficient
4. Negligible external resistance
Page 30
13
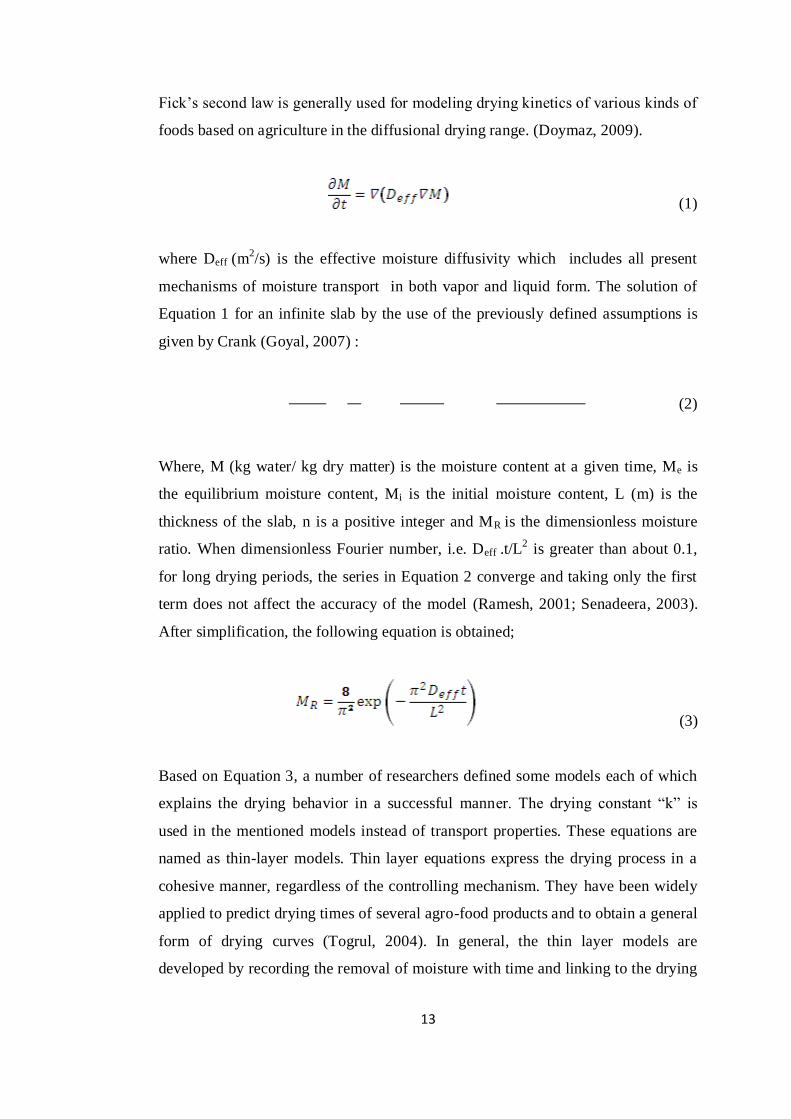
Fick‘s second law is generally used for modeling drying kinetics of various kinds of
foods based on agriculture in the diffusional drying range. (Doymaz, 2009).
(1)
where Deff (m2/s) is the effective moisture diffusivity which includes all present
mechanisms of moisture transport in both vapor and liquid form. The solution of
Equation 1 for an infinite slab by the use of the previously defined assumptions is
given by Crank (Goyal, 2007) :
(2)
Where, M (kg water/ kg dry matter) is the moisture content at a given time, Me is
the equilibrium moisture content, Mi is the initial moisture content, L (m) is the
thickness of the slab, n is a positive integer and MR is the dimensionless moisture
ratio. When dimensionless Fourier number, i.e. Deff .t/L2 is greater than about 0.1,
for long drying periods, the series in Equation 2 converge and taking only the first
term does not affect the accuracy of the model (Ramesh, 2001; Senadeera, 2003).
After simplification, the following equation is obtained;
(3)
Based on Equation 3, a number of researchers defined some models each of which
explains the drying behavior in a successful manner. The drying constant ―k‖ is
used in the mentioned models instead of transport properties. These equations are
named as thin-layer models. Thin layer equations express the drying process in a
cohesive manner, regardless of the controlling mechanism. They have been widely
applied to predict drying times of several agro-food products and to obtain a general
form of drying curves (Togrul, 2004). In general, the thin layer models are
developed by recording the removal of moisture with time and linking to the drying
Page 31
14
conditions for samples which are exposed to constant temperature and relative
humidity (Midilli, 2002)
Thin layer models are used to describe the drying behavior of several food materials
such as banana (Dandamrongrak, 2002), eggplant (Ertekin, 2004), carrot
(Prabhanjan, 1995), olive cake (Akgun, 2005), rosehip (Erenturk, 2004) , black tea
(Panchariya, 2002), corn(Henderson, 1961) , apple pomace (Sun, 2007), grape seeds
(Roberts, 2008), vegetable waste, (Lopez, 2000) and bagasse (Vijayaraj, 2007),
grape marc and pulp (Doymaz, 2009), hull-less seed pumpkin (Sacilik, 2007), corn
(Doymaz, 2003), red pepper (Akpinar, 2003), pistachio nuts (Kashaninejad, 2007),
apricots, peaches, figs, plums, grapes (Ertekin, 2004).
Henderson and Pabis model is an equivalent of the simplified form of the Fick‘s
second law which resulted in Equation 3. This model was developed in order to
describe the drying behavior of corn (Henderson, 1961) and can be written as:
(4)
The Lewis model is in fact a particular case of the previous model where ―a‖ is
equal to one. This model basically described that the moisture removal from the
agricultural materials may be perceived as analogous to the heat flow from a body
immersed in a fluid at low temperatures. This equation is considered in parallel with
Newton‘s law of cooling and it is also named as Newton model. Other names such
as exponential model and simple model are used for referring this equation in the
literature. It was applied in the modeling of drying of black tea (Panchariya, 2002).
The mathematical equation is:
(5)
In 1949 Page developed a model via modification the Lewis model by addition of
an exponent to the time term that is expected to describe the system better than the
Page 32
15
simple model. The model is given as (Doymaz, 2005; Panchariya, 2002; Simal,
1997)
(6)
Modified Page model is formed from Page model by introducing an exponential to
the k term and it is seen that it describes the drying behavior of soybean and
popcorn (Overhults, 1973; White, 1981; White, 1978) with the following equation:
(7)
Logarithmic model is another commonly used equation for describing drying
mechanism. It has been used in estimating drying rates of olive cake and rosehip
and has given good fits. (Erenturk, 2004; Akgun, 2005) It is defined as:
(8)
Other models are found in the literature such as Wang and Singh model (Wang,
1978), Midilli (Midilli, 2002), Verma (Verma, 1985), two term model (Sharaf-
Eldeen, 1970). The multiplicity of the models arose from the complexity of the
drying operation. This complexity results from the variability of biological and
structural properties thus it is very hard to define a general model (Márquez, 2006).
1.2.4 Effective Moisture Diffusivity and Activation Energy
Effective moisture diffusivity in solids which is represented in Equation 3 depends
on the temperature of the medium where the drying takes place. In general, the
Page 33
16
effect of temperature on Deff is mathematically related with an Arrhenius type
equation which is (Doymaz, 2009; Roberts, 2008; Srikiatden, 2006):
(9)
where Ea (kJ/mol) is the activation energy , T is the absolute air temperature (K) , R
is the universal gas constant (kJ/mol K) and D0 (m2/s) is a constant.
According to the study of Roberts, (2008), the temperature dependency of the
effective moisture diffusivities of the grape seeds from the types Riesling, Cab
Franc and Concord were found to obey Equation 9 and the activation energy of
each were in the range 30.45 and 40.14 kJ/mol. Furthermore, the activation energies
of grape marc and pulp were reported as 25.41 and 13.47 kJ/mol, respectively
(Doymaz, 2009). These are also comparable with the values of hull-less seed
pumpkin 33.15 kj/mol. (Sacilik, 2007), apple pomace (Sun, 2007), vegetable waste,
(Lopez, 2000) and bagasse (Vijayaraj, 2007).
1.2.5 Drying and Quality
Foods are composite biological substances, which are valuable for their nutritional,
health promoting, and energy supplying properties. When a food is exposed to heat
in drying process, its physical condition is changed, which leads to quality and
safety alterations. It can be said that the aim in drying operation is to keep the
‗acceptable-to-excellent‘ position of the foods by extending the shelf life together
with preserved nutritional values, which are proteins, minerals, vitamins and other
bioactive compounds (Chen,X.D. 2008).
The main aim of the thermal processing is to achieve the death of various
undesirable microorganisms; however it may lead to adverse affects such as loss of
vitamins. An optimization via conducting experiments is required for each of food
Page 34
17
material since biochemical compositions and target microorganisms of each
foodstuff is different than the other (Geankoplis, 2003).
For a thorough understanding on the effects of drying on quality, the process can be
discussed in three stages, namely pre-drying, drying and post-drying. Pre-drying
includes operations that are required to remove excess moisture before the drying
operation and post-drying consist of product-specific processes such as cooling,
packaging, storage and rehydration. Various studies are published in order to
comprehend the stability during pre-drying and pos-drying stages but in fact, the in-
drying stage is the main step where crucial changes on physiology and biology of
foods occur (Chen, 2008).
During drying of waste products of wine or juice processes, change in antioxidant
activity and polyphenols‘ stability desire much of the interest. It has been found that
at high temperatures the phenolic antioxidants show decomposition to an important
extend by evoking various breakdown products (Hamama, 1991). A study on
thermal stability of the grape pomace peels revealed that when the conventional
drying temperature is 100 and 140 °C, total extractable polyphenols and condensed
tannins is reduced significant significantly, whereas drying at 60 °C these are not
affected notably. Furthermore, up to 60 °C no effect is observed on the antioxidant
activity while at 100 and 140 °C a decrease of 28 and 50% is reported (Larrauri,
1997). Thus, drying temperature should be carefully selected in order not to lose the
bioactive compounds in pomace. In another study, it is reported that freeze-drying
did not lead to any reduction in antioxidant power of grape marc phenolic extracts
with noting that further studies are needed to understand antioxidant maintenance
during storage (70 Spigno, 2007).
1.3 Objectives of the study
Grape pomace is a valuable waste product of wine industry. It is utilized by various
methods and it turns into different end-products. For most of these products, drying
Page 35
18
is a crucial step in the process line. This study aims to investigate the drying
kinetics of the grape pomace fractions which are seeds and skins.
The grape types used in the study are from two varieties, namely Bogazkere and
Emir of the types red and white, respectively. The drying characteristics of these
samples are to be described. Optimum thin-layer drying model will be determined
for this purpose.
Four different temperatures were selected to test the effect of temperature. The
maximum drying temperature was decided to be 60 ºC in order to stay in the safe
region for protecting the nutritional values. Effective moisture diffusivities of each
sample was calculated. The temperature dependency of the effective moisture
diffusivity was estimated via an Arrhenius type equation.
Page 36
19
CHAPTER 2
MATERIALS AND METHODS
2.1 Grape Pomace
Grape pomace, which is a waste material of wine processing, was provided by
Kavaklıdere Winery, Ankara. Two types of grape pomace were used in drying
experiments. One of them was black grape pomace, which was from Vitis vinifera
species of the variety Bogazkere, grown in the region Diyarbakir and the other one
was white grape pomace which was from Vitis vinifera species of the variety Emir,
grown in the region Nevsehir (Kavaklıdere Anatolian Wines). The dimensions of
the grape seeds are given in Table 5 , where L symbolizes the length of the seed and
―a‖ stands for the height of the seed from the wide part. Figure 3 shows a
representation of seed shape. Measured raw data can be found in Appendix C.
Grape pomace was separated into partitions and kept frozen at -20°C until use.
Table 5 Grape Seed dimensions
Grape Type L (mm) a (mm)
Emir 6.30 ± 0.58 3.60 ± 0.47
Bogazkere 6.60 ± 0.33 3.90 ± 0.28
Page 37
20
Figure 3 Representation of grape seed
2.2 Sample Preparation
Grape pomace was maintained at the refrigerator temperature (4°C) in order to
obtain thawing prior to drying. Thawed grape pomace was separated into seeds and
skins by hand.
For analysis of initial moisture content, samples (seeds or skins), were weighed by
an electronic balance (Kern, EW 1500-2M, 0.01g sensitivity, Germany) and then
placed in an oven (Simsek Laborteknik, ST-055, Turkey) at 100 ± 1°C for 24 hours
until the constant weight was reached. The moisture content measurements were
performed in duplicates. The average initial moisture contents of the grape seeds
and skins are given in Table 6 and the raw is available in Appendix B.
Page 38
21
Table 6 Initial moisture contents of Grape seeds and skins
2.3 Dryer
The drying experiments were conducted in a laboratory scale tray dryer (Armfield
Ltd., D27412, Hampshire, England) (Figure 4). It consists of a rate adjustable fan
and an adjustable electrical heater with setting switches. The flow cross-section
throughout the dryer was 22 x 22 cm2. Air was circulated in the dryer by a motor
driven axial flow fan impeller.
Figure 4 Laboratory scale tray dryer
Type Moisture Content (g water / g dry solid)
Emir Seeds 0.68 ± 0.03
Emir Skins 2.21 ± 0.18
Bogazkere Seeds 1.11 ± 0.06
Bogazkere Skins 5.69 ± 0.20
Page 39
22
Before drying of the samples, dryer was operated in order to reach the desired
steady-state temperature. After the system had reached the steady state, sample was
inserted into the drying tunnel through a latched side door with a glass panel for
viewing purposes.
Drying of samples was carried out under constant external conditions at four
different air temperatures (40, 50, 55 and 60°C) at constant relative humidity (18.9
± 3.9 %, 10.6 ± 3.1 %, 8.5 ± 0.8 %, 7.7 ± 1.2 % , respectively) by using 1 m/s air
velocity. Relative humidity of the air was measured with a hygrometer (Comet,
S3121, Czech Republic). For sample weight measurements, a digital balance (Kern,
PFB 1200-2, 0.01g sensitivity, Germany), with a hanger rod attached to bottom of
the balance was used. Samples were positioned in a mesh basket as a thin layer of
constant thickness and the basket were suspended into the tunnel dryer in parallel
position to the air flow in attached position to the hanger rod (Figure 5). The weight
of the samples was measured every 10 minutes throughout drying for 8 hours. All
experiments were performed in triplicate.
Figure 5 Position of the mesh basket inside the dryer
Page 40
23
Dry bulb temperature of the air stream was measured by means of a digital
temperature indicator (Dixi, England) having a thermocouple and digital display.
The temperature of the experiments was controlled in every 10 minutes and it is
attained in the ± 1°C.
2.4 Mathematical Modeling
Drying kinetics of grape seeds and skins were studied in order to find the most
suitable model among five different thin-layer drying models, which are presented
in Table 7.
Table 7 Mathematical Models selected for drying curves
Model Name Model Equation References
Newton (Lewis or
Exponential) MR = exp (-kt) (Panchariya, 2002)
Page MR = exp (-ktn)
(Doymaz, 2005; Panchariya,
2002; Simal, 1997)
Modified Page MR = exp (-(kt)n)
(White, 1978; White, 1981;
Overhults, 1973)
Henderson and
Pabis MR = aexp (-kt) (Henderson, 1961)
Logarithmic MR = aexp (-kt) + c
(Erenturk, 2004; Akgun,
2005)
Modified Two
Term Model MR = aexp(-k1t) +bexp(-k2t)+c
MR represents the dimensionless moisture content, having the formula
(10)
Page 41
24
where M (kg water/ kg dry matter) is the moisture content at a given time, Me is the
equilibrium moisture content, Mi is the initial moisture content. Me is measured by
waiting when there is no more decrease in the weight of the sample.
The regression analysis was performed by means of SigmaTM
Plot 12.0. The model
constants and regression coefficients were determined by this software. The drying
curves were plotted as dimensionless moisture ratio versus time in order to visualize
the drying behavior of the samples.
Coefficient of determination, R2 and mean square residual error, MSE were used in
order to estimate the adequacy of fit. Best fit was obtained when R2
is equal to
―one‖ and MSE is equal to ―zero‖. For the decision on the most suitable model,
these parameters were considered and the model curve was plotted. MSE was
calculated according to the following equation :
(11)
where MRpre,i is the ith predicted moisture ratio, MRexp,i is the ith experimentally observed
moisture ratio, n is the number of observations, and p is the number of parameters to be
estimated (Neter, 1996)
2.5. Estimation of Effective Moisture Diffusivity
The effective moisture diffusivity (Deff) was determined by means of two different
approaches. The first approach was to calculate Deff by using equation ,3 which is a
reduced form of Fick‘s second law of diffusion for an infinite slab. The straight
slope of the normalized plot of the dimensionless moisture content (lnMR) versus
time is equal to :
Page 42
25
(12)
where L is the critical thickness of the slab. Deff / L2 is determined from Equation 12.
The second approach was to calculate Deff / L2 by taking the model constants as a
slope in Equation 12, instead of the straight slope of the normalized plot of the
dimensionless moisture content (lnMR) versus time. In this manner, slope will be
equal to the constant ―k‖ if the best fit is observed when Newton model, Page model,
Modified Page model, Henderson and Pabis model or Logarithmic model are
applied. If Modified Two Term model is found to be the most accurate model, slope
will be equal to the constant ―k2‖.
2.6. Estimation of Activation Energy
The activation energy was determined through the Arrhenius type equation which is
(9)
where Ea (kJ/mol) is the activation energy , T is the absolute air temperature (K) , R
is the universal gas constant (kJ/kgmol K) and D0 (m2/s) is a constant. The slope of
the plot of natural logarithm of Deff versus the reciprocal of temperature in Kelvin
gives the activation energy.
In this study, the equation is modified to Equation 14 and the activation energy is
calculated from the slope of the plot of natural logarithm of Deff/L2
versus the
reciprocal of temperature in Kelvin.
(13)
Page 43
26
CHAPTER 3
RESULTS AND DISCUSSION
3.1 Drying Behavior of the Samples
It was observed that there was not any constant rate drying period, drying totally
took place in falling rate period for all samples. Both first and second falling rate
drying periods were observed. In addition, it was seen that the drying rate was
increased with increasing temperature, as expected.
The change in drying rate with decreasing moisture content for Emir type grape
seed, Emir type grape skin, Bogazkere type grape seed and Bogazkere type grape
skin are shown in Figures 6, 7, 8 and 9, respectively.
Page 44
27
Figure 6 Drying Rate Plot of Emir Type Grape Seed at different temperatures
Figure 7 Drying Rate Plot of Emir Type Grape Skin at different temperatures
0
0.2
0.4
0.6
0.8
1
1.2
1.4
0 0.2 0.4 0.6 0.8
Dryin
g R
ate
(kg
wate
r /
h.
m2)
Moisture Content
(kg water / kg dry solid )
40
50
55
60
0
0.5
1
1.5
2
2.5
3
3.5
4
4.5
0 0.5 1 1.5 2 2.5
Dryin
g R
ate
(kg
wate
r /
h.
m2)
Moisture Content
(kg water / kg dry solid )
40
50
55
60
Page 45
28
Figure 8 Drying Rate Plot of Bogazkere Type Grape Seed at different temperatures
Figure 9 Drying Rate Plot of Bogazkere Type Grape Skin at different temperatures
0
0.5
1
1.5
2
2.5
0 0.5 1 1.5
Dryin
g R
ate
(kg
wate
r /
h.
m2)
Moisture Content
(kg water / kg dry solid )
40
50
55
60
-1
0
1
2
3
4
5
6
7
8
9
0 1 2 3 4 5 6
Dryin
g R
ate
(kg
wate
r /
h.
m2)
Moisture Content
(kg water / kg dry solid )
40
50
55
60
Page 46
29
3.2 Hot Air Drying
In order to analyze the drying kinetics, the term moisture ratio, MR, was used with
the accurate equilibrium moisture content inserted. The hot air drying curves is
shown in Figures 10, 11, 12 and 13 for Emir type grape seed, Emir type grape skin,
Bogazkere type grape seed and Bogazkere type grape skin, respectively.
Figure 10 Drying curve of Emir type grape seed at different temperatures
0
0.2
0.4
0.6
0.8
1
1.2
0 100 200 300 400 500 600
MR
time(min)
40
50
55
60
Page 47
30
Figure 11 Drying curve of Emir type grape skin at different temperatures
Figure 12 Drying curve of Bogazkere type grape seed at different temperatures
0
0.2
0.4
0.6
0.8
1
1.2
0 100 200 300 400 500 600
MR
time(min)
40
50
55
60
0
0.2
0.4
0.6
0.8
1
1.2
0 100 200 300 400 500 600
MR
time(min)
40
50
55
60
Page 48
31
Figure 13 Drying curve Bogazkere type grape skin at different temperatures
3.3 Modeling
In order to explain drying kinetics of grape seeds, thin-layer drying models, which
can be defined as simplified models were studied. Four common models of the
literature, namely Lewis, Page, Modified Page, Henderson-Pabis, Logarithmic and
an additional model, namely Modified Two Term model were selected. The best fit
was selected when R2 had the closest value to one while mean square error was near
to zero.
The model constants of each seed and skin variety are tabulated and the results are
explained in detail in the following sections.
0
0.2
0.4
0.6
0.8
1
1.2
0 100 200 300 400 500 600
MR
time(min)
40
50
55
60
Page 49
32
3.3.1 Emir type grape seeds
Logarithmic model was found as the most appropriate among 6 selected models
with R2 values between 0.9985 and 0.9995 and MSE values between 0.0003 and
0.00008. This model gave the best fit for temperatures 50, 55 and 60°C. For 40°C,
although Logarithmic model gave a good fit, the best fit was observed when
Modified Two Term model was applied.
For the Logarithmic model, constant ―a‖ ranged between 0.067 and 1.0431. Besides,
the model constant ―k‖, as expected, increased from 0.0050 to 0.0094 while drying
temperature increased from 40 to 60°C.
For 40°C, the model constants and statistical parameter values are shown in Table 8.
Except for the Newton Model, all the models gave a good fit. Although the
Modified Two Term model gave the best fit, since for Emir type grape seeds
Logarithmic model was shown to be the most accurate model, it was investigated if
it coincided with the experimented values and the overlap is shown in Figure 14.
Page 50
33
Table 8 Model constants of Emir type grape seeds drying at 40°C
Model
Name
Model
Constants R2 MSE
Newton
k = 0.0045 ±
0.00005 0.9896 0.00060
Page
k = 0.0095 ±
0.0002
n = 0.8637 ±
0.0038 0.9996 0.00002
Modified
Page
k = 0.0045 ±
0.00001
n = 0.8637 ±
0.0038 0.9996 0.00002
Henderson
and Pabis
a = 0.9426 ±
0.0058
k = 0.0042 ±
0.00004 0.9965 0.00020
Logarithmic
a = 0.8995 ±
0.0060
k = 0.0050 ±
0.0001
c = 0.0644 ±
0.0069 0.9985 0.00008
Modified
Two Term
a =0.0887 ±
0.0051
k1 = 0.0473 ±
0.0048
c = 0.0278 ±
0.0042 0.9999 0.00001
b = 0.8872 ±
0.0028
k2 = 0.0043 ±
0.00006
Figure 14 Fitting of Logarithmic model on Emir type grape seeds drying data at
40°C
0
0.2
0.4
0.6
0.8
1
1.2
0 200 400 600
MR
time (min)
Exp
Pred
Page 51
34
For 50°C, the model constants and statistical parameter values are shown in Table 9.
Although the coefficient of determination was found to be equal for Logarithmic
and Modified Two Term model, since the mean square error was smaller,
Logarithmic model was selected as the most accurate model and the result is shown
in Figure 15.
Table 9 Model constants of Emir type grape seeds drying at 50°C
Model
Name Model Constants R2
MSE
Newton
k =0,0070 ±
0.00005 0.9969 0.00020
Page
k = 0,0093 ±
0,0005
n = 0,9445 ±
0,0098 0.9981 0.00010
Modified
Page
k = 0,0071 ±
0.00004
n = 0,9445 ±
0,0098 0.9981 0.00010
Henderson
and Pabis
a = 0,9826 ±
0,0068
k = 0,0069 ±
0.00007 0.9972 0.00020
Logarithmic
a = 0,9683 ±
0,0034
k = 0,0077 ±
0.00007
c = 0,0350 ±
0,0024 0.9994 0.00003
Modified
Two Term
a = 0,4907 ±
0,0087
k1 =0,0077 ±
0,0421
c = 0,0350 ±
0,0168 0.9994 0.00004
b = 0,4777 ±
0,0169
k2 = 0,0077 ±
0,7070
Page 52
35
Figure 15 Fitting of Logarithmic model on Emir type grape seeds drying data at
50°C
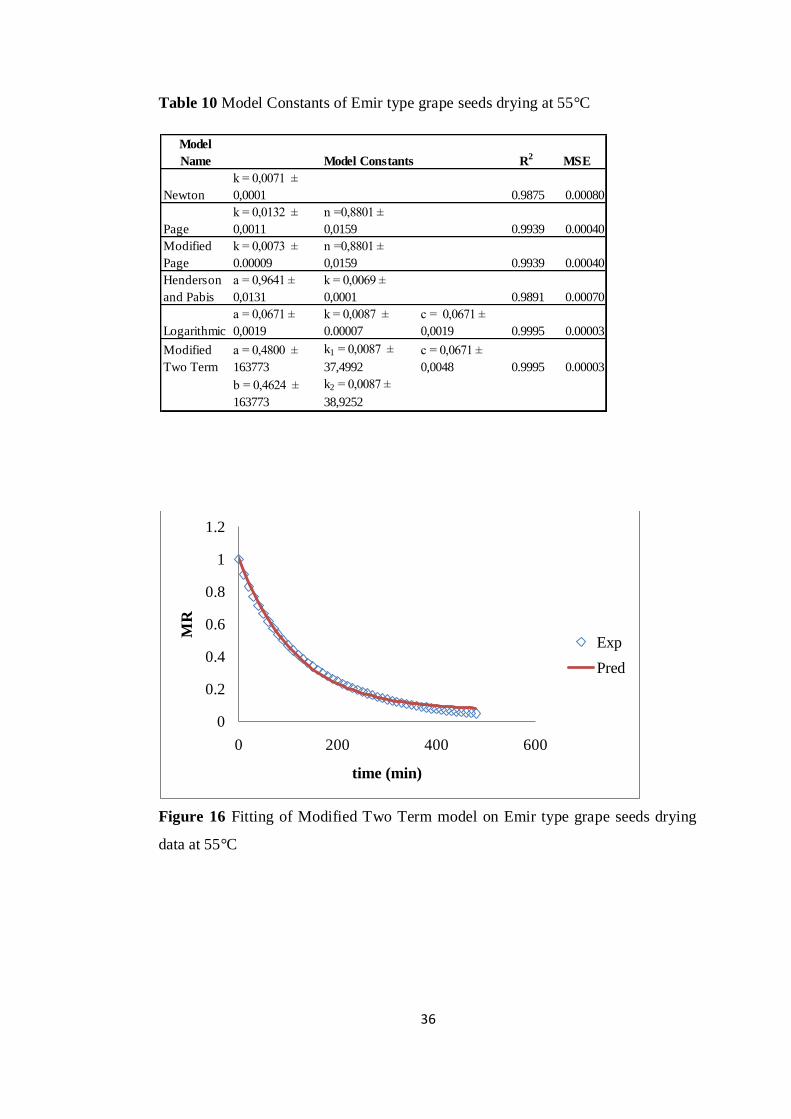
For 55°C, the model constants and statistical parameter values are shown in Table
10. Except for the Newton Model all the models gave a good fit. The coefficient of
determination and mean square error was observed to be the same for Logarithmic
and Modified Two Term model but since the standard errors of the model constants
of the Logarithmic model is less than the other. It was found as the best fit and
overlapping of the predicted values on the experimented data is represented in
Figure 16.
0
0.2
0.4
0.6
0.8
1
1.2
0 200 400 600
MR
time (min)
Exp
Pred
Page 53
36
Table 10 Model Constants of Emir type grape seeds drying at 55°C
Figure 16 Fitting of Modified Two Term model on Emir type grape seeds drying
data at 55°C
Model
Name Model Constants R2
MSE
Newton
k = 0,0071 ±
0,0001 0.9875 0.00080
Page
k = 0,0132 ±
0,0011
n =0,8801 ±
0,0159 0.9939 0.00040
Modified
Page
k = 0,0073 ±
0.00009
n =0,8801 ±
0,0159 0.9939 0.00040
Henderson
and Pabis
a = 0,9641 ±
0,0131
k = 0,0069 ±
0,0001 0.9891 0.00070
Logarithmic
a = 0,0671 ±
0,0019
k = 0,0087 ±
0.00007
c = 0,0671 ±
0,0019 0.9995 0.00003
Modified
Two Term
a = 0,4800 ±
163773
k1 = 0,0087 ±
37,4992
c = 0,0671 ±
0,0048 0.9995 0.00003
b = 0,4624 ±
163773
k2 = 0,0087 ±
38,9252
0
0.2
0.4
0.6
0.8
1
1.2
0 200 400 600
MR
time (min)
Exp
Pred
Page 54
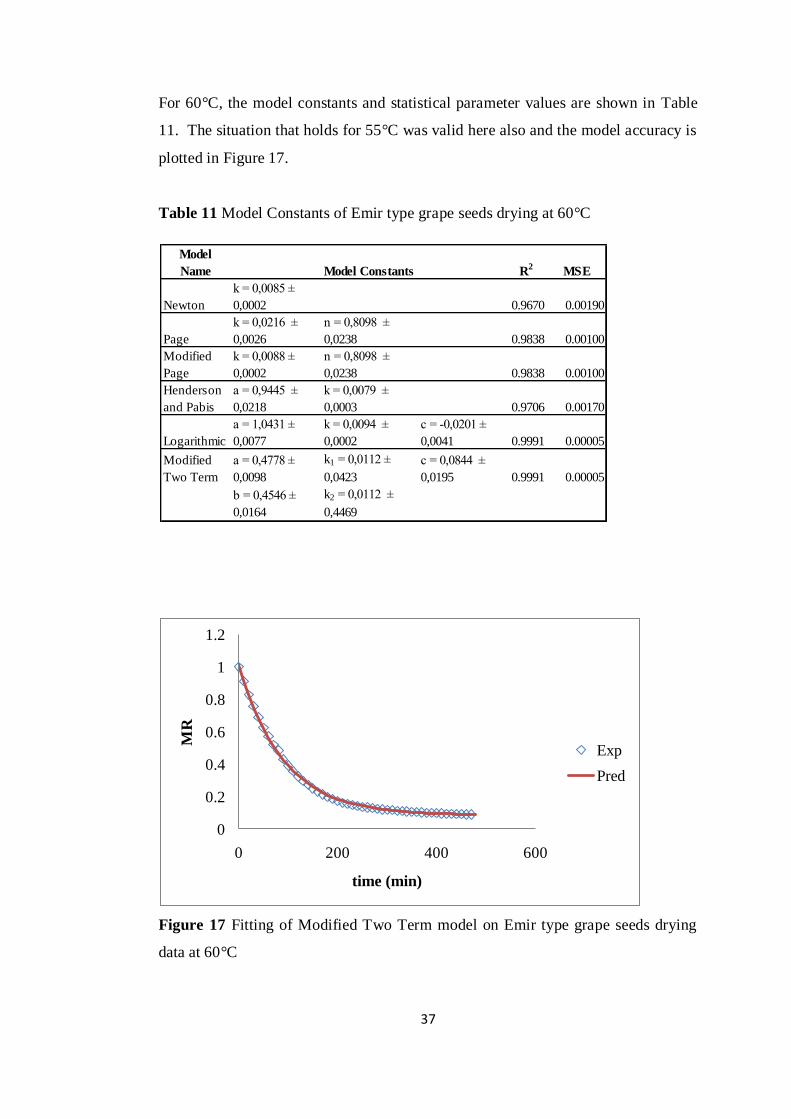
37
For 60°C, the model constants and statistical parameter values are shown in Table
11. The situation that holds for 55°C was valid here also and the model accuracy is
plotted in Figure 17.
Table 11 Model Constants of Emir type grape seeds drying at 60°C
Figure 17 Fitting of Modified Two Term model on Emir type grape seeds drying
data at 60°C
Model
Name Model Constants R2
MSE
Newton
k = 0,0085 ±
0,0002 0.9670 0.00190
Page
k = 0,0216 ±
0,0026
n = 0,8098 ±
0,0238 0.9838 0.00100
Modified
Page
k = 0,0088 ±
0,0002
n = 0,8098 ±
0,0238 0.9838 0.00100
Henderson
and Pabis
a = 0,9445 ±
0,0218
k = 0,0079 ±
0,0003 0.9706 0.00170
Logarithmic
a = 1,0431 ±
0,0077
k = 0,0094 ±
0,0002
c = -0,0201 ±
0,0041 0.9991 0.00005
Modified
Two Term
a = 0,4778 ±
0,0098
k1 = 0,0112 ±
0,0423
c = 0,0844 ±
0,0195 0.9991 0.00005
b = 0,4546 ±
0,0164
k2 = 0,0112 ±
0,4469
0
0.2
0.4
0.6
0.8
1
1.2
0 200 400 600
MR
time (min)
Exp
Pred
Page 55
38
3.3.2 Emir type grape skins
Modified Page model was found as the most appropriate one among 6 selected
models with R2 values between 0.9989 and 0.9999 and MSE values between
0.000006 and 0.00008. For Emir type grape skins, it was observed that different
models gave the best fit for different temperatures but Modified Page model was
shown to be sufficient for all of the drying temperatures.
For the Modified Page model, constant ―n‖ ranged between 1.0112 and 1.1247.
Besides, the model constant ―k‖, as expected, was increased from 0.0052 to 0.0095
while drying temperature was increased from 40 to 60°C.
For 40°C, the model constants and statistical parameter values are shown in Table
12. The Logarithmic model and the Modified Page model was at the same level of
accuracy in terms of R2
and MSE but the standard errors of the model constants was
smaller in the Modified Page model thus it was investigated if the latter model
describes the drying curve and the overlap is shown in Figure 18.
Table 12 Model Constants of Emir type grape skins drying at 40°C
Model
Name Model Constants R2
MSE
Newton
k = 0,0052 ±
0,000008 0.9999 0.00001
Page
k = 0,0049 ±
0,00006
n = 1,0112 ±
0,0023 0.9999 0.000006
Modified
Page
k = 0,0052 ±
0,000007
n = 1,0112 ±
0,0023 0.9999 0.000006
Henderson
and Pabis
a = 1,0194 ±
0,0013
k = 0,0076 ±
0,00001 0.9992 0.00006
Logarithmic
a = 1,008 ±
0,0016
k = 0,0051 ±
0,00002
c = -0,0076 ±
0,0018 0.9999 0.000006
Modified
Two Term
a = 0,5134 ±
0,0036
k1 = 0,0051 ±
0,0189
c = -0,0076 ±
0,0070 0.9999 0.000007
b = 0,4946 ±
0,0084
k2 = 0,0051 ±
0,5255
Page 56
39
Figure 18 Fitting of Modified Page model on Emir type grape skins drying data at
40°C
For 50°C, the model constants and statistical parameter values are shown in Table
13.The Modified Page model gave the best fit and the overlap of the predicted
values and experimental data is shown in Figure 19.
0
0.2
0.4
0.6
0.8
1
1.2
0 200 400 600
MR
time (min)
Exp
Pred
Page 57
40
Table 13 Model Constants of Emir type grape skins drying at 50°C
Figure 19 Fitting of Modified Page model on Emir type grape skins drying data at
50°C
Model
Name Model Constants R2
MSE
Newton
k = 0,0075 ±
0,00004 0.9988 0.00009
Page
k = 0,0056 ±
0,0001
n = 1,0581 ±
0,0038 0.9998 0.00001
Modified
Page
k = 0,0074 ±
0,00002
n = 1,0581 ±
0,0038 0.9998 0.00001
Henderson
and Pabis
a = 1,0194 ±
0,0042
k = 0,0076 ±
0,00005 0.9992 0.00006
Logarithmic
a = 1,0264 ±
0,0031
k = 0,0073 ±
0,00006
c = -0,0155 ±
0,0024 0.9996 0.00003
Modified
Two Term
a = 0,5218 ±
162084
k1 = 0,0073 ±
15,2803
c =-0,0155 ±
0,0074 0.9996 0.00003
b = 0,5046 ±
162084
k2 = 0,0073 ±
15,7973
0
0.2
0.4
0.6
0.8
1
1.2
0 200 400 600
MR
time (min)
Exp
Pred
Page 58
41
For 55°C, the model constants and statistical parameter values are shown in Table
14. Although the Logarithmic model gave the best fit, since for Emir type grape
skins Modified Page model was shown to be the most accurate model, it was
investigated if it coincides with the experimented values and the overlap is shown in
Figure 20.
Table 14 Model Constants of Emir type grape skins drying at 55°C
Model
Name Model Constants R2
MSE
Newton
k = 0,0086 ±
0,00005 0.9988 0.00008
Page
k = 0,0076 ±
0,0003
n =1,0252 ±
0,0085 0.9990 0.00007
Modified
Page
k = 0,0086 ±
0,00004
n =1,0252 ±
0,0085 0.9990 0.00007
Henderson
and Pabis
a = 1,0119 ±
0,0048
k = 0,0087 ±
0,00006 0.9989 0.00007
Logarithmic
a = 1,0096 ±
0,0047
k = 0,0089 ±
0,0001
c = 0,0065 ±
0,0027 0.9991 0.00007
Modified
Two Term
a = 0,5152 ±
0,0116
k1 = 0,0089 ±
0,0558
c = 0,0065 ±
0,0227 0.9991 0.0032
b = 0,4944 ±
0,0212
k2 = 0,0089 ±
0,7961
Page 59
42
Figure 20 Fitting of Modified Page model on Emir type grape skins drying data at
55°C
For 60°C, the model constants and statistical parameter values are shown in Table
15. Although the Modified Two Term model gave the best fit, since for Emir type
grape skins Modified Page model was shown to be the most accurate model, it was
investigated if it coincides with the experimented values and the overlap is shown in
Figure 21.
0
0.2
0.4
0.6
0.8
1
1.2
0 200 400 600
MR
time (min)
Exp
Pred
Page 60
43
Table 15 Model Constants of Emir type grape skins drying at 60°C
Figure 21 Fitting of Modified Page model on Emir type grape skins drying data at
60°C
Model
Name Model Constants R2
MSE
Newton
k = 0,0097 ±
0,0001 0.9953 0.0004
Page
k = 0,0053 ±
0,0003
n = 1,1247 ±
0,0108 0.9989 0.00008
Modified
Page
k = 0,0095 ±
0.00005
n = 1,1247 ±
0,0108 0.9989 0.00008
Henderson
and Pabis
a = 1,0353 ±
0,0097
k = 0,0100 ±
0,0001 0.9963 0.0003
Logarithmic
a = 1,0431 ±
0,0077
k = 0,0094 ±
0,0002
c = -0,0201 ±
0,0041 0.9977 0.0002
Modified
Two Term
a = 0,5385 ±
0,0188
k1 = 0,0094 ±
0,0905
c = -0,0201 ±
0,0367 0.9991 0.00007
b = 0,5046 ±
0,0335
k2 = 0,0094 ±
1,2092
0
0.2
0.4
0.6
0.8
1
1.2
0 200 400 600
MR
time (min)
Exp
Pred
Page 61
44
3.3.3 Bogazkere type grape seeds
Modified Two Term model was found as the best model among 6 selected models
with R2 values between 0.9990 and 0.9998 and MSE values between 0.000006 and
0.00007. This model gave the best fit for temperatures 40, 50 and 55°C. For 60°C,
although Modified Two Term model gave a good fit, the best fit was observed when
Logarithmic model was applied.
For the Modified Two Term model, the model constant ―k1‖ was increased from
0.0245 to 0.0761 and ―k2‖ was increased from 0.0017 to 0.0083 while drying
temperature was increased from 40 to 60°C.
For 40, 50 and 55°C, the model constants and statistical parameter values are shown
in Table 16-18. Modified Two Term model had the best accuracy and the plots of
the coincide of predicted values with experimental data is shown in Figures 22-24
Table 16 Model Constants of Bogazkere type grape seeds drying at 40°C
Model
Name Model Constants R2
MSE
Newton
k = 0,0036 ±
0,0001 0.8777 0.0043
Page
k = 0,0261 ±
0,0011
n = 0,6432 ±
0,0074 0.9969 0.0001
Modified
Page
k = 0,0034 ±
0.00002
n = 0,6432 ±
0,0074 0.9969 0.0001
Henderson
and Pabis
a = 0,8537 ±
0,0142
k = 0,0029 ±
0.00009 0.9597 0.0014
Logarithmic
a = 0,6963 ±
0,0131
k = 0,0060 ±
0,0003
c = 0,2323 ±
0,0130 0.9851 0.0005
Modified
Two Term
a = 0,3173 ±
0,0069
k1 = 0,0245 ±
0,0007
c = -0,1181 ±
0,0368 0.9998 6.409E-06
b = 0,8080 ±
0,0300
k2 = 0,0017 ±
0,0001
Page 62
45
Figure 22 Fitting of Modified Two Term model on Bogazkere type grape seeds
drying data at 40°C
Table 17 Model Constants of Bogazkere type grape seeds drying at 50°C
0
0.2
0.4
0.6
0.8
1
1.2
0 200 400 600
MR
time (min)
Exp
Pred
Model
Name Model Constants R2
MSE
Newton
k = 0,0075 ±
0,0002 0.9784 0.0013
Page
k = 0,0162 ±
0,0017
n = 0,8489 ±
0,0203 0.9895 0.0007
Modified
Page
k = 0,0078 ±
0,0001
n = 0,8489 ±
0,0203 0.9895 0.0007
Henderson
and Pabis
a = 0,9114 ±
0,0130
k = 0,0068 ±
0,0001 0.9889 0.0007
Logarithmic
a = 0,9233 ±
0,0142
k = 0,0062 ±
0,0003
c = -0,0246 ±
0,0134 0.9896 0.0007
Modified
Two Term
a = 0,2718 ±
0,0083
k1 = 0,0445 ±
0,0024
c = -0,1250 ±
0,0078 0.9997 2.046E-05
b = 0,8617 ±
0,0045
k2 = 0,0041 ±
0,0001
Page 63
46
Figure 23 Fitting of Modified Two Term model on Bogazkere type grape seeds
drying data at 50°C
Table 18 Model Constants of Bogazkere type grape seeds drying at 55°C
-0.2
0
0.2
0.4
0.6
0.8
1
1.2
0 200 400 600
MR
time (min)
Exp
Pred
Model
Name Model Constants R2
MSE
Newton
k = 0,0075 ±
0,00008 0.9932 0.0005
Page
k = 0,0112 ±
0,0008
n = 0,9223 ±
0,0146 0.9956 0.0003
Modified
Page
k = 0,0077 ±
0.00008
n = 0,9223 ±
0,0146 0.9956 0.0003
Henderson
and Pabis
a = 0,9483 ±
0,0078
k =0,0071 ±
0,00008 0.9965 0.0002
Logarithmic
a = 0,9569 ±
0,0078
k = 0,0067 ±
0,0002
c = -0,0183 ±
0,0067 0.9970 0.0002
Modified
Two Term
a = 0,1255 ±
0,0099
k1 = 0,0761 ±
0,0120
c = -0,0417 ±
0,0046 0.9994 0.00004
b = 0,9201 ±
0,0060
k2 = 0,0059 ±
0,0001
Page 64
47
Figure 24 Fitting of Modified Two Term model on Bogazkere type grape seeds
drying data at 55°C
For 60°C, the model constants and statistical parameter values are shown in Table
19. The coefficient of determination and mean square error was observed to be the
same for Logarithmic and Modified Two Term model. Although the standard errors
of the model constants of the Modified Two Term model had large values, it was
observed from the Figure 25 that this model can be used in order to describe the
drying kinetics for Bogazkere type grape seeds.
0
0.2
0.4
0.6
0.8
1
1.2
0 200 400 600
MR
time (min)
Exp
Pred
Page 65
48
Table 19 Model Constants of Bogazkere type grape seeds drying at 60°C
Figure 25 Fitting of Modified Two Term model on Bogazkere type grape seeds
drying data at 60°C
Model
Name Model Constants R2
MSE
Newton
k = 0,0084 ±
0.00006 0.9976 0.0002
Page
k = 0,0114 ±
0,0004
n = 0,9404 ±
0,0078 0.9989 7.549E-05
Modified
Page
k = 0,0086 ±
0,00004
n = 0,9404 ±
0,0078 0.9989 7.652E-05
Henderson
and Pabis
a = 0,9656 ±
0,0046
k = 0,0081 ±
0,00005 0.9989 7.652E-05
Logarithmic
a = 0,9635 ±
0,0046
k = 0,0083 ±
0,0001
c = 0,0057 ±
0,0030 0.9990 7.142E-05
Modified
Two Term
a =0,4699 ±
410851
k1 = 0,0083 ±
9,4624
c = 0,0057 ±
0,0079 0.9990 0.0000747
b = 0,4936 ±
410851
k2 = 0,0083 ±
8,9891
0
0.2
0.4
0.6
0.8
1
1.2
0 200 400 600
MR
time (min)
Exp
Pred
Page 66
49
3.3.4 Bogazkere type grape skins
Modified Page model was found as the best model among 6 selected models with
R2 values between 0.9982 and 0.9994 and MSE values between 0.000046 and
0.0005. This model gave the best fit for temperatures 50, 55 and 60°C. For 40°C,
although Modified Page model gave a good fit, the best fit was observed when
Logarithmic model was applied.
For the Modified Page model, the model constant ―k‖ increased from 0.0059 to
0.0098 as expected and ―n‖ ranged between 1.1423 and 1.1627 while drying
temperature increased from 40 to 60°C.
For 40°C, the model constants and statistical parameter values are shown in Table
20. Although Logarithmic model gave the best fit with R2
value being 0.9995 and
MSE being 0.00003, the Modified Page model was investigated if it satisfactorily
defines the drying curve since this model was observed to give a better fit for
Bogazkere type grape skins and the model fit is shown in Figure 26.
Table 20 Model Constants of Bogazkere type grape skins drying at 40°C
Model
Name Model Constants R2
MSE
Newton
k = 0,0060 ±
0,00008 0.9915 0.0337
Page
k = 0,0027 ±
0,0002
n = 1,1529 ±
0,0124 0.9982 0.0002
Modified
Page
k = 0,0059 ±
0.00003
n = 1,1529 ±
0,0124 0.9982 0.0002
Henderson
and Pabis
a = 1,0423 ±
0,0111
k = 0,0063 ±
0,0001 0.9936 0.0005
Logarithmic
a =1,1015 ±
0,0041
k = 0,0050 ±
0,00005
c = -0,0940 ±
0,0047 0.9995 0.00003
Modified
Two Term
a = 0,5661 ±
0,0086
k1 = 0,0050 ±
0,0482
c = -0,0940 ±
0,0169 0.9995 0.00004
b = 0,5355 ±
0,0207
k2 = 0,0050 ±
1,4274
Page 67
50
Figure 26 Fitting of Modified Two Term model on Bogazkere type grape skins
drying data at 40°C
For 50, 55 and 60 °C, the model constants and statistical parameter values are
shown in Table 21-23. Page and Modified Page models showed the same accuracy
in terms of R2 and MSE, while the constant ―k‖ in the Modified Page model had a
smaller value of standard error, it was chosen to describe the drying kinetics and the
predicted values over experimented data is shown in figures 27-29.
0
0.2
0.4
0.6
0.8
1
1.2
0 200 400 600
MR
time (min)
Exp
Pred
Page 68
51
Table 21 Model Constants of Bogazkere type grape skins drying at 50°C
Table 22 Model Constants of Bogazkere type grape skins drying at 55°C
Model
Name Model Constants R2
MSE
Newton
k = 0,0080 ±
0,00009 0.9943 0.0005
Page
k = 0,0039 ±
0,0002
n = 1,1403 ±
0,0081 0.9993 0.00005
Modified
Page
k = 0,0078 ±
0.00003
n = 1,1403 ±
0,0081 0.9993 0.00005
Henderson
and Pabis
a = 1,0425 ±
0,0097
k = 0,0083 ±
0,0001 0.9960 0.0003
Logarithmic
a = 1,0594 ±
0,0058
k = 0,0075 ±
0,0001
c = -0,0369 ±
0,0043 0.9986 0.0001
Modified
Two Term
a = 0,5454 ±
520445
k1 = 0,0075 ±
60,1400
c = -0,0369 ±
0,0129 0.9986 0.0001
b = 0,5140 ±
520445
k2 = 0,0075 ±
63,8218
Model
Name Model Constants R2
MSE
Newton
k = 0,0094 ±
0,0001 0.9936 0.0005
Page
k = 0,0043 ±
0,0002
n = 1,1627 ±
0,0082 0.9994 0.00005
Modified
Page
k = 0,0092 ±
0.00003
n = 1,1627 ±
0,0082 0.9994 0.00005
Henderson
and Pabis
a = 1,0494 ±
0,0107
k = 0,0099 ±
0,0001 0.9957 0.0003
Logarithmic
a = 1,0588 ±
0,0083
k = 0,0092 ±
0,0002
c = -0,0233 ±
0,0046 0.9974 0.0002
Modified
Two Term
a = 0,5506 ±
0,0204
k1 = 0,0092 ±
0,1004
c = -0,0233 ±
0,0399 0.9974 0.0002
b = 0,5081 ±
0,0368
k2 = 0,0092 ±
1,3715
Page 69
52
Table 23 Model Constants of Bogazkere type grape skins drying at 60°C
Figure 27 Fitting of Modified Two Term model on Bogazkere type grape skins
drying data at 50°C
Model
Name Model Constants R2
MSE
Newton
k = 0,0101 ±
0,0001 0.9946 0.000400
Page
k = 0,0049 ±
0,0002
n = 1,1484 ±
0,0082 0.9994 0.000045
Modified
Page
k = 0,0098 ±
0.00004
n = 1,1484 ±
0,0082 0.9994 0.000045
Henderson
and Pabis
a = 1,0443 ±
0,0100
k = 0,0105 ±
0,0001 0.9963 0.000300
Logarithmic
a = 1,0513 ±
0,0082
k = 0,0099 ±
0,0002
c = -0,0184 ±
0,0041 0.9975 0.000200
Modified
Two Term
a = 0,5458 ±
394684
k1 = 0,0099 ±
213,65
c = -0,0184 ±
0,0088 0.9975 0.000200
b = 0,5056 ±
394684
k2 = 0,0099 ±
230,65
0
0.2
0.4
0.6
0.8
1
1.2
0 200 400 600
MR
time (min)
Exp
Pred
Page 70
53
Figure 28 Fitting of Modified Two Term model on Bogazkere type grape skins
drying data at 55°C
Figure 29 Fitting of Modified Two Term model on Bogazkere type grape skins
drying data at 60°C
0
0.2
0.4
0.6
0.8
1
1.2
0 200 400 600
MR
time (min)
Exp
Pred
0
0.2
0.4
0.6
0.8
1
1.2
0 200 400 600
MR
time (min)
Exp
Pred
Page 71
54
3.4. Effective Moisture Diffusivity
Effective moisture diffusivity (Deff) was calculated by using two different
approaches. First approach was based on the solution of the diffusion equation for
infinite slab. The reduced form of the equation when dimensionless Fourier number,
i.e. Deff .t/L2 is greater than 0.1 is
(3)
Here, L represents a characteristic thickness of the slab. Since in the experiments,
the characteristic thickness cannot be determined neither for seeds nor for skins it
was decided to report Deff in terms of Deff/L2. The straight slope of the plot in terms
of ln(MR) versus time was used to calculate the values of Deff/L2. The numerical
values are given in Table 24.
Table 24 Effective moisture Diffusivities according to the first approach
Sample Temp ( °C) Deff/L2
(1/s)(10-5
)
Emir Type Grape Seeds
40 0.7
50 1.2
55 1.2
60 1.4
Emir Type Grape Skins
40 0.9
50 1.3
55 1.5
60 1.9
Bogazkere Type Grape Seeds
40 0.2
50 1.1
55 1.3
60 1.4
Bogazkere Type Grape Skins
40 1.2
50 1.7
55 1.9
60 2.1
Page 72
55
Although this approach is widely used in the literature, it is disadvantageous due to
having too many assumptions. These assumptions may not be valid throughout the
drying process. For this reason, another approach was tried. This second approach
was to calculate the effective moisture diffusivity by means of constant ―k‖ of the
drying kinetics models that were found to give the best fit. Since these models were
valid in whole drying period, this can be considered as a better approach. The
effective moisture diffusivities of the samples are presented in Table 25.
Table 25 Effective moisture diffusivities according to the second approach
Sample Temp ( °C) Deff/L2
(1/s)(10-5
)
Emir Type Grape Seeds
40 0.8
50 1.3
55 1.5
60 1.6
Emir Type Grape Skins
40 0.9
50 1.2
55 1.5
60 1.6
Bogazkere Type Grape Seeds
40 0.3
50 0.7
55 1.0
60 1.4
Bogazkere Type Grape Skins
40 1.0
50 1.3
55 1.6
60 1.7
According to the both of the calculation methods, it was observed that Deff/L2 is
increased with increasing temperature as expected. This second approach, however,
has a negative aspect that it is hard to compare the values with each other since the
best fit models were different for different samples.
Page 73
56
The Deff/L2 values are higher for grape skins than grape seeds. This can be
explained by the difference of the outer surface of the seeds and skins. Since the
seeds have a hard surface, it is reasonable that the Deff/L2 parameter is less than that
of skins. This hard surface causes a tough barrier to the removal of moisture
compared to the soft skins.
Activation energy was estimated by Equation 14. The results for each sample are
presented in Table 26 for the Deff/L2 values calculated by the first approach and in
Table 27 for the values calculated by the second approach.
Table 26 Activation Energies (first approach)
Sample (Deff/L2)0 Ea (kj/mol) R
2
Emir type grape seeds 0.875 3.048 0.9013
Emir type grape skins 2.692 32.848 0.9948
Bogazkere type grape seeds 76.533*109 99.411 0.8587
Bogazkere type grape skins 0.15 24.517 0.9861
Table 27 Activation Energies (second approach)
Sample (Deff/L2)0 Ea (kj/mol) R
2
Emir type grape seeds 0.416 28.037 0.9644
Emir type grape skins 0.247 26.627 0.9914
Bogazkere type grape seeds 970920 69.059 0.998
Bogazkere type grape skins 0.064 22.809 0.9867
It was observed that the findings of the second approach had a better fit to an
Arrhenius type equation than the first approach. This may be due to the validity
difference of the approaches. The values calculated by the second approach
Page 74
57
resembles the activation energy values that have been calculated in literature such
as 40.14 kj/mol of red grape seeds of variety Riesling, 30.45 and 31.47 kj/mol of
white grape seeds of Concord and Cab Franc.(Roberts,2008) Furthermore, the
results are comparable with grape pulp and marc activation energies of 25.41 and
13.74 kj/mol, respectively. (Doymaz,2009)
Page 75
58
CHAPTER 4
CONCLUSION AND RECOMMENDATIONS
In Turkey, grape is produced at high amount of more than four million tons a year.
It is harvested not only for table use but also for juice and wine production and
grape pomace is a waste byproduct. In the light of the results obtained in this study
the followings can be concluded:
Owing to the beneficial health effects of this by-product, it is utilized after
various processes such as separation, drying, pressing or milling whereas
drying temperature is a critical part of the treatments.
Drying rate was observed to increase with the air temperature and only
falling rate drying period is seen. For this period, it was found that the
drying kinetics can be explained accurately by the thin-layer drying models.
Of these models it was seen that for Bogazkere seeds, Modified Two Term
Model, for Bogazkere and Emir skins Modified Page Model and for Emir
skins Logarithmic Model gave the best prediction.
It was found that Deff / L2 values are larger for grape skins than grape seeds.
Deff / L2 values of each type found for each temperature increased with
increasing temperature and this dependence was described by application of
an Arrhenius type equation.
Page 76
59
REFERENCES
Kavaklidere Anatolian Wines. http://www.kavaklidere.com/viticulture.aspx
(accessed 06/06, 2011).
Turkish Statistical Institute. www.tuik.gov.tr (accessed 06/06, 2011).
AKGUN, N.A. and DOYMAZ, I. 2005. Modelling of olive cake thin-layer drying
process. J. Food Eng. 68, 455-461.
AKPINAR, E.K., BICER, Y. and YILDIZ, C. 2003. Thin layer drying of red
pepper. J. Food Eng. 59, 99-104.
ALONSO, Ã., GUILLéN, D.A., BARROSO, C.G., PUERTAS, B. and GARCÃ-
A, A. 2002. Determination of Antioxidant Activity of Wine Byproducts and Its
Correlation with Polyphenolic Content. J. Agric. Food Chem. 50, 5832-5836.
ARVANITOYANNIS, I.S., LADAS, D. and MAVROMATIS, A. 2006. Potential
uses and applications of treated wine waste: a review. Int. J. Food Sci. Tech. 41,
475-487.
BABALIS, S.J. and BELESSIOTIS, V.G. 2004. Influence of the drying conditions
on the drying constants and moisture diffusivity during the thin-layer drying of figs.
J. Food Eng. 65, 449-458.
BAKER, C.G.J. 1997. Industrial drying of foods. , 317.
BOMSER, J.A., SINGLETARY, K.W., WALLIG, M.A. and SMITH, M.A.L. 1999.
Inhibition of TPA-induced tumor promotion in CD-1 mouse epidermis by a
polyphenolic fraction from grape seeds. Cancer Lett. 135, 151-157.
Page 77
60
CELMA, A.R., ROJAS, S. and LÓPEZ-RODRÍGUEZ, F. 2007. Waste-to-energy
possibilities for industrial olive and grape by-products in Extremadura. Biomass
Bioenergy. 31, 522-534.
CHEN, X.D. and MUJUMDAR, A.S. 2008. Drying Technologies in Food
Processing, Blackwell Publishing, United Kingdom.
CRANK, J. 1957. The Mathematics of Diffusion, Clarendon Press, Oxford.
DANDAMRONGRAK, R., YOUNG, G. and MASON, R. 2002. Evaluation of
various pre-treatments for the dehydration of banana and selection of suitable
drying models. J. Food Eng. 55, 139-146.
DE MOURA, R.S., VIANA, F.S.C., SOUZA, M.A.V., KOVARY, K., GUEDES,
D.C., OLIVEIRA, E.P.B., RUBENICH, L.M.S., CARVALHO, L.C.R.M.,
OLIVEIRA, R.M., TANO, T. and CORREIA, M.L.G. 2002. Antihypertensive,
vasodilator and antioxidant effects of a vinifera grape skin extract. J. Pharm.
Pharmacol. 54, 1515-1520.
DI BLASI, C., TANZI, V. and LANZETTA, M. 1997. A study on the production of
agricultural residues in Italy. Biomass Bioenergy. 12, 321-331.
DOYMAZ, I. and AKGÜN, N. 2009. STUDY OF THIN-LAYER DRYING OF
GRAPE WASTES. 196, 890-900.
DOYMAZ, Ġ. 2005. Drying behaviour of green beans. J. Food Eng. 69, 161-165.
DOYMAZ, I. and PALA, M. 2003. The thin-layer drying characteristics of corn. J.
Food Eng. 60, 125-130.
DU, Y., GUO, H. and LOU, H. 2007. Grape Seed Polyphenols Protect Cardiac
Cells from Apoptosis via Induction of Endogenous Antioxidant Enzymes. J. Agric.
Food Chem. 55, 1695-1701.
Page 78
61
ENCINAR, J.M., BELTRÁN, F.J., RAMIRO, A. and GONZÁLEZ, J.F. 1998.
Pyrolysis/gasification of agricultural residues by carbon dioxide in the presence of
different additives: influence of variables. Fuel Process Technol. 55, 219-233.
ERENTURK, S., GULABOGLU, M.S. and GULTEKIN, S. 2004. The Thin-layer
Drying Characteristics of Rosehip. 89, 159-166.
ERTEKIN, C. and YALDIZ, O. 2004. Drying of eggplant and selection of a
suitable thin layer drying model. J. Food Eng. 63, 349-359.
FERRER, J., PÁEZ, G., MÁRMOL, Z., RAMONES, E., CHANDLER, C.,
MARÍN, M. and FERRER, A. 2001. Agronomic use of biotechnologically
processed grape wastes. Bioresour. Technol. 76, 39-44.
FRANCIS, F.J. 1992. A new group of food colorants. Trends Food Sci. Technol. 3,
27-30.
FRÉMONT, L. 2000. Biological effects of resveratrol. Life Sci. 66, 663-673.
GEANKOPLIS, C. 2003. Transport processes and separation process principles
(includes unit operations), 4th Ed., Prentice Hall Press, Upper Saddle River, NJ,
USA.
GONZáLEZ-PARAMáS, A.M., ESTEBAN-RUANO, S., SANTOS-BUELGA,
C., DE PASCUAL-TERESA, S. and RIVAS-GONZALO, J. 2004. Flavanol
Content and Antioxidant Activity in Winery Byproducts. J. Agric. Food Chem. 52,
234-238.
GOYAL, R.K., KINGSLY, A.R.P., MANIKANTAN, M.R. and ILYAS, S.M. 2007.
Mathematical modelling of thin layer drying kinetics of plum in a tunnel dryer. J.
Food Eng. 79, 176-180.
GUNHAN, T., DEMIR, V., HANCIOGLU, E. and HEPBASLI, A. 2005.
Mathematical modelling of drying of bay leaves. 46, 1667-1679.
Page 79
62
HAMAMA, A.A. and NAWAR, W.W. 1991. Thermal decomposition of some
phenolic antioxidants. J. Agric. Food Chem. 39, 1063-1069.
HAWLADER, M.N.A., CHOU, S.K. and CHUA, K.J. 1997. Development of
design charts for tunnel dryers. Int. J. Energy Res. 21, 1023-1037.
HENDERSON, S.M. and PABIS, S. 1961. Grain drying theory II. Temperature
effects on drying coefficients. J. Agric. Eng. Res. , 169-174.
HOGAN, S., CANNING, C., SUN, S., SUN, X. and ZHOU, K. 2010. Effects of
Grape Pomace Antioxidant Extract on Oxidative Stress and Inflammation in Diet
Induced Obese Mice. J. Agric. Food Chem. 58, 11250-11256.
JANG, M., CAI, L., UDEANI, G.O., SLOWING, K.V., THOMAS, C.F.,
BEECHER, C.W.W., FONG, H.H.S., FARNSWORTH, N.R., KINGHORN, A.D.,
MEHTA, R.G., MOON, R.C. and PEZZUTO, J.M. 1997. Cancer Chemopreventive
Activity of Resveratrol, a Natural Product Derived from Grapes. Science. 275, 218-
220.
KAMMERER, D., CLAUS, A., CARLE, R. and SCHIEBER, A. 2004. Polyphenol
Screening of Pomace from Red and White Grape Varieties (Vitis vinifera L.) by
HPLC-DAD-MS/MS. J. Agric. Food Chem. 52, 4360-4367.
KASHANINEJAD, M., MORTAZAVI, A., SAFEKORDI, A. and TABIL, L.G.
2007. Thin-layer drying characteristics and modeling of pistachio nuts. J. Food Eng.
78, 98-108.
KATIYAR, S.K. 2008. Grape seed proanthocyanidines and skin cancer prevention:
Inhibition of oxidative stress and protection of immune system. 52, S71-S76.
KEEY, R.B. 1972. Drying Principles and Practice, Pergamon Press, Hungary.
LARRAURI, J.A., RUPéREZ, P. and SAURA-CALIXTO, F. 1997. Effect of
Drying Temperature on the Stability of Polyphenols and Antioxidant Activity of
Red Grape Pomace Peels. J. Agric. Food Chem. 45, 1390-1393.
Page 80
63
LEWIS, W.K. 1921. The Rate of Drying of Solid Materials. 13, 427-432.
LOPEZ, A., IGUAZ, A., ESNOZ, A. and VIRSEDA, P. 2000. THIN-LAYER
DRYING BEHAVIOUR OF VEGETABLE WASTES FROM WHOLESALE
MARKET. 18, 995.
LU, Y. and YEAP FOO, L. 1999. The polyphenol constituents of grape pomace.
Food Chem. 65, 1-8.
MAIER, T., SCHIEBER, A., KAMMERER, D.R. and CARLE, R. 2009. Residues
of grape (Vitis vinifera L.) seed oil production as a valuable source of phenolic
antioxidants. Food Chem. 112, 551-559.
MÁRQUEZ, C.A., DE MICHELIS, A. and GINER, S.A. 2006. Drying kinetics of
rose hip fruits (Rosa eglanteria L.). J. Food Eng. 77, 566-574.
MARTÍN-CARRÓN, N., SAURA-CALIXTO, F. and GOÑI, I. 2000. Effects of
dietary fibre- and polyphenol-rich grape products on lipidaemia and nutritional
parameters in rats. J. Sci. Food Agric. 80, 1183-1188.
METIVIER, R.P., FRANCIS, F.J. and CLYDESDALE, F.M. 1980. SOLVENT
EXTRACTION OF ANTHOCYANINS FROM WINE POMACE. J. Food Sci. 45,
1099-1100.
MIDILLI, A., KUCUK, H. and YAPAR, Z. 2002. A new model for single-layer
drying. Drying Technol. 20, 1503-1513.
NAYAK, B.S., RAMDATH, D.D., MARSHALL, J.R., ISITOR, G.N.,
EVERSLEY, M., XUE, S. and SHI, J. 2010. Wound-healing activity of the skin of
the common grape (Vitis Vinifera) variant, cabernet sauvignon. 24, 1151-1157.
NEGRO, C., TOMMASI, L. and MICELI, A. 2003. Phenolic compounds and
antioxidant activity from red grape marc extracts. Bioresour. Technol. 87, 41-44.
Page 81
64
NETER, J., KUTNER, M.H., N. and C.J., W., W. 1996. Applied Linear Regression
Models, The McGraw-Hill Co., Inc., Chicago.
OVERHULTS, D.D., WHITE, G.M., HAMILTON, M.E. and ROSS, I.J. 1973.
Drying soybeans with heated air. , 195-200.
ÖZKAN, G., SAGDIÇ, O., GÖKTÜRK BAYDAR, N. and
KURUMAHMUTOGLU, Z. 2004. Antibacterial activities and total phenolic
contents of grape pomace extracts. J. Sci. Food Agric. 84, 1807-1811.
ÖZVURAL, E.B. and VURAL, H. 2011. Grape seed flour is a viable ingredient to
improve the nutritional profile and reduce lipid oxidation of frankfurters. Meat Sci.
88, 179-183.
PANCHARIYA, P.C., POPOVIC, D. and SHARMA, A.L. 2002. Thin-layer
modelling of black tea drying process. J. Food Eng. 52, 349-357.
PASCUAL-MARTÍ, M.C., SALVADOR, A., CHAFER, A. and BERNA, A. 2001.
Supercritical fluid extraction of resveratrol from grape skin of Vitis vinifera and
determination by HPLC. Talanta. 54, 735-740.
PRABHANJAN, D.G., RAMASWAMY, H.S. and RAGHAVAN, G.S.V. 1995.
Microwave-assisted convective air drying of thin layer carrots. J. Food Eng. 25,
283-293.
RAMESH, M.N., WOLF, W., TEVINI, D. and JUNG, G. 2001. Influence of
processing parameters on the drying of spice paprika. J. Food Eng. 49, 63-72.
RENAUD, S. and DE LORGERIL, M. 1992. Wine, alcohol, platelets, and the
French paradox for coronary heart disease. 339, 1523-1526.
ROBERTS, J.S., KIDD, D.R. and PADILLA-ZAKOUR, O. 2008. Drying kinetics
of grape seeds. J. Food Eng. 89, 460-465.
Page 82
65
RODRÍGUEZ COUTO, S., LÓPEZ, E. and SANROMÁN, M.Á. 2006. Utilisation
of grape seeds for laccase production in solid-state fermentors. J. Food Eng. 74,
263-267.
RUSS, W. and MEYER-PITTROFF, R. 2004. Utilizing Waste Products from the
Food Production and Processing Industries. Crit. Rev. Food Sci. Nutr. 44, 57.
SáNCHEZ, A., YSUNZA, F., BELTRáN-GARCÃA, M.J. and ESQUEDA, M.
2002. Biodegradation of Viticulture Wastes by Pleurotus:  A Source of
Microbial and Human Food and Its Potential Use in Animal Feeding. J. Agric. Food
Chem. 50, 2537-2542.
SACILIK, K. 2007. Effect of drying methods on thin-layer drying characteristics of
hull-less seed pumpkin (Cucurbita pepo L.). J. Food Eng. 79, 23-30.
SAITO, M., HOSOYAMA, H., ARIGA, T., KATAOKA, S. and YAMAJI, N.
1998. Antiulcer Activity of Grape Seed Extract and Procyanidins. J. Agric. Food
Chem. 46, 1460-1464.
SCHIEBER, A., STINTZING, F.C. and CARLE, R. 2001. By-products of plant
food processing as a source of functional compounds — recent developments.
Trends Food Sci. Technol. 12, 401-413.
SENADEERA, W., BHANDARI, B.R., YOUNG, G. and WIJESINGHE, B. 2003.
Influence of shapes of selected vegetable materials on drying kinetics during
fluidized bed drying. J. Food Eng. 58, 277-283.
SHAKER, E.S. 2006. Antioxidative effect of extracts from red grape seed and peel
on lipid oxidation in oils of sunflower. 39, 883-892.
SHARAF-ELDEEN, Y.I., HAMDY, M.Y. and BLAISDELL, J.L. 1970.
Mathematical description of drying fully exposed grains.
Page 83
66
SHARMA, G., TYAGI, A., SINGH, R., CHAN, D. and AGARWAL, R. 2004.
Synergistic Anti-Cancer Effects of Grape Seed Extract and Conventional Cytotoxic
Agent Doxorubicin Against Human Breast Carcinoma Cells. 85, 1-12.
SHRIKHANDE, A.J. 2000. Wine by-products with health benefits. Food Res. Int.
33, 469-474.
SIMAL, S., DEYÁ, E., FRAU, M. and ROSSELLÓ, C. 1997. Simple modelling of
air drying curves of fresh and osmotically pre-dehydrated apple cubes. J. Food Eng.
33, 139-150.
SINGH, R.P., TYAGI, A.K., DHANALAKSHMI, S., AGARWAL, R. and
AGARWAL, C. 2004. Grape seed extract inhibits advanced human prostate tumor
growth and angiogenesis and upregulates insulin-like growth factor binding protein-
3. 108, 733-740.
SINGLETARY, K.W. and MELINE, B. 2001. Effect of Grape Seed
Proanthocyanidins on Colon Aberrant Crypts and Breast Tumors in a Rat Dual-
Organ Tumor Model. Nutr. Cancer. 39, 252.
SOCCOL, C.R., VANDENBERGHE, L.P.S., RODRIGUES, C. and PANDEY, A.
2006. New Perspectives for Citric Acid Production and Application. 44, 141-149.
SPIGNO, G., TRAMELLI, L. and DE FAVERI, D.M. 2007. Effects of extraction
time, temperature and solvent on concentration and antioxidant activity of grape
marc phenolics. J. Food Eng. 81, 200-208.
SRIKIATDEN, J. and ROBERTS, J.S. 2006. Measuring moisture diffusivity of
potato and carrot (core and cortex) during convective hot air and isothermal drying.
J. Food Eng. 74, 143-152.
STRUMILLO, C. and KUDRA, T. 1986. Drying: principles, applications and
design, Gordon and Breach, New York, USA.
Page 84
67
SUN, J., HU, X., ZHAO, G., WU, J., WANG, Z., CHEN, F. and LIAO, X. 2007.
Characteristics of Thin-Layer Infrared Drying of Apple Pomace With and Without
Hot Air Pre-drying. Food Science and Technology International. 13, 91-97.
THEPENT, V. and NAEWBANIJ, M. Batch and continuous drying. www.fao.org
(accessed 06/08, 2011).
TOGRUL, I.T. and PEHLIVAN, D. 2004. Modelling of thin layer drying kinetics of
some fruits under open-air sun drying process. J. Food Eng. 65, 413-425.
VEGA, A., FITO, P., ANDRÉS, A. and LEMUS, R. 2007. Mathematical modeling
of hot-air drying kinetics of red bell pepper (var. Lamuyo). J. Food Eng. 79, 1460-
1466.
VERMA, L.R., BUCKLIN, R.A., ENDAN, J.B. and & WRATTEN, F.T. 1985.
Effects of drying air parameters on rice drying models. , 296-301.
VIJAYARAJ, B., SARAVANAN, R. and RENGANARAYANAN, S. 2007.
Studies on thin layer drying of bagasse. Int. J. Energy Res. 31, 422-437.
WANG, C.Y. and SINGH, R.P. 1978. A single layer drying equation for rough rice.
WHITE, G.M., BRIDGES, T.C., LOEWER, O.J. and ROSS, I. 1978. Seed coat
damage in thin layer drying of soybeans as affected by drying conditions.
WHITE, G.M., ROSS, I.J. and PONELERT, R. 1981. Fully exposed drying of
popcorn. , 466-468.
WOLF, M., WALKER, J.E. and KAPSALIS, J.G. 1972. Water vapor sorption
hysteresis in dehydrated food. J. Agric. Food Chem. 20, 1073-1077.
WOLF, M., WALKER, J.E. and KAPSALIS, J.G. 1972. Water vapor sorption
hysteresis in dehydrated food. J. Agric. Food Chem. 20, 1073-1077.
Page 85
68
YUCEL, U., ALPAS, H. and BAYINDIRLI, A. 2010. Evaluation of high pressure
pretreatment for enhancing the drying rates of carrot, apple, and green bean. J. Food
Eng. 98, 266-272.
Page 86
69
APPENDIX A
DRYING CONDITIONS
Table 28 Drying conditions of grape pomace varieties
Grape Pomace
Variety Tray Dryer Temperature
Emir Type 40°C 50°C 55°C 60°C
Seeds xxx xxx xxx xxx
Skins xxx xxx xxx xxx
Bogazkere Type 40°C 50°C 55°C 60°C
Seeds xxx xxx xxx xxx
Skins xxx xxx xxx xxx
x represents replications.
Page 87
70
APPENDIX B
INITIAL MOISTURE CONTENT DATA
Table 29 Initial moisture content data for Emir type grape seeds
Moisture Content (g water/g dry solid)
1 0.72
2 0.68
3 0.70
4 0.69
5 0.71
6 0.69
7 0.65
8 0.70
9 0.72
10 0.61
11 0.67
12 0.66
Page 88
71
Table 30 Initial moisture content data for Emir type grape skins
Moisture Content (g water/g dry solid)
1 2.20
2 2.13
3 2.23
4 2.20
5 2.21
6 1.99
7 2.16
8 2.19
9 2.08
10 2.17
11 2.19
12 2.72
Table 31 Initial moisture content data for Bogazkere type grape seeds
Moisture Content (g water/g dry solid)
1 1.16
2 1.05
3 1.12
4 1.09
5 1.12
6 1.13
7 1.06
8 1.06
9 1.19
10 1.01
11 1.19
12 1.08
Page 89
72
Table 32 Initial moisture content data for Bogazkere type grape skins
Moisture Content (g water/g dry solid)
1 5.91
2 5.51
3 5.72
4 6.03
5 5.46
6 5.65
7 5.61
8 5.74
9 5.58
10 6.01
11 5.47
12 5.56
Page 90
73
APPENDIX C
SEED DIMENSIONS
Table 33 Emir type grape seed dimensions
L (mm) a (mm)
1 6.0 4.0
2 7.0 4.0
3 6.2 3.5
4 6.5 4.0
5 6.3 3.8
6 5.0 3.0
7 6.0 3.0
8 7.0 4.0
9 6.5 4.0
10 6.0 3.0
Table 34 Bogazkere type grape seed dimensions
L (mm) a (mm)
1 6.5 4.0
2 7.0 4.0
3 6.7 3.5
4 6.3 3.2
5 6.7 4.0
6 6.0 4.0
7 6.9 3.8
8 6.5 4.0
9 7.0 4.0
10 6.3 4.0
Page 91
74
APPENDIX D
EQUILIBRIUM MOISTURE CONTENT DATA
Table 35 Equilibrium moisture contents of Emir type grape seeds
Temperature Me (g water/g dry solid)
40 0.073 ± 0.006
50 0.066 ± 0.006
55 0.035 ± 0.006
60 0.021 ± 0.006
Table 36 Equilibrium moisture contents of Emir type grape skins
Temperature Me (g water/g dry solid)
40 0.071 ± 0.003
50 0.061 ± 0.003
55 0.056 ± 0.003
60 0.038 ± 0.005
Page 92
75
Table 37 Equilibrium moisture contents of Bogazkere type grape seeds
Temperature Me (g water/g dry solid)
40 0.061 ± 0.003
50 0.042 ± 0.003
55 0.035 ± 0.006
60 0.032 ± 0.003
Table 38 Equilibrium moisture contents of Bogazkere type grape skins
Temperature Me (g water/g dry solid)
40 0.068 ± 0.009
50 0.059 ± 0.008
55 0.044 ± 0.007
60 0.036 ± 0.009
Page 93
76
APPENDIX E
DRYING DATA
Table 39 Drying data of Emir type grape seeds at 40 ºC at air velocity of 1 m/s.
Time (min) MR Sample 1 MR Sample 2 MR Sample 3 MR Average
0 1 1 1 1
10 0.9358 0.9375 0.9439 0.9391
20 0.8716 0.8778 0.8885 0.8793
30 0.8133 0.8250 0.8412 0.8265
40 0.7717 0.7803 0.8034 0.7851
50 0.7367 0.7405 0.7655 0.7476
60 0.7046 0.7103 0.7331 0.7160
70 0.6747 0.6774 0.7034 0.6851
80 0.6448 0.6506 0.6743 0.6566
90 0.6120 0.6245 0.6486 0.6284
100 0.5945 0.5943 0.6223 0.6037
110 0.5697 0.5758 0.5986 0.5813
120 0.5478 0.5531 0.5750 0.5586
130 0.5259 0.5346 0.5520 0.5375
140 0.5047 0.5119 0.5304 0.5157
150 0.4843 0.4934 0.5108 0.4962
160 0.4646 0.4756 0.4898 0.4767
170 0.4464 0.4570 0.4723 0.4586
180 0.4274 0.4392 0.4533 0.4400
190 0.4114 0.4213 0.4364 0.4230
200 0.3968 0.4035 0.4195 0.4066
210 0.3756 0.3740 0.4006 0.3834
220 0.3603 0.3589 0.3885 0.3692
Page 94
77
Table 39 (continued)
Time (min) MR Sample 1 MR Sample 2 MR Sample 3 MR Average
230 0.3450 0.3458 0.3709 0.3539
240
0.3321 0.3567 0.3444
250 0.3209 0.3204 0.3425 0.3280
260 0.3063 0.3060 0.3283 0.3136
270 0.2954 0.2943 0.3162 0.3020
280
0.2833 0.3033 0.2933
290 0.2742 0.2724 0.2898 0.2788
300 0.2648 0.2621 0.2790 0.2686
310 0.2502 0.2518 0.2675 0.2565
320 0.2422
0.2587 0.2504
330 0.2298 0.2408 0.2506 0.2404
340 0.2225 0.2312 0.2391 0.2309
350 0.2181 0.2223
0.2202
360 0.2108 0.2113 0.2216 0.2145
370 0.2035 0.2065 0.2121 0.2074
380 0.1977 0.1989 0.2040 0.2002
390 0.1911 0.1879 0.1979 0.1923
400 0.1853 0.1831 0.1898 0.1861
410 0.1809 0.1756 0.1844 0.1803
420 0.1758 0.1694 0.1790 0.1747
430 0.1692 0.1639
0.1666
440 0.1648 0.1564 0.1641 0.1618
450 0.1612 0.1495 0.1580 0.1562
460 0.1554 0.1461 0.1533 0.1516
470 0.1481 0.1413 0.1486 0.1460
480 0.1488 0.1385 0.1432 0.1435
Page 95
78
Table 40 Drying data of Emir type grape seeds at 50 ºC at air velocity of 1 m/s.
Time (min) MR Sample 1 MR Sample 2 MR Sample 3 MR Average
0 1 1 1 1
10 0.9303 0.9249 0.9332 0.9295
20 0.8593 0.8505 0.8705 0.8601
30 0.7964 0.7868 0.8117 0.7983
40 0.7392 0.7330 0.7589 0.7437
50 0.6883 0.6838 0.7102 0.6941
60 0.6412 0.6366 0.6668 0.6482
70 0.5979 0.5941 0.6247 0.6056
80 0.5564 0.5543 0.5853 0.5653
90 0.5187 0.5171 0.5459 0.5272
100 0.4810 0.4832 0.5139 0.4927
110 0.4445 0.4520 0.4811 0.4592
120 0.4138 0.4194 0.4524 0.4285
130 0.3823 0.3915 0.4224 0.3987
140 0.3547 0.3636 0.3977 0.3720
150 0.3270 0.3410 0.3730 0.3470
160 0.2988 0.3164 0.3509 0.3220
170 0.2780 0.2932 0.3149 0.2954
180 0.2548 0.2746 0.3055 0.2783
190 0.2341 0.2527 0.2835 0.2567
200 0.2171 0.2374 0.2648 0.2398
210 0.2008 0.2201 0.2501 0.2237
220 0.1869 0.2042 0.2341 0.2084
230 0.1712 0.1909 0.2167 0.1929
240 0.1574 0.1809 0.2034 0.1806
250 0.1467 0.1690 0.1900 0.1686
260 0.1354 0.1597 0.1773 0.1575
270 0.1254 0.1504 0.1673 0.1477
280 0.1184 0.1397 0.1580 0.1387
290 0.1109 0.1351 0.1499 0.1320
300 0.1040 0.1278 0.1406 0.1241
310 0.0996 0.1218 0.1339 0.1184
320 0.0927 0.1158 0.1279 0.1121
330 0.0877 0.1132 0.1226 0.1078
Page 96
79
Table 40 (continued)
Time (min) MR Sample 1 MR Sample 2 MR Sample 3 MR Average
340 0.0826 0.1072 0.1172 0.1023
350 0.0782 0.1039 0.1119 0.0980
360 0.0751 0.1005 0.1079 0.0945
370 0.0732 0.0959 0.1039 0.0910
380 0.0694 0.0939 0.1005 0.0879
390
0.0906 0.0959 0.0932
400 0.0644 0.0873 0.0932 0.0816
410 0.0625 0.0846 0.0912 0.0794
420 0.0600 0.0826 0.0885 0.0770
430 0.0581 0.0806 0.0852 0.0746
440 0.0569 0.0779 0.0838 0.0729
450 0.0550 0.0746 0.0785 0.0694
460
0.0740 0.0765 0.0752
470 0.0500 0.0713 0.0758 0.0657
480
0.0693 0.0738 0.0716
Page 97
80
Table 41 Drying data of Emir type grape seeds at 55 ºC at air velocity of 1 m/s.
Time (min) MR Sample 1 MR Sample 2 MR Sample 3 MR Average
0 1 1 1 1
10 0.9298 0.9296 0.9267 0.9287
20 0.8502 0.8579 0.8546 0.8542
30 0.7793 0.7952 0.7927 0.7890
40 0.7157 0.7442 0.7361 0.7320
50 0.6609 0.6925 0.6854 0.6796
60 0.6081 0.6537 0.6443 0.6354
70 0.5552 0.6091 0.5949 0.5864
80 0.5178 0.5678 0.5627 0.5494
90 0.4750 0.5303 0.5174 0.5076
100 0.4389 0.4857 0.4793 0.4680
110 0.4021 0.4521 0.4471 0.4338
120 0.3713 0.4276 0.4185 0.4058
130 0.3399 0.3966 0.3899 0.3754
140 0.3165 0.3681 0.3565 0.3470
150 0.2937 0.3430
0.3183
160 0.2710 0.3203 0.3047 0.2987
170 0.2536 0.2977 0.2844 0.2786
180 0.2329 0.2777 0.2642 0.2582
190 0.2161 0.2615 0.2451 0.2409
200 0.2034 0.2447 0.2267 0.2249
210 0.1914 0.2273 0.2171 0.2119
220 0.1780 0.2165 0.2040 0.1995
230 0.1673 0.2015 0.1838 0.1842
240 0.1606 0.1872 0.1808 0.1762
250 0.1519 0.1808 0.1716 0.1681
260 0.1426 0.1743 0.1647 0.1605
270 0.1378 0.1685 0.1534 0.1532
280 0.1312 0.1575 0.1480 0.1456
290 0.1258
0.1426 0.1342
300 0.1212 0.1369 0.1385 0.1322
310 0.1165 0.1317
0.1241
320 0.1138 0.1272 0.1254 0.1221
330 0.1105 0.1226 0.1230 0.1187
Page 98
81
Table 41 (continued)
Time (min) MR Sample 1 MR Sample 2 MR Sample 3 MR Average
340 0.1085 0.1201 0.1194 0.1160
350 0.1051
0.1152 0.1102
360 0.1018 0.1181 0.1117 0.1105
370 0.0984 0.1149 0.1099 0.1077
380 0.0957
0.1087 0.1022
390 0.0937 0.1097 0.1057 0.1031
400 0.0924 0.1052 0.1009 0.0995
410 0.0917 0.1007 0.0997 0.0974
420 0.0911 0.0987 0.0986 0.0961
430 0.0891 0.0974 0.0980 0.0948
440 0.0877 0.0962
0.0919
450 0.0864 0.0955 0.0944 0.0921
460 0.0850 0.0949 0.0902 0.0900
470 0.0824 0.0942 0.0890 0.0885
480 0.0797 0.0936 0.0884 0.0872
Page 99
82
Table 42 Drying data of Emir type grape seeds at 60 ºC at air velocity of 1 m/s.
Time (min) MR Sample 1 MR Sample 2 MR Sample 3 MR Average
0 1 1 1 1
10 0.9591 0.8983 0.9249 0.9116
20 0.9074 0.8152 0.8404 0.8278
30 0.8533 0.7379 0.7773 0.7576
40 0.8035 0.6678 0.7117 0.6897
50 0.7548 0.6047 0.6454 0.6250
60 0.7085 0.5480 0.5987 0.5734
70 0.6661 0.4926 0.5476 0.5201
80 0.6237 0.4675 0.5034 0.4855
90 0.5832 0.4044 0.4574 0.4309
100 0.5455 0.3638 0.4202 0.3920
110 0.5085 0.3304 0.3855 0.3579
120 0.4727 0.2962 0.3533 0.3248
130 0.4416 0.2666 0.3255 0.2961
140 0.4096 0.2467 0.2996 0.2732
150 0.3801 0.2235 0.2776 0.2505
160 0.3509 0.2035 0.2574 0.2304
170 0.3240 0.1861 0.2397 0.2129
180 0.3015 0.1720 0.2233 0.1976
190 0.2746 0.1597 0.2094 0.1846
200 0.2513 0.1488 0.1981 0.1734
210 0.2330 0.1404 0.1861 0.1632
220 0.2143 0.1359 0.1779 0.1569
230 0.2143 0.1269 0.1697 0.1483
240 0.1828 0.1217 0.1640 0.1429
250 0.1680 0.1160 0.1577 0.1368
260 0.1524 0.1134 0.1526 0.1330
270 0.1407 0.1089 0.1501 0.1295
280 0.1291 0.1056 0.1457 0.1257
290 0.1201 0.1031 0.1413 0.1222
300 0.1108 0.1005 0.1388 0.1196
310 0.1034 0.0986 0.1369 0.1177
320
0.0921 0.1331 0.1126
330 0.0890 0.0902 0.1312 0.1107
Page 100
83
Table 42 (continued)
Time (min) MR Sample 1 MR Sample 2 MR Sample 3 MR Average
340 0.0839 0.0889 0.1287 0.1088
350 0.0796 0.0876 0.1268 0.1072
360 0.0722 0.0850 0.1249 0.1050
370 0.0683 0.0844 0.1230 0.1037
380 0.0668 0.0838 0.1198 0.1018
390 0.0637 0.0825 0.1186 0.1005
400 0.0625 0.0812 0.1179 0.0996
410 0.0598 0.0793 0.1154 0.0973
420 0.0578 0.0773 0.1141 0.0957
430 0.0555 0.0767 0.1129 0.0948
440 0.0539 0.0754 0.1116 0.0935
450 0.0504 0.0747 0.1097 0.0922
460 0.0497 0.0741 0.1085 0.0913
470 0.0485 0.0735 0.1066 0.0900
480 0.0473 0.0735 0.1059 0.0897
Page 101
84
Table 43 Drying data of Emir type grape skins at 40 ºC at air velocity of 1 m/s.
Time (min) MR Sample 1 MR Sample 2 MR Sample 3 MR Average
0 1 1 1 1
10 0.9533 0.9536 0.9516 0.9528
20 0.9077 0.9005 0.8976 0.9019
30 0.8629 0.8522 0.8476 0.8543
40 0.8225 0.8066 0.8029 0.8107
50 0.7846 0.7648 0.7589 0.7694
60 0.7471 0.7249 0.7208 0.7309
70 0.7133 0.6800 0.6827 0.6920
80 0.6810 0.6517
0.6663
90 0.6508 0.6189 0.6139 0.6279
100 0.6225 0.5850 0.5821 0.5966
110 0.5950 0.5556 0.5525 0.5677
120 0.5689 0.5258 0.5233 0.5393
130 0.5431 0.4972 0.4952 0.5119
140 0.5189 0.4697 0.4697 0.4861
150 0.4957 0.4444 0.4460 0.4621
160 0.4623 0.4169 0.4220 0.4337
170 0.4509 0.3954 0.4006 0.4156
180 0.4310 0.3747 0.3776 0.3945
190 0.4104 0.3532 0.3573 0.3736
200 0.3910 0.3344 0.3395 0.3550
210 0.3722 0.3170 0.3207 0.3366
220 0.3472 0.2989 0.3029 0.3164
230 0.3369 0.2824 0.2870 0.3021
240 0.3266 0.2677 0.2715 0.2886
250 0.3035 0.2530 0.2571 0.2712
260 0.2880 0.2371 0.2438 0.2563
270 0.2733 0.2247 0.2308 0.2430
280 0.2590 0.2126 0.2186 0.2301
290 0.2461 0.2009 0.2075 0.2182
300 0.2336 0.1855 0.1964 0.2052
310 0.2211 0.1776 0.1865 0.1951
320 0.2105 0.1685 0.1779 0.1857
330 0.1969 0.1595 0.1683 0.1749
Page 102
85
Table 43 (continued)
Time (min) MR Sample 1 MR Sample 2 MR Sample 3 MR Average
340 0.1884 0.1501 0.1609 0.1665
350 0.1785 0.1429 0.1524 0.1579
360 0.1686 0.1342 0.1461 0.1497
370 0.1598 0.1271 0.1391 0.1420
380 0.1517 0.1210 0.1328 0.1352
390 0.1440 0.1142 0.1262 0.1281
400 0.1355 0.1086 0.1199 0.1213
410 0.1285 0.1022 0.1151 0.1153
420 0.1219 0.0973 0.1095 0.1096
430
0.0916 0.1055 0.0985
440 0.1098 0.0864 0.1014 0.0992
450 0.1043 0.0811 0.0970 0.0941
460 0.0984 0.0773 0.0936 0.0898
470 0.0932 0.0709 0.0896 0.0846
480 0.0888
0.0859 0.0873
Page 103
86
Table 44 Drying data of Emir type grape skins at 50 ºC at air velocity of 1 m/s.
Time (min) MR Sample 1 MR Sample 2 MR Sample 3 MR Average
0 1 1 1 1
10 0.9360 0.9350 0.9391 0.9367
20 0.8671 0.8655 0.8747 0.8691
30 0.8057 0.8028 0.8127 0.8070
40 0.7498 0.7444 0.7571 0.7504
50 0.6991 0.6912 0.7058 0.6987
60 0.6518
0.6579 0.6548
70 0.6066 0.5963 0.6119 0.6049
80 0.5644 0.5531 0.5698 0.5624
90 0.5252 0.5124 0.5307 0.5228
100 0.4900 0.4773 0.4924 0.4866
110 0.4560 0.4415 0.4567 0.4514
120 0.4241 0.4083 0.4238 0.4187
130 0.3949 0.3776 0.3927 0.3884
140 0.3609 0.3492 0.3617 0.3573
150 0.3379 0.3226 0.3341 0.3315
160 0.3135 0.2971 0.3081 0.3062
170 0.2909 0.2746 0.2832 0.2829
180 0.2698 0.2535 0.2610 0.2614
190 0.2487 0.2328 0.2384 0.2400
200 0.2287 0.2144 0.2188 0.2206
210 0.2110 0.1970 0.2000 0.2027
220 0.1943 0.1807 0.1832 0.1861
230 0.1788 0.1656 0.1671 0.1705
240 0.1640 0.1519 0.1529 0.1563
250 0.1507 0.1394 0.1395 0.1432
260 0.1388 0.1275 0.1272 0.1312
270 0.1277 0.1172 0.1165 0.1205
280 0.1173 0.1080 0.1073 0.1109
290 0.1081 0.0987 0.0966 0.1011
300 0.1000 0.0899 0.0882 0.0927
310 0.0914 0.0836 0.0801 0.0851
320 0.0844 0.0773 0.0728 0.0782
330 0.0774 0.0703 0.0675 0.0717
Page 104
87
Table 44 (continued)
Time (min) MR Sample 1 MR Sample 2 MR Sample 3 MR Average
340 0.0729 0.0651 0.0617 0.0666
350 0.0663 0.0600 0.0568 0.0610
360 0.0615 0.0555 0.0502 0.0557
370 0.0574 0.0518 0.0433 0.0509
380 0.0541 0.0481 0.0399 0.0474
390 0.0504 0.0448 0.0372 0.0441
400 0.0467 0.0415 0.0341 0.0408
410 0.0444 0.0389
0.0417
420 0.0411 0.0367 0.0307 0.0362
430 0.0393 0.0334
0.0363
440 0.0374 0.0315 0.0273 0.0321
450 0.0356 0.0300 0.0265 0.0307
460 0.0337 0.0289 0.0234 0.0287
470 0.0326 0.0278 0.0230 0.0278
480 0.0307 0.0263 0.0215 0.0262
Page 105
88
Table 45 Drying data of Emir type grape skins at 55 ºC at air velocity of 1 m/s.
Time (min) MR Sample 1 MR Sample 2 MR Sample 3 MR Average
0 1 1 1 1
10 0.9247 0.9271 0.9232 0.9259
20 0.8461 0.8591 0.8525 0.8526
30 0.7759 0.7792 0.7897 0.7776
40 0.7144 0.7160 0.7368 0.7152
50 0.6591 0.6575 0.6875 0.6583
60 0.6087 0.6017 0.6404 0.6052
70 0.5619 0.5532 0.5979 0.5576
80 0.5174 0.5066 0.5572 0.5120
90 0.4766 0.4619 0.5175 0.4692
100 0.4391 0.4219 0.4818 0.4305
110 0.4035 0.3849 0.4486 0.3942
120 0.3705 0.3502 0.4165 0.3603
130 0.3390 0.3187
0.3289
140 0.3104
0.3579 0.3104
150 0.2833 0.2622 0.3308 0.2727
160 0.2588 0.2403 0.3050 0.2496
170 0.2366 0.2178 0.2815 0.2272
180
0.1982 0.2597 0.1982
190 0.1976 0.1797 0.2379 0.1887
200 0.1784 0.1623 0.2179 0.1703
210
0.1453 0.1983 0.1453
220 0.1490
0.1818 0.1490
230 0.1364 0.1209 0.1640 0.1287
240 0.1249 0.1087 0.1490 0.1168
250 0.1134 0.0994 0.1343 0.1064
260 0.1034 0.0883 0.1204 0.0959
270 0.0964 0.0802 0.1075 0.0883
280
0.0743 0.0954 0.0743
290 0.0819 0.0680 0.0840 0.0749
300 0.0763 0.0624 0.0740 0.0694
310 0.0708 0.0565 0.0636 0.0637
320 0.0663 0.0528 0.0554 0.0596
330 0.0622 0.0491 0.0479 0.0557
Page 106
89
Table 45 (continued)
Time (min) MR Sample 1 MR Sample 2 MR Sample 3 MR Average
340 0.0593 0.0454 0.0404 0.0524
350 0.0563 0.0428 0.0347 0.0496
360 0.0533 0.0410 0.0290 0.0472
370 0.0515 0.0391 0.0243 0.0453
380 0.0526 0.0354 0.0201 0.0440
390 0.0478 0.0336 0.0172 0.0407
400 0.0459 0.0321 0.0136 0.0390
410 0.0452 0.0303 0.0111 0.0377
420 0.0437 0.0295 0.0086 0.0366
430 0.0426
0.0068 0.0426
440 0.0422 0.0273 0.0040 0.0348
450 0.0411 0.0269 0.0029 0.0340
460 0.0404 0.0266 0.0018 0.0335
470 0.0389 0.0262 0.0004 0.0325
480 0.0389 0.0258
0.0324
Page 107
90
Table 46 Drying data of Emir type grape skins at 60 ºC at air velocity of 1 m/s.
Time (min) MR Sample 1 MR Sample 2 MR Sample 3 MR Average
0 1 1 1 1
10 0.9273 0.9198 0.9108 0.9193
20 0.8532 0.8344 0.8257 0.8377
30 0.7867 0.7609 0.7482 0.7653
40 0.7276 0.6978 0.6799 0.7017
50 0.6722 0.6328 0.6178 0.6409
60 0.6226 0.5738 0.5615 0.5860
70 0.5745 0.5218 0.5092 0.5352
80 0.5294
0.4613 0.4953
90 0.4864 0.4223 0.4177 0.4421
100 0.4460 0.3814 0.3755 0.4010
110 0.4089 0.3417 0.3363 0.3623
120 0.3719 0.3079 0.3004 0.3267
130 0.3377 0.2741 0.2669 0.2929
140 0.3069 0.2444
0.2756
150 0.2779 0.2177 0.2058 0.2338
160 0.2500 0.1932 0.1800 0.2077
170 0.2258 0.1713 0.1559 0.1843
180 0.2008 0.1516 0.1334 0.1619
190 0.1802 0.1330 0.1137 0.1423
200 0.1604 0.1189 0.0959 0.1251
210
0.1052 0.0798 0.0925
220 0.1263 0.0933 0.0651 0.0949
230 0.1116 0.0825 0.0540 0.0827
240 0.0991 0.0725 0.0439 0.0718
250 0.0874 0.0643 0.0356 0.0624
260 0.0778 0.0562 0.0285 0.0542
270 0.0686 0.0499 0.0188 0.0458
280 0.0606 0.0439 0.0151 0.0399
290 0.0539 0.0387 0.0121 0.0349
300 0.0477
0.0097 0.0287
310 0.0418 0.0317 0.0087 0.0274
320 0.0382 0.0283 0.0077 0.0247
330 0.0334 0.0261 0.0061 0.0218
Page 108
91
Table 46 (continued)
Time (min) MR Sample 1 MR Sample 2 MR Sample 3 MR Average
340 0.0297 0.0242 0.0057 0.0199
350 0.0275 0.0220 0.0057 0.0184
360 0.0253 0.0209 0.0044 0.0169
370 0.0231 0.0194 0.0034 0.0153
380 0.0216 0.0183 0.0034 0.0144
390 0.0198 0.0179 0.0030 0.0136
400 0.0183 0.0179 0.0024 0.0129
410 0.0165 0.0172 0.0024 0.0120
420 0.0158 0.0164 0.0020 0.0114
430 0.0139 0.0157
0.0148
440 0.0136 0.0153 0.0014 0.0101
450 0.0128 0.0135 0.0014 0.0092
460 0.0121 0.0131 0.0010 0.0087
470 0.0117 0.0127 0.0010 0.0085
480 0.0114 0.0127 0.0010 0.0084
Page 109
92
Table 47 Drying data of Bogazkere type grape seeds at 40 ºC at air velocity of 1
m/s.
Time (min) MR Sample 1 MR Sample 2 MR Sample 3 MR Average
0 1 1 1 1
10 0.9196 0.9576 0.9206 0.9326
20 0.8488 0.8866 0.8514 0.8623
30 0.7900 0.8281 0.7945 0.8042
40 0.7377 0.7787 0.7471 0.7545
50 0.6950 0.7389 0.7075 0.7138
60 0.6608 0.7061 0.6754 0.6808
70 0.6317 0.6787 0.6469 0.6524
80 0.6081 0.6540
0.6310
90 0.5885 0.6325 0.6042 0.6084
100 0.5719 0.6159 0.5874 0.5917
110 0.5568 0.5960 0.5711 0.5746
120 0.5402 0.5767 0.5564 0.5578
130 0.5262 0.5643 0.5436 0.5447
140 0.5131 0.5487 0.5314 0.5311
150 0.5000 0.5342 0.5197 0.5180
160 0.4880 0.5251 0.5075 0.5069
170 0.4759 0.5090 0.4953 0.4934
180 0.4643 0.4961 0.4851 0.4819
190 0.4528 0.4864 0.4750 0.4714
200 0.4427
0.4648 0.4538
210 0.4317 0.4633 0.4551 0.4500
220 0.4216 0.4520 0.4454 0.4397
230 0.4131 0.4424 0.4368 0.4308
240 0.4020 0.4316 0.4276 0.4204
250 0.3930 0.4220 0.4185 0.4111
260 0.3840 0.4134 0.4103 0.4025
270 0.3754 0.4032 0.4017 0.3934
280 0.3664 0.3935 0.3935 0.3845
290 0.3578 0.3860 0.3849 0.3762
300 0.3498 0.3768 0.3768 0.3678
310 0.3422 0.3666
0.3544
320 0.3347 0.3580 0.3615 0.3514
330 0.3262 0.3500 0.3539 0.3433
Page 110
93
Table 47 (continued)
Time (min) MR Sample 1 MR Sample 2 MR Sample 3 MR Average
340 0.3181 0.3408 0.3457 0.3349
350 0.3111 0.3333 0.3386 0.3277
360 0.3036 0.3258 0.3310 0.3201
370 0.2955 0.3177 0.3238 0.3124
380 0.2890 0.3097 0.3157 0.3048
390 0.2814 0.3027 0.3091 0.2977
400 0.2749 0.2952 0.3025 0.2909
410 0.2679 0.2893 0.2964 0.2845
420 0.2613 0.2834 0.2898 0.2782
430 0.2553 0.2769 0.2831 0.2718
440 0.2498 0.2705 0.2760 0.2654
450 0.2423 0.2645 0.2689 0.2586
460 0.2357 0.2581 0.2623 0.2520
470 0.2302 0.2517 0.2562 0.2460
480 0.2242 0.2447 0.2501 0.2396
Page 111
94
Table 48 Drying data of Bogazkere type grape seeds at 50 ºC at air velocity of 1
m/s.
Time (min) MR Sample 1 MR Sample 2 MR Sample 3 MR Average
0 1 1 1 1
10 0.8900 0.9113 0.8916 0.8908
20 0.7881 0.8316 0.7863 0.7872
30 0.7092 0.7611 0.7058 0.7075
40 0.6479 0.7051 0.6456 0.6468
50 0.5992 0.6587 0.6014 0.6003
60 0.5580 0.6199 0.5666 0.5623
70 0.5244 0.5877 0.5368 0.5306
80 0.4952 0.5584 0.5104 0.5028
90 0.4686 0.5347 0.4856 0.4771
100 0.4455 0.5116 0.4632 0.4544
110 0.4234 0.4899 0.4414 0.4324
120 0.4018 0.4692 0.4205 0.4111
130 0.3807 0.4506 0.3976 0.3892
140 0.3576 0.4314 0.3772 0.3674
150 0.3410 0.4123 0.3579 0.3495
160 0.3225 0.3951 0.3375 0.3300
170 0.3049 0.3780 0.3186 0.3117
180 0.2878 0.3608 0.2992 0.2935
190 0.2702 0.3452 0.2823 0.2763
200 0.2557 0.3306 0.2639 0.2598
210 0.2406 0.3135 0.2480 0.2443
220 0.2265 0.2983 0.2321 0.2293
230 0.2120 0.2832 0.2172 0.2146
240 0.1979 0.2696 0.2013 0.1996
250 0.1833 0.2560 0.1884 0.1859
260 0.1708 0.2424 0.1745 0.1726
270 0.1587 0.2293 0.1620 0.1604
280 0.1487 0.2172 0.1496 0.1491
290 0.1376 0.2051 0.1377 0.1377
300 0.1251 0.1940 0.1277 0.1264
310 0.1175 0.1834 0.1173 0.1174
320 0.1070 0.1713 0.1064 0.1067
330 0.0985 0.1617 0.0984 0.0984
Page 112
95
Table 48 (continued)
Time (min) MR Sample 1 MR Sample 2 MR Sample 3 MR Average
340 0.0884 0.1517 0.0845 0.0865
350 0.0789 0.1421 0.0810 0.0799
360 0.0718 0.1325 0.0731 0.0725
370 0.0638 0.1249 0.0661 0.0650
380 0.0553 0.1159 0.0581 0.0567
390 0.0487 0.1083 0.0517 0.0502
400 0.0422 0.1002 0.0457 0.0440
410 0.0352 0.0917 0.0398 0.0375
420 0.0312 0.0856 0.0353 0.0332
430 0.0236 0.0776 0.0298 0.0267
440 0.0191 0.0710 0.0248 0.0220
450 0.0146 0.0655 0.0199 0.0172
460 0.0096 0.0589 0.0154 0.0125
470 0.0055 0.0539 0.0119 0.0087
480 0.0020 0.0483
0.0020
Page 113
96
Table 49 Drying data of Bogazkere type grape seeds at 55 ºC at air velocity of 1
m/s.
Time (min) MR Sample 1 MR Sample 2 MR Sample 3 MR Average
0 1 1 1 1
10 0.8979 0.8897 0.8982 0.8953
20 0.8048 0.8000 0.8059 0.8036
30 0.7339 0.7343 0.7325 0.7336
40 0.6825 0.6817 0.6748 0.6797
50 0.6418 0.6386 0.6279 0.6361
60 0.6036 0.6035 0.5881 0.5984
70 0.5688 0.5699 0.5545 0.5644
80 0.5361 0.5369 0.5242 0.5324
90 0.5045 0.5078 0.4939 0.5020
100 0.4753 0.4787 0.4669 0.4736
110 0.4461 0.4496 0.4390 0.4449
120 0.4184 0.4221 0.4139 0.4181
130 0.3902 0.3960 0.3893 0.3918
140 0.3641 0.3700 0.3666 0.3669
150 0.3384 0.3449 0.3438 0.3424
160 0.3148 0.3223 0.3225 0.3199
170 0.2932 0.3013 0.3026 0.2990
180 0.2730 0.2802 0.2818 0.2784
190 0.2509 0.2607 0.2633 0.2583
200 0.2313
0.2454 0.2383
210 0.2132 0.2236 0.2288 0.2218
220 0.1966 0.2061 0.2122 0.2049
230 0.1810 0.1910 0.1975 0.1898
240 0.1669 0.1765 0.1838 0.1757
250 0.1523 0.1619 0.1701 0.1614
260 0.1392 0.1494 0.1587 0.1491
270
0.1374 0.1483 0.1428
280 0.1171 0.1264 0.1374 0.1269
290 0.1065 0.1173 0.1284 0.1174
300 0.0949 0.1073 0.1189 0.1071
310 0.0884 0.0983
0.0933
320 0.0808 0.0898
0.0853
330 0.0723 0.0827 0.0958 0.0836
Page 114
97
Table 49 (continued)
Time (min) MR Sample 1 MR Sample 2 MR Sample 3 MR Average
340 0.0658 0.0742 0.0891 0.0764
350
0.0672 0.0830 0.0751
360 0.0532 0.0612 0.0778 0.0640
370
0.0557 0.0711 0.0634
380 0.0431 0.0497 0.0664 0.0531
390 0.0386 0.0457 0.0626 0.0490
400 0.0336 0.0422
0.0379
410 0.0305 0.0371
0.0338
420 0.0265 0.0331 0.0508 0.0368
430 0.0235 0.0301 0.0479 0.0338
440 0.0200 0.0271 0.0456 0.0309
450 0.0180 0.0246 0.0418 0.0281
460 0.0159
0.0394 0.0277
470 0.0129 0.0191 0.0380 0.0233
480 0.0109 0.0171 0.0356 0.0212
Page 115
98
Table 50 Drying data of Bogazkere type grape skins at 60 ºC at air velocity of 1 m/s.
Time (min) MR Sample 1 MR Sample 2 MR Sample 3 MR Average
0 1 1 1 1
10 0.8984 0.8909 0.8858 0.8917
20 0.8262 0.7999 0.7925 0.8062
30 0.7684 0.7088 0.7196 0.7323
40 0.7179 0.6571 0.6633 0.6794
50 0.6627 0.6144 0.6169 0.6313
60 0.6194 0.5703 0.5715 0.5871
70 0.5802 0.5257 0.5336 0.5465
80 0.5394 0.4968 0.4892 0.5085
90 0.5013 0.4627 0.4503 0.4714
100 0.4647 0.4299 0.4143 0.4363
110 0.4306 0.3986 0.3804 0.4032
120 0.3971 0.3688 0.3480 0.3713
130 0.3698 0.3417 0.3191 0.3435
140 0.3357 0.3137 0.2916 0.3137
150 0.3094 0.2858 0.2672 0.2875
160 0.2842 0.2668 0.2432 0.2647
170 0.2599 0.2459 0.2223 0.2427
180 0.2393 0.2265 0.2008 0.2222
190 0.2187 0.2075 0.1839 0.2033
200 0.2016 0.1909 0.1684 0.1870
210 0.1862 0.1753 0.1544 0.1720
220 0.1702 0.1582 0.1430 0.1571
230
0.1482 0.1355 0.1419
240 0.1434 0.1326 0.1210 0.1323
250 0.1305
0.1115 0.1210
260 0.1191 0.1065 0.1031 0.1096
270 0.1098
0.0936 0.1017
280 0.1006 0.0975
0.0990
290 0.0923 0.0908 0.0811 0.0881
300 0.0866 0.0837 0.0746 0.0817
310 0.0799 0.0776 0.0667 0.0747
320 0.0737
0.0652 0.0694
330 0.0686 0.0671 0.0632 0.0663
Page 116
99
Table 50 (continued)
Time (min) MR Sample 1 MR Sample 2 MR Sample 3 MR Average
340 0.0639 0.0629 0.0572 0.0613
350 0.0588 0.0586 0.0547 0.0573
360 0.0552 0.0543 0.0487 0.0527
370 0.0505 0.0515 0.0457 0.0492
380 0.0480 0.0486 0.0417 0.0461
390 0.0459 0.0448 0.0407 0.0438
400
0.0429 0.0387 0.0408
410 0.0412 0.0406 0.0372 0.0397
420 0.0382 0.0377 0.0362 0.0374
430 0.0371 0.0358 0.0327 0.0352
440 0.0356
0.0317 0.0337
450 0.0335 0.0325 0.0307 0.0322
460 0.0320 0.0306
0.0313
470 0.0304 0.0297 0.0297 0.0299
480 0.0284 0.0287 0.0292 0.0288
Page 117
100
Table 51 Drying data of Bogazkere type grape skins at 40 ºC at air velocity of 1 m/s.
Time (min) MR Sample 1 MR Sample 2 MR Sample 3 MR Average
0 1 1 1 1
10 0.9487 0.9524 0.9518 0.9510
20 0.8949 0.9025 0.8980 0.8985
30 0.8442 0.8552
0.8497
40 0.7970 0.8118 0.8059 0.8049
50 0.7512 0.7717 0.7658 0.7629
60 0.7102 0.7351 0.7268 0.7241
70 0.6702 0.6994 0.6898 0.6865
80 0.6329 0.6646 0.6526 0.6500
90 0.5954 0.6310 0.6190 0.6152
100 0.5599 0.6007 0.5864 0.5823
110 0.5267 0.5704 0.5557 0.5509
120 0.4981 0.5410 0.5227 0.5206
130 0.4660 0.5124 0.4892 0.4892
140 0.4362 0.4859 0.4608 0.4610
150 0.4102 0.4580 0.4238 0.4307
160 0.3833 0.4339 0.4035 0.4069
170 0.3581 0.4069 0.3783 0.3811
180 0.3343 0.3840 0.3556 0.3580
190 0.3114 0.3599 0.3324 0.3346
200 0.2893 0.3376 0.3109 0.3126
210 0.2682 0.3156 0.2894 0.2910
220 0.2493 0.2951 0.2699 0.2714
230 0.2306 0.2752 0.2513 0.2524
240 0.2138 0.2573 0.2338 0.2349
250 0.1971 0.2386 0.2174 0.2177
260 0.1820 0.2216 0.2008 0.2015
270 0.1671 0.2056 0.1845 0.1857
280 0.1536 0.1904 0.1704 0.1715
290 0.1407 0.1762 0.1567 0.1579
300 0.1290 0.1628 0.1438 0.1452
310 0.1170 0.1491 0.1317 0.1326
320 0.1064 0.1366 0.1206 0.1212
330 0.0966 0.1259 0.1094 0.1106
Page 118
101
Table 51 (continued)
Time (min) MR Sample 1 MR Sample 2 MR Sample 3 MR Average
330 0.0966 0.1259 0.1094 0.1106
340 0.0878 0.1149 0.0991 0.1006
350 0.0795 0.1054 0.0905 0.0918
360 0.0720 0.0962 0.0810 0.0831
370 0.0643 0.0876
0.0759
380 0.0577 0.0801 0.0658 0.0679
390 0.0508 0.0727 0.0592 0.0609
400 0.0457 0.0658 0.0526 0.0547
410 0.0402 0.0593 0.0469 0.0488
420 0.0357 0.0543 0.0420 0.0440
430 0.0305 0.0486 0.0371 0.0387
440 0.0271 0.0436 0.0331 0.0346
450 0.0233 0.0397 0.0297 0.0309
460 0.0202 0.0355 0.0260 0.0272
470 0.0170 0.0317 0.0225 0.0237
480 0.01447 0.02809 0.0199 0.0208
Page 119
102
Table 52 Drying data of Bogazkere type grape skins at 50 ºC at air velocity of 1 m/s.
Time (min) MR Sample 1 MR Sample 2 MR Sample 3 MR Average
0 1 1 1 1
10 0.9462 0.9258 0.9350 0.9356
20 0.8876 0.8595 0.8641 0.8704
30 0.8338 0.7936 0.8005 0.8093
40 0.7823 0.7331 0.7417 0.7524
50 0.7352 0.6766 0.6891 0.7003
60 0.6913 0.6238 0.6377 0.6509
70 0.6471 0.5736 0.5913 0.6040
80 0.6061 0.5282 0.5467 0.5603
90 0.5663 0.4818 0.5039 0.5174
100 0.5283 0.4432 0.4637 0.4784
110 0.4917 0.4032 0.4273 0.4407
120 0.4595 0.3666 0.3919 0.4060
130 0.4262 0.3325 0.3588 0.3725
140 0.3963 0.3010 0.3284 0.3419
150 0.3665 0.2710 0.2991 0.3122
160 0.3381 0.2422 0.2728 0.2844
170 0.3097 0.2173 0.2483 0.2584
180 0.2845 0.1968 0.2249 0.2354
190 0.2600 0.1760 0.2037 0.2132
200 0.2368 0.1570 0.1850 0.1930
210 0.2149 0.1401 0.1679 0.1743
220 0.1941 0.1243 0.1523 0.1569
230 0.1757 0.1101 0.1369 0.1409
240 0.1593 0.0973 0.1239 0.1268
250 0.1432 0.0851 0.1118 0.1134
260 0.1280 0.0759 0.1014 0.1018
270 0.1145 0.0658 0.0917 0.0907
280 0.1017 0.0584 0.0828 0.0810
290 0.0911 0.0513 0.0748 0.0724
300 0.0815 0.0450 0.0674 0.0647
310 0.0721 0.0394 0.0612 0.0576
320 0.0636 0.0349
0.0493
330 0.0563 0.0308 0.0485 0.0452
Page 120
103
Table 52 (continued)
Time (min) MR Sample 1 MR Sample 2 MR Sample 3 MR Average
340
0.0290 0.0435 0.0363
350 0.0437 0.0269 0.0385 0.0364
360 0.0399
0.0341 0.0370
370 0.0358 0.0234 0.0305 0.0299
380 0.0320 0.0207 0.0267 0.0265
390 0.0285 0.0171 0.0237 0.0231
400 0.0259 0.0154 0.0214 0.0209
410 0.0235 0.0139 0.0190 0.0188
420 0.0215 0.0124 0.0169 0.0169
430 0.0200 0.0112 0.0143 0.0152
440
0.0100 0.0134 0.0117
450 0.0183 0.0094 0.0119 0.0132
460 0.0174 0.0079 0.0107 0.0120
470 0.0168 0.0070 0.0098 0.0112
480 0.0165 0.0064 0.0089 0.0106
Page 121
104
Table 53 Drying data of Bogazkere type grape skins at 55 ºC at air velocity of 1 m/s.
Time (min) MR Sample 1 MR Sample 2 MR Sample 3 MR Average
0 1 1 1 1
10 0.9320 0.9304 0.9230 0.9285
20 0.8604 0.8532 0.8484 0.8540
30 0.7945 0.7825 0.7773 0.7848
40 0.7335 0.7185 0.7128 0.7216
50 0.6768 0.6584 0.6512 0.6621
60 0.6226 0.6021 0.5958 0.6069
70 0.5724 0.5481 0.5419 0.5542
80 0.5245 0.4983 0.4931 0.5053
90 0.4786 0.4500 0.4463 0.4583
100 0.4340 0.4055 0.4043 0.4146
110 0.3970 0.3642 0.3637 0.3750
120 0.3591 0.3259 0.3270 0.3373
130 0.3248 0.2902 0.2923 0.3025
140 0.2902 0.2578 0.2613 0.2698
150 0.2618 0.2286 0.2316 0.2407
160 0.2331 0.2018 0.2056 0.2135
170 0.2074 0.1930 0.1813 0.1939
180 0.1820 0.1570 0.1591 0.1660
190 0.1616 0.1370 0.1396 0.1460
200 0.1406 0.1199 0.1212 0.1272
210 0.1222 0.1045 0.1052 0.1107
220 0.1069 0.0919 0.0925 0.0971
230 0.0924 0.0801 0.0800 0.0842
240 0.0797 0.0704 0.0697 0.0732
250 0.0687 0.0615 0.0602 0.0635
260 0.0596 0.0547 0.0525 0.0556
270 0.0513 0.0482 0.0463 0.0486
280 0.0457 0.0424 0.0401 0.0427
290 0.0403 0.0376 0.0368 0.0383
300 0.0356 0.0332
0.0344
310 0.0318 0.0297 0.0282 0.0299
320 0.0291 0.0264 0.0250 0.0268
330 0.0264 0.0235 0.0223 0.0241
Page 122
105
Table 53(continued)
Time (min) MR Sample 1 MR Sample 2 MR Sample 3 MR Average
340
0.0211 0.0199 0.0205
350 0.0223 0.0185 0.0179 0.0195
360 0.0208 0.0167 0.0161 0.0179
370 0.0196 0.0146
0.0171
380 0.0187 0.0129 0.0137 0.0151
390 0.0179 0.0114 0.0125 0.0139
400 0.0164 0.0102 0.0114 0.0127
410 0.0158 0.0093 0.0105 0.0119
420 0.0152 0.0082 0.0096 0.0110
430 0.0146 0.0073 0.0087 0.0102
440 0.0137 0.0064 0.0084 0.0095
450 0.0134 0.0061 0.0072 0.0089
460 0.0128 0.0055 0.0069 0.0084
470 0.0125 0.0055 0.0066 0.0082
480 0.0122 0.0052 0.0060 0.0078
Page 123
106
Table 54 Drying data of Bogazkere type grape seeds at 60 ºC at air velocity of 1
m/s.
Time (min) MR Sample 1 MR Sample 2 MR Sample 3 MR Average
0 1 1 1 1
10 0.9205 0.9257 0.9154 0.9205
20 0.8410 0.8475 0.8334 0.8406
30 0.7688 0.7768 0.7598 0.7685
40 0.7031 0.7120 0.6897 0.7016
50 0.6432 0.6493 0.6250 0.6392
60 0.5886 0.5937 0.5647 0.5823
70 0.5373 0.5399 0.5077 0.5283
80 0.4889 0.4914 0.4522 0.4775
90 0.4440 0.4462 0.4083 0.4328
100 0.4026 0.4025 0.3548 0.3867
110 0.3612 0.3583 0.3233 0.3476
120 0.3260 0.3187 0.2850 0.3099
130
0.2822 0.2512 0.2667
140 0.2603 0.2492 0.2209 0.2435
150 0.2321 0.2200 0.1933 0.2152
160 0.2057 0.1921 0.1669 0.1882
170 0.1822 0.1674 0.1443 0.1647
180 0.1602 0.1454 0.1229 0.1429
190 0.1403 0.1261 0.1101 0.1255
200 0.1224 0.1086
0.1155
210 0.1063 0.0937 0.0813 0.0938
220 0.0922 0.0803 0.0710 0.0812
230 0.0798 0.0696 0.0609 0.0701
240 0.0690 0.0604 0.0525 0.0607
250 0.0593 0.0527 0.0457 0.0526
260 0.0514 0.0467 0.0389 0.0457
270 0.0443 0.0417 0.0332 0.0398
280 0.0382 0.0378 0.0285 0.0348
290 0.0332 0.0340 0.0243 0.0305
300 0.0288 0.0313 0.0214 0.0272
310 0.0247 0.0289 0.0181 0.0239
320 0.0217 0.0265 0.0157 0.0213
330
0.0248 0.0137 0.0192
Page 124
107
Table 54 (continued)
Time (min) MR Sample 1 MR Sample 2 MR Sample 3 MR Average
340 0.0173 0.0233 0.0122 0.0176
350 0.0156 0.0212 0.0110 0.0159
360 0.0141 0.0203 0.0095 0.0146
370 0.0129 0.0185
0.0157
380 0.0121 0.0176 0.0083 0.0127
390 0.0112 0.0167 0.0077 0.0119
400 0.0106 0.0155 0.0071 0.0111
410 0.0097 0.0146 0.0062 0.0102
420 0.0091 0.0143 0.0056 0.0097
430 0.0085 0.0135
0.0110
440 0.0083 0.0132 0.0050 0.0088
450 0.0077 0.0126 0.0047 0.0083
460 0.0074 0.0120 0.0042 0.0078
470 0.0068 0.0117 0.0039 0.0074
480 0.0065 0.0000 0.0036 0.0033