Modeling flow-induced crystallization in isotactic polypropylene at high shear rates Citation for published version (APA): Roozemond, P. C., Drongelen, van, M., Ma, Z., Hulsen, M. A., & Peters, G. W. M. (2015). Modeling flow-induced crystallization in isotactic polypropylene at high shear rates. Journal of Rheology, 59, 613-642. https://doi.org/10.1122/1.4913696 DOI: 10.1122/1.4913696 Document status and date: Published: 01/01/2015 Document Version: Publisher’s PDF, also known as Version of Record (includes final page, issue and volume numbers) Please check the document version of this publication: • A submitted manuscript is the version of the article upon submission and before peer-review. There can be important differences between the submitted version and the official published version of record. People interested in the research are advised to contact the author for the final version of the publication, or visit the DOI to the publisher's website. • The final author version and the galley proof are versions of the publication after peer review. • The final published version features the final layout of the paper including the volume, issue and page numbers. Link to publication General rights Copyright and moral rights for the publications made accessible in the public portal are retained by the authors and/or other copyright owners and it is a condition of accessing publications that users recognise and abide by the legal requirements associated with these rights. • Users may download and print one copy of any publication from the public portal for the purpose of private study or research. • You may not further distribute the material or use it for any profit-making activity or commercial gain • You may freely distribute the URL identifying the publication in the public portal. If the publication is distributed under the terms of Article 25fa of the Dutch Copyright Act, indicated by the “Taverne” license above, please follow below link for the End User Agreement: www.tue.nl/taverne Take down policy If you believe that this document breaches copyright please contact us at: [email protected]providing details and we will investigate your claim. Download date: 06. Jun. 2020
Transcript
Modeling flow-induced crystallization in isotactic polypropyleneat high shear ratesCitation for published version (APA):Roozemond, P. C., Drongelen, van, M., Ma, Z., Hulsen, M. A., & Peters, G. W. M. (2015). Modeling flow-inducedcrystallization in isotactic polypropylene at high shear rates. Journal of Rheology, 59, 613-642.https://doi.org/10.1122/1.4913696
DOI:10.1122/1.4913696
Document status and date:Published: 01/01/2015
Document Version:Publisher’s PDF, also known as Version of Record (includes final page, issue and volume numbers)
Please check the document version of this publication:
• A submitted manuscript is the version of the article upon submission and before peer-review. There can beimportant differences between the submitted version and the official published version of record. Peopleinterested in the research are advised to contact the author for the final version of the publication, or visit theDOI to the publisher's website.• The final author version and the galley proof are versions of the publication after peer review.• The final published version features the final layout of the paper including the volume, issue and pagenumbers.Link to publication
General rightsCopyright and moral rights for the publications made accessible in the public portal are retained by the authors and/or other copyright ownersand it is a condition of accessing publications that users recognise and abide by the legal requirements associated with these rights.
• Users may download and print one copy of any publication from the public portal for the purpose of private study or research. • You may not further distribute the material or use it for any profit-making activity or commercial gain • You may freely distribute the URL identifying the publication in the public portal.
If the publication is distributed under the terms of Article 25fa of the Dutch Copyright Act, indicated by the “Taverne” license above, pleasefollow below link for the End User Agreement:www.tue.nl/taverne
Take down policyIf you believe that this document breaches copyright please contact us at:[email protected] details and we will investigate your claim.
Modeling flow-induced crystallization in isotacticpolypropylene at high shear rates
Peter C. Roozemond,a) Martin van Drongelen, Zhe Ma, Martien A. Hulsen,and Gerrit W. M. Petersb)
Department of Mechanical Engineering, Eindhoven University of Technology,P.O. Box 513, 5600 MB Eindhoven, The Netherlands
(Received 7 December 2014; final revision received 11 February 2015;published 10 March 2015)
Synopsis
A model is presented to describe flow-induced crystallization in isotactic polypropylene at high
shear rates. This model incorporates nonlinear viscoelasticity, compressibility, and nonisothermal
process conditions due to shear heating and heat release due to crystallization. Flow-induced nucle-
ation occurs with a rate coupled to the chain backbone stretch associated with the longest mode
relaxation time of the polymer melt, obtained from a viscoelastic constitutive model. Flow-induced
nuclei propagate in flow direction with a speed related to shear rate, thus forming shish, which
increase the viscosity of the material. The viscosity change with formation of oriented fibrillar crys-
tals (known as “shish”) is implemented in a phenomenological manner; shish act as a suspension of
fibers with radius equivalent to the radius of the shish plus the attached entangled molecules? The
model is implemented in a 2D finite element code and validated with experimental data obtained in
a channel flow geometry. Quantitative agreement is observed in terms of pressure drop, apparent
crystallinity, parent/daughter ratio, Hermans’ orientation, and shear layer thickness. Moreover,
simulations for lower flow rates are performed and the results are compared, in a qualitative sense,
to experiments from literature. VC 2015 The Society of Rheology.[http://dx.doi.org/10.1122/1.4913696]
I. INTRODUCTION
Flow-induced crystallization (FIC) during processing of semicrystalline polymers
determines to a great extent the final product properties [cf. Bernland et al. (2010);
Fujiyama and Wakino (1988); Schrauwen et al. (2004b)]. Especially, at relatively low
temperatures, i.e., between the melting point of crystals as measured during heating, and
the crystallization temperature measured upon cooling, flow increases the number of
nucleation sites. This effect increases the temperature of solidification and results in fine
structures in the product’s morphology. If the flow is strong enough, it can even create
anisotropic crystalline structures, known as shish-kebabs. These structures, consisting of
a fibrous backbone with lamellar overgrowth, were first recognized in notably stirred
undercooled solutions [Pennings (1977); Pennings and Kiel (1965)], and later also in
polymer melts [Keller and Mackley (1974)].
a)Present address: DSM Ahead, PO Box 18, 6160 MD Geleen, The Netherlands.b)Author to whom correspondence should be addressed; electronic mail: [email protected]
VC 2015 by The Society of Rheology, Inc.J. Rheol. 59(3), 613-642 May/June (2015) 0148-6055/2015/59(3)/613/30/$30.00 613
Redistribution subject to SOR license or copyright; see http://scitation.aip.org/content/sor/journal/jor2/info/about. Downloaded to IP:
The formation of these structures has a big influence on the morphology of injection-
molded products [Fujiyama and Wakino (1988); Schrauwen et al. (2004b)]. Typically,
going from the wall to the center of the product, one encounters first a quenched layer due
to rapid cooling at the cold wall, then a highly oriented layer with shish-kebabs (typically
created by shear rates in excess of �100 s�1), followed by a fine-grained layer with a high
nucleation density (shear rates of �10–100 s�1) and finally a core with large spherulites
[Housmans et al. (2009b); van Meerveld et al. (2004)]. The formation of the shear layer is
commonly studied in isothermal channel flow experiments, with a combination of birefrin-
gence, x-ray diffraction, and ex-situ microscopy [Fernandez-Ballester et al. (2012);
Kumaraswamy et al. (1999); Liedauer et al. (1993); Ma et al. (2013); Seki et al. (2002)].
A number of models have been developed in attempts to capture the formation of
shish-kebabs and the resulting shear layer. Liedauer et al. coupled the parameter _c4t2s ,
with _c the shear rate and ts flow time, to the density of shish [Eder and Janeschitz-Kriegl
(1997); Liedauer et al. (1993)]. Their approach was used as a starting point for the group
in Eindhoven, who linked nucleation rate to deformation of a high-molecular weight
mode on a continuum level [Roozemond and Peters (2013); Steenbakkers and Peters
(2011); Zuidema et al. (2001)] and subsequent shish growth, after overcoming a critical
flow criterion, to deformation of a mode corresponding to the average molecular weight
[Cust�odio et al. (2009); Swartjes et al. (2003); Zuidema et al. (2001)]. This approach was
validated in terms of shear layer thickness in both channel flow and a capillary rheometer.
The model was also validated to be accurate in terms of crystallization kinetics in
extended dilatometry experiments [van Erp et al. (2013)].
Recent experiments using piston driven channel flow have revealed a strong coupling
between structure formation and rheology [Ma et al. (2013); Roozemond et al. (2015)].
As a result of this self-regulating effect, the density of shish within the shear layer is inde-
pendent of flow condition, for strong enough flows. The only affected parameter is the
shear layer thickness.
In this paper, we present a model that includes all important physical mechanisms to
explain these observations. The creation rate of flow-induced nuclei is governed by
stretch in the high-molecular weight tail, as in previous experiments from the Eindhoven
group. The shish growth mechanism is based on the “streamers” concept proposed by the
Kornfield group [Fernandez-Ballester et al. (2012)], and shish growth rate is taken to be
directly proportional to shear rate. Effects of compressibility, nonlinear viscoelasticity,
and nonisothermal conditions due to shear heating as well as heat release due to crystalli-
zation are all taken into account. It is hypothesized that shish influence the rheology in
their surroundings on a scale much larger than their radius. The model is extensively vali-
dated with experiments from a channel flow, in terms of pressure drop, crystallinity, and
shear layer thickness.
It should be stressed that the purpose of this work was not to develop a predictive
model for use in a commercial code. Rather, we attempted to extend a rather well vali-
dated phenomenological model for pointlike nucleation toward creation of oriented struc-
tures and accompanied viscosity increase to investigate the physics that are at play. Some
of the open questions that we have tried to answer are as follows:
• Is there a critical flow criterion that needs to be surpassed before shish appear?• What determines propagation speeds of shish?• At what stage in the FIC process does shish start noticeably altering viscosity of the
polymer melt?• What governs Hermans orientation factor, that can be related to mechanical properties
[Schrauwen et al. (2004a)]?
614 ROOZEMOND et al.
Redistribution subject to SOR license or copyright; see http://scitation.aip.org/content/sor/journal/jor2/info/about. Downloaded to IP:
131.155.151.137 On: Tue, 24 Mar 2015 11:15:03
II. EXPERIMENTAL
Experiments were conducted using an isotactic polypropylene (iPP) homopolymer
(Borealis HD601CF, Mw¼ 365 kg mol�1, and Mn¼ 68 kg mol–1), also examined in other
crystallization studies [Housmans et al. (2009c); van Erp et al. (2012)]. Flow is applied
in a confined slit flow geometry within a modified multipass rheometer, by simultane-
ously moving (in the same direction) the two pistons between which the material is con-
fined. This setup allows for simultaneous probing of rheology, via pressure transducers
positioned near both pistons, and structure development, through windows in the slit
placed halfway between both pistons. Part of the experimental data used for validation
purposes was already presented elsewhere [Ma et al. (2013)]. The reader is referred to
this paper for a full description of the experimental setup. Samples were molten at 220 �Cfor 10 min to erase thermomechanical history. Hereafter, the samples were cooled to a
temperature of 145 �C and subjected to flow at different piston speeds for different flow
durations, see Table I. The material near the pistons is kept above the melting tempera-
ture to guarantee proper functioning of the pressure transducers.
Morphological and structural development were evaluated during flow and during sub-
sequent isothermal crystallization using wide-angle x-ray diffraction (wavelength
k¼ 1.033 A) at the beamline BM26B [Portale et al. (2013)] of the ESRF (Grenoble,
France). During and immediately after flow, 2D patterns were recorded at a frequency of
30 Hz for a total time of 2 s using a Pilatus 300 K detector. Subsequent isothermal crystal-
lization was monitored in a higher azimuthal range (>90�) using a Frelon detector with
an acquisition time of 2.66 s per frame and a total duration of 22 min.
Crystallinity evolution was calculated from the radially integrated patterns as the ratio
between the scattered intensity by crystals and the total scatter intensity. The separate
crystallization kinetics of the kebab lamellae and the branching lamellae [known as
daughters Roozemond et al. (2014)] was determined from the Frelon detector signal. For
the data collected with the Pilatus, the area of the reflection is given by the area under-
neath the (isotropic) baseline subtracted scattering pattern. Regarding the patterns
acquired with the Frelon detector, azimuthal scans of the (110) reflection were fitted by
Lorentzian peaks, which were integrated to obtain the area of the peaks. Proper geometri-
cal corrections were applied [Dean et al. (1998)]. Examples of procedures for both detec-
tors are given in Fig. 1.
It is important to note that the crystallinity obtained is an apparent crystallinity,
because it is an average over the slit thickness. Because the shear rate is maximum at the
wall of the channel and zero in the center, crystallinity will progress much faster at the
walls than at the center.
Herman’s orientation factor [Hermans et al. (1946); Stein and Norris (1958)] was
applied in order to quantify the average level of molecular orientation in the sample
TABLE I. Experimental conditions in the multi-pass rheometer (MPR). Wall shear rate _cw and wall shear stress
rw were calculated at steady state using a Carreau–Yasuda model for the shear rate dependence of the viscosity.
Piston speed (mm/s) Flow duration (s) _cw ðs�1Þ rw (MPa)
60 0.25 370 0.121
80 0.25 500 0.135
100 0.11–0.20–0.23–0.25 635 0.147
120 0.11–0.17–0.20–0.23 769 0.157
0.20 904 0.166
615MODELING FLOW-INDUCED CRYSTALLIZATION IN iPP
Redistribution subject to SOR license or copyright; see http://scitation.aip.org/content/sor/journal/jor2/info/about. Downloaded to IP:
131.155.151.137 On: Tue, 24 Mar 2015 11:15:03
thickness direction and at the location of the diamond window only. The orientation fac-
tor is denoted by fH, which is defined as
fH ¼3h cos2/i � 1
2; (1)
where / is the angle between the crystallographic axis and a reference axis, in this case the
flow direction, and h cos2/i is the average value of the cosine squared of this angle given by
h cos2/i ¼
ðp=2
0
I /ð Þ cos2/ sin /d/
ðp=2
0
I /ð Þsin /d/
: (2)
The orientation factor fH is zero for a fully random orientation, and 1.0 or �0.5 for a
sample fully oriented parallel and perpendicular to the machine direction, respectively.
Orientation functions for the b- and c-axis, fb and fc, were extracted from the baseline
subtracted (110) and (040) reflections, taken from the Frelon recorded 2D wide angle x-
ray diffraction (WAXD) patterns. Since only very small levels of c and b crystals were
detected, it is assumed all reflected intensity originated from monoclinic a-crystals.
Defining the angles � and r, respectively, the b- and c-axis with the flow direction, and
assuming rotational symmetry of all oriented structures, the orientation functions were
obtained according to Eq. (1) with
h cos2�i ¼ h cos2/040i; (3)
h cos2ri ¼ 1� 0:901 � h cos2/040i � 1:099 � h cos2/110i; (4)
where h cos2ri was calculated using Wilchinsky’s method [Wilchinsky (1960)].
III. MODEL
The model presented in this section is solved numerically in two dimensions with an
in-house finite element method (FEM) code. The material confined between the two
FIG. 1. Azimuthal scans of the (110) diffraction of WAXD patterns (inserted) obtained with (a) Pilatus detector
and (b) Frelon detector. Flow direction is vertical.
616 ROOZEMOND et al.
Redistribution subject to SOR license or copyright; see http://scitation.aip.org/content/sor/journal/jor2/info/about. Downloaded to IP:
131.155.151.137 On: Tue, 24 Mar 2015 11:15:03
pistons is tracked using a moving mesh. The left boundary corresponds to the driving pis-
ton. The right boundary corresponds to the material boundary near the comoving piston.
The motion of the other nodes moves accordingly with a linear dependence. The
Arbitrary Lagrangian Eulerian (ALE) formulation [Hirt et al. (1974)] is employed to take
the moving mesh into account. Note that compressibility plays a role and therefore the
motion of the left and right material boundary is different during flow start-up, hence
stretching and compressing the mesh in flow direction. The governing equations are
solved sequentially per time step with semi-implicit Euler time stepping, and a semi-
implicit formulation of the stress in the momentum balance [D’Avino and Hulsen
(2010)]. A number of stabilization techniques were employed; discrete elastic-
viscoelastic stress split (DEVSS) [Bogaerds et al. (2002); Guenette and Fortin (1995)],
streamline-upwind Petrov–Galerkin (SUPG) [Brooks and Hughes (1982)], and
log-conformation representation (LCR) [Hulsen et al. (2005)]. Details about the mesh
size and time step are given in Appendix C.
A. Geometry
Figure 2 schematically shows the domain on which the governing equations are
solved, corresponding to half of the slit in which the experiments were conducted. The
thickness of the slit in velocity gradient direction d¼ 1.5 mm, the length between the two
pistons L� 185 mm. The polymer melt is confined between two pistons (area
C1 � C2 � C3 � C4). By simultaneously moving the pistons in the same direction, the
material is subjected to a Poiseuille flow. Near both pistons, pressure transducers are em-
bedded in the steel of the barrels. The distance between the two pressure transducers is
160 mm. To avoid structure formation influencing the pressure measurements, the barrels
are kept at 220 �C. The barrels and the measurement geometry (which is kept at 145 �C),
are separated by ceramic rings. Thermocouples are embedded in the steel at a distance
from the wall of the flow geometry of dthermocouple¼ 0.5 mm in the steel. The information
from these thermocouples is used for the boundary condition on the temperature problem,
i.e., T¼ 220 �C on C7 � C9 � C4 and C2 � C8 � C5, and T¼ 145 �C on C6.
FIG. 2. Geometry of the MPR. The graph below indicates the initial condition for the temperature.
617MODELING FLOW-INDUCED CRYSTALLIZATION IN iPP
Redistribution subject to SOR license or copyright; see http://scitation.aip.org/content/sor/journal/jor2/info/about. Downloaded to IP:
131.155.151.137 On: Tue, 24 Mar 2015 11:15:03
B. Momentum balance
The momentum balance is given by
q pð ÞDu
Dt¼ �rpþr � sþr � 2gsDð Þ; (5)
where u is velocity and q is the density of the material which depends on the pressure paccording to Eq. (9). The material derivative ðDu=DtÞ ¼ ½ð@u=@tÞ þ u � ru�. A viscous
component with viscosity gs¼ 10�2 Pa s is added for numerical reasons. The deformation
rate tensor is denoted by D. The extra stress is given by
s ¼X
i
Giðci � 1Þ; (6)
with ci the conformation tensor of mode i, calculated with the extended pom-pom (XPP)
viscoelastic model [Verbeeten et al. (2004)] (see Sec. III C 1).
1. Boundary and initial conditions
The fluid is at rest at the start of the simulation (t¼ 0)
• u ¼ 0 for all x.
On the driving piston, the velocity is prescribed• ux ¼ vpiston, on C1,• uy¼ 0, on C1.
On the centerline, we have• @u@y ¼ 0, on C2,
and on the wall• u ¼ 0, on C4.
On the wall near the pistons, a small slip velocity is applied in x-direction to avoid sin-
gularities at points where the pistons and the wall meet; the velocity at the wall is equal
to the piston speed at the pistons and goes linearly to zero in 4 mm. At the comoving
piston, we define a zero force constraint• F ¼ 0, on C3.
Hence, the material does not stick to the comoving piston (which would result in pres-
sure smaller than 0). Instead, the material at this end of the channel has a straight free
surface. The velocity of this free surface becomes an extra unknown, which in steady
state is equal to the velocity of the driving piston but grows to this steady state with a
time scale governed by compressibility effects.
C. Constitutive modeling
1. Viscoelastic fluid model
The rheological behavior of the material is modeled using the multimode XPP model.
This model was originally developed for branched polymer melts, but later was found to
also accurately describe the behavior of linear polydisperse melts [Verbeeten et al.(2004)]. The conformation tensor is given by
cir þ2
exp �i
ffiffiffiffiffiffiffiffiffiffiffiffitr ci=3
p� 1
� �h iks;i
1� 3
tr ci
� �ci þ
1
kb;i
3ci
tr ci� I
� �¼ 0: (7)
618 ROOZEMOND et al.
Redistribution subject to SOR license or copyright; see http://scitation.aip.org/content/sor/journal/jor2/info/about. Downloaded to IP:
131.155.151.137 On: Tue, 24 Mar 2015 11:15:03
where cir
denotes the upper convected derivative of the conformation tensor of mode i,kb;i denotes the relaxation time for backbone tube orientation of mode i, ks;i denotes back-
bone stretch relaxation time of mode i and the parameter �i depends on the number of
arms of the molecule qi following �i ¼ 0:1=qi [Verbeeten et al. (2004)]. The Giesekus
a-parameter is set to 0. The backbone stretch, used in the crystallization model to calcu-
late nucleation density, is given by
Ki ¼ffiffiffiffiffiffiffiffiffiffiffiffiffiffiffiffiðtr ci=3Þ
p: (8)
The linear viscoelastic spectrum of the iPP used in this study, obtained from small angle
oscillatory shear (SAOS) measurements, is given in Table II (i¼ 2–7). The stretch relaxa-
tion times (needed to calculate backbone stretch in the XPP model) are somewhat more dif-
ficult to determine, as this material hardly shows strain hardening in the range of strain
rates that can be probed by the usual experimental techniques [Roozemond et al. (2011);
Steenbakkers and Peters (2011)]. The relation ks;i � kb;i=4 has been observed for several
other polydisperse linear polymer melts [Verbeeten et al. (2004)]. Therefore, we take
ks;i � kb;i=4 and q¼ 1 for all modes except for the mode with the longest relaxation time.
For the latter, the parameters were obtained from a fit to uniaxial extensional viscosity data
[Roozemond et al. (2011)]. There is some ambiguity in the way these relaxation times are
determined. However, the approach is phenomenological and some uncertainty is permit-
ted because of the scaling parameters that link structure formation to these rheological vari-
ables. All relevant rheological parameters for the average and long modes are given in
Table II. To capture steady state pressure drop values it was necessary to add an additional
mode with low relaxation time (mode 1 in Table II), the viscosity of which was chosen
such that steady state pressure drop values for the lowest piston speeds were in acceptable
agreement with experiments. This is justified because SAOS does not probe the material at
shear rates in excess of 1000 s�1, even with the use of time-temperature superposition.
Pressure dependence of relaxation times is not implemented. Although at relevant pres-
sures this effect is appreciable (200 bars gives an increase of a factor 1.38 in relaxation
times [van Erp et al. (2013)], start-up behavior would not be affected because it is domi-
nated by compressibility effects. The only significant effect would be a vertical shift in
pressure drop. Hence, to get good agreement with experiments the viscosity of the shortest
mode would be lower, but the overall results would not be affected. Relaxation times shift
with temperature according to an Arrhenius relation with activation energy Ea¼ 40 kJ/mol.
2. Compressibility
The compressibility of the material is taken into account by considering the polymer
meltlike an elastic solid in volume
TABLE II. Linear viscoelastic spectrum at Tref¼ 220 �C.
Mode
Viscosity
g0;i ðPa � sÞBackbone tube
relaxation time kb;i ðsÞBackbone stretch
relaxation time ks;i ðsÞNumber of
arms qi (-)
1 20.0 5� 10�5 2� 10�5 1
2 131 0.0014 3.5� 10�4 1
3 303 0.011 2.7� 10�3 1
4 480 0.060 1.5� 10�2 1
5 377 0.29 7.3� 10�2 1
6 183 1.67 0.42 1
7 46.0 11.5 2.21 12
619MODELING FLOW-INDUCED CRYSTALLIZATION IN iPP
Redistribution subject to SOR license or copyright; see http://scitation.aip.org/content/sor/journal/jor2/info/about. Downloaded to IP:
131.155.151.137 On: Tue, 24 Mar 2015 11:15:03
p ¼ p0 � K ln J; (9)
where p is pressure, p0 is initial pressure, K is compression modulus, and the Jacobian
J ¼ detF with F the deformation gradient tensor between the initial (reference) configu-
ration X0 and the current configuration X. The Jacobian J is a measure for the change in
volume. For iPP, the compressibility modulus K¼ 109 Pa [van der Beek (2005); Zoller
(1979)].
D. Heat balance
The crystallization process, both in terms of structure formation and crystal growth, is
strongly dependent on temperature. To calculate the temperature, the heat balance is
solved
qkcp;kDT
Dt¼ kkr2T þ qkv1DH _n þ r : D; (10)
where subscript k denotes polymer or steel. Values of parameters are given in Table III.
The first term in the right hand side represents heat conduction, the second term latent
heat release due to crystallization [Eq. (27)], and the third term shear heating, with stress
calculated from the XPP model [Eq. (7)]. We do not take into account the changes of spe-
cific heat, thermal diffusivity, and density with temperature or during the phase transition
from the molten to the crystalline phase. Because most of the heat is generated by shear
heating during flow, while all the polymer is in the molten phase, we expect these effects
to be minor. Moreover, the anisotropy of the thermal diffusivity, which can be signifi-
cantly increased in the direction of flow [Venerus et al. (1999)], is not accounted for.
Because the thermal gradient in flow direction in our experiments is generally quite small
and the thermal diffusivity perpendicular to flow direction is affected much less [Venerus
et al. (1999)], we trust this is a reasonable approximation.
1. Boundary and initial conditions
The initial condition for the temperature is shown in Fig. 2; in both barrels, the tem-
perature is 220 �C with a gradient over the ceramic rings. In the flow geometry the tem-
perature is 145 �C. For boundary conditions, we prescribe the temperature of the barrel
on both pistons,
• T¼ 220 �C on C4 � C9 and on C2 � C8.
On the centerline, we have• @T@y ¼ 0, on C2.
TABLE III. Material parameters for the heat balance.
Parameter Symbol Value (unit) Reference
Density (polymer) qp 800 kg/m3 Cust�odio et al. (2009)
Heat capacity (polymer) cp,p 3157 J/kgK Cust�odio et al. (2009)
Redistribution subject to SOR license or copyright; see http://scitation.aip.org/content/sor/journal/jor2/info/about. Downloaded to IP:
131.155.151.137 On: Tue, 24 Mar 2015 11:15:03
And on the horizontal line coinciding with the thermocouples in the metal part, we
prescribe• T¼ 220 �C on C5; C7,• T¼ 145 �C on C6.• The temperature varies linearly in position from 220 to 145 �C on the ceramic rings.
E. Structure formation
Extensive research in the past decade into the phenomenon of FIC has indicated that
flow-enhanced pointlike nucleation is dominated by the chains on the high end of the mo-
lecular weight distribution [Roozemond and Peters (2013); Steenbakkers and Peters
(2011); van Meerveld et al. (2004)]. Similar to the approach taken by Cust�odio et al.(2009), Roozemond and Peters (2013), Steenbakkers and Peters (2011), and van Erp
et al. (2012), the creation rate of pointlike nuclei is coupled in a phenomenological way
to the momentary stretch in the high molecular weight tail of the material (corresponding
to the mode having the longest relaxation time, mode 7 in Table II) on a continuum level
DNf
Dt¼ gn T; pð Þexp ln K2
hmw � 1� �� �
: (11)
where Khmw is the backbone stretch calculated using the XPP constitutive model
[Verbeeten et al. (2004)], and ln and gn are scaling parameters, the latter of which
All parameters in the above equations are given in Table IV. The characterization of this
model is elaborated in Appendix A.
The growth mechanism in our model (see Fig. 3) is based on the “streamers” concept
proposed by the Kornfield group [Fernandez-Ballester et al. (2012)]. Shish propagate in
lengthwise direction by the addition of chain segments with length nseg. In a crude sense,
the flow attaches these segments as crystals to the tip of the shish. Because deformation
rates in the channel are high [possibly even more so in the surroundings of a shish
Hwang et al. (2004)], we can assume that the material deforms affinely. We can then
express the lengthwise propagation speed of a shish as
_L ¼ _cnseg: (13)
In our model, all nucleation sites grow in lengthwise direction with this mechanism.
Therefore, the total line nucleation density for kebabs, i.e., the specific shish length, is
given by
TABLE IV. Parameters for the flow-induced nucleation model at reference temperature of 166 �C and reference
pressure of 100 bars.
Parameter Value Unit
gn;ref 1012 m�3 s�1
cn,T �0.016 �C�1
cn,p 7.58� 10�4 bar�1
lN 0.03 -
621MODELING FLOW-INDUCED CRYSTALLIZATION IN iPP
Redistribution subject to SOR license or copyright; see http://scitation.aip.org/content/sor/journal/jor2/info/about. Downloaded to IP:
131.155.151.137 On: Tue, 24 Mar 2015 11:15:03
DLtot
Dt¼ 2Nf _cnseg: (14)
Note that there is not a critical flow condition for the formation of shish. However, for
weak to mild flow conditions, no shish creation is observed, because nucleation rate _Nf
and propagation rate _L are low for such flow conditions. There is no explicit dependence
on molecular weight in the growth rate of shish; this comes in via the nucleation rate
which is coupled to backbone stretch in the high-molecular weight tail.
It has been observed that shish strongly influence the rheology of the melt before the
crystalline volume fraction reaches considerable proportions [Roozemond et al. (2015)].
Chains protruding from the shish into the melt, so-called “hairs” [Hill and Keller (1981);
Keller and Kolnaar (1997)], were hypothesized to influence the rheology on a macro-
scopic scale. This is implemented in an empirical way. The dynamic viscosity as a func-
tion of space filling is accurately described by the simple equation [Roozemond (2014);
Steenbakkers and Peters (2008)]
log10
jgj n;xð Þjgj n ¼ 0;xð Þ
� �¼ log10 l xð Þð Þn; (15)
where
l xð Þ ¼ jgj n ¼ 1;xð Þjgj n ¼ 0;xð Þ (16)
is the frequency dependent ratio between the dynamic viscosity of the solidified and mol-
ten material. Obviously, there are a number of limitations to this approach, which restrict
its suitability for the current conditions. First, the material in Roozemond (2014) and
Steenbakkers and Peters (2008) crystallized in quiescent conditions, yielding spherulites,
whereas for the experimental conditions used here the material will crystallize in highly
oriented, more elongated structures. Second, the approach was validated only for SAOS,
whereas in this case the material is flowing with _c � 1000 s�1. Therefore, the relevant
material properties are not only the linear viscoelastic properties, but also the nonlinear
viscoelasticity; not only the viscosity is affected, but we also expect shear-thinning
behavior to be affected by this more solidlike phase [Moigne et al. (2013)].
Unfortunately, however, at the moment, we are unable to formulate a more detailed
model for these complex structures. The most straightforward way of implementing the
proposed effect, requiring the least adjustable parameters, is to adjust the viscosity of the
material via the modulus. Therefore, following Pogodina et al. (1999), we express
the moduli of the material as
FIG. 3. Schematic depiction of segment addition to a shish.
622 ROOZEMOND et al.
Redistribution subject to SOR license or copyright; see http://scitation.aip.org/content/sor/journal/jor2/info/about. Downloaded to IP:
131.155.151.137 On: Tue, 24 Mar 2015 11:15:03
Gi ¼ G0;i10 log10ðlÞveff : (17)
Here, G0,i is the modulus of mode i in the molten state as given in Table II, and l is the
ratio between moduli of crystal and melt, typically for iPP l ¼ 104 [Housmans et al.(2009c)]. Finally, veff is the effective space filling of shish-kebabs, taking into account
their hairy nature, given by
veff ¼ 1� exp ð�pLtotr2effÞ; (18)
where reff is the effective radius of a shish. Due to the number of uncertainties in this
approach, we will treat reff as an adjustable parameter. A priori, we expect reff to be in
the order of 35 nm, because shish have a typical radius of 10 nm and the average radius
of gyration of this material can be estimated to be 23.5 nm [Ballard et al. (1978)].
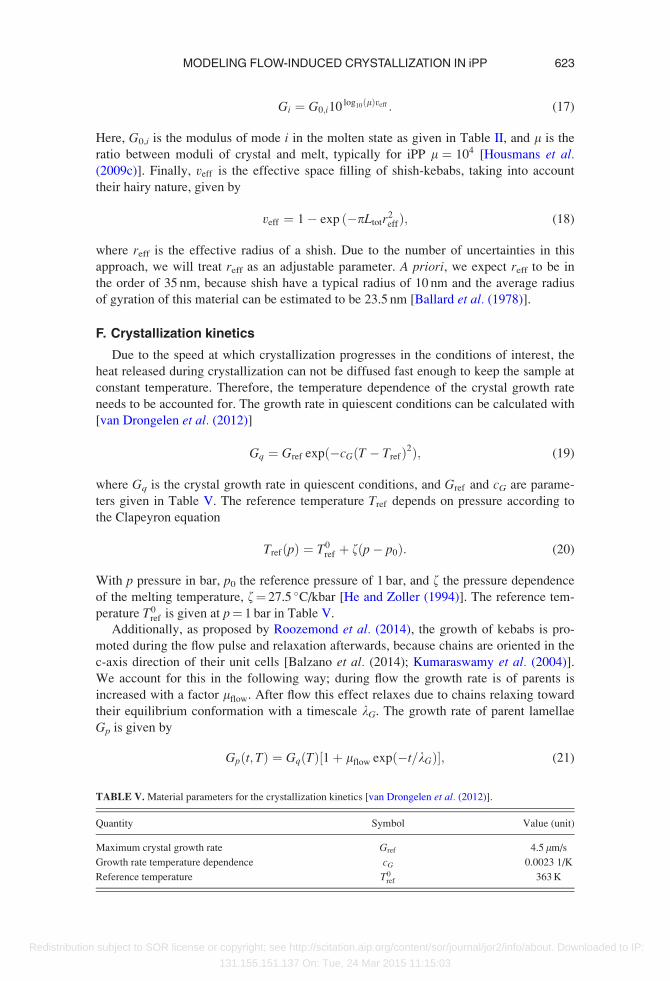
F. Crystallization kinetics
Due to the speed at which crystallization progresses in the conditions of interest, the
heat released during crystallization can not be diffused fast enough to keep the sample at
constant temperature. Therefore, the temperature dependence of the crystal growth rate
needs to be accounted for. The growth rate in quiescent conditions can be calculated with
[van Drongelen et al. (2012)]
Gq ¼ Gref expð�cGðT � TrefÞ2Þ; (19)
where Gq is the crystal growth rate in quiescent conditions, and Gref and cG are parame-
ters given in Table V. The reference temperature Tref depends on pressure according to
the Clapeyron equation
TrefðpÞ ¼ T0ref þ fðp� p0Þ: (20)
With p pressure in bar, p0 the reference pressure of 1 bar, and f the pressure dependence
of the melting temperature, f¼ 27.5 �C/kbar [He and Zoller (1994)]. The reference tem-
perature T0ref is given at p¼ 1 bar in Table V.
Additionally, as proposed by Roozemond et al. (2014), the growth of kebabs is pro-
moted during the flow pulse and relaxation afterwards, because chains are oriented in the
c-axis direction of their unit cells [Balzano et al. (2014); Kumaraswamy et al. (2004)].
We account for this in the following way; during flow the growth rate is of parents is
increased with a factor lflow. After flow this effect relaxes due to chains relaxing toward
their equilibrium conformation with a timescale kG. The growth rate of parent lamellae
Gp is given by
Gpðt; TÞ ¼ GqðTÞ½1þ lflow expð�t=kGÞ�; (21)
TABLE V. Material parameters for the crystallization kinetics [van Drongelen et al. (2012)].
Quantity Symbol Value (unit)
Maximum crystal growth rate Gref 4.5 lm/s
Growth rate temperature dependence cG 0.0023 1/K
Reference temperature T0ref 363 K
623MODELING FLOW-INDUCED CRYSTALLIZATION IN iPP
Redistribution subject to SOR license or copyright; see http://scitation.aip.org/content/sor/journal/jor2/info/about. Downloaded to IP:
131.155.151.137 On: Tue, 24 Mar 2015 11:15:03
where lflow is the additional growth rate due to flow, kG is the relevant time scale
for relaxation of this effect, and t is the time since the cessation of flow. In the present
experiments, we use the same values as found in Roozemond et al. (2014);
lflow ¼ 4; kG ¼ 9 s.
The chain orientation and stretch in flow direction makes crystallization in the daugh-
ter morphology less preferable. However, because growth of daughter crystals only
becomes noticeable when the chains have relaxed to their equilibrium conformations, we
take the growth rate for this species always equal to the quiescent growth rate. For the
isotropic spherulites, we also take the growth rate equal to the value in quiescent
conditions
GdðTÞ ¼ GsphðTÞ ¼ GqðTÞ: (22)
To calculate crystalline volume fraction from the nucleation density, specific shish
length, and crystal growth rate, two sets of coupled differential equations are used. The
first set, also known as the Schneider rate equations [Jerschow and Janeschitz-Kriegl
(1997); Schneider et al. (1988)], describes the evolution of the number density, radius
density, area density, and undisturbed volume fraction for spherulites from the measured
temperature and pressure dependent nucleation density and crystal growth rate. These
equations read
D/3
Dt¼ 8p _N /3 ¼ 8pNð Þ;
D/2
Dt¼ Gsph/3 /2 ¼ Rtotð Þ;
D/1
Dt¼ Gsph/2 /1 ¼ Stotð Þ;
D/0
Dt¼ Gsph/1 /0 ¼ Vtotð Þ;
(23)
where Gsph is the crystal growth rate as determined from Eq. (19). The flow-induced
nucleation rate @tN is given by Eq. (11). For the kebabs growing on shish (parents), we
have
Dw2;p
Dt¼ 4p _Ltot;
Dw1;p
Dt¼ Gpw2;p;
Dw0;p
Dt¼ Gpfpw1;p:
(24)
Here, Ltot denotes the specific shish length given by Eq. (14), Gp is the crystal growth
rate of parent species, and w2;p; w1;p, and w0;p are measures for the shish length per unit
volume, the surface area of kebabs, and undisturbed volume of kebabs, respectively. The
volume fraction of the shish is neglected, because it is very small compared to the total
volume of shish-kebabs (the radius of a shish is in the order of 10 nm [Keller and Kolnaar
(1997)] while the radius of a shish-kebab grows up to about 100 nm [cf. Roozemond
et al. (2015); Seki et al. (2002)].
Following the model proposed by Roozemond et al. (2014), daughter lamellae nucle-
ate on the surface of the parents
624 ROOZEMOND et al.
Redistribution subject to SOR license or copyright; see http://scitation.aip.org/content/sor/journal/jor2/info/about. Downloaded to IP:
131.155.151.137 On: Tue, 24 Mar 2015 11:15:03
Dw0;d
Dt¼ Gdfdw1;p; (25)
where w0;d is the undisturbed volume fraction of daughters. The surface area of parent
crystals, w1;p, is obtained from Eq. (24). This area acts as nucleation site for both parents
and daughters, which is allocated to either parent or daughter morphology based on their
momentary growth rates [van Drongelen et al. (2012)]
fp ¼Gp
Gp þ Gd;
fd ¼Gd
Gp þ Gd¼ 1� fp:
(26)
Even here it is important that during flow the crystallization of parent crystals is
promoted: during flow, when the crystal growth rate of parents is increased with respect
to the quiescent value, more surface of the kebabs is assigned to nucleate parent crystals.
To correct for impingement, we use the well-known Kolmogorov–Avrami equation
[Avrami (1939)]
n ¼ 1� expð�/0 � w0;p � w0;dÞ; (27)
where n is the crystalline volume fraction, or space filling. From Eq. (27) follows that the
respective crystallization rates of spherulites, parents, and daughters are given by
_nsph ¼ ð1� nÞ _/0;
_np ¼ ð1� nÞ _w0;p; (28)
_nd ¼ ð1� nÞ _w0;d;
when crystallization is complete, the total space filling n ¼ nsph þ np þ nd ¼ 1. By look-
ing at the individual contributions from the different morphologies, we can quantify the
final crystalline structure in terms of morphological composition.
IV. RESULTS
In this section, we present results from simulations with the current model. First, the
significance of compressibility effects is highlighted. Second, the interplay between the
velocity field, structure formation, and temperature is demonstrated. Further, we demon-
strate the effect of the two adjustable parameters, the segment length nseg and the radius
at which shish influence the rheology reff. Next, the current model is quantitatively vali-
dated with the experiments presented in Sec. II. We compare results from the model pre-
sented in this paper with previous simulation work from our group [Cust�odio et al.(2009); van Erp et al. (2013); Zuidema et al. (2001)]. Finally, results of the model in
milder conditions are compared in qualitative terms with experiments from literature.
A. Compressibility effects
It is important to realize that in such extreme conditions, compressibility of the poly-
mer melt plays an important role in start-up behavior. This is illustrated in Fig. 4, where
simulations and experiments are compared, with the only difference that in the results
625MODELING FLOW-INDUCED CRYSTALLIZATION IN iPP
Redistribution subject to SOR license or copyright; see http://scitation.aip.org/content/sor/journal/jor2/info/about. Downloaded to IP:
131.155.151.137 On: Tue, 24 Mar 2015 11:15:03
depicted in the left figure the material is incompressible, and compressibility is switched
on for the results shown in the right figure. Clearly, the dominant timescale for flow start-
up is the compressibility, as was also observed by, for example, Hatzikiriakos and Dealy
(1994). The upturn in pressure drop for higher flow rates is caused by structure formation,
which was turned off in these simulations.
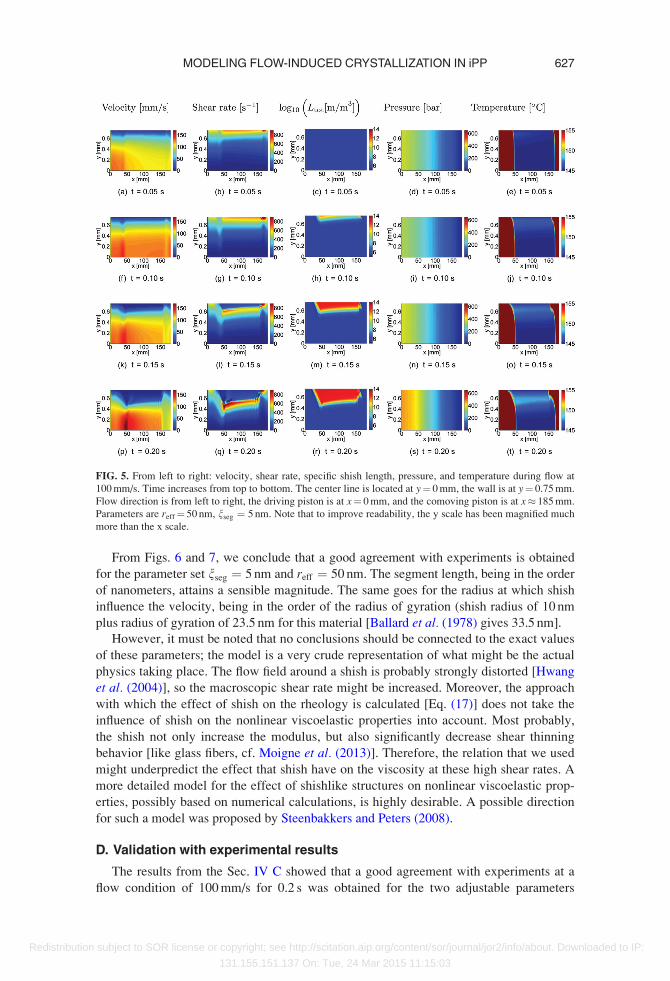
B. Interplay between structure formation and rheology
Figure 5 demonstrates the evolution of several quantities during flow with a piston
speed of 100 mm/s for 0.20 s. The flow start-up behavior is demonstrated most clearly in
the first and fourth column, showing velocity and pressure, respectively. The temperature
(not shown in the metal part), presented in the right column, clearly shows strong shear
heating effects; the temperature increases by as much as 5 �C.
The specific shish length is presented in the middle column. From 0.10 s, a significant
part of the channel is filled with a high amount of shish (inter-shish distance of roughly
100 nm). As a result, the viscosity of the material in this region is increased, giving rise
to a lower velocity, higher overall pressure drop, and a high shear rate region where shish
formation takes place that propagates from the wall toward the center.
C. Parameter variation
In Fig. 6, we present simulation results for a flow condition of 100 mm/s for 0.20 s, with
varying segment length nseg. The radius at which shish influence the rheology reff was kept
constant at 50 nm. The segment length only has a minor influence on the results. Notably,
the specific shish length within the shear layer is hardly affected by the segment length. The
main effect of varying nseg is the increased shear layer thickness; because shish grow at
higher speeds, the modulus increases faster, causing a faster propagation of the shear layer.
The specific shish length within the shear layer, and with it the crystallization kinetics,
is dominated by the effective radius of shish. This is demonstrated in Fig. 7, where the ra-
dius at which shish affect rheology reff was varied. For low reff, shish only start affecting
rheology at a high density, resulting in a small shear layer with high nucleation density
and fast crystallization kinetics. The apparent crystallinity however is quite low, because
the shear layer is thin. For high reff, the modulus of the melt is already increased signifi-
cantly for shish that are spaced far apart (i.e., low Ltot), causing a fast propagation of the
shear layer front but a low total shish density within the layer.
FIG. 4. Time evolution of pressure drop over the slit. Symbols show measurements, lines show simulations for
the iPP used in this study, which is taken to be incompressible (a) or compressible (b). Signals are shifted in ver-
tical direction for clarity.
626 ROOZEMOND et al.
Redistribution subject to SOR license or copyright; see http://scitation.aip.org/content/sor/journal/jor2/info/about. Downloaded to IP:
131.155.151.137 On: Tue, 24 Mar 2015 11:15:03
From Figs. 6 and 7, we conclude that a good agreement with experiments is obtained
for the parameter set nseg ¼ 5 nm and reff ¼ 50 nm. The segment length, being in the order
of nanometers, attains a sensible magnitude. The same goes for the radius at which shish
influence the velocity, being in the order of the radius of gyration (shish radius of 10 nm
plus radius of gyration of 23.5 nm for this material [Ballard et al. (1978) gives 33.5 nm].
However, it must be noted that no conclusions should be connected to the exact values
of these parameters; the model is a very crude representation of what might be the actual
physics taking place. The flow field around a shish is probably strongly distorted [Hwang
et al. (2004)], so the macroscopic shear rate might be increased. Moreover, the approach
with which the effect of shish on the rheology is calculated [Eq. (17)] does not take the
influence of shish on the nonlinear viscoelastic properties into account. Most probably,
the shish not only increase the modulus, but also significantly decrease shear thinning
behavior [like glass fibers, cf. Moigne et al. (2013)]. Therefore, the relation that we used
might underpredict the effect that shish have on the viscosity at these high shear rates. A
more detailed model for the effect of shishlike structures on nonlinear viscoelastic prop-
erties, possibly based on numerical calculations, is highly desirable. A possible direction
for such a model was proposed by Steenbakkers and Peters (2008).
D. Validation with experimental results
The results from the Sec. IV C showed that a good agreement with experiments at a
flow condition of 100 mm/s for 0.2 s was obtained for the two adjustable parameters
FIG. 5. From left to right: velocity, shear rate, specific shish length, pressure, and temperature during flow at
100 mm/s. Time increases from top to bottom. The center line is located at y¼ 0 mm, the wall is at y¼ 0.75 mm.
Flow direction is from left to right, the driving piston is at x¼ 0 mm, and the comoving piston is at x� 185 mm.
Parameters are reff¼ 50 nm, nseg ¼ 5 nm. Note that to improve readability, the y scale has been magnified much
more than the x scale.
627MODELING FLOW-INDUCED CRYSTALLIZATION IN iPP
Redistribution subject to SOR license or copyright; see http://scitation.aip.org/content/sor/journal/jor2/info/about. Downloaded to IP:
131.155.151.137 On: Tue, 24 Mar 2015 11:15:03
reff ¼ 50 nm and nseg ¼ 5 nm. Using this parameter set, we performed simulations for
additional flow condition. Comparison between experiments and simulations are pre-
sented in Fig. 8. Simulations capture the experimental data quite accurately, both in terms
of pressure drop [Fig. 8(a)] and apparent crystallinity [Fig. 8(b)]. Note that for the fastest
piston speed (140 mm/s), we only show calculated pressure drop up to 0.165 s. The rea-
son for this is explained in Sec. IV E. One clear discrepancy concerns the crystallization
during flow; our simulations clearly underpredict the evolution of crystallinity at short
times, indicating that the initial growth of shish-kebabs is much faster than in our model.
A possible explanation is that chains protruding into the melt have an enhanced crystalli-
zation rate, an effect which is not accounted for in the current model.
In Appendix B, it is shown that the model shows satisfactory agreement with experi-
mental data at much milder flow conditions.
Figure 9 depicts the evolution of the parent/daughter ratio. Although the trend of
increasing parent/daughter ratio with flow strength is captured well by our simulations,
the exact values are generally underpredicted. This discrepancy might also be resolved
by a higher crystallization rate during flow; as the growth of parent crystals is favorable
over growth of daughter crystals during and shortly after flow, an increased crystalliza-
tion rate would lead to an increased parent/daughter ratio.
FIG. 6. (a) Pressure drop, (b) apparent crystallinity, and (c) shish length density at the window, for varying nseg.
The radius at which shish affect the rheology is kept constant at reff¼ 50 nm. Symbols show experimental data,
and lines show results from simulations.
628 ROOZEMOND et al.
Redistribution subject to SOR license or copyright; see http://scitation.aip.org/content/sor/journal/jor2/info/about. Downloaded to IP:
131.155.151.137 On: Tue, 24 Mar 2015 11:15:03
FIG. 7. (a) Pressure drop, (b) apparent crystallinity, and (c) shish length density at the window, for varying reff.
The segment length is kept constant at nseg ¼ 5 nm. Symbols show experimental data, and lines show results
from simulations.
FIG. 8. Comparison between experiments (symbols) and simulations (lines) for five flow conditions; 60, 80,
100, 120, and 140 mm/s. Flow times are 0.25, 0.25, 0.2, 0.17, and 0.20 s, respectively. (a) Pressure drop and (b)
apparent crystallinity.
629MODELING FLOW-INDUCED CRYSTALLIZATION IN iPP
Redistribution subject to SOR license or copyright; see http://scitation.aip.org/content/sor/journal/jor2/info/about. Downloaded to IP:
131.155.151.137 On: Tue, 24 Mar 2015 11:15:03
Ultimately, this work is aimed at connecting processing conditions to final properties.
Schrauwen et al. (2004a) showed that yield stress was related to orientation of the
crystalline phase, expressed in the Hermans’ orientation factor of the c-axis of the unit
cell, fc. From our calculations, we can extract the Hermans’ orientation factor from the
volume fractions of parent and daughter crystals; kebabs (parents) have their c-axis
oriented parallel to flow direction (i.e., fc¼ 1), whereas daughter lamellae are oriented at
an angle of approximately 80� with respect to flow direction; hence, fc¼�0.45.
The Hermans’ orientation factor in an oriented crystalline piece of material is therefore
given by
fc ¼1 np � 0:45nd
np þ nd; (29)
with np; nd the volume fractions of parents and daughters, respectively. The x-ray beam
traverses across thickness direction in the present experiments; therefore, we should
calculate the average Hermans’ orientation factor over the thickness of the slit at the
location of the beam
hfci ¼1
d
ðd
0
fc dy; (30)
where d is the thickness of the slit. Experimental and calculated values for the average
Hermans’ orientation factor of the c-axis hfci are presented in Fig. 10. The final value is
captured quite well by our calculations for all flow conditions. An interesting direction
for future work would be to investigate if the calculated Hermans’ orientation factor is a
good predictor of mechanical properties for this type of material under relevant flow
conditions.
Increasing flow time while keeping piston speed constant shows similar trends as
increasing the piston speed, as demonstrated in Fig. 11. The increase of shear layer
thickness and parent/daughter ratio with flow time is captured by simulations. However,
crystallization kinetics at short times as well as parent/daughter ratio are underpredicted
for all flow conditions.
FIG. 9. Parent/daughter ratio from experiments (symbols) and simulations (lines).
630 ROOZEMOND et al.
Redistribution subject to SOR license or copyright; see http://scitation.aip.org/content/sor/journal/jor2/info/about. Downloaded to IP:
131.155.151.137 On: Tue, 24 Mar 2015 11:15:03
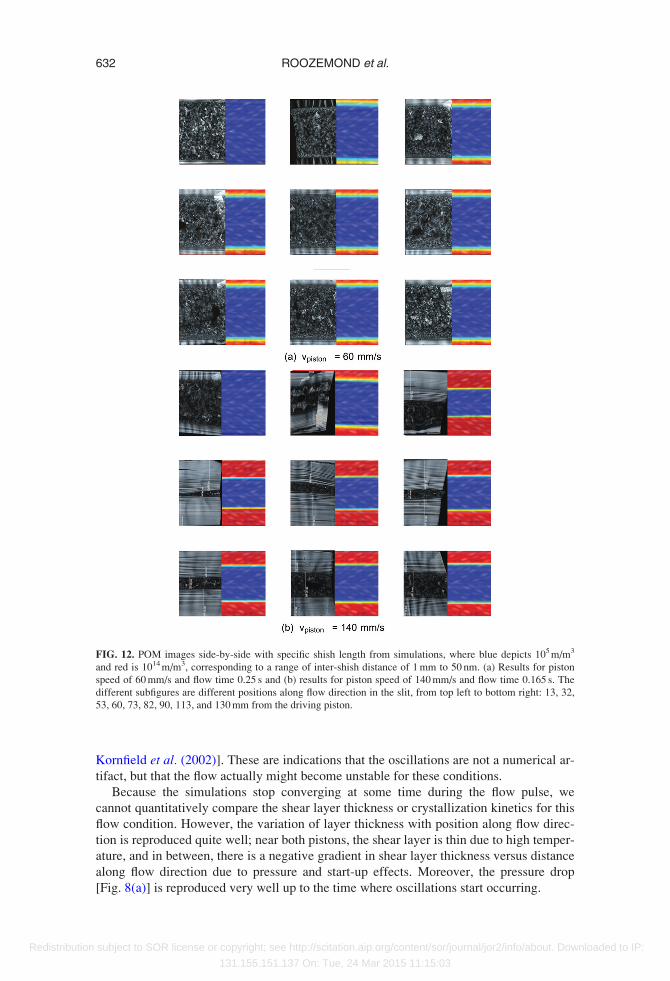
E. Shear layer thickness and flow instabilities
Figure 12 shows polarized optical microscopy (POM) pictures of the sample in the slit
at nine positions along flow direction, for piston speeds of 60 mm/s (a) and 140 mm/s (b).
The shear layer is distinctly visible in the POM images. The specific shish length from
simulations is shown next to the POM images, where the color scale ranges from inter-
shish distance of 1 mm (blue) to 50 nm (red). For the piston speed of 60 mm/s, shear layer
thickness is captured very accurately. For the piston speed of 140 mm/s, however, we are
unable to reproduce the experimental results. As the thickness of the shear layer increases
and the channel effectively becomes narrower, the velocity starts showing oscillations in
x-direction as a result of which the numerical model no longer converges. The morphol-
ogy that we show in Fig. 12 is the morphology at 0.165 s. Shortly after this moment, the
flow becomes unstable. The exact time at which these oscillations start occurring depends
on mesh size; with a finer mesh, these oscillations start at earlier times. Also, the POM
images for this piston speed do not reveal the shear layers with straight edges that can be
found for the lower piston speed, and also in many other studies [Cust�odio et al. (2009);
FIG. 10. Average Hermans’ orientation factor of the c-axis from experiments (symbols) and simulations (lines).
FIG. 11. Apparent crystallinity (a) and parent/daughter ratio (b) for flows with piston speed 120 mm/s for vary-
ing flow times. Symbols indicate measurements, lines are simulations.
631MODELING FLOW-INDUCED CRYSTALLIZATION IN iPP
Redistribution subject to SOR license or copyright; see http://scitation.aip.org/content/sor/journal/jor2/info/about. Downloaded to IP:
131.155.151.137 On: Tue, 24 Mar 2015 11:15:03
Kornfield et al. (2002)]. These are indications that the oscillations are not a numerical ar-
tifact, but that the flow actually might become unstable for these conditions.
Because the simulations stop converging at some time during the flow pulse, we
cannot quantitatively compare the shear layer thickness or crystallization kinetics for this
flow condition. However, the variation of layer thickness with position along flow direc-
tion is reproduced quite well; near both pistons, the shear layer is thin due to high temper-
ature, and in between, there is a negative gradient in shear layer thickness versus distance
along flow direction due to pressure and start-up effects. Moreover, the pressure drop
[Fig. 8(a)] is reproduced very well up to the time where oscillations start occurring.
FIG. 12. POM images side-by-side with specific shish length from simulations, where blue depicts 105 m/m3
and red is 1014 m/m3, corresponding to a range of inter-shish distance of 1 mm to 50 nm. (a) Results for piston
speed of 60 mm/s and flow time 0.25 s and (b) results for piston speed of 140 mm/s and flow time 0.165 s. The
different subfigures are different positions along flow direction in the slit, from top left to bottom right: 13, 32,
53, 60, 73, 82, 90, 113, and 130 mm from the driving piston.
632 ROOZEMOND et al.
Redistribution subject to SOR license or copyright; see http://scitation.aip.org/content/sor/journal/jor2/info/about. Downloaded to IP:
131.155.151.137 On: Tue, 24 Mar 2015 11:15:03
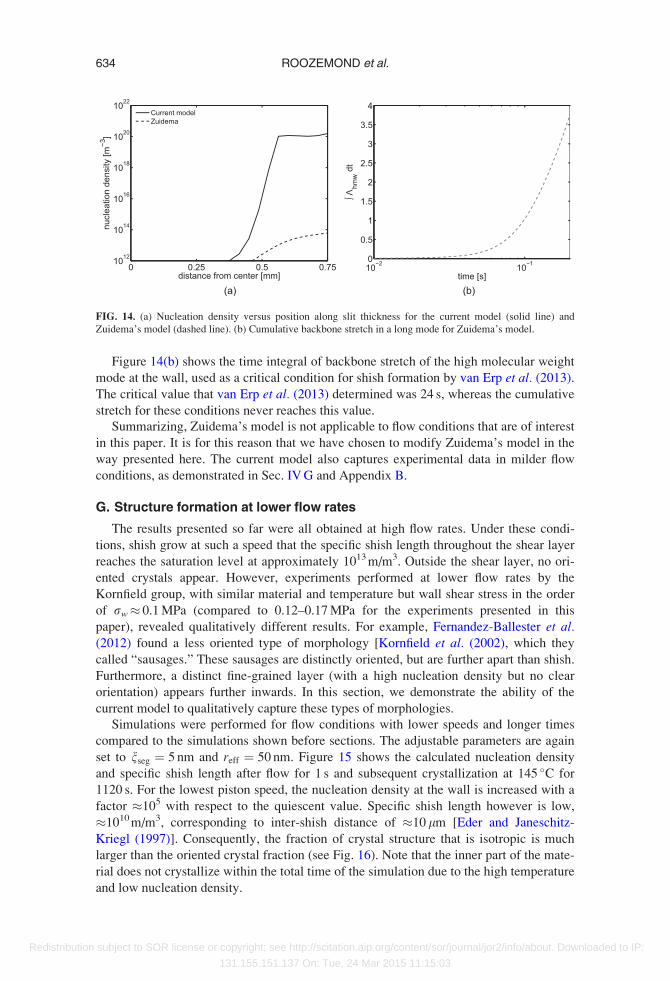
F. Comparison to Zuidema’s model
The approach of coupling structure formation to deformation calculated with a
rheological model on continuum level was first presented by Zuidema et al. (2001). The
model presented by Zuidema was slightly modified by Steenbakkers and Peters (2011),
who replaced the recoverable strain by backbone stretch, and also used by Cust�odio et al.(2009). In the aforementioned publications, shish started growing after a critical back-
bone stretch was reached in the high molecular weight tail. Instead, van Erp et al. (2013)
showed that a more realistic critical condition is a cumulative stretch, i.e., time integral
over backbone stretch.
The model presented in this paper differs significantly from the aforementioned works
in a number of aspects. First, in the current model, the nucleation rate depends on back-
bone stretch of a high-molecular weight mode via an exponential relation instead of a
power law. Second, there is no critical condition for the formation of shish; oriented crys-
tals always grow, and the propagation velocity is related to shear rate instead of backbone
stretch of an average mode. Finally, we have added the coupling between shish formation
and viscosity increase.
The reason for the first two modifications is demonstrated in Fig. 13, where we have
shown experimental data and simulations with the current model and the most recent
formulation of Zuidema’s model [van Erp et al. (2013)] for a flow condition of 100 mm/s
for 0.2 s. It is clear that at these flow conditions, which are much stronger and shorter
than the conditions at which the model was validated in previous publications;
Zuidema’s model vastly underpredicts structure formation.
Figure 14(a) shows the nucleation density after flow as a function of position along
the slit. For Zuidema’s model, the maximum value is around 1014 m�3, which is what one
would expect for far milder shear conditions. The nucleation density calculated by the
current model is much higher. Due to the exponential relation between backbone stretch
and nucleation rate, the nucleation density reaches �1020 m�3. The specific shish length
is around 1013 m/m3 [cf. Fig. 6(c)]; hence, an individual shish has a length of around
100 nm. This is obviously much smaller than the total length of a shish, which can be in
the order of micrometers. However, some authors suggest that shish consist of highly
crystalline blocks connected by less ordered regions [cf. Barham and Keller (1985)]. This
length of �100 nm might correspond to the size of each of the crystalline blocks.
FIG. 13. Pressure drop (a) and apparent crystallinity (b) during and after flow with piston speed of 100 mm/s for
0.2 s. Symbols show experimental data, solid lines show current model, and dashed lines show Zuidema’s model
[van Erp et al. (2013)].
633MODELING FLOW-INDUCED CRYSTALLIZATION IN iPP
Redistribution subject to SOR license or copyright; see http://scitation.aip.org/content/sor/journal/jor2/info/about. Downloaded to IP:
131.155.151.137 On: Tue, 24 Mar 2015 11:15:03
Figure 14(b) shows the time integral of backbone stretch of the high molecular weight
mode at the wall, used as a critical condition for shish formation by van Erp et al. (2013).
The critical value that van Erp et al. (2013) determined was 24 s, whereas the cumulative
stretch for these conditions never reaches this value.
Summarizing, Zuidema’s model is not applicable to flow conditions that are of interest
in this paper. It is for this reason that we have chosen to modify Zuidema’s model in the
way presented here. The current model also captures experimental data in milder flow
conditions, as demonstrated in Sec. IV G and Appendix B.
G. Structure formation at lower flow rates
The results presented so far were all obtained at high flow rates. Under these condi-
tions, shish grow at such a speed that the specific shish length throughout the shear layer
reaches the saturation level at approximately 1013 m/m3. Outside the shear layer, no ori-
ented crystals appear. However, experiments performed at lower flow rates by the
Kornfield group, with similar material and temperature but wall shear stress in the order
of rw� 0.1 MPa (compared to 0.12–0.17 MPa for the experiments presented in this
paper), revealed qualitatively different results. For example, Fernandez-Ballester et al.(2012) found a less oriented type of morphology [Kornfield et al. (2002), which they
called “sausages.” These sausages are distinctly oriented, but are further apart than shish.
Furthermore, a distinct fine-grained layer (with a high nucleation density but no clear
orientation) appears further inwards. In this section, we demonstrate the ability of the
current model to qualitatively capture these types of morphologies.
Simulations were performed for flow conditions with lower speeds and longer times
compared to the simulations shown before sections. The adjustable parameters are again
set to nseg ¼ 5 nm and reff ¼ 50 nm. Figure 15 shows the calculated nucleation density
and specific shish length after flow for 1 s and subsequent crystallization at 145 �C for
1120 s. For the lowest piston speed, the nucleation density at the wall is increased with a
factor �105 with respect to the quiescent value. Specific shish length however is low,
�1010 m/m3, corresponding to inter-shish distance of �10 lm [Eder and Janeschitz-
Kriegl (1997)]. Consequently, the fraction of crystal structure that is isotropic is much
larger than the oriented crystal fraction (see Fig. 16). Note that the inner part of the mate-
rial does not crystallize within the total time of the simulation due to the high temperature
and low nucleation density.
FIG. 14. (a) Nucleation density versus position along slit thickness for the current model (solid line) and
Zuidema’s model (dashed line). (b) Cumulative backbone stretch in a long mode for Zuidema’s model.
634 ROOZEMOND et al.
Redistribution subject to SOR license or copyright; see http://scitation.aip.org/content/sor/journal/jor2/info/about. Downloaded to IP:
131.155.151.137 On: Tue, 24 Mar 2015 11:15:03
For the flow condition with vpiston ¼ 30 mm=s, a thin layer (thickness of 0.1 mm) with
predominantly oriented structures is observed at the wall. The specific shish length den-
sity reaches values between 1010–1012 m/m3, corresponding to inter-shish distance
between �750 and 7500 nm. With such distances between shish, structures would have
the space available to display noncrystallographic branching and splaying at farther dis-
tance, decreasing their degree of orientation [Fernandez-Ballester et al. (2012)]. Hence,
this value indicates a sausagelike structure. Outside of this layer, we again find a fine-
grained layer with high nucleation density, and in the middle of the slit, no crystallization
takes place during the time of the simulation. For the strongest flow condition, the major-
ity of the shear layer of 0.25 mm thickness is filled with shish kebabs (inter-shish distance
of �250 nm), with a thin fine-grained layer adjacent to the shear layer.
These results demonstrate that the current model not only quantitatively captures the
formation and crystallization of shish-kebab structures at high flow rates, but also qualita-
tively captures the formation of less oriented morphologies at lower flow rates.
V. CONCLUSIONS
We have presented a detailed model for FIC at high shear rates. The model calculates
nucleation rate from backbone stretch of a long mode. Growth of nuclei in flow direction
is directly related to local shear rate. Crucially, the model describes a strong effect of
shish on the macroscopic viscosity already at low crystalline volume fractions.
FIG. 15. Nucleation and shish length densities for simulations with flow time of 1 s and varying piston speed.
FIG. 16. Distribution of crystal phases along slit thickness at a selected position in the slit. Piston speed
increases from left to right. The corresponding steady state wall shear stresses in the absence of structure forma-
tion are, respectively, 0.071, 0.087, and 0.095 MPa.
635MODELING FLOW-INDUCED CRYSTALLIZATION IN iPP
Redistribution subject to SOR license or copyright; see http://scitation.aip.org/content/sor/journal/jor2/info/about. Downloaded to IP:
131.155.151.137 On: Tue, 24 Mar 2015 11:15:03
The model was implemented in a numerical code that solves for flow field, constitu-
tive behavior, temperature, and crystallization kinetics in two dimensions. In this way,
the model was validated with experiments at high shear rates. It was found that the model
captures the necessary physics (with only two adjustable parameters) to accurately
describe experimental results, in terms of morphology (i.e., shear layer thickness), crys-
tallization kinetics, and rheology during structure formation. Simulations were also per-
formed for milder flow conditions. It was found that qualitatively, the model predicts
different types of morphology that have been observed in literature.
Coming back to the questions that were posed in the introduction, the following con-
clusions can be stated:
• Crystalline morphologies created in both in low and high shear rate regimes can be
modeled without posing a critical flow criterion for the formation of shish.• Propagation speeds of shish can be linked to shear rate and are in the order of lm/s.• Shish significantly affect the melt viscosity at very low levels of space filling (in the
order of 1%), indicating that noncrystalline material (possibly in the form of chains
tethered to shish) plays a crucial role.• The Hermans orientation factor is a result from different crystal orientations (parent
and daughter lamellae) growing on shish.
A recommended improvement for the current model is a more accurate description of
the influence of dispersed elongated structures on viscoelastic properties at high flow
rates. Furthermore, the proposed (very straightforward) relation between shear rate and
shish propagation velocity needs to be more thoroughly validated, for example, at differ-
ent temperatures and pressures, different materials, and more complex flow fields.
ACKNOWLEDGMENTS
The staff at beamline BM26 is gratefully acknowledged for their invaluable help
during the experiments. Financial support from STW (projects 08083 and 07730) made
this work possible. The authors thank NWO for granting beamtime to do these
experiments (proposal no. 26-02 668).
APPENDIX A: CHARACTERIZATION OF FLOW-INDUCED NUCLEATION
To determine all parameters for the flow-induced nucleation model [Eq. (11)], we used
the experimental data set that was presented by van Erp et al. (2012, 2013). The experiments
were performed in the Pirouette extended dilatometer [Housmans et al. (2009a); van Erp
et al. (2012, 2013)]; material was cooled down from the molten state at �1 �C/s to room
temperature in isobaric conditions at four different pressures (p¼ 100, 500, 900, 1200 bars).
A shear pulse with fixed duration of 1 s and varying shear rate of _c ¼0; 3; 10; 30; 100; 180 s�1 was applied at undercooling of 30 �C or 60 �C. The undercooling
is the difference between the temperature where the shear pulse was applied and the melting
temperature, corrected for the variation of melting temperature with pressure according the
Clapeyron equation [He and Zoller (1994)]. The specific volume of the material was moni-
tored. The experimental crystallization temperature was defined as shown in Fig. 17, which
corresponds to a space filling of �10% [van Erp et al. (2013)]. The Schneider rate equations
(Sec. III F) were used to calculate crystallization kinetics during cooling. The crystallization
temperature from calculations was defined at the temperature where n¼ 0.12.
Experiments and calculations are compared in terms of dimensionless transition tem-
perature H as
636 ROOZEMOND et al.
Redistribution subject to SOR license or copyright; see http://scitation.aip.org/content/sor/journal/jor2/info/about. Downloaded to IP:
131.155.151.137 On: Tue, 24 Mar 2015 11:15:03
H ¼ Tc_c
TcQ; (A1)
with TcQ the crystallization temperature in quiescent conditions and Tc
_c the crystallization
temperature after shear. Hence, H¼ 1 if shear has no effect and H increases with shear rate.
Van Erp et al. (2012, 2013) determined the critical shear rate for appearance of ori-
ented crystalline structures from small angle x-ray scattering (SAXS). Generally, the
morphology was isotropic for shear rates up to 100 and 30 s�1 for undercoolings of 30
and 60 �C, respectively. In this Appendix, we use only the experiments that yielded
exclusively isotropic structures to find the parameters for our flow-induced nucleation
model. This model calculates nucleation rate from backbone stretch of a high molecular
weight mode
_Nf ¼ gnðT; pÞ exp ðlnðK2hmw � 1ÞÞ; (A2)
where the pressure and temperature dependence of gn is given by


![The structure of Isotactic Polypropylene Crystallized from ... · During the crystallization of isotactic polypropylene, Varga [4] found that, two types of spherulites α-and β-modification.](https://static.documents.pub/doc/80x56/5f728cad3c16086d9a751103/the-structure-of-isotactic-polypropylene-crystallized-from-during-the-crystallization.jpg)


