21
Modeling In Situ Oil Shale Retorting Jack Parker and Fan Zhang Oak Ridge National Laboratory

Modeling In Situ Oil Shale Retorting
Jack Parker and Fan ZhangOak Ridge National Laboratory

Overview
Describe a model for in situ oil shale retorting with nonequilibrium fracture-matrix heat and mass transfer
Compare first-order transfer function approximation and radial matrix diffusion model
Model validation for laboratory retort experiments
Practical criteria for use of first-order approach

Model Description
Transient gas phase flow
Thermal transport in dual-continuum fracture-matrix medium
Multispecies transport in dual-continuum medium
Geochemical model to handle complex kinetic and/or equilibrium-controlled reaction networks
Implemented in 3-D finite element code

In Situ Retort ReactionsDescription* Reaction KineticsPrimary pyrolysis (m)
Secondary pyrolysis (m)
Carbon gasification (m)
Dolomite decomposition (m)
Calcite decomposition (m)
Oil coking (f,m)
kerogen(s) oil(l) + gas(v) + H2 (v) + CH4 (v)+ CO2 (v) + H2O(v) + char1(s)
char1(s) H2(v) + CH4(v) + char2(s)char2(s) H2(v) + ROC(s) + ROH(s)
ROC(s) + CO2 (v) H2(v) + CH4(v) + ROC(s)
MgCa(CO3)2(s) CaCO3(s) + MgO(s)+ CO2 (v)
CaCO3(s) + SiO2(s) Ca2SiO4(s) + CaO(s)+ CO2 (v)
oil(l) H2(v) + CH4(v) + ROC(s)
Arrhenius (Campbell et al. 1980)
Arrhenius with distributed Eact
Ergun (Gregg et al 1980; Braun 1981)
Arrhenius (Gregg et al. 1980)
Arrhenius (Braun 1981)
Empirical function of primary pyrolysis rate and heating rate (Braun 1981)
* m = matrix reaction, f = fracture reaction
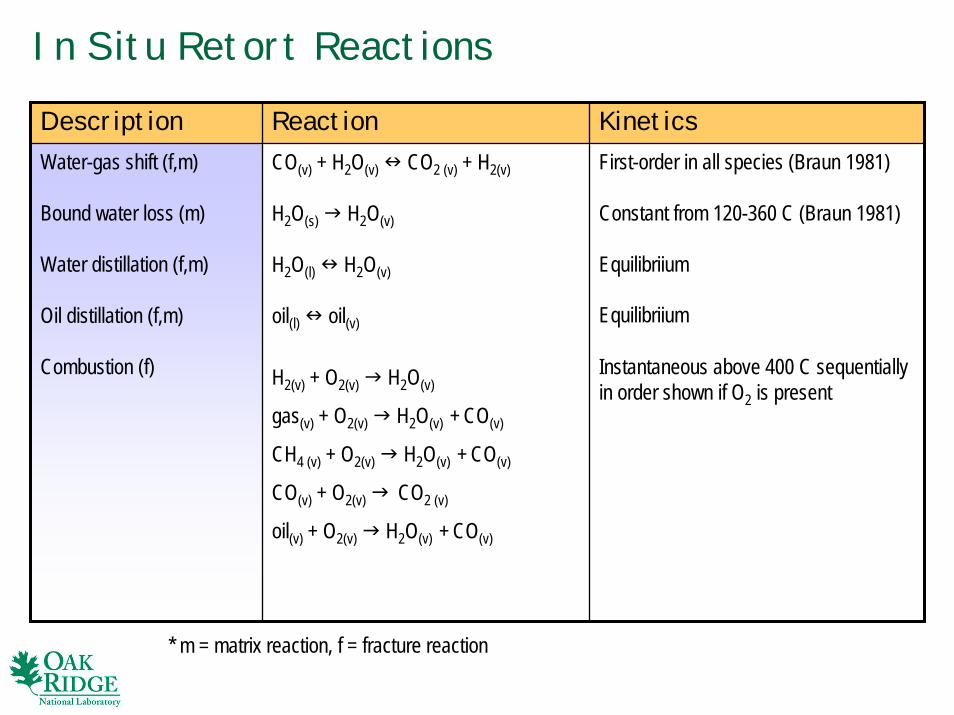
In Situ Retort ReactionsDescription Reaction KineticsWater-gas shift (f,m)
Bound water loss (m)
Water distillation (f,m)
Oil distillation (f,m)
Combustion (f)
CO(v) + H2O(v) CO2 (v) + H2(v)
H2O(s) H2O(v)
H2O(l) H2O(v)
oil(l) oil(v)
H2(v) + O2(v) H2O(v)
gas(v) + O2(v) H2O(v) + CO(v)
CH4 (v) + O2(v) H2O(v) + CO(v)
CO(v) + O2(v) CO2 (v)
oil(v) + O2(v) H2O(v) + CO(v)
First-order in all species (Braun 1981)
Constant from 120-360 C (Braun 1981)
Equilibriium
Equilibriium
Instantaneous above 400 C sequentially in order shown if O2 is present
* m = matrix reaction, f = fracture reaction

Mass Transport Model
Mass transport processes in fractures− advection− dispersion− fluxes to/from rock matrix− production/loss due to reactions
Mass transport processes in rock matrix− gas phase diffusion− fluxes to/from fracture porosity− production/loss due to reactions

Spherical radial diffusion model
First-order mass transfer model
Rock Matrix Mass Transfer Formulations
22
1m m m mm m
C CD r St r r rφ φ∂ ∂∂ ⎛ ⎞= +⎜ ⎟∂ ∂ ∂⎝ ⎠
( )m mf m m
C C C Stφ α∂
= − +∂
r
An “equivalent” mass transfer coefficient, α, for a given diffusion problem may be derived by equating second moments of the two models yielding
2
60 m m
eff
Dd
φα =
where Dm is the effective species diffusion coefficient, φm is matrix porosity (which varies with time), and deff = rock fragment diameter
Rock Fragment

Heat Transport Model
Thermal processes in fractures− gas phase advection− thermal gas phase dispersion− fluxes to/from rock matrix− endothermic/exothermic reactions
Thermal processes in rock matrix− conduction in rock − fluxes to/from fracture porosity− endothermic/exothermic reactions− external thermal source/sink

Analogous formulations for radial conduction and first-order heat transfer may be written as discussed for mass transfer
The “equivalent” first-order model may be written as
Rock Matrix Heat Transfer Formulations
( )260
f meff
T Tdλ
= −
where λ is thermal conductivity, Tf is fracture temperature, Tm is average rock matrix temperature, and deff is effective rock diameter
fracture-matrix heat transfer raterock volume

Large 17 cm block with 18 deg C/h heating rate
Small 2.5 cm block with 120 deg/h heating rate
Argon sweep gas at fixed flow rate
Off-gas analyzed for various componentsShale composition:• Fischer assay 23 gal/T• Dolomite 38 wt%• Calcite 8.2 wt%
Laboratory Block Retort Study (Gregg et al, 1990)
Compute “equivalent”spherical diameter
deff = 1.5 V/A

Tsurface – Tcenter for FO model computed as 2 x (Tsurface – Taverage)
Increasing deviations between FO and radial models at high temps
Reactions reaching completion sooner with FO model for this experiment; effective diameter behaves smaller than 1.5 V/A
Reaction kinetics controlled by avg temp for first-order model but by temperature distribution for radial model
Temperature in Large Block During Retorting
020406080
100120140160180
250 300 350 400 450 500 550 600 650 700 750 800 850 900 950
Temperature (C)
Tsur
face
-Tce
ntre
(C)
experimentradial diffusion modelheat transfer model
Primary pyrolysis
Mineral decomposition+ secondary pyrolysis
Secondary pyrolysis
Surface
17 cm block with 18 deg/h heating rate

Relative CO2 and CO Flux for Large Block Retort
0
1
2
3
4
5
250 300 350 400 450 500 550 600 650 700 750 800 850 900 950
Surface Temperature (C)
CO
Rel
ativ
e Fl
ux
experimentradial diffusion modelheat transfer model
Reactions peak later and reach completion earlier with first-order models
17 cm block with 18 deg/h heating rate
0
1
2
3
4
5
250 300 350 400 450 500 550 600 650 700 750 800 850 900 950Surface Temperature (C)
CO
2 R
elat
ive
Flux
experimentradial diffusion modelheat transfer model

Final Large Block Retort Results (t = 50 hrs)
Property Measured Radial Model
First-Order Model
Oil yield (% Fischer assay) 91.2 92.0
34.6
1040
600
39.8
Total H2 gas evolved (L) 112.7 113.1 115.0
Residual organic carbon (wt %) 7.83 3.91 6.41
5.52
92.0
Total mass loss (%) 35.5 35.3
Total CO2 gas evolved (L) 1059 1075
Total CH4 gas evolved (L) 46.2 39.8
Total CO gas evolved (L) 546 634
Residual carbonates (wt%) 4.82 2.17
17 cm block with 18 deg/h heating rate
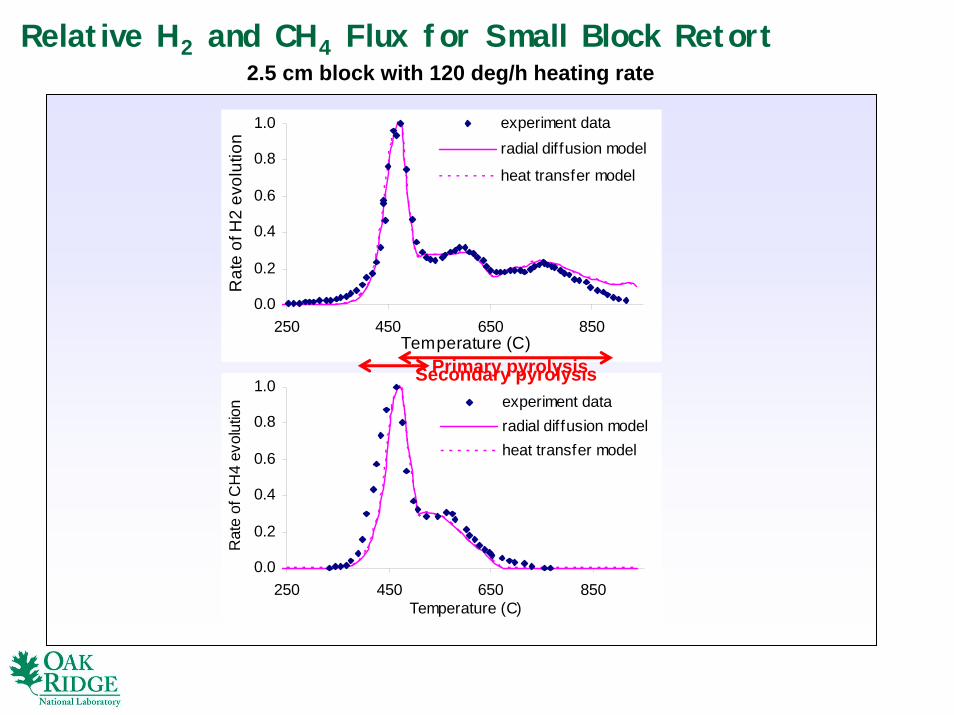
Relative H2 and CH4 Flux for Small Block Retort2.5 cm block with 120 deg/h heating rate
0.0
0.2
0.4
0.6
0.8
1.0
250 450 650 850Temperature (C)
Rat
e of
H2
evol
utio
n
experiment dataradial diffusion model
heat transfer model
0.0
0.2
0.4
0.6
0.8
1.0
250 450 650 850Temperature (C)
Rat
e of
CH
4 ev
olut
ion experiment data
radial diffusion modelheat transfer model
Primary pyrolysisSecondary pyrolysis
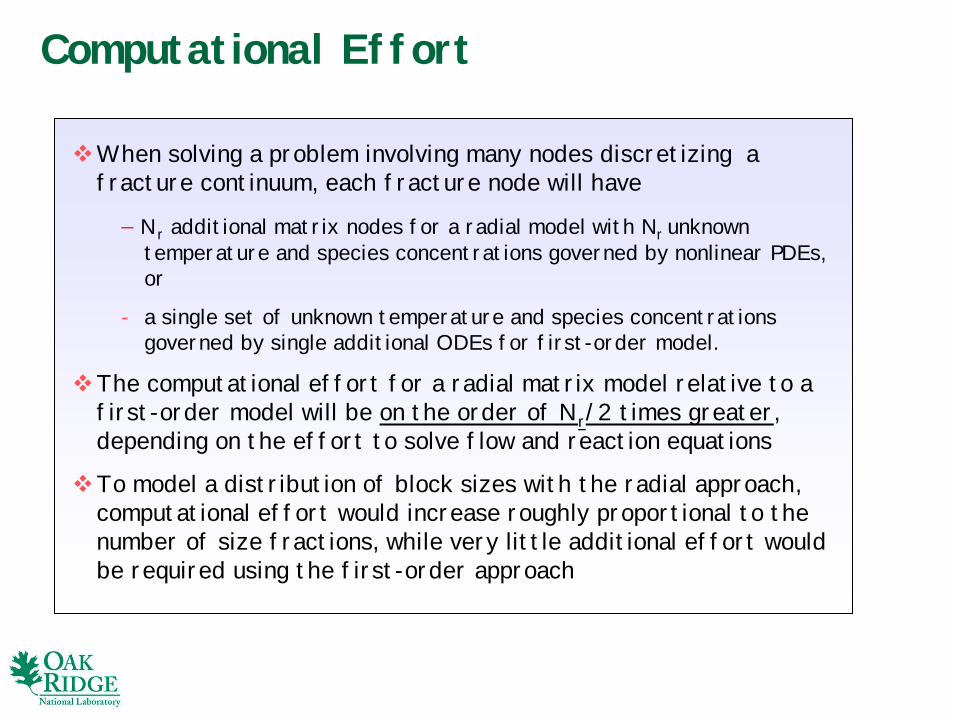
When solving a problem involving many nodes discretizing a fracture continuum, each fracture node will have
− Nr additional matrix nodes for a radial model with Nr unknown temperature and species concentrations governed by nonlinear PDEs, or
- a single set of unknown temperature and species concentrations governed by single additional ODEs for first-order model.
The computational effort for a radial matrix model relative to afirst-order model will be on the order of Nr/2 times greater, depending on the effort to solve flow and reaction equations
To model a distribution of block sizes with the radial approach,computational effort would increase roughly proportional to the number of size fractions, while very little additional effort would be required using the first-order approach
Computational Effort

Compare oil yield vs. time for
− radial and first-order heat/mass transfer models
For block sizes of
− 2.5, 5, 10, 20 cm diameter
For surface heating rates of
− 10, 20, 50, 100 deg C/hr
Model Comparison for a Range of Conditions
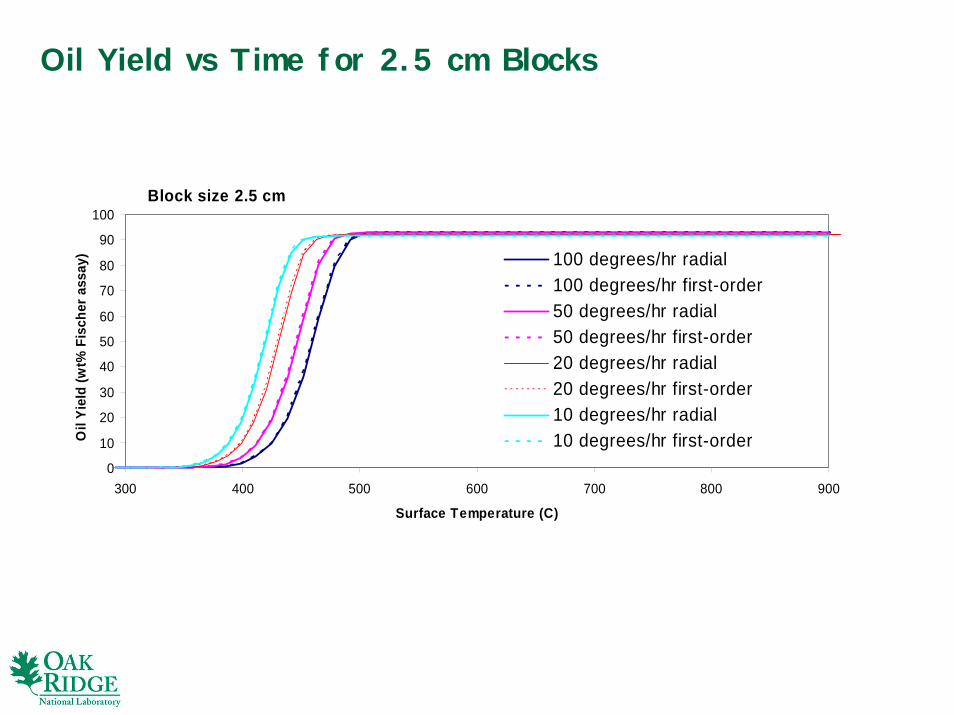
Oil Yield vs Time for 2.5 cm Blocks
Block size 2.5 cm
0
10
20
30
40
50
60
70
80
90
100
300 400 500 600 700 800 900
Surface Temperature (C)
Oil
Yiel
d (w
t% F
isch
er a
ssay
) 100 degrees/hr radial100 degrees/hr first-order50 degrees/hr radial50 degrees/hr first-order20 degrees/hr radial20 degrees/hr first-order10 degrees/hr radial10 degrees/hr first-order

Block size 5 cm
0
10
20
30
40
50
60
70
80
90
100
300 400 500 600 700 800 900
Surface Temperature (C)
Oil
Yiel
d (w
t% F
isch
er a
ssay
) 100 degrees/hr radial100 degrees/hr first-order50 degrees/hr radial50 degrees/hr first-order20 degrees/hr radial20 degrees/hr first-order10 degrees/hr radial10 degrees/hr first-order
Oil Yield vs Time for 5 cm Blocks
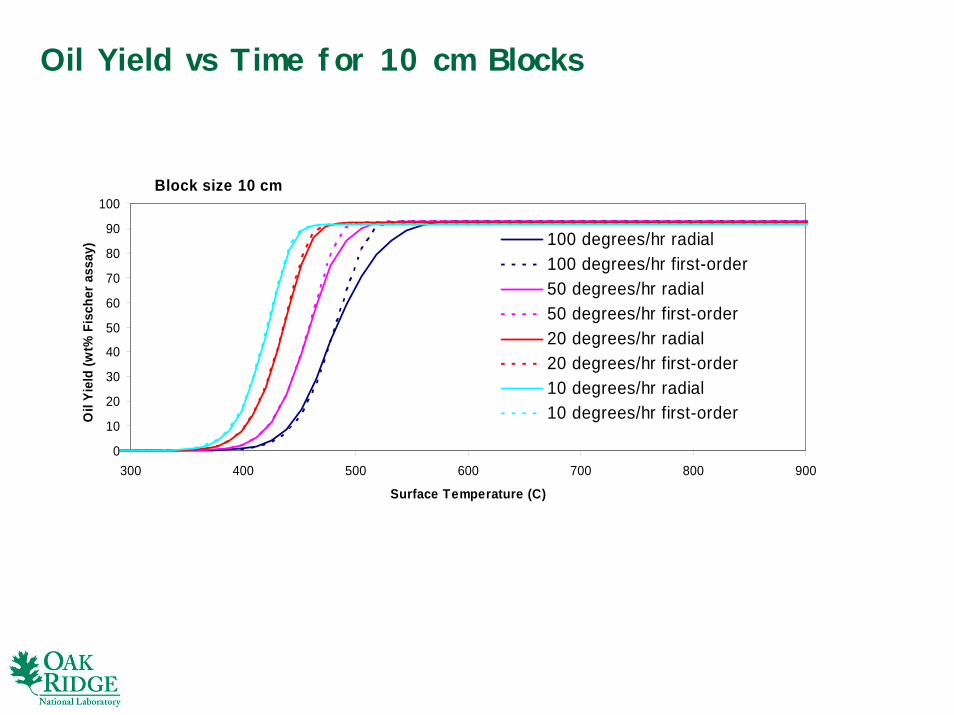
Block size 10 cm
0
10
20
30
40
50
60
70
80
90
100
300 400 500 600 700 800 900
Surface Temperature (C)
Oil
Yiel
d (w
t% F
isch
er a
ssay
) 100 degrees/hr radial100 degrees/hr first-order50 degrees/hr radial50 degrees/hr first-order20 degrees/hr radial20 degrees/hr first-order10 degrees/hr radial10 degrees/hr first-order
Oil Yield vs Time for 10 cm Blocks
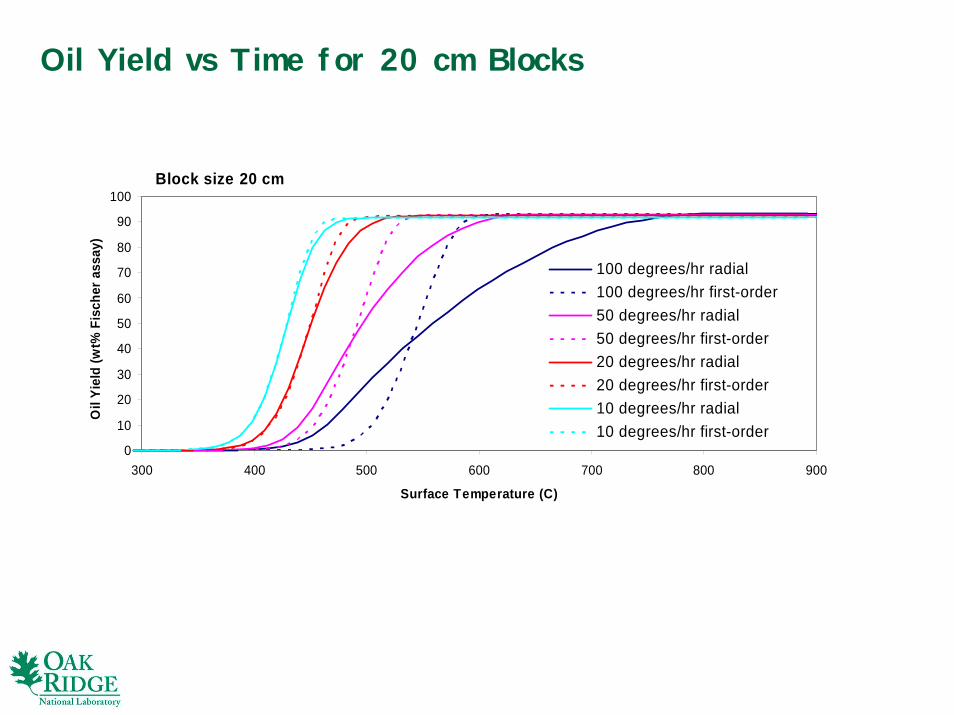
Block size 20 cm
0
10
20
30
40
50
60
70
80
90
100
300 400 500 600 700 800 900
Surface Temperature (C)
Oil
Yiel
d (w
t% F
isch
er a
ssay
)
100 degrees/hr radial100 degrees/hr first-order50 degrees/hr radial50 degrees/hr first-order20 degrees/hr radial20 degrees/hr first-order10 degrees/hr radial10 degrees/hr first-order
Oil Yield vs Time for 20 cm Blocks
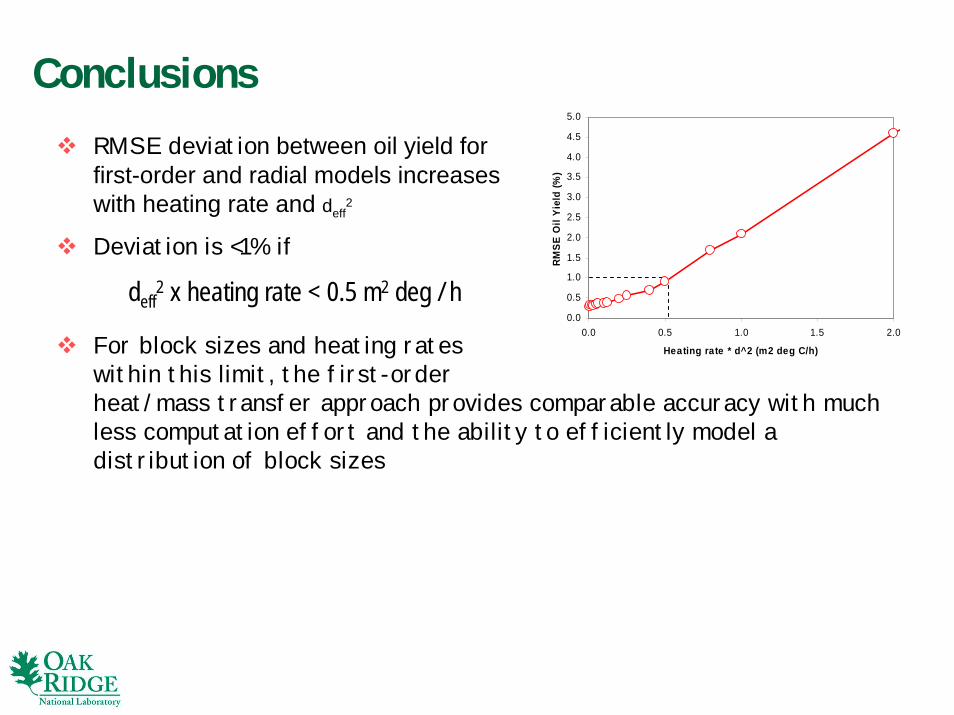
RMSE deviation between oil yield for first-order and radial models increases with heating rate and deff
2
Deviation is <1% if
deff2 x heating rate < 0.5 m2 deg / h
Conclusions
0.0
0.5
1.0
1.5
2.0
2.5
3.0
3.5
4.0
4.5
5.0
0.0 0.5 1.0 1.5 2.0
Heating rate * d^2 (m2 deg C/h)
RMSE
Oil
Yiel
d (%
)
For block sizes and heating rates within this limit, the first-order heat/mass transfer approach provides comparable accuracy with much less computation effort and the ability to efficiently model a distribution of block sizes


