Page 1
ModelingLunarCalendarHoliday Effectsin Taiwan
Jin-LungLin 1
Instituteof Economics,AcademiaSinica
Tian-SyhLiu
Directorate-Generalof Budget,Accounting,andStatistics,ExecutiveYuan,R.O.C
July2002
1We would like to thank Brian Monsell at the Bureauof Census,USA for providing us the program
to generatelunar calendar holiday regressors used in this paper. David Findley hasmadesomeexcellent
suggestions on modeling unemployment rates and on using X-12-ARIMA. Ruey-wan Liou gave useful
commentsof our paper during the2001Workshop on Macroeconometric Modeling heldduring December
13-14, 2001, at the Institute of Economics, AcademiaSinica,Taipei. Kuo-Tung Chenprovided us infor-
mation about the history of lunar calendar. We thank them all. Finally, an anonymousreferee is much
appreciated to proofreadthe manuscript andgive suggestions which have significantly improved the writ-
ing of this paper. Without mentioning, the authors take soleresponsibility of any remaining error. Email
address:[email protected]
Page 2
Abstract
ThethreemostimportantChineseholidays,ChineseNew Year, theDragon-boatFestival,andMid-
AutumnHoliday have datesdeterminedby a lunarcalendarandmovebetweentwo solarmonths.
Consumption,production, andothereconomicbehavior in countrieswith largeChinesepopulation
includingTaiwanarestronglyaffectedby theseholidays.For example,productionacceleratesbe-
fore lunarnew year, almostcompletelystopsduringtheholidaysandgraduallyrisesto anaverage
level aftertheholidays. This movingholidayoftencreatesdifficulty for empiricalmodelingusing
monthly dataandthis paperemploys anapproachthatusesregressorsfor eachholidayto distin-
guisheffectsbefore,duringandafterholiday. Assumingthattheholidayeffect is thesamefor each
dayof the interval over which theregressoris nonzeroin a givenyear, thevalueof theregressor
in a givenmonthis theproportionof this interval thatfalls in themonth.Bell andHillmer (1983)
proposedsucha regressorfor Easterwhich is now extensively usedin theU.S. andEurope.We
applytheBell andHillmer’smethodto analyzetenimportantseriesin Taiwan,whichmightbeaf-
fectedby moving holidays.AICC andout-of-sample forecastperformancewereusedfor selecting
numberof holidayregressorsandtheir interval lengths.Theresultsarefurthercheckedby various
diagnostic checkingstatistics including outlierdetectionandslidingspansanalysis.Theempirical
resultssupportthisapproach.Addingholidayregressorscaneffectively controltheimpactof mov-
ing holidaysandimproves theseasonaldecomposition. AICC andaccumulatedforecasterrorare
usefulin regressorselection.Wefind thatunemploymentratesin Taiwanhaveholidayeffectsand
seasonalfactorscannotbe consistentlyestimatedunlessthe holiday factor is included. Further-
more,astheunemploymentis rising, themagnitudeof holidayandseasonalfactoraredecreasing.
Finally, we find thatholidayfactorsaregenerallysmallerthanseasonalfactorsbut shouldnot be
ignored.
Page 3
1 Introduction
Peoplelive by thecalendarandactaccordingly. For example,Christmasandsolarnew yearhave
beenthemostimportantholidayfor westerncountries.During theholidays,productioneithersig-
nificantly scalesdown or completelyhalts,but consumption,andshoppingactivitiessurge.While
theGregoriancalendarwhich is baseduponsolarsystemis theofficial calendarin mostcountries
nowadays,importantholidaysin somecountriesaredeterminedby othercalendars.Examplesare
theLunarNew Yearof theChineselunarcalendar, Easterof theChristiancalendars,andRamadan
of the Islamiccalendar. As a result,theseholidayshave moving datesin theGregoriancalendar.
For example,the datesof the lunar new yearbetween1998and2001areJanuary28, February
16, February5 andJanuary24 respectively. More precisely, the lunar new yeardatemove be-
tweenJanuary21 andFebruary20, makingthe time lagsbetweenthe lunar andsolarnew years
vary from 21 to 51 days.Dragon-boatFestival andMid-Autumn Holidayareothertwo important
lunar holidayswith datesmoving betweenMay-JuneandSeptember-Octoberrespectively. See
webexhibits.org/calendars/calendar-chinese.htmlfor moredetails.
For furtherexposition of theeffectsof moving holidayoneconomicstatistics, let usconsider
exports. During the monthcontaininglunar new year, export will be much lower thanin other
monthsmainly becausetherearefewer working daysin thatmonth. As a result,monthly growth
ratesas comparedwith samemonth last year will be much lower for, say, February1999and
January2001but veryhighfor January1999andFebruary2001.Econometricmodeling,seasonal
adjustment, andempiricaleconomicanalysesusingmonthlydataaredifficult unlesstheeffectsof
thesemoving holidayscanbeestimatedwith someprecision.Therehavebeennogeneralmethods
or modelsfor estimatingtheseeffects.Thispaperemploysageneralapproachthatusesregressors
for eachholiday to distinguish effects before,during and after the holiday. Assuming that the
holiday effect is the samefor eachday of the interval over which the regressoris nonzeroin a
givenyear, thevalueof theregressorin agiven monthis theproportion of this interval thatfalls in
themonth. Bell andHillmer (1983)proposedsucha regressorfor Easterwhich is now extensively
usedin theU.S.andEurope.Thefundamentalmodelselectionissuesarehow many intervals to
useandthelengthof eachinterval. AICC andout-of-sampleforecastperformancecanbeusedfor
modelselectionandvariouspropertiesof theseasonaladjustmentobtainedafteradjustingfor the
holidayeffectscanbeusedfor diagnosticchecking.
We applytheBell andHillmer approachto analyzeten importanteconomicseriesin Taiwan
which couldbeaffectedby the lunarcalendarholidays. To illustratethis modeling approach,we
provide a detailedaccountof modelselectionanddiagnostic checkingprocessfor theunemploy-
mentrate. Theempiricalresultssupportthis approach.Useof holidayregressorsis, indeed,able
to produceabetterseasonaldecomposition.
1
Page 4
In additionto this introduction,Section2 summarizestheproceduresof seasonaladjustment.
The regARIMA modelingandX-12-ARIMA are elaboratedhere. Variousdiagnostic checking
is also introduced. Bell and Hillmer’s approachis discussedin Section3. Section4 provides
empiricalresultsandSection5 concludes.
2 Procedures of seasonal adjustment
Seasonaladjustmentinvolvestwo stages.In the first stage,a regARIMA model is built for the
time seriesunderinvestigation or its transformedvalues,e.g. logs. The model is usedto pre-
adjustthe seriesfor variouseffects and for forecastingand backcasting.The regARIMA time
seriesregressionerror is the outputof this stage. In the secondstage,this error is fed into X-
12 for seasonaladjustment. Theadjustedseriesis decomposedinto trend,seasonalandirregular
components. Thecorrespondingdecomposition of the original seriescanbe easilyrecoveredby
addingbacktheregressoreffectsandtakingtheinversetransformationif logsweremodeled.Here
aresomesummaries.SeeFindley, Monsell,Bell, OttoandChen(1998)for details.
2.1 regARIMA models
A regARIMA modelis usedfor forecasting,backcastingandpreadjustments. X-12-ARIMA ad-
justment is bestwith a two-sidedfilter anda time seriesmodelis neededto simulatedataoutside
the beginning andendof the sampleperiodso that two-sidedfilters canbe applied. In addition,
preadjustments outliers,trading-dayeffectsandothereffectsincluding thoseof moving holidays
areperformedat this stage.Monthly flow variablesareoften influencedby theweekdaycompo-
sition of the month. More precisely, suchvariablesdependuponwhich daysof the weekoccur
five timesin themonth. To illustrate,let usconsiderindustrial production,export andimport an-
alyzedin this paper. Sinceweekenddaysareofficial holidays, customs andmost factoriesare
closedthen. The threevariablesabove tendto be smallerfor the months with 5 Saturdays,or 5
Sundaysthanthosewith only 4 weekenddays.Young(1965)proposedto control for tradingday
effectsby introducing7 regressors,�����
, measuringthenumberof occurrencesof day � in month����� � �� .
It is sometimesusefulto transformaseriesprior to estimatingaregARIMA modelin orderto
stabilizethevariance.Morespecifically,
� ����������������������� ������� "!$# ���&%�(' �*) � ,+��-/.
2
Page 5
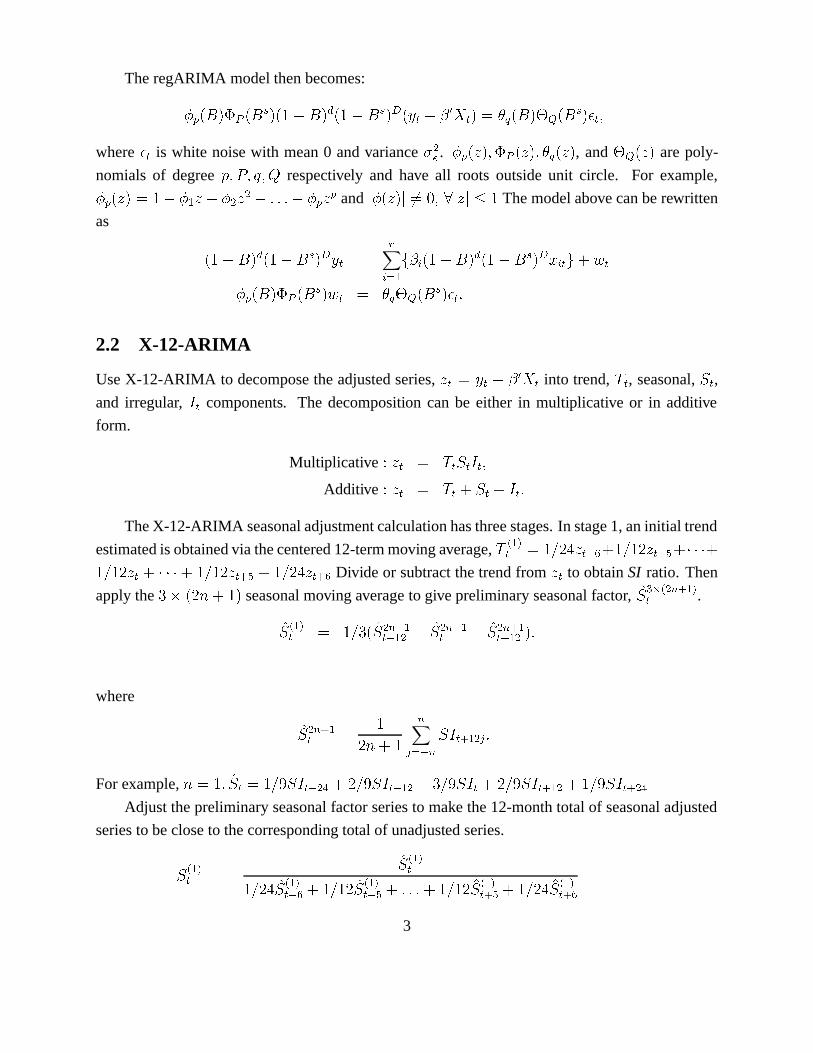
TheregARIMA modelthenbecomes:
0�1 ��23�*4�5���276��8� ' 2���9:� ' 276;�=<>� � � '@?�ACB �=����D�E��2��*FHG���276;�JI=� �where
I��is white noisewith mean0 andvarianceK !L . 0M1 ��NO� � 4�5���NO� � DJE��NO� , and
FPGQ��NO�arepoly-
nomialsof degree R �8S��8TU�WV respectively and have all roots outsideunit circle. For example,0M1 ��NO�$� ' 0YX N ' 0 ! NW! ' .8.8. ' 0"1 N 1and Z 0 ��NO� Z +��- �M[ Z N Z �\
Themodelabovecanberewritten
as
� ' 2��=9:� ' 2&6���< � �]� ^_a` Xcb ? _ � ' 2���9�� ' 276;�=<ed _ �gf #ih �0�1 ��2��c4�5���2 6 � h �]� D�E�FPGQ��2 6 �JI=�g.
2.2 X-12-ARIMA
UseX-12-ARIMA to decomposetheadjustedseries,NW�j� � � 'k? A B � into trend, l � , seasonal,m � ,
and irregular, n � components. The decomposition canbe either in multiplicative or in additive
form.
Multiplicative o Np�q� l � m � n � �Additive o N;�q� l � # m � # n �g.
TheX-12-ARIMA seasonaladjustmentcalculationhasthreestages.In stage1,aninitial trend
estimatedis obtainedvia thecentered12-termmovingaverage,lsrXgt� � )OuOvN;��wOx # ) uN;�ywOz #s{|{8{y#
) u/N;� #}{|{|{O# ) u/Np�y~Oz # )Uu/v/N;��~OxDivideor subtractthetrendfrom
Np�to obtainSI ratio. Then
applythe �3� �yuW� # �seasonalmoving averageto givepreliminaryseasonalfactor, �m��p��r !��
~ Xgt�.
�m rXgt� � ) � � �m !�� ~ X�yw X ! # �m !�� ~ X� # �m !�� ~ X��~ X ! �*.
where
�m !�� ~ X� � up� # �
� ` w � m$n��~ X ! ��.
For example,��� W� �m ��� )O� m$n ��w !g� # u)U� m�n ��w X ! # � )U� m�n � # u)U� m�n ��~ X ! # )U� m�n ��~ !g�
Adjust thepreliminaryseasonalfactorseriesto make the12-monthtotal of seasonaladjusted
seriesto becloseto thecorrespondingtotalof unadjustedseries.
m rX�t� � �m�r
Xgt� )Uu/v �m$r
X�t��wOx # ) u �m$rX�t��wOz # .8.8. # ) u �m$r
X�t��~Oz # )OuOv �m$rX�t��~Ox
3
Page 6
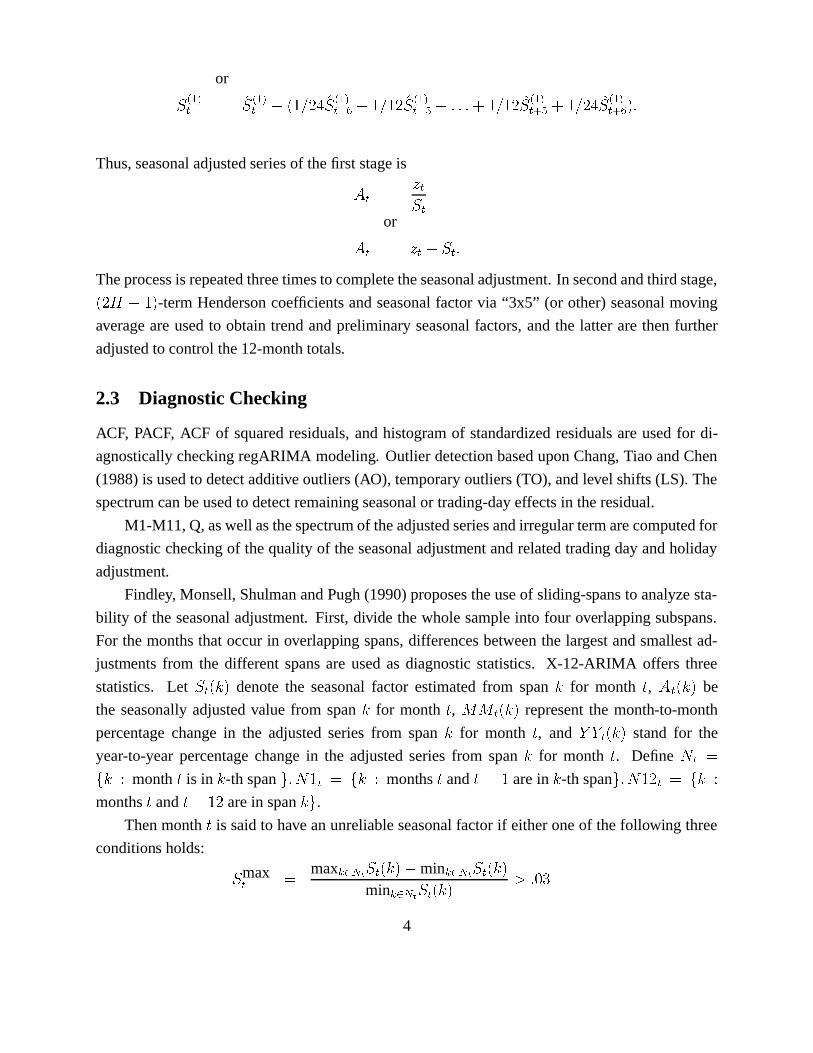
or
m$rX�t� � �m$r
Xgt� ' � )OuOv �m$rX�t��wOx # ) u �m$r
X�t��wOz # .8.8. # ) u �m$rXgt��~Uz # )OuOv �m$r
Xgt��~Ux �*.
Thus,seasonaladjustedseriesof thefirst stageis� ��� N��m �
or� ��� N�� ' m �g.Theprocessis repeatedthreetimesto completetheseasonaladjustment.In secondandthird stage,��u/� # �
-termHendersoncoefficientsandseasonalfactorvia “3x5” (or other)seasonalmoving
averageareusedto obtaintrendandpreliminaryseasonalfactors,andthe latter arethenfurther
adjustedto controlthe12-monthtotals.
2.3 Diagnostic Checking
ACF, PACF, ACF of squaredresiduals,andhistogramof standardizedresidualsareusedfor di-
agnosticallycheckingregARIMA modeling. Outlier detectionbaseduponChang,Tiao andChen
(1988)is usedto detectadditiveoutliers(AO), temporaryoutliers(TO), andlevel shifts(LS). The
spectrumcanbeusedto detectremainingseasonalor trading-dayeffectsin theresidual.
M1-M11,Q,aswell asthespectrumof theadjustedseriesandirregulartermarecomputedfor
diagnostic checkingof thequality of theseasonaladjustmentandrelatedtradingdayandholiday
adjustment.
Findley, Monsell,ShulmanandPugh(1990)proposestheuseof sliding-spansto analyzesta-
bility of theseasonaladjustment. First, divide thewholesampleinto four overlappingsubspans.
For themonthsthatoccurin overlapping spans,differencesbetweenthe largestandsmallestad-
justmentsfrom the different spansare usedas diagnostic statistics. X-12-ARIMA offers three
statistics. Let m �;����� denotethe seasonalfactor estimatedfrom span�
for month�,� �;�����
be
the seasonallyadjustedvaluefrom span�
for month�, ��� ������� representthe month-to-month
percentagechangein the adjustedseriesfrom span�
for month�, and
�3���������standfor the
year-to-yearpercentagechangein the adjustedseriesfrom span�
for month�. Define � ���
b � o month�
is in�-th span
f � � �s� b � o months�
and� '
arein�-th span
f � � uU��� b � omonths
�and
� ' uarein span
�Mf.
Thenmonth�
is saidto have anunreliableseasonalfactorif eitheroneof thefollowing three
conditions holds:
m max� � max�8������m �;����� ' min�8������m �;�����min�8������m �����M� � .�- �
4
Page 7
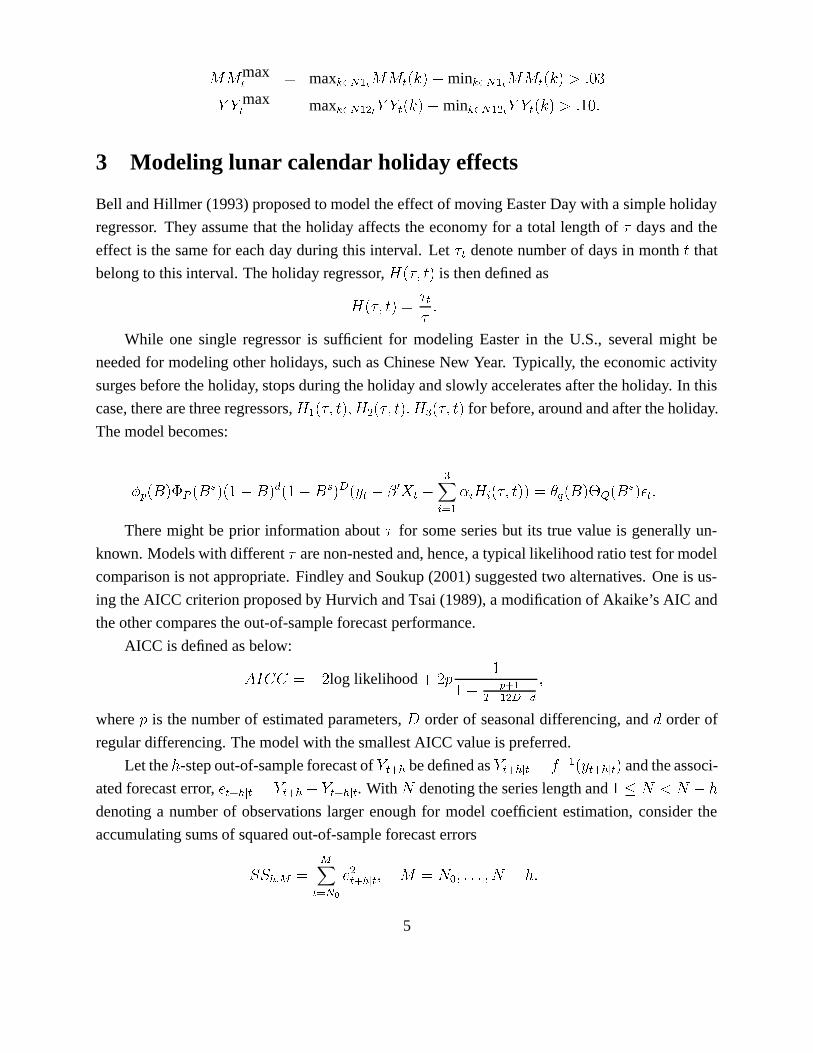
��� max� �max�8��� X ����� �p���M� ' min�8��� X ����� ������� � .�- ��3� max� �max�8��� X ! � �3�������M� ' min�|�;� X ! � ���"�;����� � . -.
3 Modeling lunar calendar holiday effects
Bell andHillmer (1993)proposedto modeltheeffectof movingEasterDaywith asimpleholiday
regressor. They assumethat theholidayaffectstheeconomyfor a total lengthof � daysandthe
effect is thesamefor eachdayduringthis interval. Let � � denotenumberof daysin month�
that
belongto this interval. Theholidayregressor,��� � �c� � is thendefinedas
��� � �c� � � � ��.
While one single regressoris sufficient for modeling Easterin the U.S., several might be
neededfor modelingotherholidays,suchasChineseNew Year. Typically, theeconomicactivity
surgesbeforetheholiday, stopsduringtheholidayandslowly acceleratesaftertheholiday. In this
case,therearethreeregressors,� X � � �c� � � � ! � � ��� � � � �
� � �c� � for before,aroundandaftertheholiday.
Themodelbecomes:
0�1 ��23�*4�5���276��8� ' 2���9:� ' 276��=<>� � � '@?�ACB � ' �_a` X�¡ _ � _ � � �c� �*���¢D�E��2��*FHG���276;�JI=�g.Theremight be prior informationabout� for someseriesbut its true valueis generallyun-
known. Modelswith different� arenon-nestedand,hence,a typical likelihoodratio testfor model
comparisonis not appropriate.Findley andSoukup(2001)suggestedtwo alternatives. Oneis us-
ing theAICC criterionproposedby HurvichandTsai(1989),a modificationof Akaike’sAIC and
theothercomparestheout-of-sample forecastperformance.
AICC is definedasbelow:� n:£¤£ � ' u
log likelihood# u R
' 1 ~ X¥ w X ! < w 9�
whereR is thenumberof estimatedparameters,�
orderof seasonaldifferencing,and ¦ orderof
regulardifferencing.Themodelwith thesmallestAICC valueis preferred.
Let the § -stepout-of-sampleforecastof�¨�y~/©
bedefinedas�"��~O©«ª �¬�¢� w X � � ��~O©«ª ��� andtheassoci-
atedforecasterror, �y~/©«ª � ���"��~/© ' � ��~O©«ª �. With � denotingtheserieslengthand
�� �]®¢� ' §denotinga numberof observations larger enoughfor modelcoefficient estimation, considerthe
accumulatingsumsof squaredout-of-sampleforecasterrors
m�m ©U¯ °\� °� ` ��±
! ��~/©«ª � � � � �H² � .8.8. � � ' § .
5
Page 8
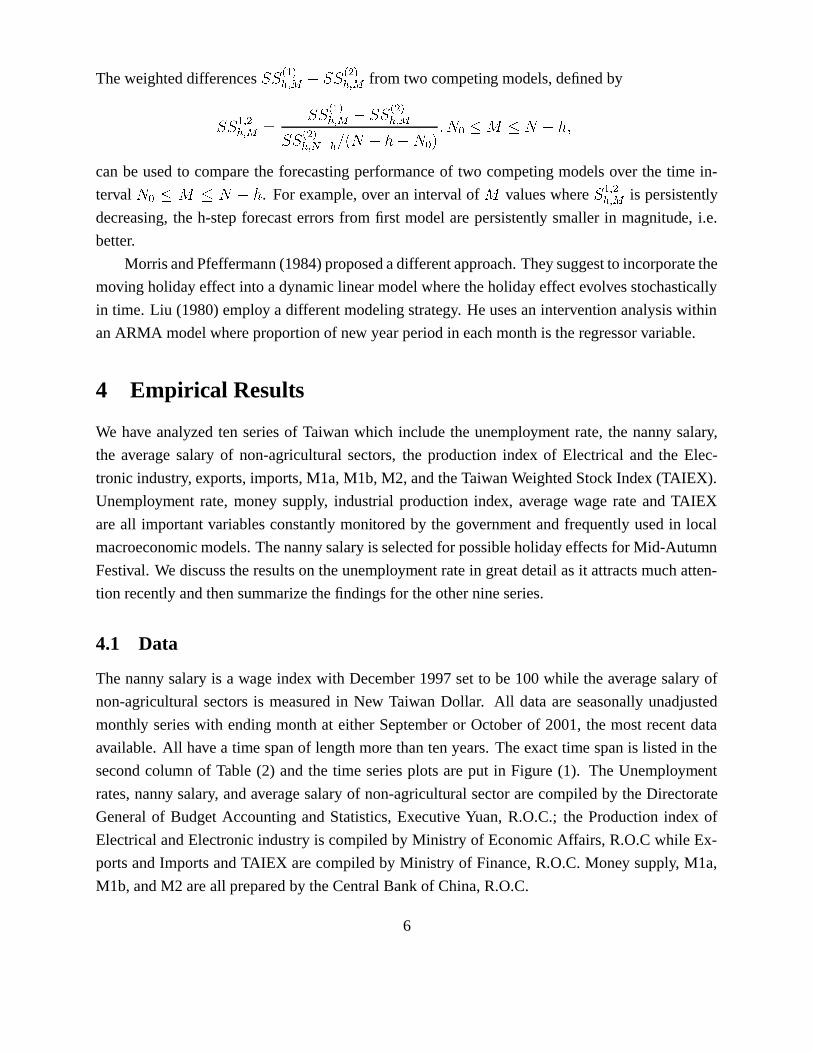
Theweighteddifferencesm�m rX�t©U¯ ° ' m�m r !
t©«¯ °from two competing models,definedby
m$mX ¯ !©«¯ ° � m$m r
Xgt©«¯ ° ' m�m r !t©U¯ °
m�m$r !t©U¯ � w/© )�� � ' § ' �Q² �
� �P² � � � � ' § �
canbe usedto comparethe forecastingperformanceof two competingmodelsover the time in-
terval �P² � � � � ' § . For example,over an interval of � valueswhere m X ¯ !©«¯ ° is persistently
decreasing,the h-stepforecasterrorsfrom first modelarepersistently smallerin magnitude, i.e.
better.
MorrisandPfeffermann(1984)proposedadifferentapproach.They suggestto incorporatethe
movingholidayeffect into adynamiclinearmodelwheretheholidayeffectevolvesstochastically
in time. Liu (1980)employ a differentmodelingstrategy. He usesanintervention analysiswithin
anARMA modelwhereproportionof new yearperiodin eachmonthis theregressorvariable.
4 Empirical Results
We have analyzedten seriesof Taiwan which includethe unemployment rate,the nanny salary,
the averagesalaryof non-agriculturalsectors,the productionindex of Electrical and the Elec-
tronic industry, exports,imports,M1a,M1b, M2, andtheTaiwanWeightedStockIndex (TAIEX).
Unemployment rate,money supply, industrial productionindex, averagewagerateandTAIEX
areall importantvariablesconstantlymonitoredby the government andfrequentlyusedin local
macroeconomicmodels.Thenanny salaryis selectedfor possibleholidayeffectsfor Mid-Autumn
Festival. We discusstheresultson theunemploymentratein greatdetailasit attractsmuchatten-
tion recentlyandthensummarizethefindingsfor theothernineseries.
4.1 Data
Thenanny salaryis a wageindex with December1997setto be100while theaveragesalaryof
non-agriculturalsectorsis measuredin New Taiwan Dollar. All dataareseasonallyunadjusted
monthly serieswith endingmonthat eitherSeptemberor Octoberof 2001,the mostrecentdata
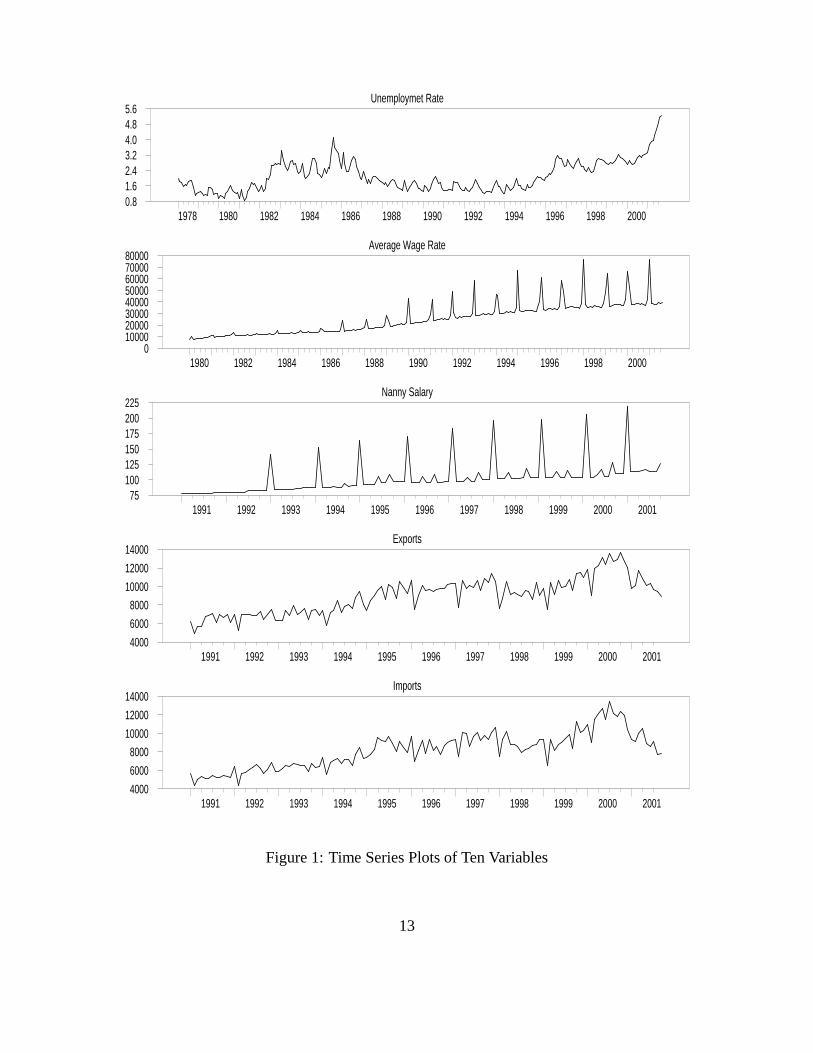
available.All have a time spanof lengthmorethantenyears.Theexact time spanis listedin the
secondcolumnof Table(2) andthe time seriesplots areput in Figure(1). The Unemployment
rates,nanny salary, andaveragesalaryof non-agricultural sectorarecompiledby theDirectorate
Generalof BudgetAccountingandStatistics,Executive Yuan,R.O.C.; the Productionindex of
ElectricalandElectronicindustryis compiledby Ministry of EconomicAffairs,R.O.Cwhile Ex-
portsandImportsandTAIEX arecompiledby Ministry of Finance,R.O.C.Money supply, M1a,
M1b, andM2 areall preparedby theCentralBankof China,R.O.C.
6
Page 9
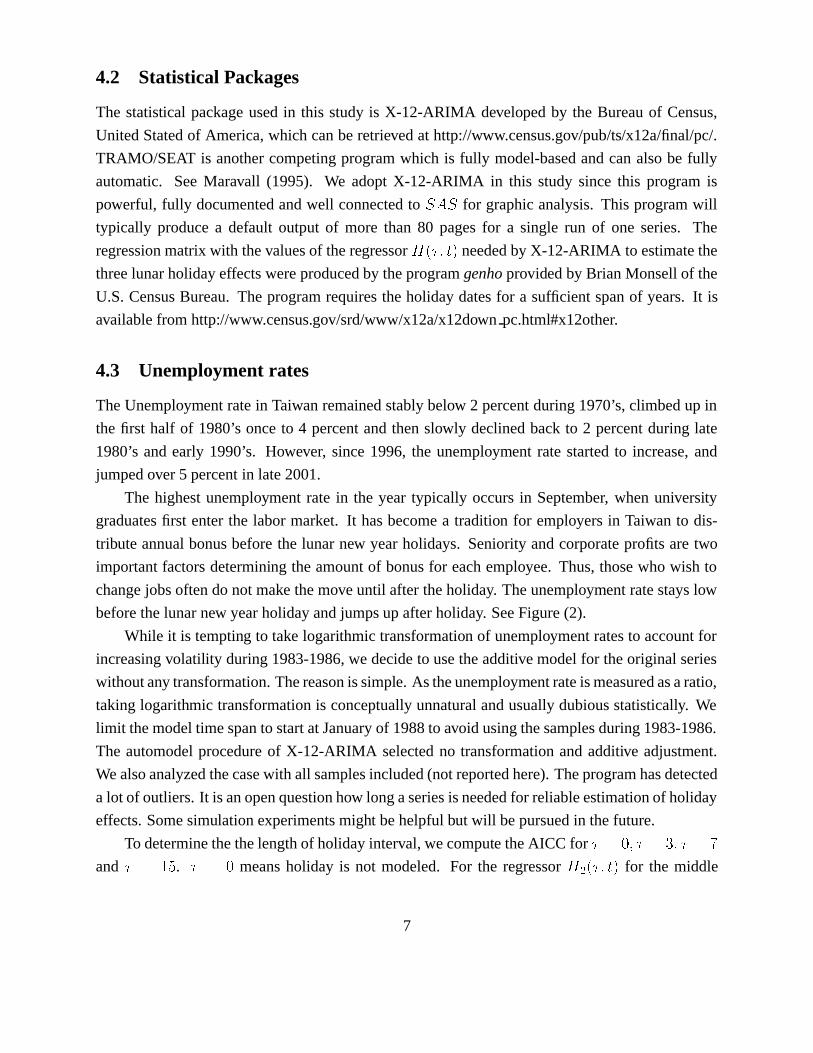
4.2 Statistical Packages
The statistical packageusedin this studyis X-12-ARIMA developedby the Bureauof Census,
UnitedStatedof America,which canberetrievedat http://www.census.gov/pub/ts/x12a/final/pc/.
TRAMO/SEAT is anothercompetingprogramwhich is fully model-basedandcanalsobe fully
automatic. SeeMaravall (1995). We adoptX-12-ARIMA in this study sincethis programis
powerful, fully documentedandwell connectedto m � m for graphicanalysis.This programwill
typically producea default output of more than 80 pagesfor a single run of one series. The
regressionmatrixwith thevaluesof theregressor��� � �c� � neededby X-12-ARIMA to estimatethe
threelunarholidayeffectswereproducedby theprogramgenho providedby BrianMonsellof the
U.S. CensusBureau.The programrequirestheholidaydatesfor a sufficient spanof years. It is
availablefrom http://www.census.gov/srd/www/x12a/x12down pc.html#x12other.
4.3 Unemployment rates
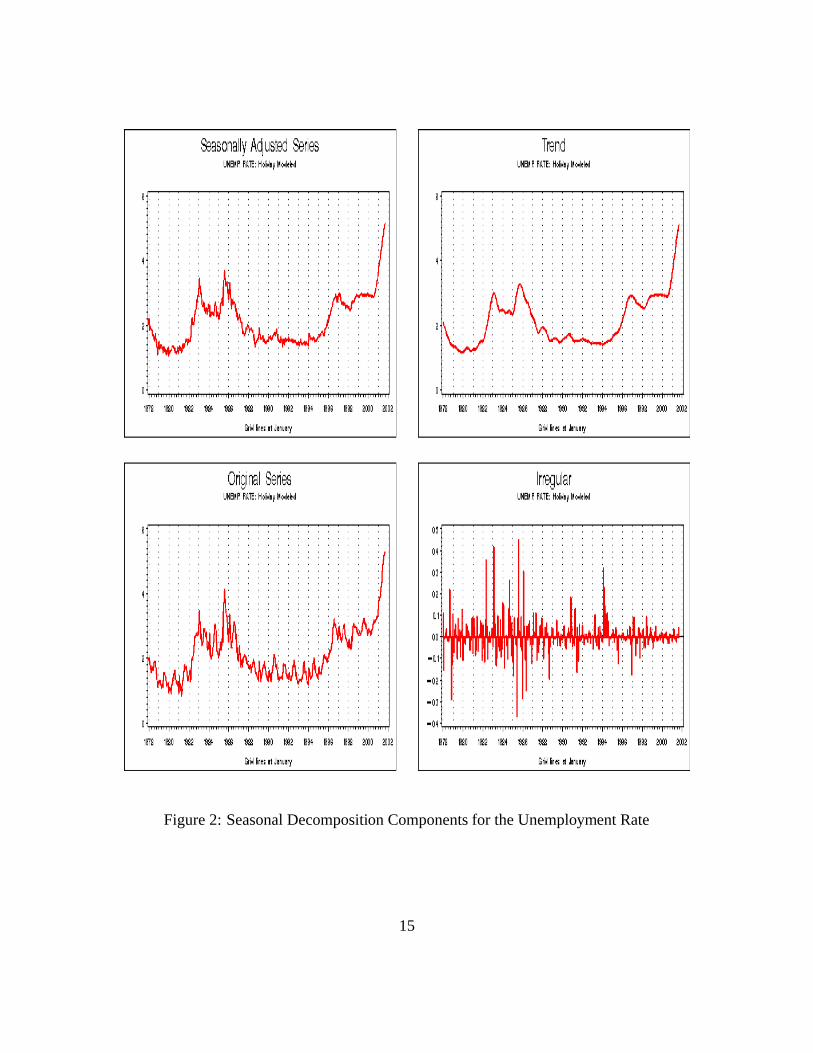
TheUnemploymentratein Taiwanremainedstablybelow 2 percentduring1970’s,climbedup in
the first half of 1980’s onceto 4 percentandthenslowly declinedbackto 2 percentduring late
1980’s andearly 1990’s. However, since1996, the unemployment ratestartedto increase,and
jumpedover5 percentin late2001.
The highestunemployment rate in the year typically occursin September, whenuniversity
graduatesfirst enterthe labor market. It hasbecomea tradition for employersin Taiwan to dis-
tributeannualbonusbeforethe lunar new yearholidays. Seniorityandcorporateprofitsaretwo
importantfactorsdetermining theamountof bonusfor eachemployee. Thus,thosewho wish to
changejobsoftendonotmake themoveuntil aftertheholiday. Theunemploymentratestayslow
beforethelunarnew yearholidayandjumpsupafterholiday. SeeFigure(2).
While it is tempting to take logarithmic transformation of unemploymentratesto accountfor
increasingvolatility during1983-1986,we decideto usetheadditivemodelfor theoriginal series
withoutany transformation.Thereasonissimple. As theunemploymentrateismeasuredasaratio,
taking logarithmic transformationis conceptuallyunnaturalandusuallydubiousstatistically. We
limit themodeltimespanto startatJanuaryof 1988to avoid usingthesamplesduring1983-1986.
The automodelprocedureof X-12-ARIMA selectedno transformationandadditive adjustment.
Wealsoanalyzedthecasewith all samplesincluded(notreportedhere).Theprogramhasdetected
alot of outliers.It is anopenquestionhow longaseriesis neededfor reliableestimationof holiday
effects.Somesimulationexperimentsmight behelpfulbut will bepursuedin thefuture.
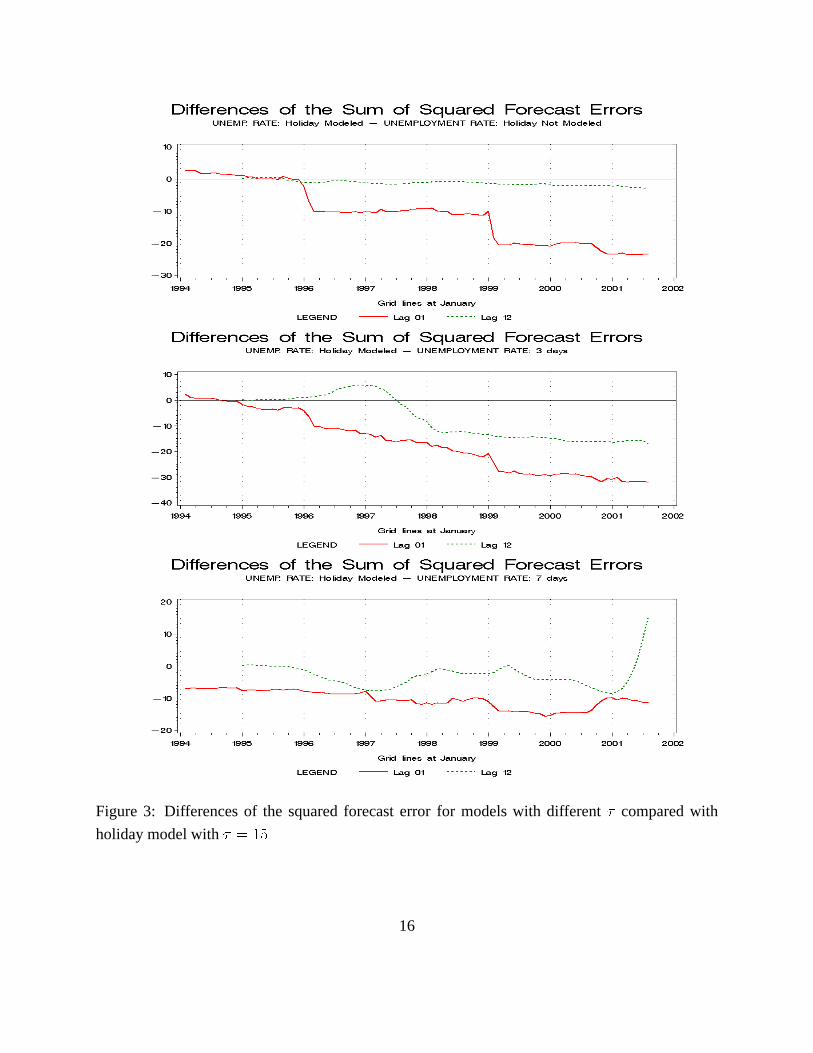
To determinethethelengthof holidayinterval,wecompute theAICC for � ��- � � � � � � � and � � p³
. � �´-meansholiday is not modeled. For the regressor
� ! � � ��� � for the middle
7
Page 10
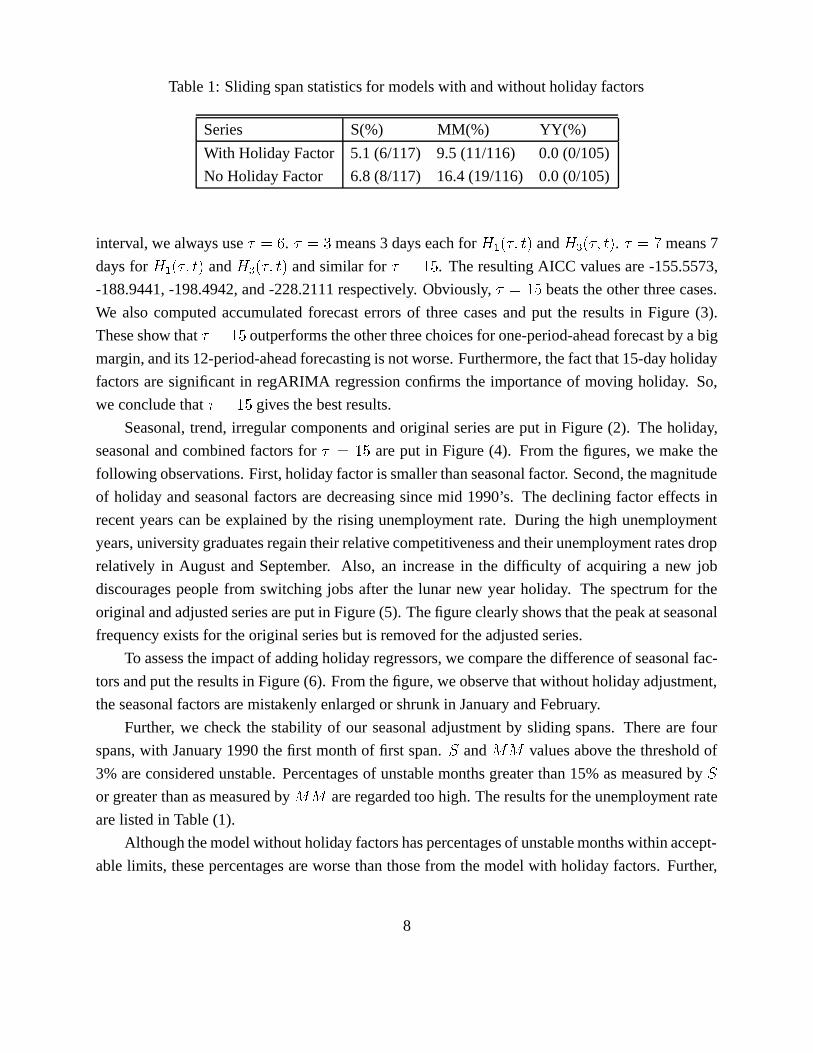
Table1: Slidingspanstatisticsfor modelswith andwithoutholidayfactors
Series S(%) MM(%) YY(%)
With HolidayFactor 5.1(6/117) 9.5(11/116) 0.0(0/105)
No HolidayFactor 6.8(8/117) 16.4(19/116) 0.0(0/105)
interval, wealwaysuse� �¢µ. � � � means3 dayseachfor
� X � � �c� � and��� � �c� � . � �
means7
daysfor� X � � ��� � and
��� � �c� � andsimilar for � � p³
. TheresultingAICC valuesare-155.5573,
-188.9441,-198.4942,and-228.2111respectively. Obviously, � � p³beatstheotherthreecases.
We alsocomputedaccumulatedforecasterrorsof threecasesandput the resultsin Figure (3).
Theseshow that � � p³outperformstheotherthreechoicesfor one-period-aheadforecastby abig
margin,andits 12-period-aheadforecastingis notworse.Furthermore,thefactthat15-dayholiday
factorsaresignificantin regARIMA regressionconfirmsthe importanceof moving holiday. So,
weconcludethat � � p³givesthebestresults.
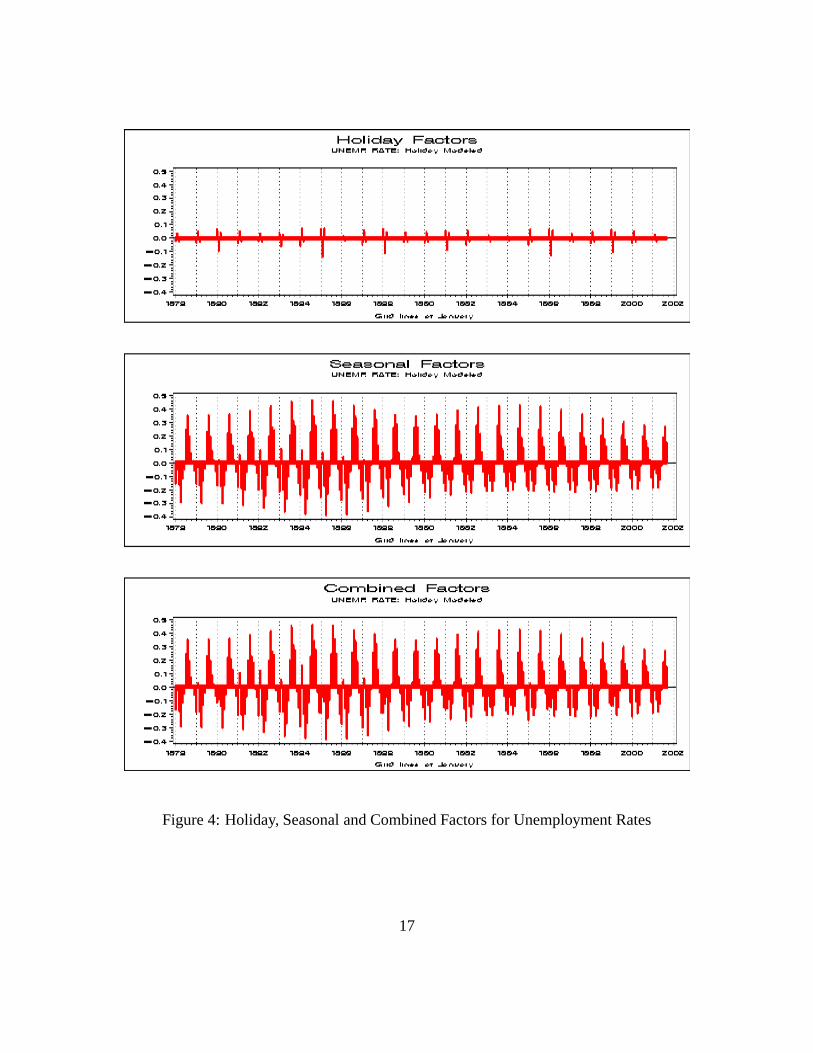
Seasonal,trend,irregularcomponents andoriginal seriesareput in Figure(2). Theholiday,
seasonalandcombinedfactorsfor � � �³areput in Figure(4). From the figures,we make the
followingobservations. First,holidayfactoris smallerthanseasonalfactor. Second,themagnitude
of holiday andseasonalfactorsaredecreasingsincemid 1990’s. The decliningfactoreffectsin
recentyearscanbe explained by the rising unemployment rate. During the high unemployment
years,university graduatesregaintheirrelativecompetitivenessandtheirunemploymentratesdrop
relatively in AugustandSeptember. Also, an increasein the difficulty of acquiringa new job
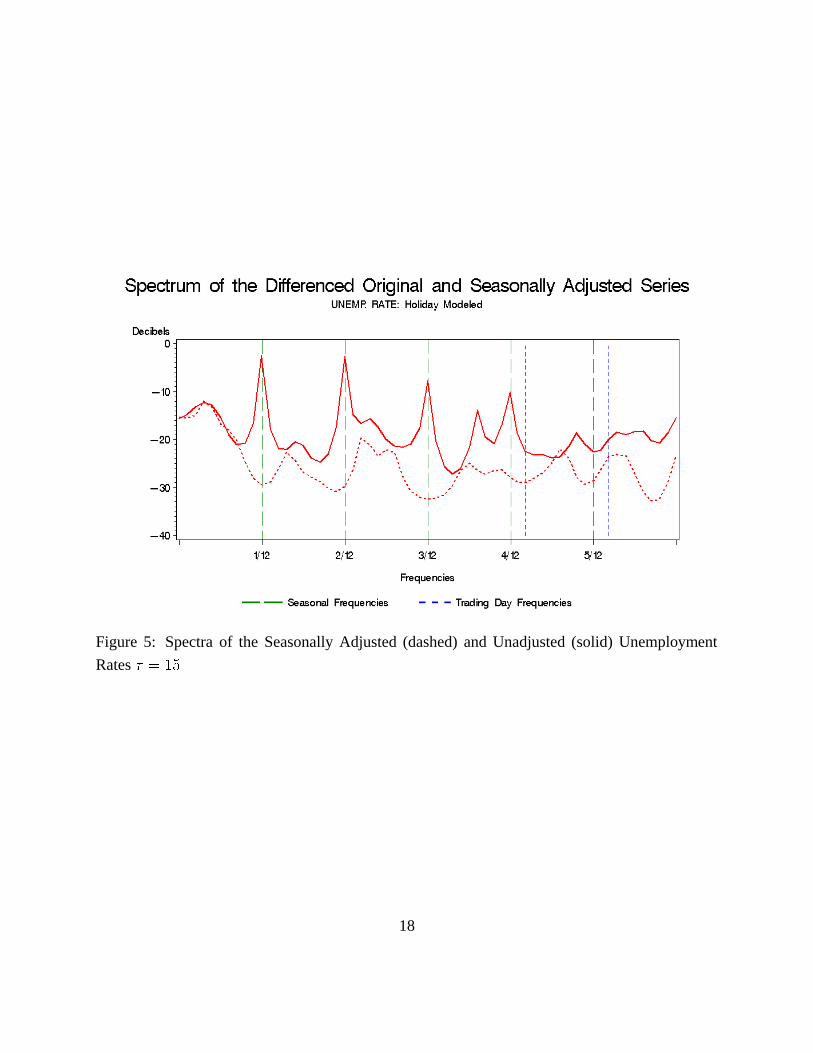
discouragespeoplefrom switchingjobs after the lunar new yearholiday. The spectrumfor the
originalandadjustedseriesareput in Figure(5). Thefigureclearlyshowsthatthepeakatseasonal
frequency exists for theoriginalseriesbut is removedfor theadjustedseries.
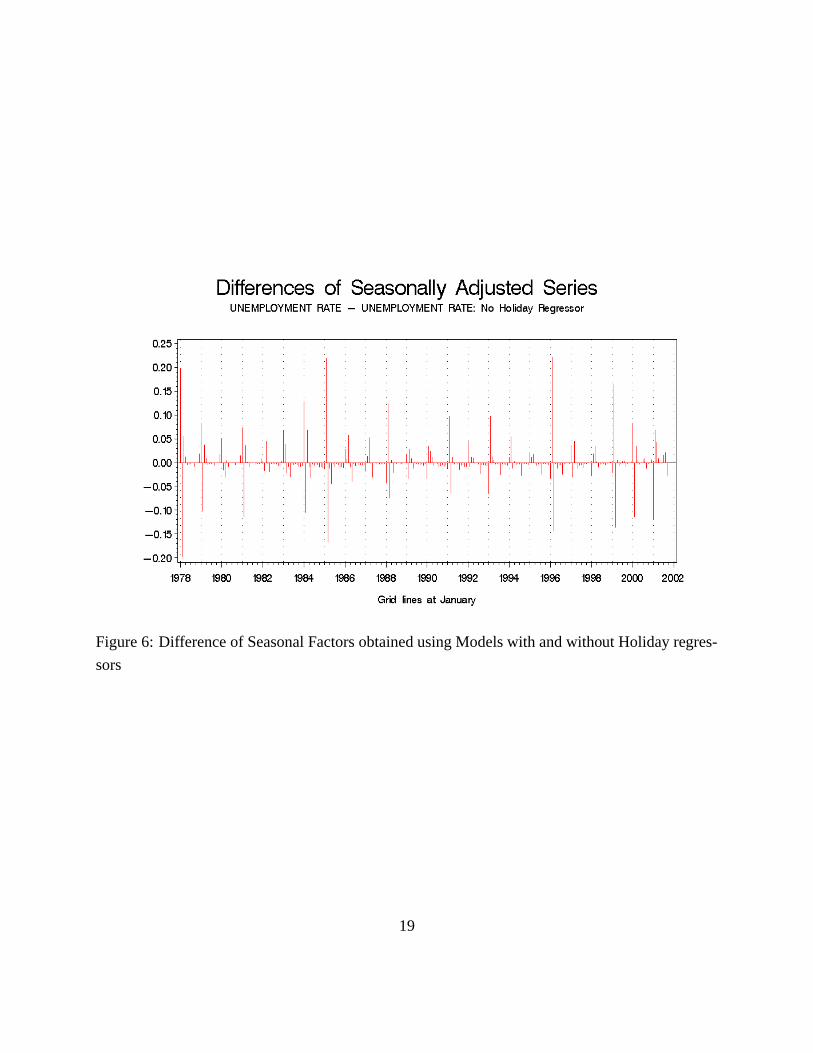
To assesstheimpactof addingholidayregressors,wecomparethedifferenceof seasonalfac-
torsandput theresultsin Figure(6). Fromthefigure,weobserve thatwithoutholidayadjustment,
theseasonalfactorsaremistakenlyenlargedor shrunkin JanuaryandFebruary.
Further, we checkthe stability of our seasonaladjustmentby sliding spans.Thereare four
spans,with January1990thefirst monthof first span. m and ��� valuesabove the thresholdof
3% areconsideredunstable.Percentagesof unstablemonthsgreaterthan15%asmeasuredby mor greaterthanasmeasuredby ��� areregardedtoohigh. Theresultsfor theunemploymentrate
arelistedin Table(1).
Althoughthemodelwithout holidayfactorshaspercentagesof unstablemonthswithin accept-
ablelimits, thesepercentagesareworsethanthosefrom themodelwith holidayfactors.Further,
8
Page 11
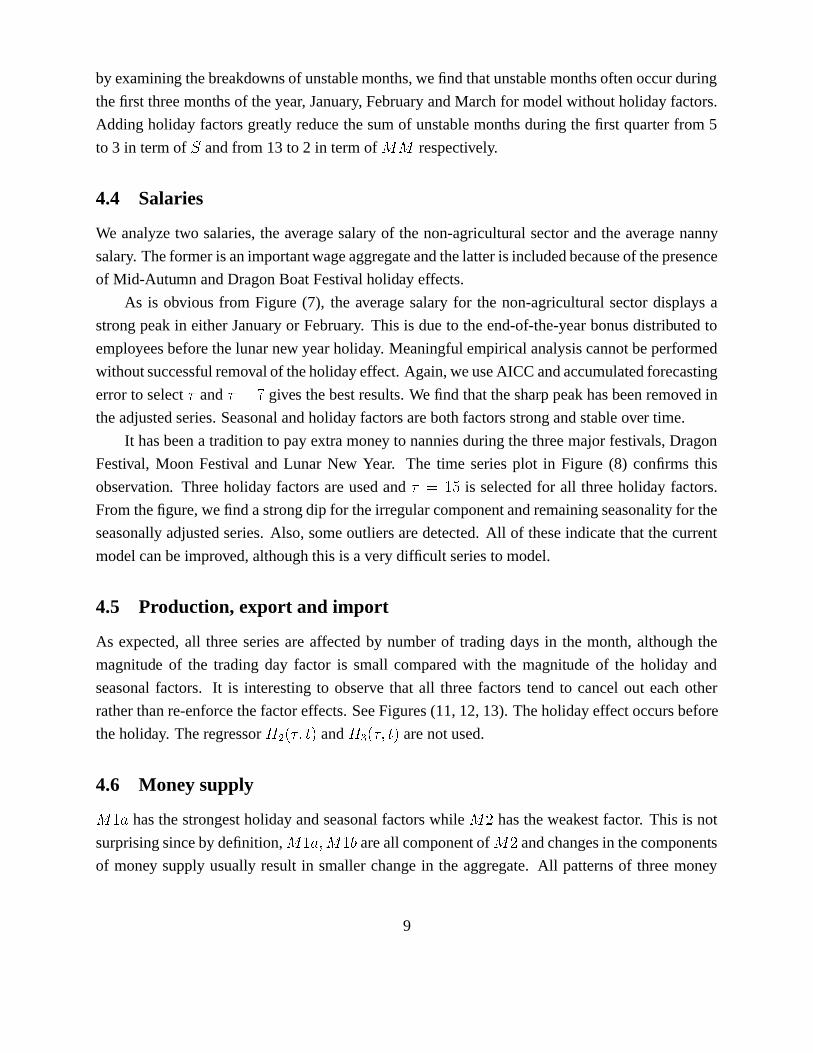
by examining thebreakdownsof unstablemonths,wefind thatunstablemonthsoftenoccurduring
thefirst threemonthsof theyear, January, FebruaryandMarchfor modelwithoutholidayfactors.
Adding holiday factorsgreatlyreducethesumof unstablemonthsduringthefirst quarterfrom 5
to 3 in termof m andfrom 13 to 2 in termof ��� respectively.
4.4 Salaries
We analyzetwo salaries,the averagesalaryof the non-agricultural sectorandtheaveragenanny
salary. Theformeris animportantwageaggregateandthelatteris includedbecauseof thepresence
of Mid-Autumn andDragonBoatFestival holidayeffects.
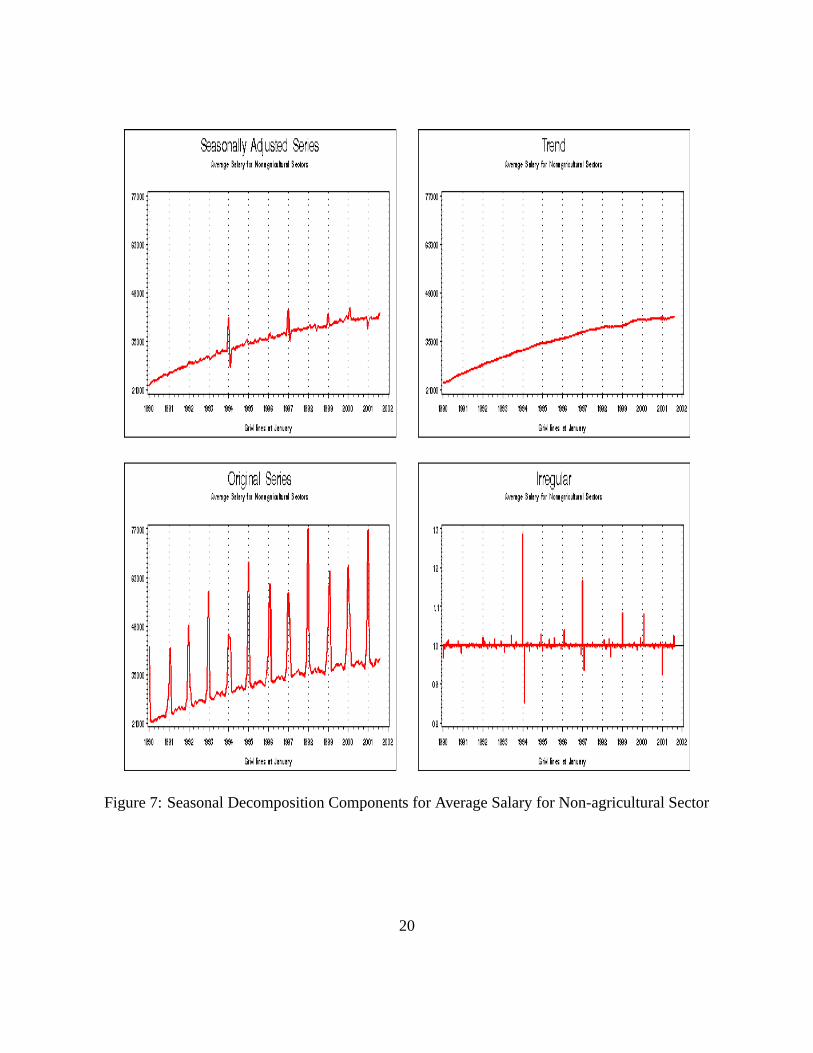
As is obvious from Figure(7), the averagesalaryfor the non-agriculturalsectordisplaysa
strongpeakin eitherJanuaryor February. This is dueto theend-of-the-yearbonusdistributedto
employeesbeforethelunarnew yearholiday. Meaningfulempiricalanalysiscannotbeperformed
withoutsuccessfulremovalof theholidayeffect. Again,weuseAICC andaccumulatedforecasting
errorto select� and � � gives thebestresults.We find thatthesharppeakhasbeenremovedin
theadjustedseries.Seasonalandholidayfactorsarebothfactorsstrongandstableover time.
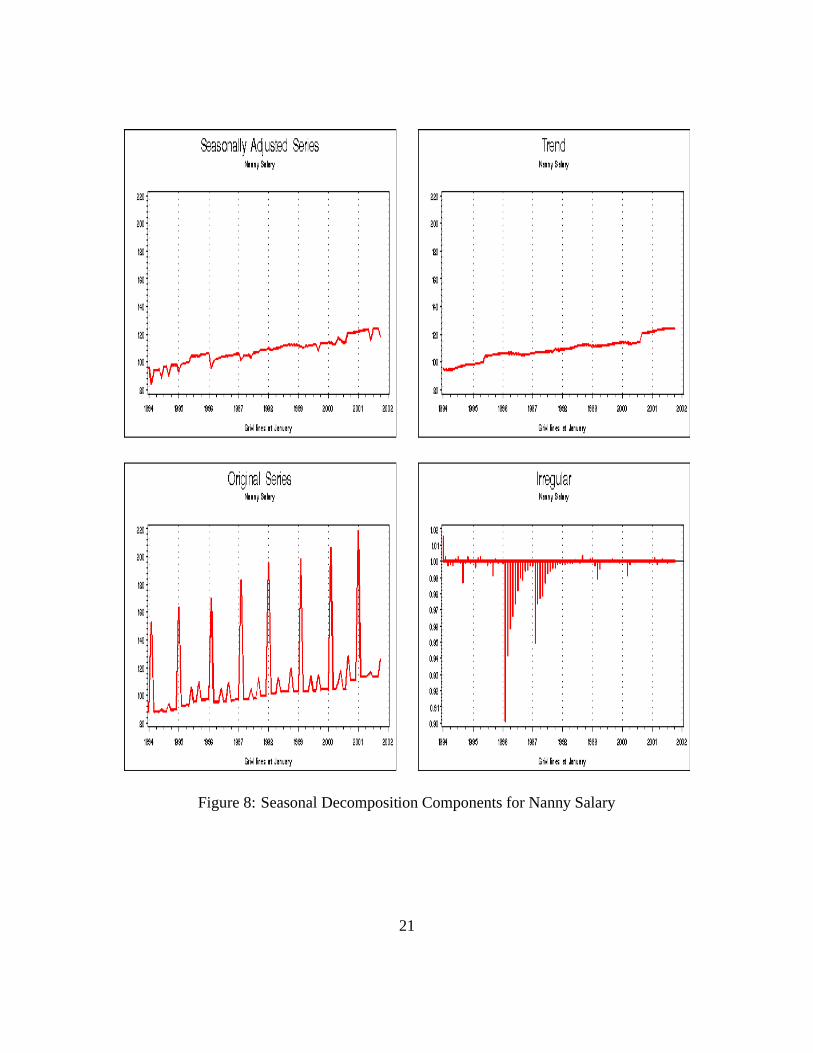
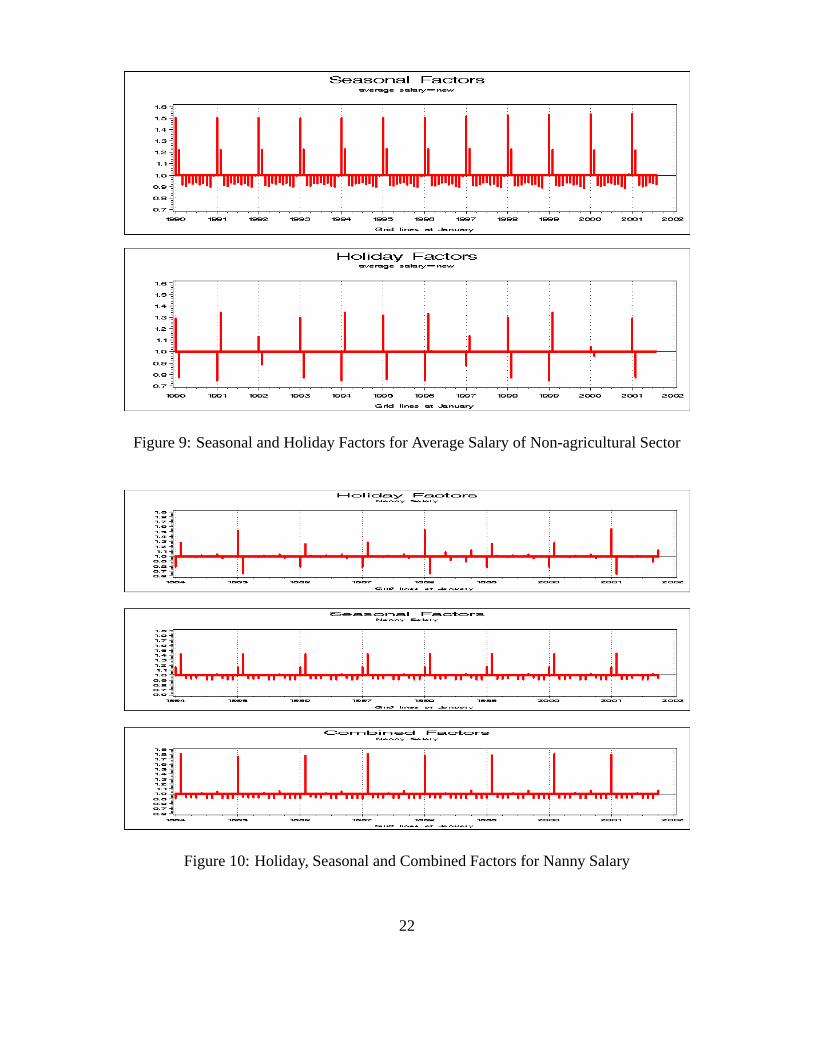
It hasbeena traditionto payextra money to nanniesduringthethreemajorfestivals,Dragon
Festival, Moon Festival and Lunar New Year. The time seriesplot in Figure (8) confirmsthis
observation. Threeholiday factorsareusedand � � p³is selectedfor all threeholiday factors.
Fromthefigure,wefind astrongdip for theirregularcomponentandremainingseasonalityfor the
seasonallyadjustedseries.Also, someoutliersaredetected.All of theseindicatethat thecurrent
modelcanbeimproved,althoughthis is averydifficult seriesto model.
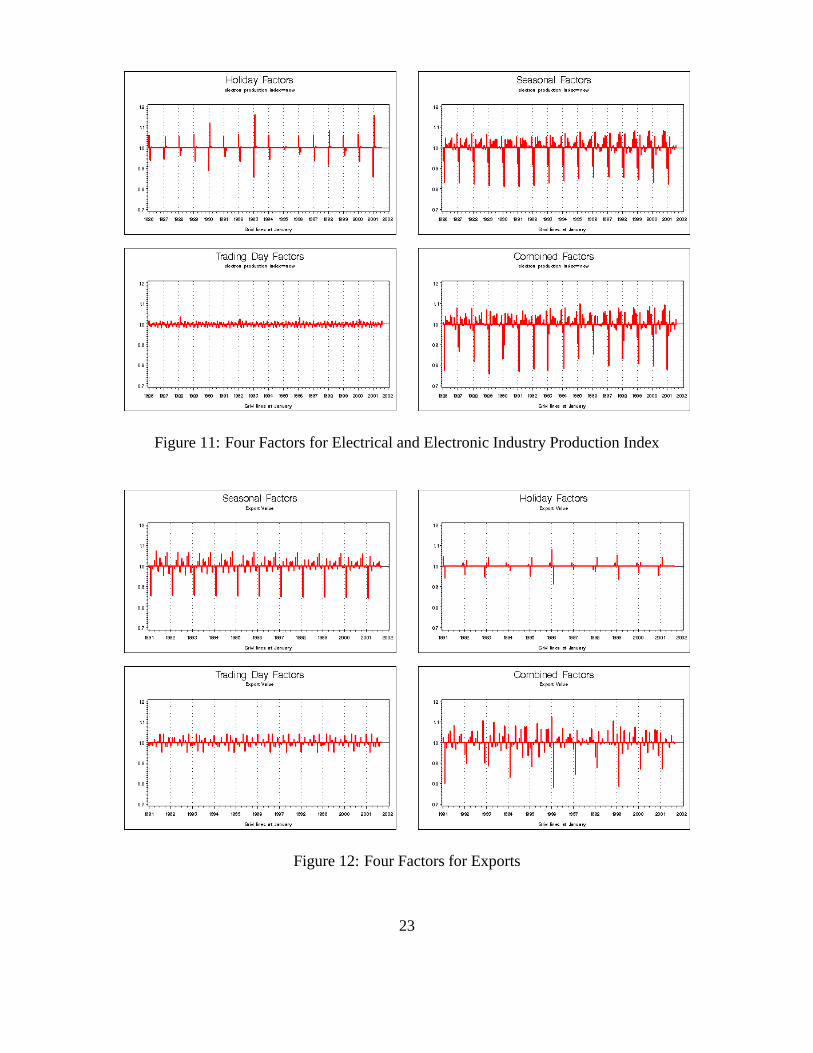
4.5 Production, export and import
As expected,all threeseriesareaffectedby numberof tradingdaysin the month,althoughthe
magnitude of the trading day factor is small comparedwith the magnitude of the holiday and
seasonalfactors. It is interestingto observe that all threefactorstend to cancelout eachother
ratherthanre-enforcethefactoreffects.SeeFigures(11,12,13). Theholidayeffectoccursbefore
theholiday. Theregressor� ! � � �c� � and
��� � ��� � arenotused.
4.6 Money supply
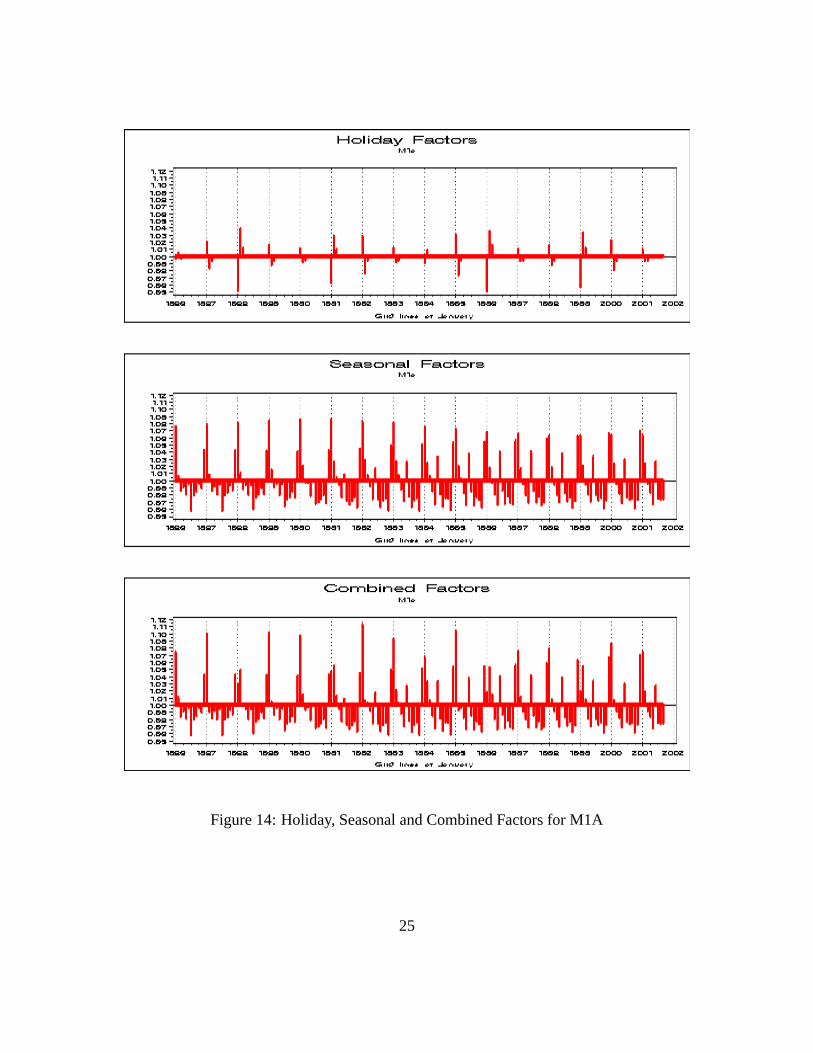
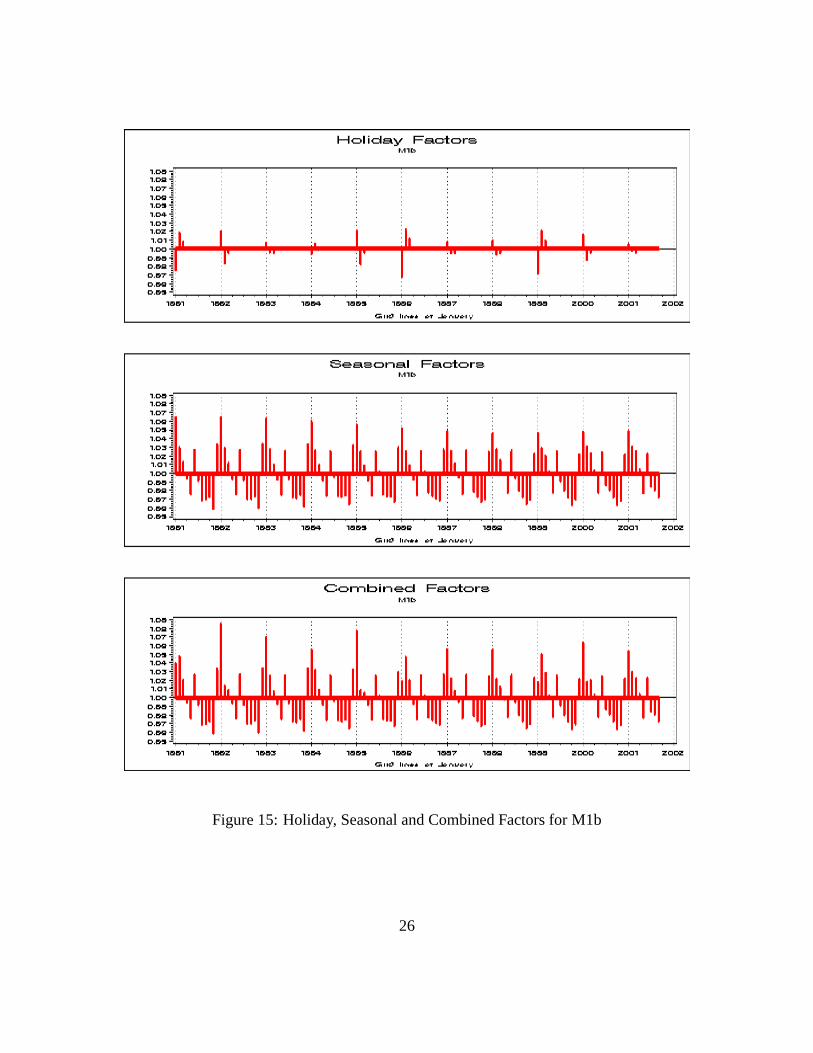
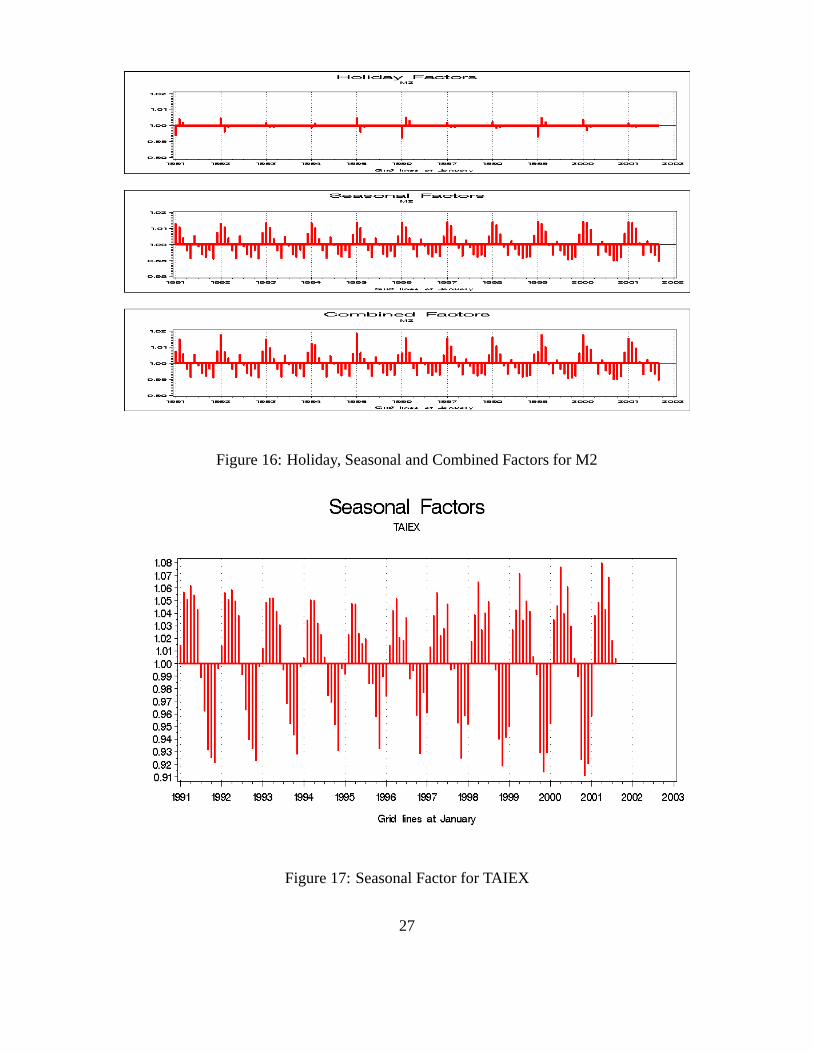
� W¶hasthestrongestholidayandseasonalfactorswhile � u
hastheweakestfactor. This is not
surprisingsinceby definition, � p¶"� � p·areall componentof � u
andchangesin thecomponents
of money supplyusuallyresult in smallerchangein the aggregate. All patternsof threemoney
9
Page 12
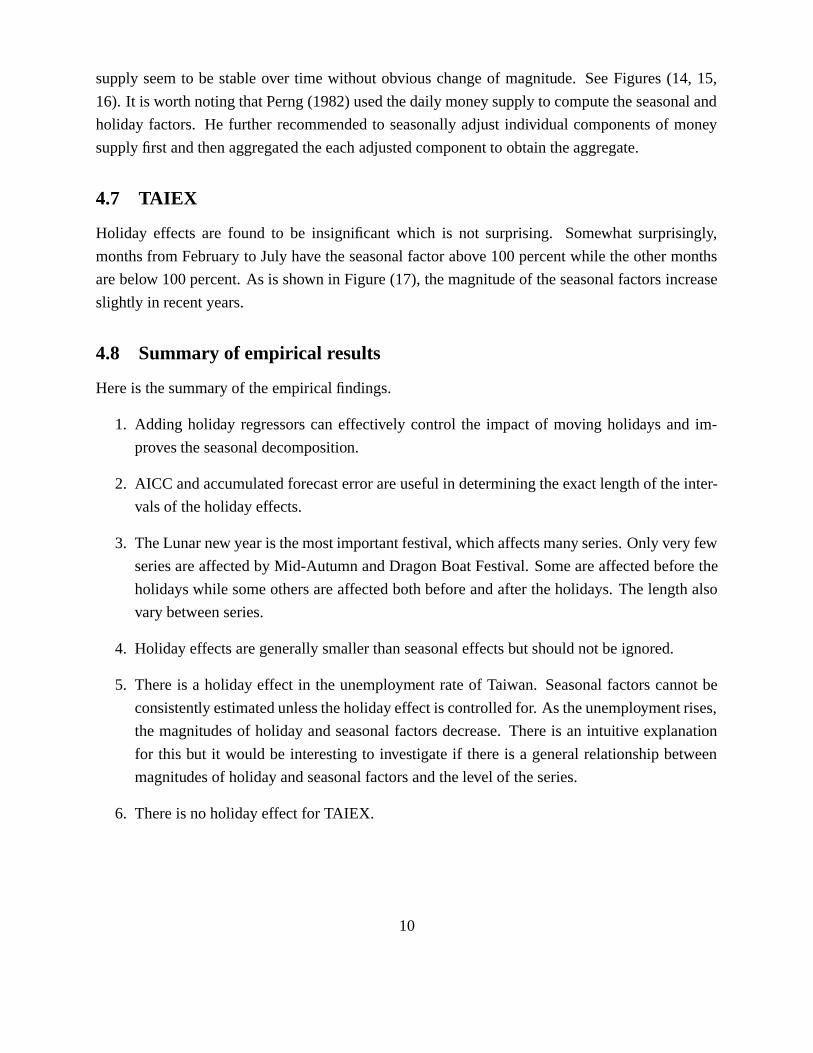
supplyseemto be stableover time without obviouschangeof magnitude. SeeFigures(14, 15,
16). It is worthnotingthatPerng(1982)usedthedaily money supplyto computetheseasonaland
holiday factors. He further recommendedto seasonallyadjustindividual componentsof money
supplyfirst andthenaggregatedtheeachadjustedcomponentto obtaintheaggregate.
4.7 TAIEX
Holiday effects are found to be insignificant which is not surprising. Somewhat surprisingly,
monthsfrom Februaryto July have theseasonalfactorabove 100percentwhile theothermonths
arebelow 100percent.As is shown in Figure(17), themagnitudeof theseasonalfactorsincrease
slightly in recentyears.
4.8 Summary of empirical results
Hereis thesummaryof theempiricalfindings.
1. Adding holiday regressorscaneffectively control the impactof moving holidaysand im-
provestheseasonaldecomposition.
2. AICC andaccumulatedforecasterrorareusefulin determiningtheexactlengthof theinter-
valsof theholidayeffects.
3. TheLunarnew yearis themostimportantfestival,whichaffectsmany series.Only veryfew
seriesareaffectedby Mid-AutumnandDragonBoatFestival. Someareaffectedbeforethe
holidayswhile someothersareaffectedbothbeforeandafter theholidays.Thelengthalso
varybetweenseries.
4. Holidayeffectsaregenerallysmallerthanseasonaleffectsbut shouldnotbeignored.
5. Thereis a holidayeffect in the unemployment rateof Taiwan. Seasonalfactorscannotbe
consistently estimatedunlesstheholidayeffect is controlledfor. As theunemploymentrises,
the magnitudesof holidayandseasonalfactorsdecrease.Thereis an intuitive explanation
for this but it would be interestingto investigateif thereis a generalrelationshipbetween
magnitudesof holidayandseasonalfactorsandthelevel of theseries.
6. Thereis noholidayeffect for TAIEX.
10
Page 13
5 Conclusions
In this study, we have modeledthe impactof moving lunar new yearandotherholidayson ten
selectedseriesin Taiwan by using the holiday regressors.This regressorsmeasurethe length
of theperiodbefore,aroundandafter theholiday in eachmonth. Our analysisshow thatadding
holidayregressorscaneffectively controltheimpactof movingholidaysandimprovestheseasonal
decomposition. AICC andaccumulatedforecasterror areuseful in determiningthe numberand
exactlengthof holidayfactors.
11
Page 14
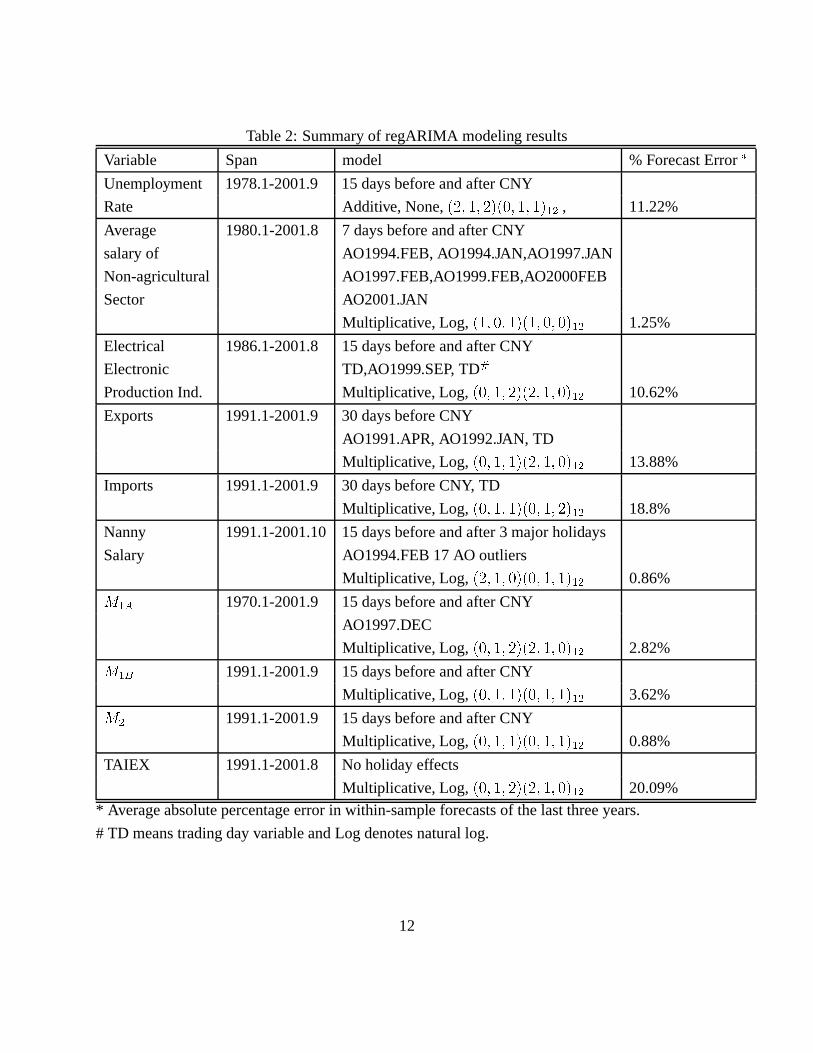
Table2: Summaryof regARIMA modeling results
Variable Span model % ForecastError ¸Unemployment 1978.1-2001.9 15daysbeforeandafterCNY
Rate Additive,None,��u �/W� uO�|�y- �p� � X ! , 11.22%
Average 1980.1-2001.8 7 daysbeforeandafterCNY
salaryof AO1994.FEB,AO1994.JAN,AO1997.JAN
Non-agricultural AO1997.FEB,AO1999.FEB,AO2000FEB
Sector AO2001.JAN
Multiplicative,Log,� p� - � �|� W� - � -/� X ! 1.25%
Electrical 1986.1-2001.8 15daysbeforeandafterCNY
Electronic TD,AO1999.SEP, TD ¹ProductionInd. Multiplicative,Log,
��- �W� u/�8��u �/W� -O� X ! 10.62%
Exports 1991.1-2001.9 30daysbeforeCNY
AO1991.APR,AO1992.JAN, TD
Multiplicative,Log,��- �W� �|�yu �p� -/� X ! 13.88%
Imports 1991.1-2001.9 30daysbeforeCNY, TD
Multiplicative,Log,��- �W� �|�y- �p� u/� X ! 18.8%
Nanny 1991.1-2001.10 15daysbeforeandafter3 majorholidays
Salary AO1994.FEB17AO outliers
Multiplicative,Log,��u �W� -O�|�y- �p� � X ! 0.86%
� X»º 1970.1-2001.9 15daysbeforeandafterCNY
AO1997.DEC
Multiplicative,Log,��- �W� uO�|�yu �p� -/� X ! 2.82%
� X»¼ 1991.1-2001.9 15daysbeforeandafterCNY
Multiplicative,Log,��- �W� �|�y- �p� � X ! 3.62%
� ! 1991.1-2001.9 15daysbeforeandafterCNY
Multiplicative,Log,��- �W� �|�y- �p� � X ! 0.88%
TAIEX 1991.1-2001.8 No holidayeffects
Multiplicative,Log,��- �W� uO�|�yu �p� -/� X ! 20.09%
* Averageabsolutepercentageerrorin within-sample forecastsof thelastthreeyears.
# TD meanstradingdayvariableandLog denotesnaturallog.
12
Page 15
Unemploymet Rate
1978 1980 1982 1984 1986 1988 1990 1992 1994 1996 1998 20000.81.62.43.24.04.85.6
Average Wage Rate
1980 1982 1984 1986 1988 1990 1992 1994 1996 1998 20000
1000020000300004000050000600007000080000
Nanny Salary
1991 1992 1993 1994 1995 1996 1997 1998 1999 2000 200175
100125150175200225
Exports
1991 1992 1993 1994 1995 1996 1997 1998 1999 2000 20014000
6000
8000
10000
12000
14000
Imports
1991 1992 1993 1994 1995 1996 1997 1998 1999 2000 20014000
6000
8000
10000
12000
14000
Figure1: Time SeriesPlotsof TenVariables
13
Page 16
Industrial Production
1986 1987 1988 1989 1990 1991 1992 1993 1994 1995 1996 1997 1998 1999 2000 2001255075
100125150175200225
M1A
1970 1972 1974 1976 1978 1980 1982 1984 1986 1988 1990 1992 1994 1996 1998 20000
250000500000750000
100000012500001500000175000020000002250000
M1B
1991 1992 1993 1994 1995 1996 1997 1998 1999 2000 20011500020000250003000035000400004500050000
M2
1991 1992 1993 1994 1995 1996 1997 1998 1999 2000 2001600000800000
100000012000001400000160000018000002000000
TAIEX
1991 1992 1993 1994 1995 1996 1997 1998 1999 2000 20013000400050006000700080009000
10000
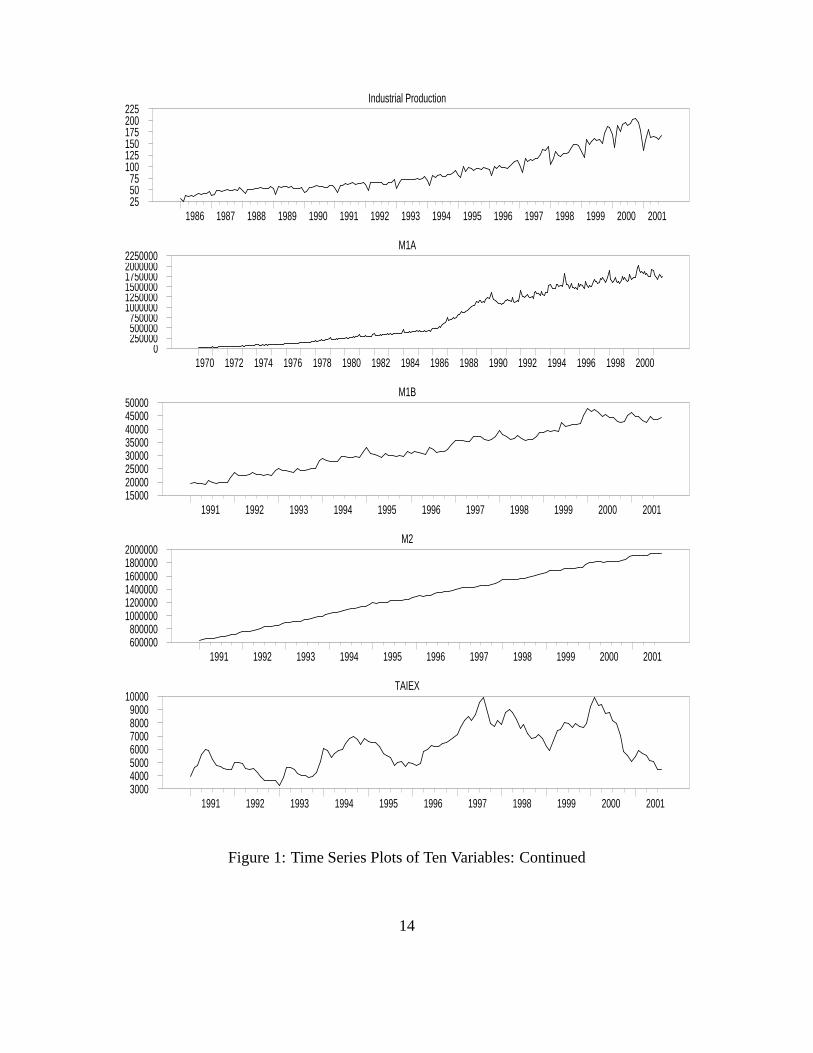
Figure1: TimeSeriesPlotsof TenVariables:Continued
14
Page 17
Figure2: SeasonalDecompositionComponentsfor theUnemploymentRate
15
Page 18
Figure 3: Differencesof the squaredforecasterror for modelswith different � comparedwith
holidaymodelwith � � �³
16
Page 19
Figure4: Holiday, SeasonalandCombinedFactorsfor UnemploymentRates
17
Page 20
Figure 5: Spectraof the SeasonallyAdjusted(dashed)and Unadjusted(solid) Unemployment
Rates� � �³
18
Page 21
Figure6: Differenceof SeasonalFactorsobtainedusingModelswith andwithout Holiday regres-
sors
19
Page 22
Figure7: SeasonalDecomposition Components for AverageSalaryfor Non-agriculturalSector
20
Page 23
Figure8: SeasonalDecomposition Componentsfor Nanny Salary
21
Page 24
Figure9: SeasonalandHolidayFactorsfor AverageSalaryof Non-agriculturalSector
Figure10: Holiday, SeasonalandCombinedFactorsfor Nanny Salary
22
Page 25
Figure11: FourFactorsfor ElectricalandElectronicIndustryProductionIndex
Figure12: FourFactorsfor Exports
23
Page 26
Figure13: FourFactorsfor Imports
24
Page 27
Figure14: Holiday, SeasonalandCombinedFactorsfor M1A
25
Page 28
Figure15: Holiday, SeasonalandCombinedFactorsfor M1b
26
Page 29
Figure16: Holiday, SeasonalandCombinedFactorsfor M2
Figure17: SeasonalFactorfor TAIEX
27
Page 30
References
[1] Bell, W. R., and Hillmer, S. C. (1983) “Modeling Time Serieswith CalendarVariation,”
Journal of the American Statistical Association, 78, 526–534.
[2] Chang,I., G. Tiao,C. Chen(1988),“Estimation of time seriesparametersin thepresenceof
outliers,” Technometrics, 30,193-204.
[3] Findley D. F.,Monsell,H. B. Shulman,andM. G.Pugh(1990),“Sliding-spansdiagnosticsfor
seasonalandrelatedadjustments,Journal of American Statistical Association, 85,345-355.
[4] Findley D. F.,Monsell,B. C.,Bell, W. R.,Otto,M. C.,andChen,B.-C.(1998),“New Capabil-
ities andMethodsof theX-12-ARIMA SeasonalAdjustmentProgram,” Journal of Business
and Economic Statistics, 16,127-177.
[5] Findley, D.F. and R. J. Soukup(2001) “Modeling and model selectionfor moving holi-
days,”2000 Proceedingsof The BusinessandEconomicStatistics Sectionof the American
StatisticalAssociation,102-107,Alexandria:AmericanStatisticalAssociation.
[6] Hurvich, C. M. and Tsay, C. L. (1989), “Regressionand Time SeriesModeling in Small
Samples,” Biometrika,76,297-307.
[7] Liu, L. (1980), “Analysisof time serieswith calendareffects,” Management Science, 26,
106-112.
[8] Morris, N.D., andD. Pfeffermann(1984), “A Kalmanfilter approachto the forecastingof
monthly seriesaffectedby moving festivals,” Journal of Time Series Analysis, 5, 255-268.
[9] Maravall, A (1995),“Unobserved components in economictime series,” in The Handbook
of Applied Econometrics, vol. 1, eds.H. Pesaran,P. SchmidtandW. Wickens,Oxford.U.K.:
BasilBlackwell,12-72.
[10] Perng,F.N. (1982),“Seasonaladjustmentof money supplyandmodelingtheof moving lunar
new yearon currency anddemanddeposit,” Quarterly Review of Central Bank of China, 4,
8-61.
[11] Soukup,R. J. , andFindley D. F. (2000),“DetectionandModeling of TradingDay Effects,”
in ICES II: Proceedingsof the SecondInternationalConferenceon Establishment Surveys
(2001),743-753,Alexandria:AmericanStatisticalAssociation.
28
Page 31
[12] Young,A. H. (1965),“Estimating tradingday variation in monthly economictime series,”
TechnicalPaper12,U.S.Departmentof Commerce,Bureauof theCensus,Washington,DC.
29