Modeling Nanoparticle Formation during Early Stages of Zeolite Growth: A Low-Coordination Lattice Model of Template Penetration L. Jin, † Scott M. Auerbach,* ,†,‡ and P. A. Monson* ,† Department of Chemical Engineering and Department of Chemistry, UniVersity of Massachusetts, Amherst, Massachusetts 01003 ReceiVed: May 14, 2010; ReVised Manuscript ReceiVed: July 20, 2010 We present an extension of the simple-cubic lattice model developed by Jorge et al. [J. Am. Chem. Soc. 2005, 127, 14388] of nanoparticle growth in the clear solution synthesis of silicalite-1 (MFI). We have implemented the model on a body-center cubic (bcc) lattice with second-neighbor repulsions, to generate a four-coordinate network that mimics the tetrahedral structure of silica. With this low-coordination lattice model we observe that the nanoparticles are metastable, possessing a core-shell structure with mostly silica in the core and templates forming a shell. Nanoparticle size is found to increase with temperature and decrease with solution pH, in qualitative agreement with results from experiment and the previous lattice model study. The low-coordination model makes it possible to model porosity in the silica core of nanoparticles. We use this feature to investigate the extent of template penetration into the silica core, a level of nuance missing in experimental data on the core-shell model. We find that template penetration is rare for bulky templates. We discuss the implications of this result for understanding the role of these nanoparticles in the growth of MFI, especially in light of recent experiments on the long-time behavior of nanoparticle suspensions. I. Introduction Zeolites are an industrially important class of nanoporous crystalline silica materials, 1 whose self-assembly mechanism remains largely unknown. Revealing this mechanism is crucial for rational control of zeolite pore size and shape, and may allow targeted crystallite shapes of anisotropic zeolites. 2 The problem is complicated by the competition between silica polymerization and silica-template interactions, and also by structure at many length scales from silica oligomers, rings, and cages to nanoscale critical nuclei and beyond. Experimental progress has remained slow because critical nuclei likely fall into the nanoscale blindspot between characterization methods such as NMR and X-ray crystallography. Molecular modeling is thus poised to shed light on this problem. 3 However, the length scales involved require the development of clever models that capture the essential chemistry and physics of zeolite formation. In this article, we report progress on a lattice model of silica-template nanoparticles that appear in the early stages of the formation of silicalite-1 zeolite. The clear-solution synthesis of silicalite-1 (pure silica form of zeolite ZSM-5) has been investigated extensively as a model system to study the mechanisms of self-assembly of zeolites. 4 Upon hydrolysis of tetraethylorthosilicate (TEOS) in aqueous solutions containing the template tetrapropylammonium (TPA) hydroxide, precursor silica nanoparticles form spontaneously and finally evolve to TPA-silicalite-1, with each zeolite pore occupied by a TPA cation. However, the precise structure of these nanoparticles and their role in zeolite formation remains unknown, with many hypotheses reported in the literature. Schoeman postulated that the nanoparticles are colloidally stable species that do not directly participate in the formation of silicalite-1 but instead depolymerize to provide silica oligomers for subsequent zeolite crystallization. 5 Van Santen and co- workers hypothesized that zeolites form by reaction-controlled integration of precursor nanoparticles at crystal surfaces. 6 Kirschhock et al. hypothesized that the nanoparticles are actually “nanoslabs” with MFI crystal structure, and that silicalite-1 forms by direct aggregation of these nanoslabs. 7 The last two hypotheses point to a mechanism involving direct assimilation of nanoparticles into the eventual zeolite crystals. Recent experiments have since shed light on these issues. An in situ SAXS and SANS study by Fedeyko et al. found that the precursor nanoparticles are formed with a typical size of about 3-5 nm, with a core-shell structure of a silica-rich core surrounded by a TPA-rich shell, in both fresh and aged TPA-silica precursor solutions. 8 These particles were found to bear no evidence of silicalite-1 structure, and remained stable at room temperature for days. 8 They studied the spontaneous formation of silica nanoparticles in basic solutions of small tetraalkylammonium (TAA) cations tetramethyl- to tetrabutyl- ammonium, finding that nanoparticle core size decreases with pH, increases with temperature, and remains nearly independent of the composition of the TAA cation. Davis et al. 9 and Kumar et al. 10 carried out room- temperature studies of dilute TPA-silica solutions, observing them for over a year. They studied the evolution of TPA-silica nanoparticles, finding that their size continued to increase until day 100 and then remained nearly constant, with no evidence silicalite-1 structure. After 220-245 days of aging, a second population of larger particles emerged, showing evidence of silicalite-1 structure. TEM images revealed the particles to be agglomerates of small crystals with domains comparable in size to those of the nanoparticles. It was concluded that nanoparticles actively participate in the nucleation and crystallization processes as building blocks. These studies suggest a synthesis process that occurs through formation and aggregation of the nanoparticles * Authors for correspondence. E-mail: [email protected]; [email protected]. † Department of Chemical Engineering. ‡ Department of Chemistry. J. Phys. Chem. C 2010, 114, 14393–14401 14393 10.1021/jp1044207 2010 American Chemical Society Published on Web 08/10/2010
Transcript
Modeling Nanoparticle Formation during Early Stages of Zeolite Growth: ALow-Coordination Lattice Model of Template Penetration
L. Jin,† Scott M. Auerbach,*,†,‡ and P. A. Monson*,†
Department of Chemical Engineering and Department of Chemistry, UniVersity of Massachusetts, Amherst,Massachusetts 01003
ReceiVed: May 14, 2010; ReVised Manuscript ReceiVed: July 20, 2010
We present an extension of the simple-cubic lattice model developed by Jorge et al. [J. Am. Chem. Soc.2005, 127, 14388] of nanoparticle growth in the clear solution synthesis of silicalite-1 (MFI). We haveimplemented the model on a body-center cubic (bcc) lattice with second-neighbor repulsions, to generate afour-coordinate network that mimics the tetrahedral structure of silica. With this low-coordination latticemodel we observe that the nanoparticles are metastable, possessing a core-shell structure with mostly silicain the core and templates forming a shell. Nanoparticle size is found to increase with temperature and decreasewith solution pH, in qualitative agreement with results from experiment and the previous lattice model study.The low-coordination model makes it possible to model porosity in the silica core of nanoparticles. We usethis feature to investigate the extent of template penetration into the silica core, a level of nuance missing inexperimental data on the core-shell model. We find that template penetration is rare for bulky templates. Wediscuss the implications of this result for understanding the role of these nanoparticles in the growth of MFI,especially in light of recent experiments on the long-time behavior of nanoparticle suspensions.
I. Introduction
Zeolites are an industrially important class of nanoporouscrystalline silica materials,1 whose self-assembly mechanismremains largely unknown. Revealing this mechanism is crucialfor rational control of zeolite pore size and shape, and may allowtargeted crystallite shapes of anisotropic zeolites.2 The problemis complicated by the competition between silica polymerizationand silica-template interactions, and also by structure at manylength scales from silica oligomers, rings, and cages to nanoscalecritical nuclei and beyond. Experimental progress has remainedslow because critical nuclei likely fall into the nanoscaleblindspot between characterization methods such as NMR andX-ray crystallography. Molecular modeling is thus poised toshed light on this problem.3 However, the length scales involvedrequire the development of clever models that capture theessential chemistry and physics of zeolite formation. In thisarticle, we report progress on a lattice model of silica-templatenanoparticles that appear in the early stages of the formation ofsilicalite-1 zeolite.
The clear-solution synthesis of silicalite-1 (pure silica formof zeolite ZSM-5) has been investigated extensively as a modelsystem to study the mechanisms of self-assembly of zeolites.4
Upon hydrolysis of tetraethylorthosilicate (TEOS) in aqueoussolutions containing the template tetrapropylammonium (TPA)hydroxide, precursor silica nanoparticles form spontaneouslyand finally evolve to TPA-silicalite-1, with each zeolite poreoccupied by a TPA cation. However, the precise structure ofthese nanoparticles and their role in zeolite formation remainsunknown, with many hypotheses reported in the literature.Schoeman postulated that the nanoparticles are colloidally stablespecies that do not directly participate in the formation of
silicalite-1 but instead depolymerize to provide silica oligomersfor subsequent zeolite crystallization.5 Van Santen and co-workers hypothesized that zeolites form by reaction-controlledintegration of precursor nanoparticles at crystal surfaces.6
Kirschhock et al. hypothesized that the nanoparticles are actually“nanoslabs” with MFI crystal structure, and that silicalite-1forms by direct aggregation of these nanoslabs.7 The last twohypotheses point to a mechanism involving direct assimilationof nanoparticles into the eventual zeolite crystals.
Recent experiments have since shed light on these issues.An in situ SAXS and SANS study by Fedeyko et al. found thatthe precursor nanoparticles are formed with a typical size ofabout 3-5 nm, with a core-shell structure of a silica-rich coresurrounded by a TPA-rich shell, in both fresh and agedTPA-silica precursor solutions.8 These particles were foundto bear no evidence of silicalite-1 structure, and remained stableat room temperature for days.8 They studied the spontaneousformation of silica nanoparticles in basic solutions of smalltetraalkylammonium (TAA) cations tetramethyl- to tetrabutyl-ammonium, finding that nanoparticle core size decreases withpH, increases with temperature, and remains nearly independentof the composition of the TAA cation.
Davis et al.9 and Kumar et al.10 carried out room-temperature studies of dilute TPA-silica solutions, observingthem for over a year. They studied the evolution ofTPA-silica nanoparticles, finding that their size continuedto increase until day 100 and then remained nearly constant,with no evidence silicalite-1 structure. After 220-245 daysof aging, a second population of larger particles emerged,showing evidence of silicalite-1 structure. TEM imagesrevealed the particles to be agglomerates of small crystalswith domains comparable in size to those of the nanoparticles.It was concluded that nanoparticles actively participate inthe nucleation and crystallization processes as buildingblocks. These studies suggest a synthesis process that occursthrough formation and aggregation of the nanoparticles
† Department of Chemical Engineering.‡ Department of Chemistry.
J. Phys. Chem. C 2010, 114, 14393–14401 14393
10.1021/jp1044207 2010 American Chemical SocietyPublished on Web 08/10/2010
followed by crystallization to MFI within the aggregates.What remains largely unknown is the process by which TPAcations redistribute from their shell domain to the nanoporesof silicalite-1.
Jorge et al.11 developed a lattice gas model to simulatesilica-template nanoparticle formation. This model was inspiredin part by previous work on surfactant systems12 and on self-assembly in the formation of mesoporous silica materials.13 Themodel involves a ternary mixture of coarse-grained particles,including neutral silicic acid, its deprotonated conjugate base,and cationic TPA “particles”. Jorge et al. found that nanopar-ticles spontaneously form in canonical Monte Carlo simulations,exhibiting a core of neutral silica with anionic silica on thesurface surrounded by a layer of TPA. Parallel tempering MonteCarlo14,15 simulations showed that these nanoparticles aremetastable species, equilibrating to a bulk solid phase which,in our model, is one large cluster sequestering all available silica.The model nanoparticles resist agglomeration because of theTPA coating, which is not a network-forming component inthis system. Nanoparticle size was found to decrease withsolution pH and increase with temperature, consistent withexperimental observations.8 Experimental evidence for meta-stability comes from the observation that between the initialrapid evolution of nanoparticles and the appearance of theaggregates, there is a period during which the size and numberof nanoparticles remain largely unchanged.9 Heating the modelnanoparticles produces desorptive fluctuations of TPA specieswhich expose nanoparticle surfaces to further growth, leadingto equilibration of the nanoparticles around 150 °C to the bulksolid phase, in reasonable agreement with experiment. However,because of the 6-fold coordination in the simple-cubic lattice,the model bulk solid is nonporous, precluding the incorporationof TPA into the silica core. In order to study the redistributionof TPA as nanoparticles evolve toward zeolite critical nuclei, anew model is required that allows pore spaces in a silicanetwork. The objective of this paper is thus to refine the latticemodel to mimic the tetrahedral framework structure of silica,and to allow template penetration into the silica core.
A four-coordinate tetrahedral network can be generated byusing the body-centered cubic (bcc) lattice, which is equivalentto two interpenetrating tetrahedral lattices.16 This feature hasbeen used previously to model the network-forming substancessuch as water.17-19 By imposing second-neighbor repulsionsbetween silica units, the silica species are driven onto one ofthe two tetrahedral sublattices of the bcc structure. Refining themodel of Jorge et al. in this way generates nanoparticles withfour-coordinated tetrahedral networks possessing core-shellstructures with silica in the core and template in the shell. Moreimportantly, the unoccupied tetrahedral sublattice provides space(i.e., lattice sites) for template penetration. We find below thattemplate penetration is a rare event; we discuss the implicationsof this result in light of the recent experimental work on therole of these nanoparticles in zeolite formation.
The outline of this paper is as follows. Section 2 presentsthe lattice model and its parameters. Section 3 describes thesimulation techniques used. We present our results in section4, and in section 5 we provide a summary of our results andconclusions.
2. Model Description
The general features of our model closely follow those ofJorge et al.,11 focusing on an aqueous solution containingtetraethyl orthosilicate (TEOS) and tetrapropylammonium hy-droxide (TPAOH) at room temperature. Here we focus on the
implementation on a bcc lattice. At the isoelectric pH of silica(∼2), the condensation/hydrolysis reaction between neutral silicamonomers (denoted by SN) can be written in the generic form:
The polymerization energy is modeled by an effective first-neighbor attractive interaction between silica units, with strengthεSNSN
. In our system, all the lattice sites are occupied by eithersolute or solvent; we consider the ethanol and water in thesystem as a single solvent with energy defined to be zero.11 Inorder to generate the four-coordinated network that mimics thetetrahedral framework of silica, a second-neighbor repulsion wasimposed between both neutral and ionized silica units. Asdiscussed in the Introduction this has the effect of driving thesespecies on to one of the diamond sublattices of the bcc lattice.This is the principal difference between the present model andthat of Jorge et al.11 All nonzero energies in this paper are scaledby |εSNSN
|. The reduced temperature is defined as T* ) kBT/|εSNSN
|, where kB is Boltzmann’s constant.Silicalite-1 is commonly synthesized under conditions of high
water/silicon ratio and high pH where the following reactionalso becomes important:
To describe the polymerization process, we differentiateionized monomers (denoted by SI) from neutral monomers SN.As shown below, if the SI-SN attraction is too weak, mostionized silica remains in solution; if too strong, an ordered solidphase arises with strictly alternating SI and SN, which is mostlikely an artifact of the model. For consistency with our previouswork, we struck this balance with an SI-SN attraction of-0.8|εSNSN
|.We treat the interactions involving ionized silica as orienta-
tion-dependent: the magnitude of interactions varies as a givenmolecule approaches to the negatively charged oxygen or theneutral hydroxyl group. We assigned a pointer variable to eachlattice site occupied by SI to represent the anionic end of SI,labeled as SI
-. This variable “points” to one of the neighbors ofthat site, indicating the position of the negatively chargedoxygen.11 For example, at the first-neighbor level, the interactionbetween the pointer variable indicating the anionic end of SI
and neutral silica (denoted as εSNSI-) is different from that
between the neutral end group of ionized silica and neutral silica(εSNSI
). The interaction εSNSI- is set to zero because such a
condensation would produce a hydroxide group, which at highpH is extremely unlikely.
With a focus on modeling template penetration, we investigatebelow how the size dependence of templates influences penetra-tion probability. We study “small” and “large” templatesmodeling TMA and TPA, respectively. The electrostatic attrac-tion between TMA and SI
- is a first-neighbor interaction. Forthe interactions involving TPA, we note that the diameter ofthe TPA cation is about 1.5 times that of the silica monomers.20
This size effect is treated by adding a first-neighbor repulsionshell around each TPA unit. With a strong enough repulsion,all first-neighbor sites around each TPA remain unoccupied.For consistency with our previous study, we set this repulsionto +5|εSNSN
|; the precise magnitude of this repulsion controlsthe extent of template penetration as discussed below. A second-neighbor repulsion between each pair of TPA cations is also
R-Si-OH + R′-Si-OH h R-Si-O-Si-R′ + H2O(1)
R-Si-OH + OH- h R-Si-O- + H2O (2)
14394 J. Phys. Chem. C, Vol. 114, No. 34, 2010 Jin et al.
added. Because of the larger size of TPA, the electrostaticattraction between TPA and SI
- must be extended to the second-neighbor level, which brings the pointer variable that representsthe negatively charged oxygen in SI
- to the second neighborsas well. As a result, we assign both first- and second-neighborpointer variables, taking care that they both correspond to thesame negatively charged oxygen.
We ignore SN-TAA (either TMA or TPA) attractions becausequantum chemical calculations have shown that these arecomparable with TAA-water interactions,21 which we alsoignore for simplicity. For the first-/second-neighbor attractionbetween TMA/TPA and SI
-, we set the attraction to εTAA-SI- )
-2|εSNSN| consistent with our previous work. As we show below,
this attraction corresponds to a value of -6.6 kcal/mol basedon the SN-SN energy obtained in section 4.1. This value ofεTPA-SI
- is slightly larger than the free energy well depth of 4.7kcal/mol computed for the interaction of cubic silicate polyionTMA+ in aqueous solution.22
The Hamiltonian of the lattice model can be written as
where superscripts FN and SN denote first- and second-neighborinteractions. Indices 1, 2, and 3 refer to SI, SN, and TAA species,respectively, while the index 0 refers to interactions involvingSI-. Tables 1 and 2 represent the reduced parameters for the
TMA model, while Tables 3 and 4 summarize the reducedinteraction parameters for TPA model. Following Jorge et al.11
the TPA-TPA and TMA-TMA interaction parameters are
chosen to generate only size-exclusion, with the larger size ofthe TPA reflected in both first- and second-neighbor repulsions.
3. Simulation Methods
We use canonical ensemble (NVT) Monte Carlo (MC), grandcanonicalensembleMC,andparallel temperingMCsimulations23,24
to investigate the properties and behavior of this bcc model.Most of the results presented in this paper were obtained fromNVT MC simulations. Grand canonical MC was used to confirmthat the canonical simulations of silica solubility are convergedwith respect to system size. Parallel tempering MC simulationswere used to increase the probability that the system can crosslarge barriers between local minima of the free energy, andthereby locate equilibrium states in systems with the tendencyto be trapped in metastable states. We use these simulations toprovide evidence that the nanoparticles formed in our NVTsimulations constitute a metastable state. Given that the nano-particle states we find are metastable, it might be reasonable toask whether the states are sensitive to the simulation pathfollowed. As we are using a lattice model, the most obviousmove to make would be short-range displacements so that theevolution of the system would follow Kawasaki-like dynamics.25
We have found that the resulting dynamics is too slow for usto observe the self-assembly processes in these systems in areasonable amount of computer time. Instead, as describedbelow, we use larger scale moves so that the system followsGlauber-like dynamics.25 We believe that this speeds up thekinetics without changing the mechanism of self-assembly orthe nature of the metastable states formed in the system.
In the NVT MC simulations there are two types of MC movesimplemented. The first kind of move is an occupancy swapbetween two species on different lattice sites. If an ionized silicais chosen, the value of its pointer variable stays the same duringa swap. Since the concentration of template and silica arerelatively low, most sites of the bcc lattice are unoccupied (sitesoccupied by solvent are treated as unoccupied because all theinteractions involving solvent are set to zero). In order to avoidthe inefficiency of attempted swaps between two solvent sites,we build an occupied site list. The first site is chosen randomlyfrom that list, and the second site is chosen randomly from allthe lattice sites of the system. The move is then accepted orrejected based on the usual Metropolis criterion.
The second kind of move is the rotation of a pointer variablefor ionized silica monomers. This is implemented as follows.We randomly pick one site from the occupied site list and checkthe type of species on that site. If it is occupied by ionized silica,then the new pointer(s) is(are) assigned; otherwise that moveis rejected. For the first-neighbor model, the new pointer ischosen randomly from eight possible values (eight first neigh-bors). When it comes to the second-neighbor model, both first-and second-neighbor pointers are updated. The first-neighborpointer is chosen randomly from 8 possible values, and thesecond-neighbor pointer is chosen consistent with the new first-neighbor pointer. After the new pointer(s) is(are) updated, therotation is accepted or rejected according to the same Metropoliscriterion.
Each NVT MC run was initiated from a random configurationin a cubic simulation box of length L bcc sites. The initialconcentrations of SI, SN and TAA species were determined fromexperimental conditions.11 The system was allowed to equilibratefor at least 3 million steps. A step is defined as Nocc attemptedswaps plus Nocc pointer rotations, where Nocc is the number ofoccupied sites on the lattice. Cluster sizes were calculated usingthe Hoshen-Kopelman cluster-counting algorithm.26 For the
TABLE 1: Reduced First-Neighbor Interaction Parametersfor the TMA Model
εijFN SI
- SI SN TMA
SI- 0 0 0 -2
SI 0 0 -0.8 0SN 0 -0.8 -1 0TMA -2 0 0 0
TABLE 2: Reduced Second-Neighbor InteractionParameters for the TMA Model
εijSN SI
- SI SN TMA
SI- 5 5 5 0
SI 5 5 5 0SN 5 5 5 0TMA 0 0 0 0
TABLE 3: Reduced First-Neighbor Interaction Parametersfor the TPA Model
εijFN SI
- SI SN TPA
SI- 0 0 0 5
SI 0 0 -0.8 5SN 0 -0.8 -1 5TPA 5 5 5 5
TABLE 4: Reduced Second-Neighbor InteractionParameters for the TPA Model
εijSN SI
- SI SN TPA
SI- 5 5 5 -2
SI 5 5 5 5SN 5 5 5 5TPA -2 5 5 5
H ) 12 ∑
i)0
3
∑j)0
3
(NijFNεij
FN + NijSNεij
SN) (3)
Lattice Model of Silica-Template Nanoparticles J. Phys. Chem. C, Vol. 114, No. 34, 2010 14395
core-shell structure calculation, we first labeled all the occupiedlattice sites according to the Hoshen-Kopelman algorithm,calculated the center of mass of each nanoparticle, and histo-grammed the core-shell structure of all nanoparticles. For theTPA model involving second-neighbor attractions, the Hoshen-Kopelman algorithm remains valid if we label TPA accordingto the second neighbor to which it is connected.
The parallel tempering MC simulations are implemented bysimulating M replicas of the original system, each replica inthe canonical ensemble but at a different temperature Ti. Aftera preset number of conventional MC steps in each replica,replica exchange is attempted by switching the configurationsbetween adjacent replicas. We first select two adjacent replicasrandomly and accept or reject on the basis of the probability:23,24
The lowest temperature is usually the physical temperatureof interest, while the highest temperature must be sufficientlyhigh so that no replicas become trapped in local energy minima.The number of replicas, how to select the temperature grids,and how frequently to employ replica exchange are presentedin detail elsewhere.11,14,15,27 Most of our parallel temperingsimulations used 28 replicas with code run on a multiprocessorcomputer system, with the communications between processorshandled by the Message Passing Interface library. The temper-ature grid was optimized through trial and error and the 28reduced temperatures were: T* ) 0.18, 0.1828, 0.1856, 0.1886,0.1916, 0.1948, 0.1980, 0.2014, 0.2048, 0.2084, 0.2121, 0.2160,0.2200, 0.2242, 0.2274, 0.2307, 0.2342, 0.2377, 0.2413, 0.2451,0.2490, 0.2530, 0.2571, 0.2614, 0.2658, 0.2704, 0.2751, 0.28.
4. Results and Discussion
4.1. Simulations for Model Parametrization. We begin bydiscussing the simulation studies that were used in estimatingparameters for the model, as presented in section 3. We firstcalibrate the SN-SN interaction energy that mimics the condensa-tion reaction of silica. To do this, we studied a system containingonly neutral silica and solvent, comparing the canonical andgrand canonical simulation results with experimental data onsilica solubility to fit the energy scale of SN-SN attractions. TheseNVT MC simulations were initialized with a slab of close-packed silica in contact with pure solvent (i.e., vacancies), withperiodic boundaries in the directions perpendicular to the slabsurface. The system was then allowed to equilibrate at differentreduced temperatures, and silica solubility was computed overthe low-density region of space. Because the slab acts as areservoir for a bcc lattice gas, these NVT MC simulations werecompared with corresponding grand canonical MC simulationsto confirm that the slab size is sufficiently large to act as a properreservoir. Figure 1 shows the solubility of silica at varioustemperatures. The best fit of solubility yields a SN-SN attractionof εSNSN
) -3.3 kcal/mol. The deviation between experimentalsolubility of amorphous silica28 and our simulation resultspresumably comes from the various approximations in the latticemodel. The fitted value of the SN-SN interaction agrees withthe silica dimerization energy of -3.2 kcal/mol from ab initiocalculations.21 A temperature of 298 K thus corresponds to areduced temperature of T* ) 0.18 in the lattice model.
Now we turn to the calibration of the SN-SI interaction. Asdiscussed in the paper by Jorge et al.,11 the SN-SI interactionis studied by simulating dilute solutions containing an equimolar
mixture of SN and SI species. The parameter εSNSIcontrols the
partitioning of ionized silica between solution and solid phases,as well as the charge and structure of nanoparticles. When theSN-SI interaction is zero, most SI is in solution and the negativecharge per silicon is negligible. As the SN-SI interactionincreases, more SI is pulled into nanoparticles; the slope of thischange is steep in the range of εSNSI
between -0.7 and -1.1.When εSNSI
is stronger than -1.2, almost all SI is in the solidphase, and the negative charge per silicon reaches its limitingvalue of 0.5 (since the system we study is equimolar).
As the SN-SI interaction becomes strong, the nanoparticlesappear as solids with alternating SN and SI (i.e., sublatticeordering). The degree of sublattice ordering is obtained bycalculating the fraction of SI with all SN neighbors. As shownin Figure 2, when εSNSI
is less than -1.5, sublattice orderingbecomes essentially complete. There are two criteria forchoosing the SN-SI interaction: it must be large enough to allowthe nanoparticles to be negatively charged, but not too large toforce substantial sublattice ordering to occur. On the basis ofthese considerations we chose the bcc value of εSNSI
) -0.8,consistent with our earlier work, although values in the range
p ) min{1, exp[( 1kBTj
- 1kBTi
)(Ej - Ei)]} (4) Figure 1. Solubility of amorphous silica at the isoelectric point as afunction of temperature. The solid circles represent experimental datafrom Iler,28 the solid triangles and open squares show the results ofNVT and grand canonical Monte Carlo simulations, respectively. Thebest fit yields a SN-SN attraction of εSNSN ) -3.3 kcal/mol.
Figure 2. Simulation results for an equimolar solution containingneutral and ionized silica at room temperature (T* ) 0.18), using variousvalues of the reduced interaction energy εSNSI. Open squares show thenegative charge per silicon in the solid phase, and solid squares representthe degree of sublattice ordering in the solid phase.
14396 J. Phys. Chem. C, Vol. 114, No. 34, 2010 Jin et al.
-0.7 to -0.9 give essentially the same results as is evidentfrom Figure 2.
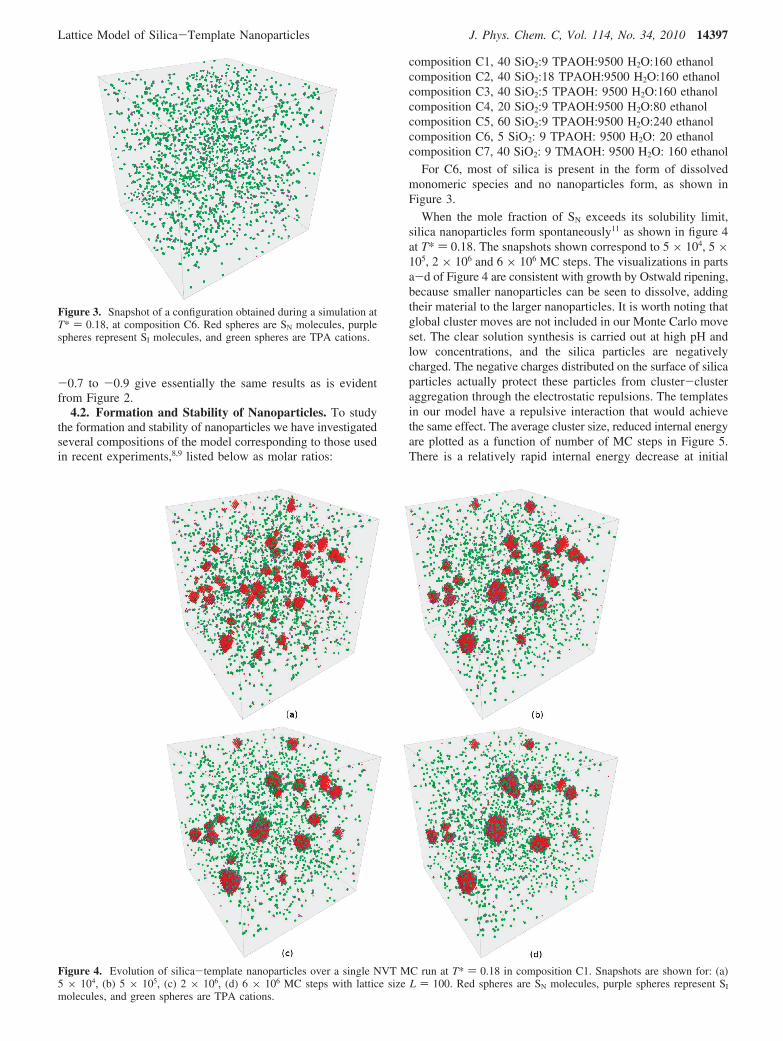
4.2. Formation and Stability of Nanoparticles. To studythe formation and stability of nanoparticles we have investigatedseveral compositions of the model corresponding to those usedin recent experiments,8,9 listed below as molar ratios:
For C6, most of silica is present in the form of dissolvedmonomeric species and no nanoparticles form, as shown inFigure 3.
When the mole fraction of SN exceeds its solubility limit,silica nanoparticles form spontaneously11 as shown in figure 4at T* ) 0.18. The snapshots shown correspond to 5 × 10⁴, 5 ×10⁵, 2 × 10⁶ and 6 × 10⁶ MC steps. The visualizations in partsa-d of Figure 4 are consistent with growth by Ostwald ripening,because smaller nanoparticles can be seen to dissolve, addingtheir material to the larger nanoparticles. It is worth noting thatglobal cluster moves are not included in our Monte Carlo moveset. The clear solution synthesis is carried out at high pH andlow concentrations, and the silica particles are negativelycharged. The negative charges distributed on the surface of silicaparticles actually protect these particles from cluster-clusteraggregation through the electrostatic repulsions. The templatesin our model have a repulsive interaction that would achievethe same effect. The average cluster size, reduced internal energyare plotted as a function of number of MC steps in Figure 5.There is a relatively rapid internal energy decrease at initial
Figure 3. Snapshot of a configuration obtained during a simulation atT* ) 0.18, at composition C6. Red spheres are SN molecules, purplespheres represent SI molecules, and green spheres are TPA cations.
Figure 4. Evolution of silica-template nanoparticles over a single NVT MC run at T* ) 0.18 in composition C1. Snapshots are shown for: (a)5 × 10⁴, (b) 5 × 10⁵, (c) 2 × 10⁶, (d) 6 × 10⁶ MC steps with lattice size L ) 100. Red spheres are SN molecules, purple spheres represent SI
molecules, and green spheres are TPA cations.
Lattice Model of Silica-Template Nanoparticles J. Phys. Chem. C, Vol. 114, No. 34, 2010 14397
stages because of the formation of small clusters. After about4 × 106 MC steps, the average cluster size is seen to reach aplateau. We average the properties over a several statisticallyindependent runs to converge the accumulation of statistics.
We have used parallel tempering MC simulations to inves-tigate the thermodynamic stability of these nanoparticle systems.Figure 6 shows the average cluster size as a function of reducedtemperature from both NVT and parallel tempering simulations;the results show qualitative agreement with our previous simple-cubic results.11,29 At lower temperature there are two branchesto the cluster size versus temperature behavior: one for the NVTMC simulations and one for the parallel tempering simulations.Below T* ) 0.26, all the parallel tempering simulations (opensquares) produce a single large cluster (i.e., bulk solid phase),presumably representing the true equilibrium state of the system,and the average cluster size decreases with temperature. Thisdecrease reflects the increasing solubility of silica with increas-ing temperature. When the temperature is high enough (aboveabout T* ) 0.26), the bulk solid dissolves precipitously. Incontrast to the parallel tempering simulations, the NVT MonteCarlo simulations produce nanoparticles that grow with increas-ing temperature. As with the simple-cubic model,11 this can be
explained by increasing solubility of TPA, a capping agent,thereby allowing further particle growth. When heated to T* )0.23 ( 0.01, the nanoparticles fluctuate wildly in size, allowingthem to overcome the free energy barrier separating them fromthe bulk solid phase. Once the nanoparticles equilibrate fullyto bulk solid, they remain in this state until heated to 0.26, atwhich point full dissolution occurs. Overall, these resultscorroborate the metastable nature of these nanoparticles byshowing that this conclusion holds for more than one lattice.
We have investigated system size effects by computing meancluster sizes for various simulation cell edge lengths L )20-130 bcc sites. For each value of L, we have averaged overnL statistically independent realizations. Values of nL werechosen to keep the total simulated volume a constant, i.e., nL ×L3 was kept constant from one value of L to the next.11 Figure7 shows the average cluster size as a function of L. When L <80, the average cluster size increases with L. This is becausesmall systems always end up in a single cluster whose size growswith system size. For L g 100, multiple clusters are formedduring all realizations, and the average cluster size approachesconvergence. On the basis of these results we have used L )100 in most of our simulations to balance convergence andcomputational cost.
4.3. Composition Distribution in Nanoparticles. We havecalculated the distribution functions of silica and template withinthe nanoparticles shown in Figure 8a from NVT simulations.The distributions are normalized by setting the peak of eachdistribution function to unity. Fedeyko et al.8 employed SANSand SAXS scattering methods to analyze the structure ofsilicate-TPA nanoparticles; their pair-distance-distribution func-tion (PDDF) is reproduced in Figure 8b. In their experimentalsystems, X-rays are scattered primarily by silica whereasneutrons are scattered by both silica and TAA cations. In orderto compare our simulation results with SANS data, we need tocombine the silica and template distributions. However, noeffective weighting function combining silica and template isavailable. To get a qualitative comparison, we used a linearcombination of silica and template with equal weighting. Herewe compare SAXS data with our silica distribution (blacksquares), and SANS data with our combined distribution profile(blue triangles). The nanoparticles obtained during NVT simula-tions possess a core-shell structure, with silica (black squares)in the core and TPA cations (red circles) in the shell, which is
Figure 5. Evolution of a single NVT MC run at T* ) 0.18 of solutionC1. Solid squares show the reduced internal energy per lattice site (lefty axis), and open circles represent the average cluster size (right y axis).
Figure 6. Average cluster size as a function of temperature withcomposition of C1. Open squares are obtained with parallel tempering,while triangles are results from NVT simulations, averaged over threeindependent simulations. Error bars represent one standard deviation.
Figure 7. Average cluster size obtained from independent NVTsimulations using different system sizes at composition C1. Cubicsimulation boxes are used, and L is the cube edge length in bcc sites.
14398 J. Phys. Chem. C, Vol. 114, No. 34, 2010 Jin et al.
consistent with experimental observations.8 However, the ex-perimental SANS pair-distance-distribution function (PDDF) ismuch broader than our combined radial distribution (bluetriangles). This is probably because the experimental SANSPDDF not only counts molecules belonging to the nanoparticlesbut also includes ones in the electrostatic double layer sur-rounding the nanoparticles, while the simulated templatedistribution (see section 3) only considered templates directlyadjacent to nanoparticles. The Debye length calculated fromexperimental conditions (temperature and ionic strength) yields1.3 nm, partially accounting for this discrepancy betweenexperiment and simulation.
Figure 9 shows the “combined” distribution function corre-sponding to different MC run lengths of 5 × 10⁴, 5 × 10⁵, 2 ×10⁶ and 6 × 10⁶ MC steps, respectively. These distributionprofiles agree with snapshots shown in Figure 4. There is arelatively rapid increase in particle size during the first 5 × 10⁴
steps, followed by slower particle growth after 5 × 10⁴ steps,which agrees qualitatively with experimental observations.9
We now consider the penetration of TPA into the nanopar-ticles. Figure 10 shows a snapshot of nanoparticles formedduring NVT simulation; six-membered rings and channels areseen from this view. More importantly, TPA cations (green
spheres) were observed inside the cores of nanoparticles.Penetration of TPA into the silica core in our model is rarebecause of the second-neighbor repulsion shell imposed aroundeach TPA (see Table 4). To establish a baseline for TPApenetration, we note that the TPA/silicon ratio in TPA-silicalite-1crystals is 4:96 or about 4.2%. In our simulations, the numberof all TPAs associated with nanoparticles divided by the numberof silica units in the nanoparticles is found to be 5.3%. This isquite comparable to the TPA loading in as-made silicalite-1. Incontrast, the number of penetrating TPAs in nanoparticlesdivided by the number of silica in nanoparticles is about 0.2%,i.e., much less than in the zeolite. Nevertheless, the amount ofpenetrated TPAs is large enough to suggest that some TPA
Figure 8. Silica-TPA nanoparticle structures at T* ) 0.18 withcomposition C1. (a) Radial distribution of silica, TPA and combined(silica + TPA) distributions from NVT simulation. Black squares andred circles represent the distribution of silica and TPA, respectively, xaxis is the radius of nanoparticles in nm. Blue triangles are the linearcombination of silica and template with a ratio of 1:1. (b) ExperimentalSANS and SAXS data from ref 8.
Figure 9. Radial distribution of nanoparticles evolution during MCrun. Black squares, red circles, green up triangles, and blue downtriangles correspond to 5 × 10⁴, 5 × 10⁵, 2 × 10⁶, and 6 × 10⁶ numberof MC steps, respectively. Each distribution is a linear combination ofsilica and template distributions with equal weighting.
Figure 10. Snapshot of nanoparticles formed during NVT simulationat T* ) 0.18 with compositions C1. Red spheres are SN molecules,purple spheres represent SI molecules, and green spheres are TPAcations. (a) Snapshot of a single particle. The most compact structureformed using bcc lattice model with second neighbor repulsion is the�-cristobalite, as shown in this figure. Six-membered rings and channelsare seen from this view. (b) Amplified view of rectangular region in(a). A TPA cation has penetrated inside the nanoparticles, as indicatedby the black arrow.
Lattice Model of Silica-Template Nanoparticles J. Phys. Chem. C, Vol. 114, No. 34, 2010 14399
cations reside in the silica core regions of precursor nanopar-ticles, a possibility that is not ruled out by the SANS and SAXSexperiments.8 We suggest that the rare incorporation of externalTPA molecules within the interior of nanoparticles may explainthe long induction period during clear-solution synthesis, andcontribute to the decrease of their charge and long-term stability.Thus, we speculate that template penetration is key to silicalitenucleation.
The initial concentration of TPAOH controls both theconcentration of TPA cations and solution pH. Experimentalmeasurements have shown that increasing TPAOH concentrationat constant silica concentration leads to smaller nanoparticles.8
Figure 11 shows the distribution profiles of combined silica andTPA templates in precursor nanoparticles at T* ) 0.18 withdifferent TPAOH concentrations. As the concentration ofTPAOH increases from C3 (blue triangle) to C1 (red circle) toC2 (black square), while keeping the silica concentrationconstant, the sizes of the silica cores decrease slightly whilethe distribution profiles for TPA vary significantly. In particular,the C3 system with low TPA concentration shows tails in bothcore and shell distributions, suggesting there is not enough TPAto completely encapsulate the nanoparticles.
In Figure 12, we show “combined” (Silica + TPA) radialdistribution profiles for different concentrations of silica whilekeeping the TPAOH concentration constant. As the concentra-tion of silica is doubled (C1) and tripled (C5) compared tosolution C4, nanoparticle size shifts only slightly to larger sizes,consistent with experimental observations that particle size ismore sensitive to pH than to silica concentration (above a criticalconcentration).8
Experimental studies indicate that silica nanoparticles withsimilar structures also form spontaneously with other small TAAcations, such as tetramethylammonium (TMA), tetraethyl-ammmonium (TEA), and tetrabutylammonium (TBA).8 Toinvestigate how template size influences penetration into nano-particle cores, we have studied nanoparticle formation with theTMA model of first-neighbor template-silica attractions. Figure13 shows the radial distribution of silica and TMA of nano-particles formed during NVT simulations. The nanoparticlesformed with TMA have an average radius of 3.5 nm, estimatedon the basis of a Si-O bond length of 0.16 nm, Si-O-Si angleof 150°, and the observed average radius of nanoparticles of10 bcc lattice sites. The distributions of silica and combined
silica-TMA show similar behavior as the experimental X-rayand neutron scattering data for TMA nanoparticles.30
Fedeyko et al. interpreted their silica-TMA nanoparticlescattering data in light of core-shell structure.30 However, oursimulation results do not support this interpretation, consideringthat the width of our simulated “shell” is only a fraction of thesize of TMA. As shown in Figure 14, a significant number ofTMA cations are observed penetrating inside nanoparticle cores.We also observe that the size of silica-TMA nanoparticles isabout the same as silica-TPA nanoparticles. In other words,the nanoparticle core size is found to be nearly independent oftemplate size, in agreement with experimental observations.8
5. Conclusions
We have presented an extended version of the lattice modelof Jorge et al. for studying the early-stage formation ofnanoparticles during silicalite zeolite nucleation. By implement-ing the model on a bcc lattice and imposing a second-neighborrepulsion, we obtained precursor silica nanoparticles with atetrahedral coordinated network and with remaining sites to actas pore spaces. We observed the spontaneous formation ofsilica-template nanoparticles under conditions comparable to
Figure 11. Radial distribution profiles of precursor nanoparticles atT* ) 0.18 with different TPAOH concentrations. Blue triangles, redcircles, and black squares correspond to combined silica and TPAdistribution in C3, C1, and C2 solutions, respectively.
Figure 12. “Combined” (Silica + TPA) radial distribution profiles ofsolutions T* ) 0.18 at different concentrations of silica, wherein blacksquares, red circles, and blue triangles correspond to compositions ofC4, C1, and C5, respectively. Simulation distribution profiles areaveraged over four independent runs at each composition.
Figure 13. Radial distribution of silica and TMA of nanoparticlesformed during NVT simulation at C7. Solid squares represent thedistribution of silica, and open circles show that of TMA. The trianglesare equally weighted silica and template distributions.
14400 J. Phys. Chem. C, Vol. 114, No. 34, 2010 Jin et al.
experiments. The nanoparticles were found to be metastable,equilibrating to bulk solid at high enough temperature. Themetastability of these nanoparticles can be explained by theirhierarchical structure: a core of mostly neutral silica, with ionicsilica located mainly on the particle surface, surrounded by alayer of TPA cations. The TPA cations tend to adsorb to silicaanions near the nanoparticle surface, thus providing a barrierprotecting the nanoparticles from further addition of silicamonomers.
Silica and template composition profiles were calculated toanalyze the precise structures of nanoparticles. The nanoparticleswere found to possess a structure consisting of a silica coreand a template shell, consistent with experimental SANS andSAXS results. The size of simulated nanoparticles was foundto increase with temperature and to decrease with solution pH(TPA concentration). Increasing the silica concentration atconstant pH increased the number of nanoparticles and onlyslightly increased their size as well.
The most significant feature of the refined bcc lattice modelis that templates can and do penetrate the interior of nanopar-ticles. Although in our simulated nanoparticles the template/silica ratio is comparable to that in as-made TPA-silicalite,the penetrating-template/silica ratio is 25 times smaller. Wesuggest that incorporation of the template into nanoparticles mayplay an important role during evolution from metastablenanoparticles to the nearly final state in the synthesis ofsilicalite-1 - with template molecules sitting in the intersectionsof zeolite. In future work, we will further develop such low-coordination models to investigate template penetration andnanoparticle structure along the path toward zeolite synthesis.
Acknowledgment. This work was supported by a grant fromthe U.S. Department of Energy (Contract No. DE-FG02-07ER46466).
References and Notes
(1) Auerbach, S. M., Carrado, K. A., Dutta, P. K., Eds. Handbook ofZeolite Science and Technology; Dekker Inc.: New York:, 2003.
(2) Barton, T. J.; Bull, L. M.; Klemperer, W. G.; Loy, D. A.; McEnaney,B.; Misono, M.; Monson, P. A.; Pez, G.; Scherer, G. W.; Vartuli, J. C.;Yaghi, O. M. Chem. Mater. 1999, 11, 2633–2656.
(3) Auerbach, S. M.; Ford, M. H.; Monson, P. A. Curr. Opin. ColloidInterface Sci. 2005, 10, 220–225.
(4) Singh, R.; Dutta, P. K. In Handbook of Zeolite Science andTechnology.; Auerbach, S. M., Carrado, K. A., Dutta, P. K., Eds.; DekkerInc.: New York:, 2003.
(5) Schoeman, B. J. Microporous Mesoporous Mater. 1998, 22, 9–22.(6) de Moor, P. P. E. A.; Beelen, T. P. M.; van Santen, R. A. J. Phys.
Chem. B 1999, 103, 1639–1650.(7) Kirschhock, C. E. A.; Ravishankar, R.; Jacobs, P. A.; Martens, J. A.
J. Phys. Chem. B 1999, 103, 11021–11027.(8) Fedeyko, J. M.; Rimer, J. D.; Lobo, R. F.; Vlachos, D. G. J. Phys.
Chem. B 2004, 108, 12271–12275.(9) Davis, T. M.; Drews, T. O.; Ramanan, H.; He, C.; Dong, J. S.;
Schnablegger, H.; Katsoulakis, M. A.; Kokkoli, E.; McCormick, A. V.;Penn, R. L.; Tsapatsis, M. Nat. Mater. 2006, 5, 400–408.
(10) Kumar, S.; Wang, Z. P.; Penn, R. L.; Tsapatsis, M. J. Am. Chem.Soc. 2008, 130, 17284–17286.
(11) Jorge, M.; Auerbach, S. M.; Monson, P. A. J. Am. Chem. Soc. 2005,127, 14388–14400.
(12) Larson, R. G. J. Chem. Phys. 1989, 91, 2479–2488.(13) Siperstein, F. R.; Gubbins, K. E. Langmuir 2003, 19, 2049–2057.(14) Hukushima, K.; Nemoto, K. J. Phys. Soc. Jpn. 1996, 65, 1604–
1608.(15) Kofke, D. A. J. Chem. Phys. 2002, 117, 6911–6914.(16) Kittel, C. Introduction to Solid State Physics; Wiley: New York:,
1996.(17) Bell, G. M.; Salt, D. W. J. Chem. Soc., Faraday Trans. 2 1976,
72, 76–86.(18) Borick, S. S.; Debenedetti, P. G. J. Phys. Chem. 1993, 97, 6292–
6303.(19) Liu, J.-C.; Monson, P. A.; van Swol, F. J. Phys. Chem. C 2007,
111, 15976–15981.(20) Zana, R.; Yeager, E. J. Phys. Chem. 1967, 71, 4241–4244.(21) Catlow, C. R. A.; David, S. C.; Ben, S.; Lewis, D. W.; Pereira,
J. C. G. In Handbook of zeolite science and technology; Auerbach, S. M.,Carrado, K. A., Dutta, P. K., Eds.; Dekker Inc.: New York: 2003; pp 91-171.
(22) Caratzoulas, S.; Vlachos, D. G.; Tsapatsis, M. J. Am. Chem. Soc.2006, 128, 16138–16147.
(23) Swendsen, R. H.; Wang, J. S. Phys. ReV. Lett. 1986, 57, 2607–2609.
(24) Earl, D. J.; Deem, M. W. Phys. Chem. Chem. Phys. 2005, 7, 3910–3916.
(25) Newman, M. E. J.; Barkema, G. T. Monte Carlo Methods inStatistical Physics; Clarendon Press, Oxford University Press: New York:,1999.
(26) Hoshen, J.; Kopelman, R. Phys. ReV. B 1976, 14, 3438–3445.(27) Yan, Q. L.; de Pablo, J. J. J. Chem. Phys. 1999, 111, 9509–9516.(28) Iler, R. K. The Chemistry of Silica: Solubility, Polymerization,
Colloid and Surface Properties and Biochemistry; Wiley: New York:, 1979.(29) Jorge, M.; Auerbach, S. M.; Monson, P. A. Mol. Phys. 2006, 104,
3512–3522.(30) Fedeyko, J. M.; Vlachos, D. G.; Lobo, R. F. Langmuir 2005, 21,
5197–5206.
JP1044207
Figure 14. Silica and TMA nanoparticles formed during NVT MCrun at T* ) 0.18 in C7 solution after 6 × 10⁶ MC steps with latticesize L ) 100. Red spheres are SN molecules, purple spheres representSI molecules, and green spheres are TMA cations. Significant TMApenetration into nanoparticle cores is seen from these snapshots.
Lattice Model of Silica-Template Nanoparticles J. Phys. Chem. C, Vol. 114, No. 34, 2010 14401