The aim of this study was to determine the relationship between natural frequency of vibration, the height of the structure, the stiffnesses of members and number bays of a structure. The relationship was to be developed based on data obtained using two methods. The methods were theoretical and experimental. In the theoretical method Computer Modeling was done based on structural theory. In the experimental method physical prototypes of structures were made to vibrate freely. In the theoretical approach, a matrix approach a computer program which generated structural models was developed using a matrix method. A horizontal force would be input at a top joint of each model and deflection at the centre of mass was calculated. The deflection was the amplitude of vibration. The stiffness of the structure was then calculated using the structural amplitude obtained. The stiffness would then be used to calculate the natural frequency of vibration for the structural model. In the experimental approach, physical miniature structures were fabricated with different heights, member stiffnesses and number of bays. An increasing force would be applied on each structure using a magnet which would release it, at a certain magnitude of force, to vibrate freely. Deflections against time at the centre of mass were then measured using an horizontal motion transducer. The transducer has a probe which gets depressed on contact with a vibrating object. The instrument was connected to a TDS 302 data-logger which displayed deflection against time on a screen. Analysis of data obtained from the two approaches was done using a graphical method. The experimental data correlated very closely to the theoretical data. The results of the analysis enabled development of a formula for obtaining the natural frequency of vibration using the various parameters. The formula will aid the engineering design of tall buildings such that they do not resonate with the forces acting on them. In this way it will be possible to avoid catastrophic resonance disasters. Key Words: Vibrations, Frequencies, Natural, Resonance, Structures
Source of Support: None; Conflict of Interest: Declared
How to Cite: Mutala GN. 2016. Modeling Natural Frequencies of Vibration of Three Dimensional Frames under
Two Dimensional Loading Asian Journal of Applied Science and Engineering, 5, 71-92.
This article is is licensed under a Creative Commons Attribution-NonCommercial 4.0 International License. Attribution-NonCommercial (CC BY-NC) license lets others remix, tweak, and build upon work non-commercially, and although the new works must also acknowledge & be non-commercial.
Mutala: Modeling Natural Frequencies of Vibration of Three Dimensional Frames under Two Dimensional Loading (71-92)
Page 72 Volume 5, No 1/2016 | AJASE
INTRODUCTION
Background
Structures undergo free vibrations if oscillations are induced when there is no further energy input into the structure. The frequencies of vibration during free vibrations are the natural frequencies. When energy is continuously input into a structure, forced vibrations occur. The source of such energy can include wind, earthquake and machines. When input of energy into a vibrating structure is done at the same frequency as the natural frequency of the structure, resonance occurs. The resonance causes the vibrations to reach very high magnitudes and may lead to collapse of the structure.
The parameters associated with vibration characteristics are; natural frequencies, modal shapes and modal damping ratios (Arakawa & Yamamoto, 2004). Variations on vibration characteristics reflect changes in the physical parameters of the structural system and indicate certain cracks or damages caused by failure of members in the system (Arakawa & Yamamoto, 2004).
Winds have different frequencies ranging from 0.6Hz to over 70Hz. Wind tunnel simulations have been used to determine these frequencies. Thousands of tornadoes occur each year in various parts of the world. These tornadoes cause major destruction of lives and property. The destruction is more where the frequency of vibration of the building structure is the same as that of the tornado. A structure whose frequency of vibration is different from that of the tornado is sometimes left standing whereas a structure which has the same frequency as the tornado is destroyed. Speed plays an important role in governing the effects of resonance. Fast-moving tornadoes may affect stiffer or smaller buildings while slow-moving tornadoes with lower frequencies may affect taller or flexible buildings (Dutta, et al., 2002). An awareness of both tangential and translation speed may be essential to the understanding of damage caused by a specific tornado event on a building.
The earthquake of September 1985 in Mexico City provided a striking illustration of how resonance can have disastrous effects on structures. Most of the buildings which collapsed during the earthquake were on average twenty stories high. These had a natural frequency of vibration of about 0.5Hz. These twenty storey buildings were in resonated with the earthquake. Other buildings, of different heights and with different natural frequencies, were often found undamaged even though they were located right next to the damaged buildings. There were five parameters that affected the seismic performance. These included the degree of regularity, redundancy of structure, relation between the natural frequency of the structure and the frequency of the earthquake, the stiffness of the structure, and the ability to sustain cycles of inelastic deformation without a loss in strength (Bertero, 1989).
An example of catastrophic resonance failure is the failure of the Basse-Chaine Bridge in France in 1850. Many soldiers were marching over the bridge when it collapsed. A storm caused the bridge to vibrate in resonance with the wind. The soldiers' efforts to avoid falling off the bridge inadvertently caused them to match at the natural frequency of the structure. This resonance largely contributed to the catastrophic failure (Dupuit, et al., 1850). In a different case in Bangladesh, the collapse of a factory was partly attributed to resonance between the factory machines and the building (Schilling, 2013).
Asian Journal of Applied Science and Engineering, Volume 5, No 1/2016 ISSN 2305-915X(p); 2307-9584(e)
The foregoing illustrates catastrophic resonance where the natural frequency of the structure is the same as that of the force acting on it. It is therefore necessary to gain a better understanding of the relationship between the natural frequency and the dimensions of a structure. Such a relationship will inform engineering design of structures for various forces expected to act on them. This way, it will be possible to reduce destruction of property and lives. Moreover, engineers will be able to detect structural deterioration based on changes of frequency of vibration. In addition engineers will also be able to minimize discomfort to users by avoiding resonance during vibrations in buildings.
Problem statement
In a past study where computer modeling was utilized (Verma & Ashish, 2011) it was found that the natural frequencies of vibration of structures decreased with increase in the height of the structure. The study was undertaken for structures where members were either vertical or horizontal. In the study, two-dimensional structures were considered instead of three-dimensional as proposed in this research. Moreover, no formulation was done for the relationship between the natural frequency and horizontal length of the structure or the stiffnesses of structural members. This research aimed at derivation of the mathematical model for the relationships in three dimensional structures.
Objective of the study
The main objective of this study was to model the relationship between natural frequency of vibration of a structure, its height, the stiffnesses of its members and the number of bays.
The specific objectives were:
To use stiffness matrix method to develop software capable of analysing deflections for given initial horizontal forces acting on a structure. The software was to be used to simulate free vibrations and calculate the deflections against time. This was to be done for structures with different heights, number of bays and structural member stiffnesses.
To make steel model structures and subject them to free vibrations by applying initial horizontal forces. The horizontal deflections against time for the free vibrations were to be measured. This was to be repeated for structures of different heights, number of bays and structural member stiffnesses.
To model the relationship between natural frequency, the height of structure, the number of bays and the stiffnesses of the structural members.
Justification of the study
It is important to study natural frequencies of vibration in structures because excessive vibrations due to resonance have been known to cause collapse of the structures. If designers had information regarding the natural frequencies of vibration of the structures under design, there would be a reduced possibility of resonance of the structures under the forces they are likely to be subjected to in their life spans.
Scope of the study
The scope of the study is two dimensional vibrations for the first mode of vibration. It is assumed that the maximum horizontal deflection is at the top of the structure.
Mutala: Modeling Natural Frequencies of Vibration of Three Dimensional Frames under Two Dimensional Loading (71-92)
Page 74 Volume 5, No 1/2016 | AJASE
THEORETICAL AND CONCEPTUAL FRAMEWORK
Theoretical Framework
The theoretical framework for this research is outlined in the remaining section of this Chapter.
Theory and Code for Computer Modeling
Based on the theory given in this Chapter, software, named “Structuresoft”, was developed to simulate free vibrations and calculate deflections against time. The computer code is given in the appendix. A three dimensional structure has six degrees of freedom at each joint which can fully move. Similarly, a structure with twelve fully movable joints has seventy two degrees of freedom at the fully movable joints. Such a structure has seventy two natural frequencies at the joints due to seventy two degrees of freedom. However in this research one degree of freedom at the centre of gravity is of interest. Therefore after analyzing the structure for the initial deflection at all the degrees of freedom at the joints, interpolation was used to determine the idealized initial horizontal deflection at the centre of gravity of the structure.
The stiffness matrix that was assembled to analyze structures was of the form;
Where K i j is the force in coordinate i due to a unit deflection in coordinate j
and n is the total number of joints.
The relationship between the external force, the stiffnesses, the deflections, and the internal forces at coordinates 1 and 2 is given by equations 1 and 2:
0=P1+P1’ +K 11 ∆1+K 12 ∆2+K13∆3---------------K1n∆n ----------------Equation 1 0=P2+P2’ +K21∆1+K22∆2+K23∆3----------K2n∆n ----------------------Equation 2 The equations in the other coordinates are similar.
The general expression for equations 1 and 2 is given by equation 3;
Where PJ is the external force at coordinate J, PJ’ is the internal force at coordinate J and ∆1,∆2,∆3-----------∆n are deflections at coordinates 1,2,3---- up to n. The force can be in KN or be a moment in KNm.
Enumeration of Coordinates
It is necessary to enumerate coordinates by considering the degrees of freedom at all the joints. The maximum number of degrees of freedom in space for any joint is six as described below: 1. Linear displacement in X-direction 2. Linear displacement in Y-direction 3. Rotation about Z-axis 4. Linear displacement in Z-direction 5. Rotation about Y-xis 6. Rotation about X-axis
If a joint is a support, it has zero degrees of freedom unless restraint is removed in any of the above mentioned degrees of freedom.
Asian Journal of Applied Science and Engineering, Volume 5, No 1/2016 ISSN 2305-915X(p); 2307-9584(e)
Calculation of Stiffnesses for Various Coordinates for a Given Member
Consider a member with two joints J1 and J2 at the left and right respectively. The XYZ axes are shown in Figure 1. The displacement coordinates at the two end joints are shown in Figure 2.
Figure 1: XYZ AXES
Figure 2: The Displacement Coordinates at the 2 ends of a Structural member
Joint 1 has coordinates 1 to 6. Coordinate 1 represents displacement in the x –direction, 2 represents deflection in the y-direction, 3 represents rotation about the z-axis, 4 represent displacement in the z-direction, 5 represents rotation about the y-direction and 6 represents rotation about the x-axis.
Joint 2 have coordinates 7 to 12. Coordinate 7 is a deflection in the x-axis, coordinate 8 is a deflection in the y-axis, coordinate 9 is a rotation about the z-axis, and coordinate 10 is a deflection in the z-axis, coordinate 11 is a rotation about the y-axis and coordinate 12 is a rotation about the x-axis. The equilibrium condition of the members is described in equation 4.
0=External load +Internal load+ sum of (stiffness x deflection) at any coordinate----Equation 4
Simulation of Vibrations
The model structures were subjected to an initial horizontal force Fot at one of top most joints to cause deflection xot at the top and deflection xo at the centre of mass. The deflection at the centre of mass was calculated based on the deflection at the top using interpolation. The structures were thereafter released to undergo free vibrations. The overall stiffness of the structure Ko is defined as the force required at the top to cause a unit horizontal deflection at the centre of mass. Application of the force at the top results in the first mode of vibrations. For theoretical approach, the deflections at the centre of mass were determined by use of the model structure’s stiffness matrices. On the other hand, in the experimental approach the deflections were physically measured. The force applied at the top is divided by the deflection at the centre of mass to give the stiffness of the structure Ko.
Mutala: Modeling Natural Frequencies of Vibration of Three Dimensional Frames under Two Dimensional Loading (71-92)
Page 76 Volume 5, No 1/2016 | AJASE
Newton’s second law of motion (which states that force =mass * acceleration) governs the relationship between the overall structure’s stiffness, Ko, the horizontal deflection, x, the acceleration, a and total mass of the structure, m.
Total Mass* acceleration=stiffness *deflection at the centre of mass, which is given by equation 5 below.
To determine Ko, a horizontal force Fot at a top joint of the structure is first input in a computer programme, which does a calculation of the deflection, xo, of the structure at the centre of mass.
The stiffness Ko is then calculated using equation 7 below;
Ko =Fot /xo----------------------------------------------Equation 7
The angular velocity, W, is then calculated as follows;
W=√( Ko /m)-------------------------------------------Equation 8
From equation 8, the eigen frequency f and vibration period T are derived, according to;
where x oc is initial deflection at centre of mass.
MATERIALS AND METHODOLOGY
Free Vibration Models
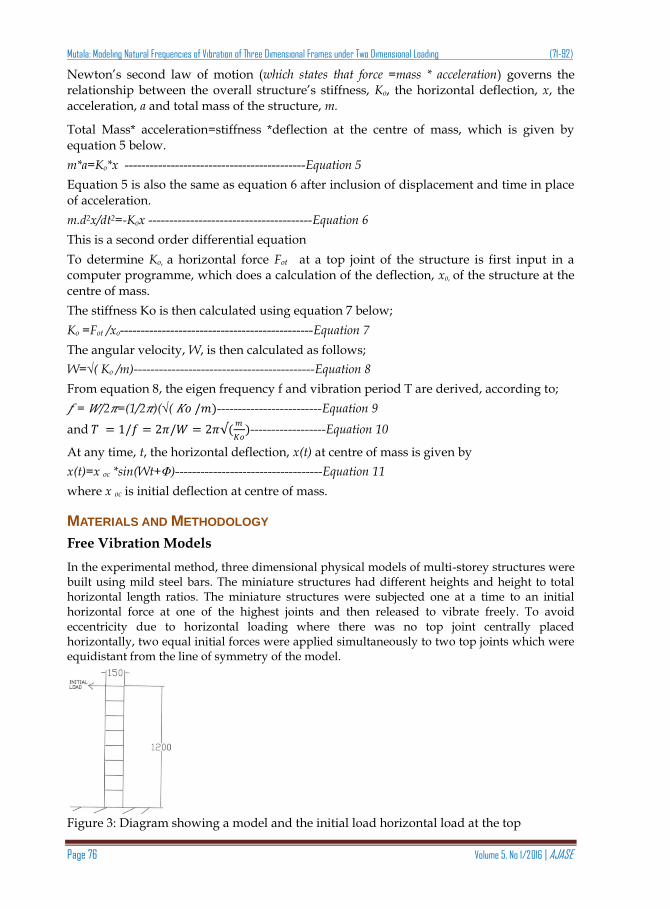
In the experimental method, three dimensional physical models of multi-storey structures were built using mild steel bars. The miniature structures had different heights and height to total horizontal length ratios. The miniature structures were subjected one at a time to an initial horizontal force at one of the highest joints and then released to vibrate freely. To avoid eccentricity due to horizontal loading where there was no top joint centrally placed horizontally, two equal initial forces were applied simultaneously to two top joints which were equidistant from the line of symmetry of the model.
Figure 3: Diagram showing a model and the initial load horizontal load at the top
Asian Journal of Applied Science and Engineering, Volume 5, No 1/2016 ISSN 2305-915X(p); 2307-9584(e)
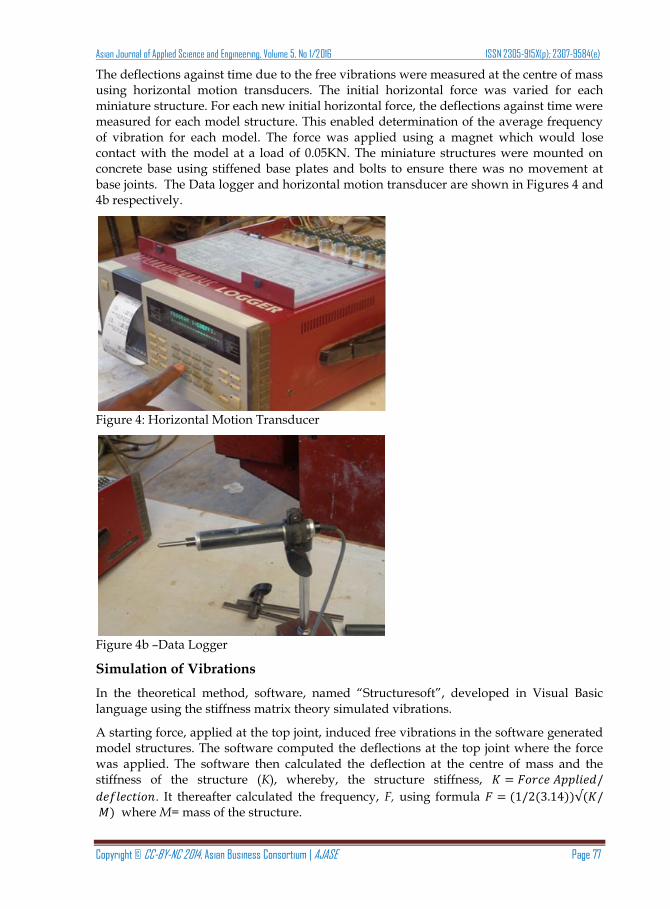
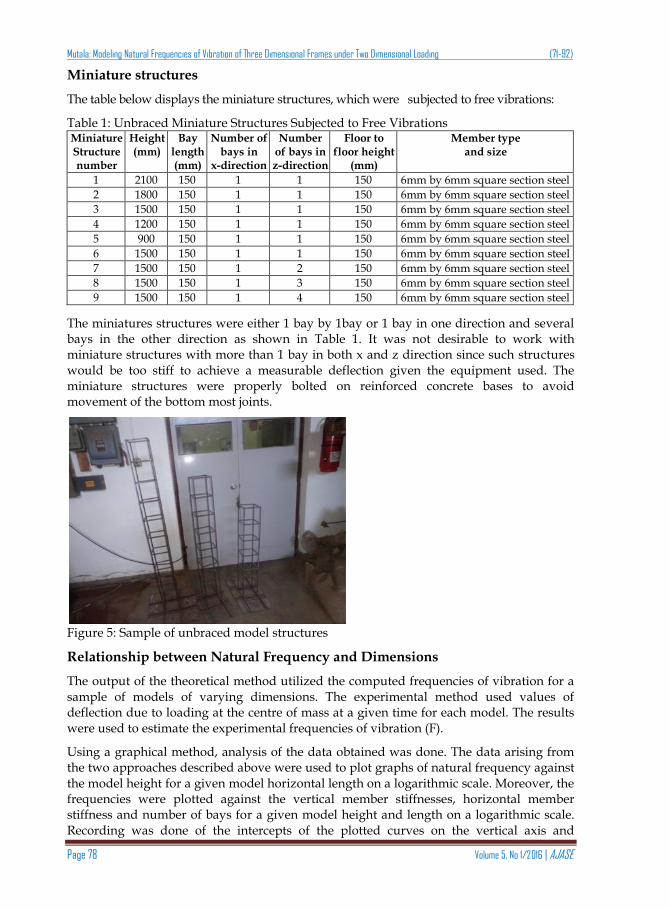
The deflections against time due to the free vibrations were measured at the centre of mass using horizontal motion transducers. The initial horizontal force was varied for each miniature structure. For each new initial horizontal force, the deflections against time were measured for each model structure. This enabled determination of the average frequency of vibration for each model. The force was applied using a magnet which would lose contact with the model at a load of 0.05KN. The miniature structures were mounted on concrete base using stiffened base plates and bolts to ensure there was no movement at base joints. The Data logger and horizontal motion transducer are shown in Figures 4 and 4b respectively.
Figure 4: Horizontal Motion Transducer
Figure 4b –Data Logger
Simulation of Vibrations
In the theoretical method, software, named “Structuresoft”, developed in Visual Basic language using the stiffness matrix theory simulated vibrations.
A starting force, applied at the top joint, induced free vibrations in the software generated model structures. The software computed the deflections at the top joint where the force was applied. The software then calculated the deflection at the centre of mass and the stiffness of the structure (K), whereby, the structure stiffness, 𝐾 = 𝐹𝑜𝑟𝑐𝑒 𝐴𝑝𝑝𝑙𝑖𝑒𝑑/
𝑑𝑒𝑓𝑙𝑒𝑐𝑡𝑖𝑜𝑛. It thereafter calculated the frequency, F, using formula 𝐹 = (1/2(3.14))√(𝐾/ 𝑀) where M= mass of the structure.
Mutala: Modeling Natural Frequencies of Vibration of Three Dimensional Frames under Two Dimensional Loading (71-92)
Page 78 Volume 5, No 1/2016 | AJASE
Miniature structures
The table below displays the miniature structures, which were subjected to free vibrations:
Table 1: Unbraced Miniature Structures Subjected to Free Vibrations Miniature Structure number
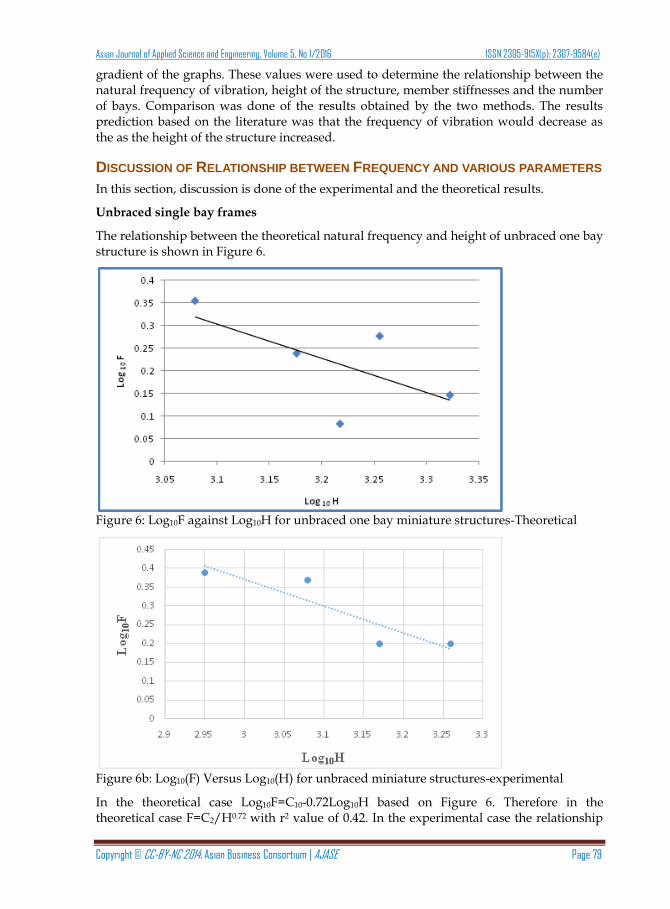
The miniatures structures were either 1 bay by 1bay or 1 bay in one direction and several bays in the other direction as shown in Table 1. It was not desirable to work with miniature structures with more than 1 bay in both x and z direction since such structures would be too stiff to achieve a measurable deflection given the equipment used. The miniature structures were properly bolted on reinforced concrete bases to avoid movement of the bottom most joints.
Figure 5: Sample of unbraced model structures
Relationship between Natural Frequency and Dimensions
The output of the theoretical method utilized the computed frequencies of vibration for a sample of models of varying dimensions. The experimental method used values of deflection due to loading at the centre of mass at a given time for each model. The results were used to estimate the experimental frequencies of vibration (F).
Using a graphical method, analysis of the data obtained was done. The data arising from the two approaches described above were used to plot graphs of natural frequency against the model height for a given model horizontal length on a logarithmic scale. Moreover, the frequencies were plotted against the vertical member stiffnesses, horizontal member stiffness and number of bays for a given model height and length on a logarithmic scale. Recording was done of the intercepts of the plotted curves on the vertical axis and
Asian Journal of Applied Science and Engineering, Volume 5, No 1/2016 ISSN 2305-915X(p); 2307-9584(e)
gradient of the graphs. These values were used to determine the relationship between the natural frequency of vibration, height of the structure, member stiffnesses and the number of bays. Comparison was done of the results obtained by the two methods. The results prediction based on the literature was that the frequency of vibration would decrease as the as the height of the structure increased.
DISCUSSION OF RELATIONSHIP BETWEEN FREQUENCY AND VARIOUS PARAMETERS
In this section, discussion is done of the experimental and the theoretical results.
Unbraced single bay frames
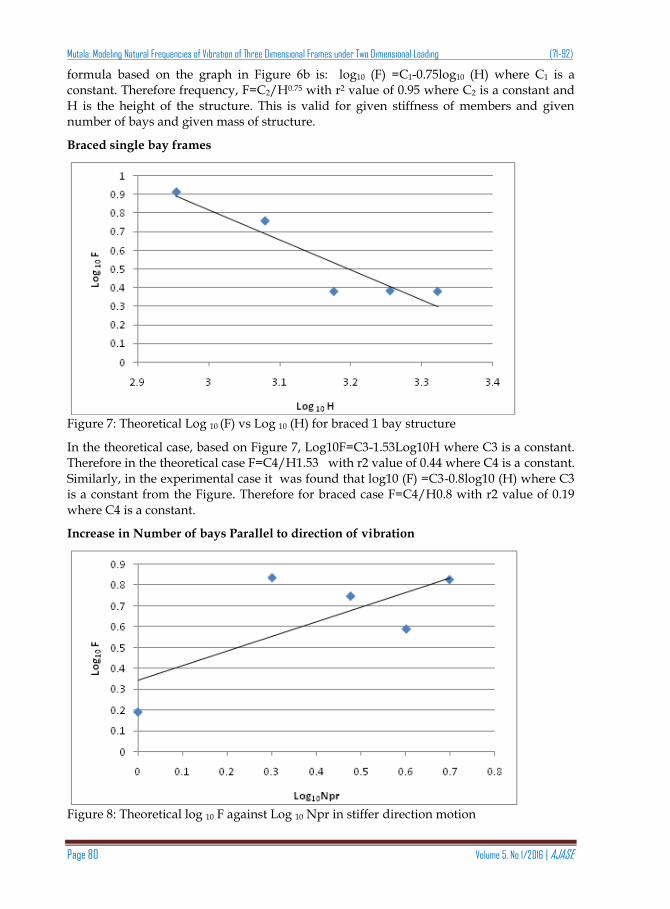
The relationship between the theoretical natural frequency and height of unbraced one bay structure is shown in Figure 6.
Figure 6: Log10F against Log10H for unbraced one bay miniature structures-Theoretical
Figure 6b: Log10(F) Versus Log10(H) for unbraced miniature structures-experimental
In the theoretical case Log10F=C10-0.72Log10H based on Figure 6. Therefore in the theoretical case F=C2/H0.72 with r2 value of 0.42. In the experimental case the relationship
Mutala: Modeling Natural Frequencies of Vibration of Three Dimensional Frames under Two Dimensional Loading (71-92)
Page 80 Volume 5, No 1/2016 | AJASE
formula based on the graph in Figure 6b is: log10 (F) =C1-0.75log10 (H) where C1 is a constant. Therefore frequency, F=C2/H0.75 with r2 value of 0.95 where C2 is a constant and H is the height of the structure. This is valid for given stiffness of members and given number of bays and given mass of structure.
Braced single bay frames
Figure 7: Theoretical Log 10 (F) vs Log 10 (H) for braced 1 bay structure
In the theoretical case, based on Figure 7, Log10F=C3-1.53Log10H where C3 is a constant. Therefore in the theoretical case F=C4/H1.53 with r2 value of 0.44 where C4 is a constant. Similarly, in the experimental case it was found that log10 (F) =C3-0.8log10 (H) where C3 is a constant from the Figure. Therefore for braced case F=C4/H0.8 with r2 value of 0.19 where C4 is a constant.
Increase in Number of bays Parallel to direction of vibration
Figure 8: Theoretical log 10 F against Log 10 Npr in stiffer direction motion
Asian Journal of Applied Science and Engineering, Volume 5, No 1/2016 ISSN 2305-915X(p); 2307-9584(e)
In the theoretical case, the relationship between Log 10 F and Log 10 N where the number of bays increased and motion is parallel to the stiffer direction is shown in Figure 8. The relationship for the experimental case is shown in Figure 8b.
Figure 8b: Log10 (Frequency, F) VsLog10 (Number of bays, Npr), in stiffer Direction Motion-Experimental
In the theoretical case, Log10 F=C9+0.68Log10Npr. Therefore F=C10*Npr 0.68 with an r2 value of 0.23 based on Figure 8. In the experimental case, based on the graph in Figure 8b, log 10(F) =C9+0.68 log10 (Npr) with an r2 value of 0.19 where C9 is a constant. Therefore, in the experimental case F=C10*(Npr0.68) where C10 is a constant.
Increase in Number of bays Perpendicular to direction of vibration
Figure 9: Log 10F against log 10 (Npp) as the number of bays increase in one direction-Motion parallel to less stiff direction-Theoretical
Mutala: Modeling Natural Frequencies of Vibration of Three Dimensional Frames under Two Dimensional Loading (71-92)
Page 82 Volume 5, No 1/2016 | AJASE
Figure 9b: Log10 (F) against Log10 (Npp) for motion perpendicular to stiffer direction-Experimental
In the theoretical Log10F=C5-0.28Log10 (Npp) based on Figure 9 where C5 is a constant. Therefore in this case F=C6/Npp
0.28 where C6 is a constant with r2 value of 0.997. In the experimental case, based on Figure 9b, the relationship between Log10F and Log10Npp is: Log10 (F) =C5+1.17log10 (Npp) where C5 is a constant. Therefore for motion in less stiff direction experimental case, F=C6*Npp1.17 with r2 value of 0.92
Change of Natural frequency as the Column Stiffness Increases
Figure 10: Log10 (F) against Log10 (Sv) -Theoretical
In the theoretical case, the relationship between log10 (F) and log10(Sv) is shown in Figure 10 where F is the frequency, and Sv is the column stiffness ratio (I/L).
Asian Journal of Applied Science and Engineering, Volume 5, No 1/2016 ISSN 2305-915X(p); 2307-9584(e)
Figure 10b: Log 10(Frequency, F) against log10 (Column stiffness, Sv)-Experimental
In the theoretical case Log10F=C10+1.4Log10Sv based on Figure 10 where C10 is a constant. Therefore, F=C11*Sv1.4 with r2 value of 0.94. In the experimental case the relationship between F and Sv is log 10 (F) =C10+1.7Log10 (Sv) where C10 is a constant, based on Figure 10b. Therefore, F=C11*Sv1.7 where C11 is a constant, with an r2 value of 0.92.
Change in horizontal stiffness parallel to motion
Figure 11: Theoretical Log10 (F) against log10 (Spl) where stiffness of horizontal members varies parallel to horizontal deflection
Mutala: Modeling Natural Frequencies of Vibration of Three Dimensional Frames under Two Dimensional Loading (71-92)
Page 84 Volume 5, No 1/2016 | AJASE
Figure 11b: Experimental Log10(F) VS Log10(Spl) for motion parallel to change in horizontal stiffness
In the theoretical case Log10F=C15-1.59Log10Spl where C15 is a constant based on Figure 11. Therefore, F=C16/(Spl1.59) with an r2 value of 0.96. In the experimental case the relationship between log10 (F) and Log10 (Spl) is shown in Figure 11b.The relationship is: log10(F)=C15-1.83*Log10(Spl) where C15 is a constant. Therefore F=C16/((Spl)1.83) with an r2 value of 0.58 .
Change Horizontal Member Stiffness Perpendicular to motion
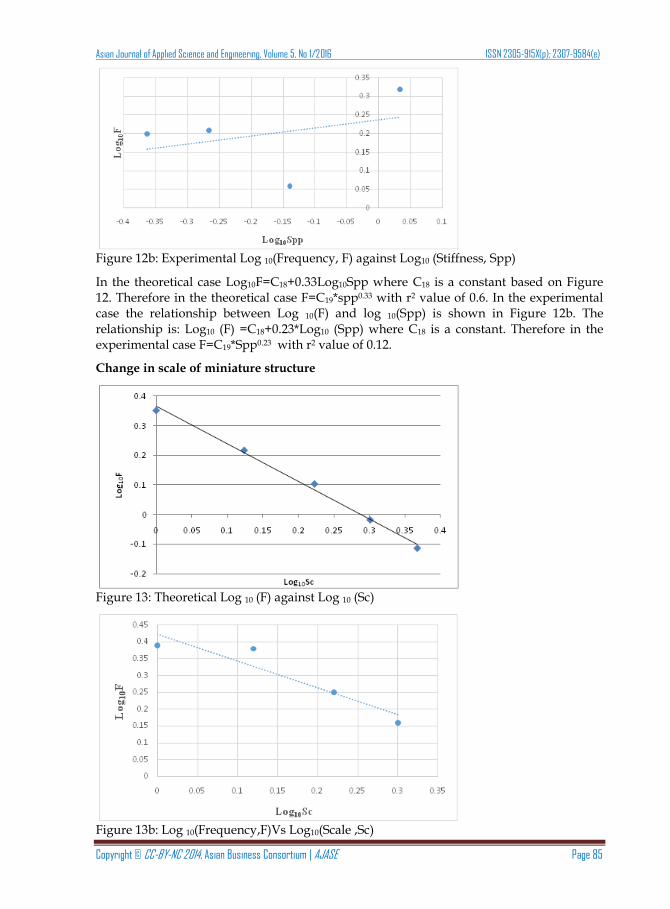
Figure 12: Theoretical Log10(F) against Log10(Spp) where stiffness of horizontal member stiffness varies perpendicular to motion.
Asian Journal of Applied Science and Engineering, Volume 5, No 1/2016 ISSN 2305-915X(p); 2307-9584(e)
Figure 12b: Experimental Log 10(Frequency, F) against Log10 (Stiffness, Spp)
In the theoretical case Log10F=C18+0.33Log10Spp where C18 is a constant based on Figure 12. Therefore in the theoretical case F=C19*spp0.33 with r2 value of 0.6. In the experimental case the relationship between Log 10(F) and log 10(Spp) is shown in Figure 12b. The relationship is: Log10 (F) =C18+0.23*Log10 (Spp) where C18 is a constant. Therefore in the experimental case F=C19*Spp0.23 with r2 value of 0.12.
Change in scale of miniature structure
Figure 13: Theoretical Log 10 (F) against Log 10 (Sc)
Mutala: Modeling Natural Frequencies of Vibration of Three Dimensional Frames under Two Dimensional Loading (71-92)
Page 86 Volume 5, No 1/2016 | AJASE
In the theoretical case, based on Figure 13, Log10F=C20-1.24Log10Sc where C20 is a constant. Therefore in the theoretical case F=C21/(Sc1.24) with r2 value of 0.99. In the experimental case, the relationship between log10(F) and Log10(Sc) is shown in Figure 13b. The relationship is: Log 10(F)=C20-0.9Log10(Sc) where C20 is a constant. Therefore in the experimental case for varying scale models, F=C21/(Sc0.9) with r2 value of 0.98 where C21 is a constant.
RELATIONSHIP BETWEEN THE EXPERIMENTAL AND THEORETICAL VALUES
The theoretical values of natural frequencies had the same trend of variation with number of bays and stiffness as the experimental. However the experimental values were higher in most cases.
Relationship between Theoretical and Experimental results for unbraced 1 bay miniature structures The graph below shows the relationship.
Figure 14: Comparison of Theoretical and Experimental frequencies for unbraced 1 bay structure
The experimental values of natural frequencies for 1 bay unbraced frames were lower than the theoretical values as shown in Figure 14. However, the frequencies for experimental case are expected to be lower than the theoretical ones due to damping. There was positive correlation between the two sets of values. The correlation coefficient was 0.99.
Relationship between Theoretical and Experimental results for braced 1 bay miniature structures
The graph below shows the relationship.
Figure 15: Comparison of Theoretical and Experimental frequencies for braced one bay structure
Asian Journal of Applied Science and Engineering, Volume 5, No 1/2016 ISSN 2305-915X(p); 2307-9584(e)
The experimental values of natural frequencies for one bay braced frames were lower than the theoretical values as shown in Figure 15. Section 4.3 discusses the difference, which is mainly due to errors. However, the frequencies for the experimental case frequencies are expected to be lower than the theoretical ones due to damping. There was a positive correlation between the two sets of values. The correlation coefficient was 0.99.
Relationship between Theoretical and Experimental results as the number of bays increased in the direction of motion.
The experimental values of vibration frequency were mostly lower than the theoretical values as the number bays increased in the direction of motion as shown in Figure 16. However the experimental case frequencies are expected to be lower than the theoretical ones due to damping. There was positive correlation between the two sets of values. The correlation coefficient was 0.99.
Figure 16: Comparison of Theoretical and Experimental frequencies as the number of bays increased for unbraced Models (Motion in stiffer direction).
Relationship between Theoretical and Experimental results as the Number of bays increased in the direction perpendicular to Motion
Figure 17: Comparison of Theoretical and Experimental frequencies as number of bays increased for unbraced miniature structures (Motion in less stiff direction).
Mutala: Modeling Natural Frequencies of Vibration of Three Dimensional Frames under Two Dimensional Loading (71-92)
Page 88 Volume 5, No 1/2016 | AJASE
The experimental values of natural frequencies, as number bays increased in one direction, were generally lower than the theoretical values as shown in Figure 17. However, the experimental case frequencies are expected to be lower than the theoretical ones due to damping. There was a positive correlation between the two sets of values. The correlation coefficient was 0.99.
Relationship between Theoretical and Experimental results as stiffness of columns increased
The experimental values of natural frequencies were lower than the theoretical values as shown in Figure 18. Sources of Error section discusses the difference, which is mainly due to errors. However, the experimental case frequencies are expected to be lower than the theoretical ones due to damping. There was a positive correlation between the two sets of values. The correlation coefficient was 0.98.
Figure 18: Comparison of Theoretical and Experimental frequencies as column stiffness increased for unbraced Models.
Relationship between Theoretical and Experimental results as stiffness of horizontal Members increased parallel to the initial force direction
The graph below shows the relationship.
Figure 19: Comparison of Theoretical and Experimental frequencies as the stiffnesses for horizontal members parallel to initial force direction increased.
Asian Journal of Applied Science and Engineering, Volume 5, No 1/2016 ISSN 2305-915X(p); 2307-9584(e)
The experimental values of natural frequencies were lower than the theoretical ones as shown in Figure 19. Sources of Error section discussed the difference, which is mainly due to errors. However, the experimental case frequencies are expected to be lower than the theoretical ones due to damping. There was a positive correlation between the two sets of values. The correlation coefficient was 0.88
Relationship between Theoretical and Experimental results as stiffness of horizontal increased perpendicular to initial force direction
Figure 20 shows the experimental values of natural frequencies were lower than the theoretical ones. Sources of Error section discusses the difference, which is mainly due to errors. However, the experimental case frequencies are expected to be lower than the theoretical ones due to damping. There was a positive correlation between the two sets of values. The correlation coefficient was 0.97.
Figure 20: Comparison of Theoretical and Experimental frequencies as the horizontal member stiffnesses increased perpendicular to initial force direction.
Relationship between Theoretical and Experimental results as the scale factor increased
Figure 21: Comparison of Theoretical and Experimental frequencies as scale factor increased.
Mutala: Modeling Natural Frequencies of Vibration of Three Dimensional Frames under Two Dimensional Loading (71-92)
Page 90 Volume 5, No 1/2016 | AJASE
The experimental values of natural frequencies were higher than the theoretical values as shown in Figure 21. Sources of Error section discusses the difference, which is mainly due to errors. There was a positive correlation between the two sets of values. The correlation coefficient was 0.99.
Most of the r2 values for the theoretical case were better than the corresponding ones for the experimental. Moreover, the experimental frequencies are reduced by damping. Since there was an input of a large quantity of data, errors may have occurred leading to some of the difference between the theoretical and experimental values. It is better to adopt a formula based on an average of the two methods.
Sources of Error The sources of error in the experiments are the following.
Due to errors in making miniature structures
Due to inaccuracies in reading the wave lengths from data logger
It was assumed that damping was zero but in reality there was some damping even from the air around and internal structural damping. The damping reduced experimental frequencies.
Data entry errors in the theoretical case as input of a large quantity of data were done.
CONCLUSIONS AND RECOMMENDATIONS
Conclusions
The study was found the following relationships:
The relationship between natural frequency, F, and Height of structure, H, for given column and beam length or column and beam stiffness as: F=C2/H0.735 which is an average between the theoretical and experimental value.
The relationship between natural frequency, F, and the number of bays, parallel to motion, Npr, as F=C10*(Npr
0.74) which is an average between the theoretical and experimental value.
The relationship between natural frequency, F, and number of bays, perpendicular to motion, Npp, as F=C6*((Npp)0.445)which is an average between the theoretical and experimental value.
The relationship between natural frequency, F, and stiffness of vertical members, Sv, as F=C11*(Sv1.55) which is an average between the theoretical and experimental value.
The relationship between natural frequency, F, and stiffness of horizontal members parallel to motion, Spl, as F=C16/(Spl
1.71) which is an average between the theoretical and experimental value.
The relationship between natural frequency, F, and stiffness of horizontal members perpendicular to motion, Spp, as F=C19*(Spp
0.28) which is an average between the theoretical and experimental value.
Therefore, a comprehensive formula for the natural frequency of vibration for unbraced structures is F=C*(1/H0.735)*(Npr
0.74))*(Npp0.445)*(Sv
1.55)*(1/(Spl1.71))*Spp
0.28 where C is a constant depending on material type. This equation is based on an average of the theoretical and experimental model.
In the theoretical case by taking a particular case where there is 10 storeys unbraced model of 150mm long members, H=1500mm, Npr =1, Npp=1, Sv=0.72mm3, Spl =0.72mm3, Spp=0.72mm3 and frequency=1.73 Hertz, gives an approximate value of C=389 in the case
Asian Journal of Applied Science and Engineering, Volume 5, No 1/2016 ISSN 2305-915X(p); 2307-9584(e)
of steel structures. In the experimental case taking the same parameters of a structure frequency=1.58 Hertz and C= 354. Therefore average value of C=371.The formula is in line with the existing literature on natural frequencies. However no formula has been given like this before.
Recommendations
There is need to conduct further studies for other modes of vibrations and more bays in both directions. There is also need to determine the K value for other materials other than steel. There is need to conduct further research using Finite Element Method where deflections at centre of mass are estimated more accurately. Moreover, data should be gathered of earthquake frequencies in various geographical regions to guide design against resonance of structures to earthquake vibrations.
REFERENCES
Aktan, A. E. Et al., 1997. Structural Identification for Condition Assessment. ASCE, 123 (12), pp. 1674-1684.
Arakawa, T. & Yamamoto, K., 2004. Frequencies and Damping ratios of a Highrise building Based on Micrometer measurement., Canada: World Conference on Earthquake Engineering.
Awkar, J. C. & Lui, E. M., 1997. "Seismic analysis and response of multistory semirigid frames". Journal of Engineering Structures, 21(5), pp. 425-442.
Baker, R. M. & Puckett, J. A., 1997. The design of Highway Bridges. NewYork: John Wiley and Sons, Inc.
Beck, J. L. & Jennings, P. C., 1980. Structural identification using linear models and earthquake engineering records. Earthquake Engineering and Structural Dynamics 1980, Issue 8, pp. 145-160.
Bertero, V., 1989. Lessons Learned from the 1985 Mexico Earthquake., El Cerrito, CA: Earthquake Engineering Research Institute.
Clinton, J. F., Bradford, S. C., Heaton, T. H. & Favela, 2006. The Observed Wander of natural frequencies. Bulletin of the Seismological, p. 237.
Dutta, P. K., Ghosh, A. K. & Agarwal, B. L., 2002. Dynamic response of structures subjected to tornado loads by FEM. Journal of Wind Eng. And Ins. Aerodynamics 90, pp. 55-69.
Gerre, J. M. & Good, B. J., 2008. Mechanics of Material., s.l.: USA:CengageLearning.
Ishizaki, H. & Chiu, A. N. L., 1974. Wind effects on structures, Tokyo: University of Tokyo.
Jacobsen, L. S., 1958. Engineering Vibrations.. London: McGrawHill.
James, M. L., Smith, G. M., Wolford, J. C. & Whale, 1989. Vibration of Mechanical and Structural Systems. UK: Harper Row.
Jeary, A. P., 1986. Damping in tall buildings – a mechanism and a predictor. Earthquake Engineering and Structural Dynamics, pp. 14: 733-750.
Maurice, P., 1990. Introduction to finite element vibration analysis, U.K: Cambridge University Press.
Moore, J. R. & Maguire, D. A., 2003. Natural sway frequencies and damping ratios of trees. UK: Springer-Verlag.
Navarro, M. et al., 2004. “ Expected Ground-R.C. Resonance Phenomenon in Granada City”. s.l., s.n., p. 3308.
Ozyigit, H. A., 2002. Vibration and Buckling of Plate Structures, USA: American Academy of Mechanics.
Schilling, D. R., 2013. Bangladesh Factory Collapse. Toronto: E.F.Schilling & Sons.
Shih, H. W., 2009. Damage Assessment in Structures using Vibration Characteristics, UK: QueenslandUniversity of Technology.
Snowdon, J. C., 1968. Vibration and Shock in Damped Mechanical Systems. New York: John Wiley and Sons.
Tamura, Y., Shimada, K. & Hibi, K., 1993. "Wind response of a tower". Journal of Wind Engineering and Industrial Aerodynamics, Volume 50, pp. 309-318.
Mutala: Modeling Natural Frequencies of Vibration of Three Dimensional Frames under Two Dimensional Loading (71-92)
Page 92 Volume 5, No 1/2016 | AJASE
Thomson, W. T., 1993. Theory of Vibration with Applications. UK: Nelson Thornes.
Ugural, A. C., 1999. Stress in Plate and Shells. NewYork: McGraw-Hill.
Vasilopoulos, A. A. & Beskos, D. E., 2009. Seismic Analysis of Plane steel frames by the Damage Theory. Greece: Springer.
Vekteris, V., Kilikevičius, A., Mokšin, V., & Gedvila, A. (2014). Investigation of the Efficiency of Vibro-Isolating Supports of Optical Tables. Asian Journal Of Applied Science And Engineering, 3(1), 18-23.