The INL is a U.S. Department of Energy National Laboratory operated by Battelle Energy Alliance INL/EXT-13-30267 Modeling of Late Blooming Phases and Precipitation Kinetics in Aging Reactor Pressure Vessel (RPV) Steels Yongfeng Zhang Pritam Chakraborty S. Bulent Biner September 2013
Transcript
The INL is a U.S. Department of Energy National Laboratory operated by Battelle Energy Alliance
INL/EXT-13-30267
Modeling of Late Blooming Phases and Precipitation Kinetics in Aging Reactor Pressure Vessel (RPV) Steels
Yongfeng Zhang Pritam Chakraborty S. Bulent Biner
September 2013
DISCLAIMERThis information was prepared as an account of work sponsored by an
agency of the U.S. Government. Neither the U.S. Government nor any agency thereof, nor any of their employees, makes any warranty, expressed or implied, or assumes any legal liability or responsibility for the accuracy, completeness, or usefulness, of any information, apparatus, product, or process disclosed, or represents that its use would not infringe privately owned rights. References herein to any specific commercial product, process, or service by trade name, trade mark, manufacturer, or otherwise, does not necessarily constitute or imply its endorsement, recommendation, or favoring by the U.S. Government or any agency thereof. The views and opinions of authors expressed herein do not necessarily state or reflect those of the U.S. Government or any agency thereof.
INL/EXT-13-30267Revision 0
Modeling Of Late Blooming Phases And Precipitation Kinetics In Aging Reactor Pressure Vessel (RPV)
Steels
Yongfeng Zhang,Pritam Chakraborty
S. Bulent Biner
September 2013
Idaho National LaboratoryIdaho Falls, Idaho 83415
http://www.inl.gov
Prepared for theU.S. Department of EnergyOffice of Nuclear Energy
Under DOE Idaho Operations OfficeContract DE-AC07-05ID14517
iii
ABSTRACTThe reactor pressure vessel, RPV, houses the reactor core and because of this function it has direct
safety significance. The RPV is considered to be irreplaceable or prohibitively expensive to replace, which means that if the RPV degrades sufficiently it could be the operational life-limiting feature of a nuclear plant.
In general, there are three main contributors in service embrittlement:
Damage evolution in the form of vacancy and self interstitial atom (SIA) and clusters as a result of displacement cascades.
Segregation of alloying elements Cu, Ni, Mn and Si, forming 2-3 nanometer clusters/precipitates and possible segregation of P to the grain boundaries.
Environmental variables, irradiation dose, and dose rate and temperature.
Currently, the RPV integrity is assessed using a fracture mechanics approach based on:
1. The development of a Master Fracture Toughness Curve (ASME Code Case N-631 Section III).
2. The determination of the ductile-brittle transition temperature shift in the master fracture toughness curve during in service.
The determination of this temperature shift is the prime importance in ensuring the structural integrity of the RPVs. This is accomplished through surveillance programs, accelerated irradiation experiments (PIA), and followed by the statistical modeling of the surveillance and PIA database by non-linear and least-square regression analysis, such as the EONY model, which are valid for only available data set.
To extend these current approaches beyond the scope of the surveillance test program is a challenge because of the scarcity of the future data. Currently, there is not enough experimentally generated data to assess with a high degree of certainty that current embrittlement trend curves, developed from the nuclear power plants, can be extrapolated to beyond 40 years. The reasons for this are:
There is a clear need to establish, whether or not the additional damage mechanisms which were not been observed so far, appear at higher influences. There are now indications of late segregations of Ni, Mn and Si (so called late blooming phases) near the end of 40 years in service.
Most of the databank on RPVs embrittlement has been obtained from the specimens irradiated in test or experimental reactors, as opposed to irradiations performed as part of power reactor surveillance programs. Many of the test reactor specimens have been exposed to fluences far higher than anticipated, even at or beyond 80 years of operation. However, because of the accelerated exposure achieved in test reactors versus power reactors, the concerns persist that the different damage mechanisms may be active in these different reactor environments. If it is true, this definitely would make test reactor data an unreliable predictor for the power reactor embrittlement.
There are inconsistencies with the master curve approach, where the measured and predicted behaviors sometimes do not agree. This is typically in situations where one or more of the basic assumptions (usually either the fracture mode or homogeneity) are not satisfied, and application of the Master Curve required extrapolation outside the scope of the basic model. Therefore, more data is needed to demonstrate the true transition behavior and its dependency on high influence regime.
Understanding of thermal aging effects is not very pronounced currently; however, there is a need for assurance for beyond 40 years operations so that it will not present itself as another embrittlement mechanism.
The use of miniature-reconstituted samples to extend the original surveillance program beyond the last capsule may provide a pathway to determine some of the properties and to mitigate the above
iv
concerns for the future. On the other hand, it is well known that sub-size (miniature) samples provide an over estimation of the fracture toughness in comparison to the ones obtained from the standard samples.
From above, it is clear that only viable alternative appears to be to resort to the predictive modeling methodologies for the RPVs embrittlement along with the limited experiments. This is the approach taken in our current vision. We are familiar with the similar program named PERFECT-60 in Europe. Although, our vision is conceptually similar; however, it significantly differs in terms of modeling algorithms and details from ours.
In this report we summarize our modeling efforts in two sections, each having its own introduction, methodologies, results and conclusions. These sections are:
Section-I: The objective is in here to develop a modeling and simulation paradigm that will provide the quantitative information for the microstructural evolution and reaction kinetics (i.e., formation of solute clusters in the form of precipitation/segregation of Cu, Ni, Mn and P, so called the late blooming phases) in RPV steels. An accurate quantitative modeling requires the fundamental understanding of unit processes taken place at the atomic scale such as nucleation events and their early stable growth kinetics; and their collective and collaborative behavior with the dislocations and self-interstitial atom, SIA loops. In FY-2013, we concentrated our efforts on the development of atomistic simulation algorithms. Eventually, these information will be utilized in mesoscale modeling, so that the simulations of larger spatial and longer temporal scales that are relevant to services life can be achieved.
Section-II: The objective of this task is to develop a virtual fracture toughness testing paradigm with which the degradation of RPV steels (i.e. the shift in DBT curves) will be estimated with a high degree of certainty based on the microstructural information and the hardening behaviors estimated through the algorithms developed in Section-I. These modeling efforts require not only development of accurate constitutive models with the relevant physical parameters for the fracture, but also an accurate crack extension modeling from just numerical framework of finite element modeling, so that the fracture toughness values obtained will be accurate and faithful to the underlying physics.
Finally, we will present our overall summary and the list of publications and presentations resulting from this current work.
MODELING OF PRECIPITATION KINETICS AND AGING IN RPV STEELS
1. IntroductionThe integrity of reactor pressure vessels (RPVs) is one of the safety factors that limit the service life
of current light water reactors [1-4]. In these reactors, the RPVs are usually made of low-alloy steels of body-center-cubic (bcc) ferritic phase with Mn, Ni, C, and Si being the primary alloying elements and Cu being either an alloying element or an impurity. During their prolonged service, usually on the order of tens of years, RPVs are subject to both high temperature (about 300 C) and radiation damage induced by fast neutrons. Long time thermal aging leads to the formation of precipitates of alloying elements, particularly Cu, which is almost insoluble in bcc-Fe. On the other hand, neutron radiation produces lattice defects such as vacancies and self-interstitial-atoms (SIAs) and their agglomerates including voids anddefect loops. Both the precipitates and lattice defects will impede the dislocation motion, resulting in hardening and consequent embrittlement of RPV steels.
Depending on the chemical composition, two types of precipitates have been characterized in RPVsteels, namely the Cu-rich precipitates (CRPs) in steels containing high-Cu concentrations and the Mn/Ni-rich precipitates (MNPs), i.e., the so-called late-blooming-phases, in low- to no-Cu-containing steels [3].The formation of CRPs has been considered as the primary cause for RPV embrittlement. The effect of MNPs, which form at high neutron fluence with longer incubation time, is currently less understood.Both types of precipitates share the same lattice structure with the bcc matrix when their sizes are small. As their sizes grow beyond a certain critical size, the CRPs experience a bcc to face-centered-cubic (fcc)phase transition [5]. However, regardless of their crystalline structures, all precipitates are obstacles to dislocation motion and thus cause hardening and embrittlement. During in service, the precipitation of alloying elements and the formation of lattice defects take place at the same time. The radiation-induced lattice defects can cause hardening and embrittlement just by being obstacles to dislocation motion. Furthermore, the irradiation-induced point defects enhance the diffusion of alloying elements, thus accelerating the precipitation kinetics. Extended defects formed by clustering of point defects, includingvoids and defect loops as observed in experiments, may act as preferential nucleation sites for the precipitates, in particular MNPs that are usually seen at high neutron fluence. In a combined experimental and modeling study, SIA loops have been shown to play an important role in the formation of CRPs [6]. On the other hand, the presence of alloying elements may also change the formation and growth kinetics of extended lattice defects. For instance, transmission-electron-microscopy (TEM) analysis has shown that the presence of alloying elements may delay the growth of SIA loops, resulting in smaller average size and narrower size distribution [7].
The hardening and consequent embrittlement RPV steels originate from the changes in the microstructure, i.e., precipitation and radiation damage. Both processes take place via atomic events such as diffusion and displacement of atoms. Accurate quantitative modeling requires a fundamental understanding of unit processes taking place at the atomic scale, such as nucleation events and their early stable growth kinetics, as well as their collective and colloborative behavior with the dislocation,vacancy, and SIA loops. The microstructural features responsible for the property degradation are usually ranges in sizes of a few to tens of nanometers. For a predictive description, the nature and the associated spatial dimensions call for fundamental studies at the atomic scale, e.g., via the ab-initio density-functional-theory (DFT) calculations, molecular dynamics (MD), and Metropolis Monte Carlo (MMC) with empirical interatomic potentials, Lattice Monte Carlo (LKMC), or Atomic Kinetic Monte Carlo (AKMC) simulations.
In this section, we summarize our progress at the atomic scale during FY2013.
2
1.1 Method developmentThe principal work at the atomic scale is to develop a predictive quantitative model for the
microstructure evolution of RPV steels under thermal aging and neutron radiation. We have developed an AKMC method for the precipitation kinetics in bcc-Fe, with Cu, Ni, Mn, and Si being the alloying elements. In addition, we used MD simulations to provide input parameters (if not available in literature). MMC simulations were also carried out to explore the possible segregation/precipitation morphologies at the lattice defects. First we briefly describe each of the simulation algorithms, then we present our results.
1.1.1 Molecular dynamics (MD):MD simulations determine the trajectories of atoms by numerically solving the Newton’s equation of
motion for a system consisting of interacting atoms. The force acting on each atom is given by the inter-atomic potential, i.e., the force field, which governs the interaction of each atom with its surrounding neighbors. In our studies, MD simulations were performed using the simulation package LAMMPSdeveloped at Sandia National Laboratory [8]. For the interatomic potential we used the embedded-atom-method (EAM) type potential developed by Bonny et al. for the Fe-Cu-Ni system [9]. This potential was derived from the Mendelev potential [10] for bcc-Fe, the Voter potential for fcc-Ni [11], and the Mishin potential [12] for fcc-Cu. The cross terms for Fe-Cu, Fe-Ni and Ni-Cu were given in Pasianot et al. [13], Bonny et al. [14], and Bonny et al. [9] respectively. The Bonny potential was “developed in such a way that both the alloy’s (Fe-Ni and Fe-Cu) thermodynamic properties and the interaction between solute atoms and point-defects are properly reproduced, compared to, respectively, the experimental phase diagram and DFT calculations” [9]. One of the primary motivations to develop this potential is to study of the hardening and embrittlement of RPV steels. Therefore, it was chosen as the inter-atomic potential in our present work.
1.1.1.1 Metropolis Monte Carlo (MMC):MMC simulations are used to explore the possible precipitation morphologies, owing to the slow
kinetics, which may not be accessible with MD and AKMC simulations. To take the advantage of the large empirical potential database in LAMMPS, the MMC method used in this project is implemented as user-defined subroutines to LAMMPS with three different MMC moves namely [15]:
1) Random translation of atoms, based of the probability p = exp(-total potential energy induced by the move. K is Boltzmann constant and T temperature.
2) Swapping the positions of randomly selected two different atom types based on the probability p = exp(- o enhance the mass transport without changing the global composition.
3) Changes the type of a randomly selected atom to a desired type, to mimic a chemical interaction that changes the global composition.
Our algorithm is designed in such a way that the MC moves can be used in NVT or NPT ensembles.
1.1.2 Atomic Kinetic Monte Carlo Model (AKMC):The development of the AKMC model for the Fe-based alloy systems was the primary task at the
atomic scale simulations for FY2013. Therefore, it is given some more details in here. Our code development is based on the SPARKKs simulation package that uses the MPI framework developed at Sandia National Laboratory [16]. In the AKMC model [17], the microstructure of the system evolves by the jump of mobile atoms (or vacancies) within a predefined rigid-lattice framework. Off-lattice motions are currently not allowed in this algorithm. The kinetics, i.e., time evolution, can be achieved using thelist of events, e.g., jump of i of each event given by:
3
(1)
Here vi is the attempt frequency of the i-th event; is the activation barrier; T is the temperature and kB is the Boltzmann constant. In each AKMC step, one event is chosen from the list by a weighted random selection to evolve the microstructure, therefore it is much more efficient than the MCC method, and the corresponding time increment is given by:
(2)
Ideally, all the possible events should be included in the event list in order to achieve the correct kinetics. Furthermore, accurate attempt frequencies and activation barriers are required to obtain the correct time. The attempt rates and activation barriers can be calculated using atomistic simulations such as MD simulations or by fitting to the nominal diffusion coefficients in the materials system. To account for the environment dependence of the activation barrier, we used the Final-Initial-System-Energy (FISE) method [17] to update the activation barrier for each KMC event based on the local atomic configurations. In the FISE method, the effective activation barrier is given by:
(3)
In the equation E0 is a constant, usually the activation barrier in the pure metallic matrix. Ef and Eirepresent the final and initial system energies calculated by the broken bond mode:
(4)
Here means the bond energy between elements X and Y , e.g., fcc or bcc phases.The bond interactions are defined on nearest-neighbor (NN) atoms of different orders, depending on the complexity of the system. In our AKMC model, both the first-NN and second-NN interactions are included. The bond energies, as defined in Vincent et al. [18], are fitted to many relevant materials properties obtained from experiments or DFT calculations, including the cohesive energy and vacancy formation energy in bcc-Fe, heat of solution of alloy elements in bcc-Fe, and the binding energies between solute atoms and point-defects, e.g., vacancy-vacancy, vacancy-Cu, and Cu-Cu.
To simulate systems other than perfect bcc lattices, defects along with sink and source mechanisms are introduced for vacancies in our current implementation of the AKMC model. Once a vacancy reaches a sink, it will transform into the matrix element. The types of sinks added include 1D (dislocations or loops), 2D (interfaces), and 3D (spherical) entities. The source term is added as a reaction that converts element A to element B, with an input thermal barrier and a target number of element B. The reaction is turned on if the current number of element B is below target, and off if it’s beyond. The reaction takes place only at specified lattice sites representing the sources. The sink and source functions are demonstrated using a simulation cell of 144,000 atoms with no vacancies initially in Fig.1. A sink of octagon in shape is added with the sink radius of 2.0 a0, where a0 is the lattice constant. Lattice sites not included in the sink region are assigned as vacancy sources to maintain a vacancy number of 200 during the simulation. The simulation runs for 10,000 KMC steps at the temperature of 0.2 eV. The sink mechanism is turned on when the number of vacancies is below the target, and the source mechanism is turned on when it is beyond. As shown in Fig.1a, the number of vacancies quickly reaches to 200 after the simulation starts. Due to the introduction of the sink, vacancies were absorbed by the sink at aconstant rate. However, the number of vacancies remained almost constant (200) by the sink/source mechanisms during the course of the simulation. The small fluctuations seen are owing to the on/off reaction events. Both the current vacancies and those absorbed at the sink are shown in Fig. 1b. The
)/exp( TKE Bmiii
miE
1)(i
it
2/)(0 ifm EEEE
)(, ji
YXtotalE
YX
4
current vacancies are randomly distributed with a few clusters. The absorbed vacancies depict the shape of the sink.
Fig. 1. (a) number of mobile and absorbed vacancies as functions of KMC steps; (b) atomic configuration at 10000 KMC step. Blue atoms represent vacancies absorbed by the sink and red atoms represent currently mobile ones in the system.
In addition to the sink and source mechanisms, the elastic interactions between solute atoms and dislocations and defect loops are also incorporated into the current AKMC model. As will be shown later, the elastic interaction is a dominant factor for the interaction between dislocation (loops) and solute atoms, and it can be well described using the linear-elastic theory. This interaction is given by E
b
[19]. P is the by replacing a matrix atom with a substitutional solute atom. Positive pressure means tension and negative means compression. Therefore, oversize solute atoms such as Cu will be attracted at the tensile regions and repelled at the compressive regions. In our AKMC model, the pressure P due to presence of lattice defects (i.e., dislocations, vacancy and SIA loops) is numerically computed using the Stroh formalism in linear-elastic theory [20]. In the calculations, we use cubic symmetry for bcc-Fe. The elastic moduli were taken as c11 = 243 GPa, c12 = 143.5 GPa and c44 = 116 GPa. As shown in Fig.2a, the pressure given by the Stroh formalism agrees very well with that calculated by the MD simulations using the Mendelev potential [10]. As will be shown later, the long-range elastic interaction will affect the precipitation of Cu both kinetically and thermodynamically.
5
Fig. 2. Atomic stress as a function of vacancy loop radius from MD and KMC (Stroh formalism) calculation for a spherical SIA loop. The loop radius is 2.0 nm.
1.2 Results and Discussion1.2.1 Segregation energies from MD simulations
In this section, the interaction between Cu and lattice defects will be elucidated by calculating the interaction energies using MD simulations. The lattice defects considered in this study include point-defects, edge and screw dislocations, SIA and vacancy loops, and void. For point defects, the binding energy is defined as the energy required to dissociate the two defects. For other extended defects, the segregation energy is defined as the difference in energy of a solute atom occupying a segregation site with that of a regular solute. The binding energy can be taken as the segregation energy with the opposite sign. Therefore, positive binding (negative segregation) energy represents attraction, and negative binding (positive segregation) energy represents repulsion.
1.2.1.1 Cu/Point-defects interaction The interactions of Cu with a point-defect or another Cu atom were found to be short range within
about 2 a0. As shown in Fig.3, a Cu atom is attracted by a vacancy, V, or another Cu atom. The maximum binding energies for Cu-V and Cu-Cu were found to be about 0.10 and 0.08 eV respectively at
In contrast, the Cu-SIA interaction was found to be repulsive. The strongest repulsion was obtained with Cu being one of the split dumbbell atoms. Due to the attractive interaction between Cu atoms, a strong precipitation tendency of Cu is expected in bcc-Fe, in accordance to the very low solubility. These results are shown in Fig.3 and they are in good agreement with previous DFT calculations [21]. The results indicate that, while under radiation, Cu atoms prefer to cluster with vacancies, leading to enhanced diffusion and nucleation of precipitates. On the other hand, SIAs will have less effect on Cu diffusion and precipitation. It is also expected that they will recombine with vacancies and affect the overall vacancy concentration.
6
Fig.3. Binding energies of a Cu solute atom with a point defect or another Cu solute atom, as functions of distance.
1.2.1.2 The role of dislocationsThe dislocations considered here were straight with infinite length with pure edge or screw characters.
The Burgers vectors were taken as ½<111> for both. Unlike point defects for which the interactions with solute atom are usually short range, dislocations may interact with solute atoms in long range through the associated stress-fields. For edge dislocation, non-zero hydrostatic pressure present even at the long range with both tensile and compressive regions. As shown in Fig.4a, Cu is attracted by the tensile region (below the core) and is repelled by the compressive region (above the core). The absolute interaction energy decreases with increasing distance from the core; however, as can be seen, interaction energy is still not zero even at much longer distance. On the other hand, for screw dislocation, the interaction is short range within the core region, owing to the zero hydrostatic pressure resulting from the pure shear displacement field of screw dislocations. Cu is attracted at the core of screw dislocation, with a much weaker interaction than that for the edge dislocation.
The different results exhibited by edge and screw dislocations suggested that the solute interactions might be classified into the long-range interaction induced by the stress-field and short-range interaction from the dislocation core-effect. The elastic interaction can be described as E
b= [19]. The pressure
P can be calculated using the linear-elastic theory, e.g., using the Stroh formalism. The size mismatch can be obtained using MD simulations. In order to get the size mismatch of Cu in bcc-Fe, a few MD simulations were carried out in the present work, with the Cu concentration ranging from 0.0 to 10.0 atomic percent. Cu atoms were randomly inserted as substitutions. By determining the lattice constant, the average atomic volume V was obtained as a function of Cu concentration CCu. As shown in Fig.4b, V increases proportionally with CCu. A l Cu)=V0+CCu 0(1+ 0.026CCu); here V0 is the atomic volume for bcc-Fe without Cu and it is 11.64Å3. Correspondingly, the size mismatch is determined to be V0.
7
Fig.4. and a screw (right) dislocation, with the atoms colored by segregation energies, (b) Lattice constant of bcc Fe as a function of Cu concentration, and (c) the segregation energies of Cu near an edge and a screw dislocation as functions of distances from the dislocation core. The solid and dash curves represent the linear-elastic estimation.
In Fig.4c, the segregation energies calculated from MD simulations are compared with the elastic interactions obtained from the linear-elastic theory. For screw dislocation, the elastic interaction is zero everywhere and the interaction is dominated by the core effect in the short-range. For edge dislocation, the elastic interaction varies with locations, with the maximum attraction along the and maximum repulsion along the . Here is the angle between the Burgers vector and the vector pointing from the dislocation core to the segregation site, projected onto the plane normal to the dislocation line-vector. The interaction is long-range with non-zero interaction energy at places far from the core. It is also interesting to note that the results from MD calculations agree well with the linear-elastic estimation, suggesting that the latter is the dominant effect. Indeed, the much weaker interaction energy given by screw dislocation indicates that the core-effect is less significant compared to the elastic effect. This conclusion is very important for the AKMC simulations where the core-effect is not included owing to the rigid-lattice assumption. The results also shows that the dominant long-range elastic interactions can be efficiently included into AKMC simulations by introducing a stress field given by the linear-elastic theory, as described in Section 1.2.3.
1.2.1.3 The effects of defect loops Dislocation loops have been widely observed in neutron radiated bcc-Fe or Fe-based alloys.
According to experimental observations, the loops may have either ½<111> or <100> burgers vector, residing on {111} or {100} crystallographic planes respectively [22]. In the following, only the results for {100} loops will be summarized. All loops considered here are assumed to be in circular in shape.
8
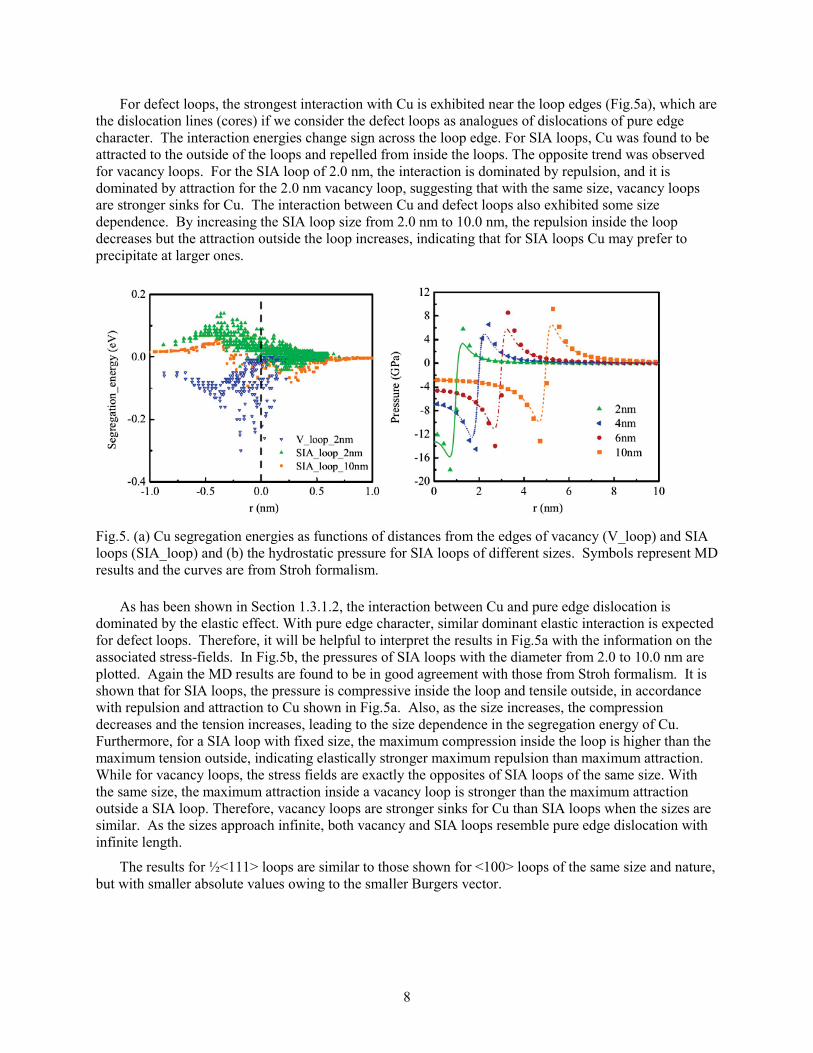
For defect loops, the strongest interaction with Cu is exhibited near the loop edges (Fig.5a), which are the dislocation lines (cores) if we consider the defect loops as analogues of dislocations of pure edge character. The interaction energies change sign across the loop edge. For SIA loops, Cu was found to be attracted to the outside of the loops and repelled from inside the loops. The opposite trend was observed for vacancy loops. For the SIA loop of 2.0 nm, the interaction is dominated by repulsion, and it is dominated by attraction for the 2.0 nm vacancy loop, suggesting that with the same size, vacancy loops are stronger sinks for Cu. The interaction between Cu and defect loops also exhibited some size dependence. By increasing the SIA loop size from 2.0 nm to 10.0 nm, the repulsion inside the loop decreases but the attraction outside the loop increases, indicating that for SIA loops Cu may prefer to precipitate at larger ones.
Fig.5. (a) Cu segregation energies as functions of distances from the edges of vacancy (V_loop) and SIA loops (SIA_loop) and (b) the hydrostatic pressure for SIA loops of different sizes. Symbols represent MD results and the curves are from Stroh formalism.
As has been shown in Section 1.3.1.2, the interaction between Cu and pure edge dislocation is dominated by the elastic effect. With pure edge character, similar dominant elastic interaction is expected for defect loops. Therefore, it will be helpful to interpret the results in Fig.5a with the information on the associated stress-fields. In Fig.5b, the pressures of SIA loops with the diameter from 2.0 to 10.0 nm are plotted. Again the MD results are found to be in good agreement with those from Stroh formalism. It is shown that for SIA loops, the pressure is compressive inside the loop and tensile outside, in accordance with repulsion and attraction to Cu shown in Fig.5a. Also, as the size increases, the compression decreases and the tension increases, leading to the size dependence in the segregation energy of Cu. Furthermore, for a SIA loop with fixed size, the maximum compression inside the loop is higher than the maximum tension outside, indicating elastically stronger maximum repulsion than maximum attraction. While for vacancy loops, the stress fields are exactly the opposites of SIA loops of the same size. With the same size, the maximum attraction inside a vacancy loop is stronger than the maximum attraction outside a SIA loop. Therefore, vacancy loops are stronger sinks for Cu than SIA loops when the sizes are similar. As the sizes approach infinite, both vacancy and SIA loops resemble pure edge dislocation with infinite length.
The results for ½<111> loops are similar to those shown for <100> loops of the same size and nature, but with smaller absolute values owing to the smaller Burgers vector.
9
1.2.1.4 The role of voids:Due to low solubility of Cu in bcc-Fe, void surfaces are expected to be preferential precipitation sites.
Indeed, MD calculations show that the binding energy of Cu at the surface of a 1.0 nm void can be ashigh as 0.75 eV, as shown in Fig.6. The interaction between Cu and voids is attractive and short-range within about one a0, followed by a slightly repulsive zone. Compared to other types of extended defects considered, voids are found to be the strongest sinks, indicated by the segregation energies plotted in Fig.6. Following voids, vacancy loops are shown stronger sinks than edge dislocation and the SIA loops. To summarize, vacancy type of defects are in general stronger sinks for Cu, which is oversize in bcc-Fe, than SIA type of defects. For defect with non-zero stress field, long-range elastic interaction presents and it dominates the interaction with Cu. For other defects, the interaction is short-range, usually within a couple of lattice constants.
Fig.6. Cu segregation energies at di erent lattice defects including edge dislocation, defect loops and void. The dash line shows the edges of defect loops and the void surface.
1.2.2 Heterogeneous precipitation from MMC simulations:The above results on segregation energies of all extended defects considered here indicate that they
can be preferential precipitation site of Cu. It is therefore of an interest to explore the precipitation morphology. Owing to the slow kinetics involved, we used MMC instead of MD to investigate the Cu precipitation behavior. For all MMC simulations, the Cu concentration of 1.0 atomic percent was used. This concentration is higher than in typical RPV steels, however, it was used in here in order to accelerate the precipitation process for the computational efficiency. In MMC simulations, both the translation and swap moves described earlier were performed. The translation move was used to relax the defect
The swap move can be regarded as the diffusion of Cu. It searches randomly in the the potential energy. For all the MMC simulations
were carried out for 5 million MC steps. However, in none of the simulations was the final thermal equilibrium reached. Nevertheless, the results obtained are sufficient enough to show the precipitation tendency.
10
2.5 million and (C) 5 million MMC steps. Cu atoms are show in blue and non-BCC Fe atoms in gray spheres which indicate the dislocation and the constrained layers at the top and the bottom of the simulation cell.
In Fig.7 the MMC simulation results for an edge dislocation are summarized. Due to the non-periodic each 1.0 nm thick, , no MMC moves
were performed.. Initially all Cu atoms were randomly distributed, and excludinglayers, they form clusters in 2.5 million MMC steps as shown in Fig.7a and b. Due to the repulsion in the compressive region (below the dislocation line), more Cu clusters (precipitates) were observed in the tensile region (above the dislocation line). Only one precipitate was found attached to the dislocation core. With more MMC steps, some small clusters dissolved and some relatively large ones kept growing in size by absorbing Cu atoms dissolved from the smaller clusters, showing an Oswald-ripening behavior(see Fig.7b and c). We note that in the MMC simulations the coalescence of clusters is suppressed because the di usion of Cu atoms takes place primarily by the swap move, which enhances the dissociation of Cu atoms from the clusters. The Cu clusters tend to develop a {110} faceting while growing in size, which has also been observed in previous studies in the literature.
Similar to edge dislocation, the precipitation of Cu around SIA loops is also influenced by the stress-field. To study the size e ect, two <100> SIA loops with diameters of 2.0 nm and 10.0 nm were simulated. For the 2.0 nm SIA loop, all precipitates were found to form in the matrix, without thesegregation/precipitation near the loop edges (see Fig.8a and c). This is because the interaction with Cu is dominated by repulsion, as shown earlier in Fig.5a. While for the 10.0 nm loop, clear precipitation of Cu with the non-bcc Cu atoms was observed at the loop edges (Fig.8d-f). The local Cu concentration near the loop edge was much higher than the average concentration of 1.0 atomic percent, indicating heterogeneous precipitation at SIA loops that are larger in size.
11
2.5 million and (c) 5 million MMC steps; and those for a 10.0 nm at (d) 0, (e) 2.5 million and (f) 5 million MMC steps. bcc-Cu atoms are show in blue; non-bcc Cu atoms are shown in yellow; and non-bcc Fe atoms (indicating SIA loops) are shown in gray spheres.
million and (c) 5 million MMC steps. bcc Cu atoms are show in blue; non-bcc Cu atoms are shown in yellow; and non-bcc Fe atoms (indicating the void) are shown in gray spheres.
Due to the high segregation energy, strong precipitation tendency was observed for voids. As shown in Fig.9, the surface of a 2.0 nm void was almost completely covered by Cu atoms in 2.5 million MMC steps. After 5 million MMC steps, the spherical void developed into a {110} faceted precipitates.
12
Oswald-ripening type behavior was also observed, with the small clusters dissolving and large ones growing in size. The precipitate formed at the void surface contained many more Cu atoms that in any other cluster, indicating strong heterogeneous precipitation behavior.
In general, the results obtained from the MMC simulations on the precipitation behavior are in agreement with the MD results on segregation energies. Heterogeneous precipitation was observed at locations with negative segregation energies, such as the exterior of the SIA loops with relatively large size and the surfaces of voids. The MMC results obtained from an empirical potential can be good validations for the results obtained from the AKMC simulations, where the defect configurations are not fully represented (i.e., dislocation cores) due to the rigid-lattice assumption, and also less accurate pair-wise interactions are used to describe the system.
1.2.3 Precipitation kinetics from AKMC simulations:Using our AKMC model described in Section 2.3, the precipitation kinetics of Cu and the effects of
edge dislocation and defect loops were investigated. In the AKMC simulations, periodic simulations cells with 2 million atoms were used, with the composition of Fe-1.34%Cu. In each simulation, one vacancy was introduced into the system, giving a nominal vacancy concentration of Cv of 5×10⁻⁷. The simulation temperature was 773K, at which the thermal equilibrium vacancy concentration is given by Ceq ~ exp(-Ef/KT)= 1.3×10⁻¹². For comparison, several parallel AKMC simulations are carried out for the following cases: (1) in addition to Cu, 1%Ni and 1.5%Mn, (2) a vacancy loop of 2.8 nm in radius, (3) a SIA loop of 2.8nm in radius, and (4) an infinitely long edge dislocation. The loops and dislocations were represented by their corresponding elastic stress-fields and they remained stationary during the course of the simulations.
To elucidate the kinetics, the volumetric density and average size of Cu precipitates are plotted in Fig. 10. To be consistent with previous modeling and experimental studies in the literature, here we also considered Cu clusters with 10 or more Cu atoms as precipitates. Compared to the only Cu being the alloying element, introduction of other alloying elements such as Ni and Mn was found to delay the precipitation kinetics, in terms of both reduced density and average size of the precipitated. It has been shown in previous AKMC study that the presence of Ni enhances the nucleation but impedes the growth of Cu clusters [23]. Indeed, if we consider all Cu clusters with 2 or more Cu atoms, the density was higher for the Cu-Ni-Mn case than that for Cu only. Ni and Mn require higher activation barriers and are less mobile than Cu. They are also attractive to Cu and act as nucleation sites for Cu precipitates, enhancing the nucleation. Meanwhile, clustering with Ni and Mn reduces the effective mobility of Cu atoms, delaying further growth of small Cu clusters via diffusion of Cu atoms. As a result, both the density and average size of Cu precipitates (10 or more Cu atoms) are reduced by the presence of Ni and Mn, as shown in Fig. 10.
Fig. 10: (a) Volumetric density (Ncrp) and (b) average size (<Rcrp>) of CRPs as functions of KMC
13
time.
Fig. 11 Atomic configurations of the system with an edge dislocation at (a) 0, (b) 0.03 and (c) 0.07 seconds in KMC time. Cu clusters with 20 or more atoms are shown in red and other Cu atoms in blue. Fe atoms are omitted for clarity. The position of the dislocation core is shown in (a).
The presence of edge dislocation may also reduce the density of Cu precipitates. However, the average size was found to be larger than that for the Cu-only case, as shown in Fig. 10b. Due to the associated stress-field, the nucleation and growth of Cu precipitates are suppressed in the compressive region, but on the other hand, enhanced in the tensile region. As shown in Fig.11a to c, the sizes of Cu clusters below the dislocation (tensile region) are much larger than those seen at the above (compressive region) of the dislocation line. At the time of 0.07 second (KMC time), all precipitates with 10 or more Cu atoms formed are below the dislocation line, with none above. The overall effect of edge dislocation results in reduced precipitate density and increased average size. Also, the distribution of precipitates shown in Fig. 11 from AKMC simulations is consistent with the results from MMC simulations shown earlier in Fig. 7.
In contrast, the effects of SIA and vacancy loops are less significant than those for edge dislocation, probably due to the relatively small size of the loops considered in here. For vacancy and SIA loops, similar effects are observed. Compared to the case of Cu only, introduction of defect loops leads to slight decrease in precipitate density, but slight increase in average size. Further study on the size effect is required to fully understand the effect of these defect loops.
1.3 ConclusionsFor the first year of the project to model the late blooming phases and precipitation kinetics in RPV
steels our efforts concentrated on the understanding of the atomic scale events which will be the foundations for mesoscale and continuum level modeling and simulations.
In summary:
1) We have used MD simulations to elucidate the interaction between Cu and lattice defects including point defects, dislocations, loops and voids, and used MMC simulations to explore the possible heterogeneous precipitation behavior. Two types of interactions, short-range interaction and long-range elastic interaction have been identified. The elastic interaction was found to be a dominant effect for dislocations and defect loops.
14
2) Based on the results from MD and MMC simulations, an AKMC model has been developed. On the basis of conventional AKMC model, sink/source mechanisms and elastic interaction are included to allow for heterogeneous precipitations at the extended defects.
3) Preliminary results of AKMC simulations show that alloy elements and lattice defects such as dislocation and defect loops significantly affect the evolution kinetics of CRPs which has not been considered in the previous studies available in the literature.
2. S.J. Zinkle and G.S. Was, Acta Mater. 61 (2013) 735–758.
3. G.R. Odette and R.K. Nanstad, JOM 61 (2009) 17–23.
4. E.D. Eason, G.R. Odette, R.K. Nanstad, T. Yamamoto, A Physically Based Correlation of Irradiation-Induced Transition Temperature Shifts for RPV Steels, Oak Ridge National Laboratory Report ORNL/TM-2006/530, 2007.
5. Y. U. Heo, Y. K. Kim, J. S. Kim, J. K. Kim, Acta Mater. 61 (2013) 519–528.
6. B. Radiget, A. Barbu and P. Pareige, J. Nucl. Mater. 360, (2007) 104-107.
7. E. Meslin, M. Lambrecht, M. Hernández-Mayoral, F. Bergner, L. Malerba, P. Pareige,B. Radiguet, A. Barbu, D. Gómez-Briceño, A. Ulbricht and A. Almazouzi, J. Nucl. Mater. 406 (2010) 73.
8.
9. S. Plimpton, J Comp Phys, 117 (1995) 1-19.
10. G. Bonny, R.C. Pasianot, N. Castin, and L. Malerba, Phil. Mag. 89, (2009) 3531-3546.
11. M.I. Mendelev, A. Han, D.J. Srolovitz, G.J. Ackland, D.Y. Sun and M. Asta, Phil. Mag. A 83 (2003) 3977.
12. Y. Mishin, M.J. Mehl, D.A. Papaconstantopoulos, A.F. Voter and J.D. Kress, Phys. Rev. B 63 (2001) 224106.
13. A.F. Voter and S.P. Chen, Mater. Res. Soc. Symp. Proc. 82 (1987) 175.
14. R.C. Pasianot and L. Malerba, J. Nucl. Mater. 360 (2007) 118.
15. G. Bonny, R.C. Pasianot and L. Malerba, Model. Simul. Mater. Sci. Eng. 17 (2009) 025010.
16. D. Terentyev, X. He, E. Zhurkin and A. Bakaev, J. Nucl. Mater. 408 (2011) 161–170
17. Crossing the Mesoscale No-Man's Land via Parallel Kinetic Monte Carlo, S. Plimpton, C. Battaile, M. Chandross, L. Holm, A. Thompson, V. Tikare, G. Wagner, E. Webb, X. Zhou, C. Garcia Cardona, A. Slepoy, Sandia report SAND2009-6226, October 2009.
18. Soisson, C.S. Becquart, N. Castin, C. Domain, L. Malerba and E. Vincent, J. Nucl. Mater. 406 (2010) 55–67
19. E. Vincent, C. S Becquart and C Domain, J. Nucl. Mater. 382 (2008) 154.
20. J. P. Hirth and J. Lothe, Theory of Dislocations (McGraw-Hill, New York, 1968).
21. Stroh, A.N., Philos. Mag. 3 (1958) 625–646.
22. P. Olsson, T. P. C. Klaver, and C. Domain, Phys. Rev. B. 81 (2010) 054102.
23. B. Yao, D. J. Edwards and R. J. Kurtz, J. Nucl. Mater. 434 (2013) 402.
15
24. Y. Wang, H. Y. Hou, X. B. Liu, R. S. Wang and J. T. Wang, http://arxiv.org/abs/1212.6900
25. Bacon, D. J., and Y. N. Osetsky, J. Nucl. Mater. 329-333 (2004) 1233.
16
Section 2:2. MODELING DUCTILE TO BRITTLE FRACTURE TRANSITION IN
RPV STEELS2.1 Introduction
There has been significant effort to model the different failure mechanisms that are active at different temperature regime in RPV steels. At lower temperatures, unstable failure by cleavage fracture is identified as the dominant failure mechanism. This is characterized by slip induced micro-crack formation at carbides and their extension into macroscopic cracks depending on the local deformation state and microstructure. Physics-based models have been proposed in [1-3] to explain these mechanisms of cleavage initiation in steel. However these models don’t relate cleavage initiation at a microscopic length scale to the fracture toughness. To develop such a correlation, a model has been proposed in [4], in which it is assumed that cleavage failure happens when crack tip stress ( f) exceeds a critical value over 1 or 2 grain diameters. However this model fails to capture the scatter in fracture toughness associated with cleavage failure. Modifications have been made to this model in [5] in which a critical volume ahead of the crack tip has been considered to explain the scatter in fracture toughness due to cleavage failure. A more rigorous statistical model has been proposed by Beremin [6] in which a Weibull distribution [7] is used to relate fracture stress to failure probability at lower and transition temperatures where cleavage fracture is the dominant mechanism. The Weibull parameters are obtained from fracture tests performed at lower temperatures and are assumed to be temperature independent. The temperature dependent variation of fracture toughness is considered by modifying the flow stress of the material. Analytical solutions and FE simulations with hardening plasticity are used to obtain crack-tip stress fields. Though this model has been fairly successful in capturing the scatter in fracture toughness at and near the lower shelf, it requires the modeling of stable crack growth near the transition regime to provide accurate results. Stable crack growth primarily takes place through void nucleation, growth and coalescence. By incorporating ductile damage models proposed by Rousselier [8] or Gurson [9] to simulate stable crack growth prior to unstable failure, improved predictions can be made. In [10-11] DBT using Charpy specimens have been performed using Rousselier model [8] in conjunction with Beremin model [6] to predict onset of cleavage failure. Modifications have been made to the Beremin model by introducing the effect of plastic strain and history of maximum principal stress to evaluate the critical Weibull stress. Irradiation effects have also been considered in their work. DBT of German low alloy pressure vessel (PV) steel using CT-specimens have been analyzed in [12] by considering a non-local Rousselier model [13] in conjunction with Beremin model [6]. The non-local model eliminates the mesh-dependency typically observed in local strain-softening models. In addition to the Beremin model, a local stress based model in conjunction with Weibull distribution has also been proposed in [14] as a cleavage initiation indicator. Though these approaches have been able to capture the fracture toughness variability at and near lower shelf, an improved model consisting of both ductile and cleavage mode of crack growth is necessary to predict the entire DBT region accurately. In addition, the model should have the provision to incorporate more physical lower length scale models as in [15] and should be usable at engineering scales.
In the present work, a cohesive zone-based model has been proposed to analyze DBT in RPV steel. A unified model that incorporates both ductile damage and cleavage failure mechanisms through temperature and failure probability dependent parameters has been developed. The flow stress of the bulk material is varied to obtain the temperature dependent bulk material behavior. It is assumed that without cleavage, the cohesive law follows a traction-separation behavior of ductile-damage as described in [16].From the known flow-stress evolution at different temperatures separate ductile-damage traction-separation parameters can thus be obtained from a unit cell analysis. However depending on the temperature and failure probability, unloading in the cohesive law due to cleavage can start earlier, and can reduce the fracture toughness of the material. With the use of such a cohesive law, scatter in the
17
fracture toughness with temperature can be successfully obtained. The results from this methodology are compared with experiments and Master Curve reported in [12].
In this report, both approaches to modeling DBT have been investigated. The material parameters reported in [12] for German low alloy steel have been used. A rate dependent Gurson model for ductile damage and Beremin model to predict cleavage crack initiation has been used for the first approach. For the second approach, a correlation has been derived for unified traction separation law parameters at different temperatures. Fracture toughness predictions are compared with Master curve reported in [12].Presently ABAQUS FEM code is used to perform the simulations since the model is still under development.
2.2 Constitutive modeling of ductile to brittle transition of fracture2.2.1 2.2.1. Gurson and Beremin models
This approach has been reported extensively in the literature. In this approach, ductile crack growth is explicitly captured using the Gurson [9] or Rousselier model [8] and cleavage failure is predicted using the Beremin model [6] as a post processing after the simulations.
In the Gurson model for ductile damage the resulting crack growth happens through nucleation of voids, their subsequent growth, and coalescence. Enhancements proposed in [17] in which accelerated void coalescence once a critical void volume fraction is reached have also been considered in our present work. Following large deformation theory, the plastic component of rate of deformation tensor in the rate-dependent Gurson model is obtained from:
(1)
where the flow potential is represented by:
(2)
and the flow rate is obtained from equivalence of plastic power as:
(3)
In Equations 1-3, e is the Von Mises stress, h is the hydrostatic stress, m is the stress in the matrix, mis the viscoplastic strain in the matrix, f* is the modified void volume fraction and q1, q2, q3 are parameters. The viscoplastic strain in the matrix is evolved using a power law as:
(4)
18
where 0 is the reference strain rate and m is the flow exponent. m=0.005 has been considered in the present work to simulate rate independent behavior. The evolution of void is governed by:
(5)
where void growth rate is defined by:
(6)
and a strain controlled void nucleation rate is defined by:
(7)
where fN, sN and N are the statistical parameters describing the variations in the void nucleation sites.Accelerated coalescence of void after a critical void volume fraction is modeled using:
(8)
where fu=1/q1 and fc and ff are critical and final void volume fractions respectively.
In the Beremin model, it is assumed that unstable cleavage crack initiation happens at the weakest link. Based on the strength of the weakest link, a cumulative probability density Pf for failure is defined as:
(9)
where I is the maximum principal stress, g is some functional form defining the strength of an infinitesimal volume and Vo is the reference volume. Weibull distribution [7] has been assumed to describe the distribution of strength in the microstructure in [6] and is given as:
(10)
where u and m are parameters. Using the Weibull distribution, the probability of failure Pf can be described by:
19
(11)
where w is the Weibull stress and can be represented as:
(12)
In our present study, the experimental results for one-inch thick compact tension, 1T-CT, fracture toughness testing specimen of German low alloy steel reported in [12] have been used for comparison of simulation results with the experiments. The Weibull parameters are calibrated from fracture toughness data at temperature T=-100oC and are used in the present work. Also, an assumption similar to [12] is made i.e. Weibull parameters predicting cleavage failure are temperature independent. The calibrated Rousselier model parameters in [12] were taken for the Gurson model in the present work. For parameters q1, q2, and q3 in Equation 2 values of 1.5, 1, and 2.25 has been considered similar to [17]. Void nucleation parameters were also taken from [17] and were fN=0.04, sN=0.1 and N=0.3.
Plane strain FEM simulations for three different temperatures (T=-100oC, T=-60oC, and T=-20oC) were performed using the rate dependent Gurson model. The FEM mesh, boundary conditions and specimen dimensions are shown in Fig. 1.
20
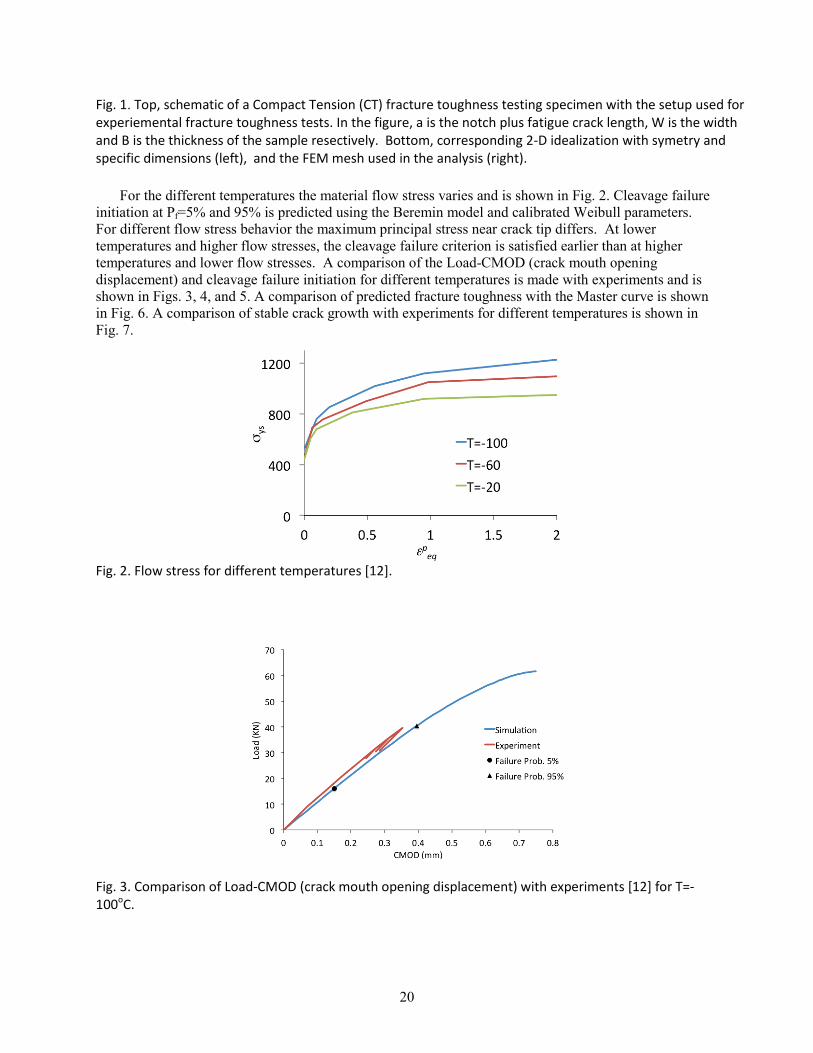
Fig. 1. Top, schematic of a Compact Tension (CT) fracture toughness testing specimen with the setup used for experiemental fracture toughness tests. In the figure, a is the notch plus fatigue crack length, W is the width and B is the thickness of the sample resectively. Bottom, corresponding 2-D idealization with symetry and specific dimensions (left), and the FEM mesh used in the analysis (right).
For the different temperatures the material flow stress varies and is shown in Fig. 2. Cleavage failure initiation at Pf=5% and 95% is predicted using the Beremin model and calibrated Weibull parameters. For different flow stress behavior the maximum principal stress near crack tip differs. At lower temperatures and higher flow stresses, the cleavage failure criterion is satisfied earlier than at higher temperatures and lower flow stresses. A comparison of the Load-CMOD (crack mouth opening displacement) and cleavage failure initiation for different temperatures is made with experiments and is shown in Figs. 3, 4, and 5. A comparison of predicted fracture toughness with the Master curve is shown in Fig. 6. A comparison of stable crack growth with experiments for different temperatures is shown inFig. 7.
Fig. 2. Flow stress for different temperatures [12].
Fig. 3. Comparison of Load-CMOD (crack mouth opening displacement) with experiments [12] for T=-100oC.
21
Fig. 4. Comparison of Load-CMOD with experiments [12] for T=-60oC.
Fig. 5. Comparison of Load-CMOD with experiments [12] for T=-20oC.
Fig. 6. Comparison of predicted fracture toughness with Master curve [12] for all temperatures.
22
The evolution of the Weibull stress w for different temperatures is shown in Fig. 8. As can be observed from the figure, the Weibull stress for Pf=95% at T=20oC (room temperature) never satisfies cleavage failure initiation criterion. Hence at room temperature ductile damage is the dominant mechanism for crack growth and is consistent with experimental observation.
Fig. 7. Stable crack growth for different temperatures compared with experiments [12].
Fig. 8: Evolution of Weibull stress for all temperatures.
As can be observed from the comparisons with the experiments, this approach is able to capture DBT with reasonable accuracy. The large difference with Master curve at higher temperature (T=-20oC) is due to the Gurson model which localizes damage evolution to a small region ahead of the crack tip (mesh dependency). Owing to such localized damage, higher stresses-state evolves near the crack tip andsatisfying the cleavage failure criterion earlier. Also larger stable crack growth prior to unstable failure can be observed (Fig. 7). These deficiencies in the model can be somehow mitigated using a mesh size independent non-local formulation.
23
2.2.1.1 Unified Cohesive Zone Model (CZM) for Ductile to Brittle Fracture TransitionFor a material undergoing ductile damage, the underlying traction separation law consists of an initial
steady state void growth and coalescence, followed by rapid coalescence and complete loss of strength once a critical void volume fraction is reached. The traction-separation law proposed in [16] has been used in the present work to represent ductile damage where the traction is related to the separation by
(13)
where 0 is the maximum stress and e, c, f are the separation distances when maximum stress is reached, at onset of damage (unloading) and final failure respectively. A schematic of the traction-separation law is shown in Fig. 9.
Fig. 9. Schematic of traction separation law for ductile damage.
As reported in [18], the global Load-CMOD behavior is nearly insensitive to the shape of the traction-separation law. Hence a constant maximum stress ( 0) during steady void coalescence has been assumed, as can be seen from Fig. 9. For the unified cohesive law developed in this work, it is assumed that:
For a given flow stress, at a given temperature, the shape of the traction separation law is fixed by the ductile damage
Depending on temperature and the failure probability the maximum stress at unloading ( max) and failure separation distance ( f) varies
The separation distance at onset of unloading ( c) determines the amount of ductile damage before the cleavage failure.
A schematic of the proposed unified traction separation law is shown in Fig. 10.
24
Fig. 10: Schematic of unified traction separation law.
The traction separation law for cleavage failure follows a similar law as shown in Equation 13 but without the hold at 0 and is given by:
(14)
where max is the maximum stress ( max < 0) and c, f are the separation distances at onset of damage (unloading) and final failure respectively.
In order to improve the stability of FEM simulation using CZM, particularly due to cleavage failure, an artificial viscosity term has been added to the basic traction separation law following [19] as:
(15)where is the viscosity parameter. In [19], an exponential cohesive law [20] with elastic response for bulk material has been used to describe the methodology. In the present work, the formulation has been extended to Equations 13 and 14 with Von Mises plasticity for bulk material. Since the viscosity term adds artificial dissipation to improve convergence behavior under unstable crack growth, it can affect the global response significantly. A parametric study has been performed to estimate the sensitivity of global Load-CMOD to viscosity parameter. The CT specimen shown in has been used for this study. The cohesive parameters considered are c = 0.0001 mm, f = 0.0005 mm and max = 1810 MPa. Five different viscosity parameters are used and the corresponding modified traction-separation behavior for d /dt = 0.001 mm/s and t=0.001s is shown in Fig. 11(a). The corresponding Load-CMOD is shown in Fig. 11(b). The simulation didn’t converge without viscosity ( = 0).
25
(a) (b) Fig. 11. Sensitivity studies for different values of viscosity parameter: (a) Traction separation (b) Load-CMOD.
As can be observed from the figure, the Load-CMOD and fracture toughness have a strong dependence on the viscosity parameter. A higher value of viscosity parameter though allows larger time steps, over estimates the fracture toughness significantly. Hence a viscosity parameter =1 has been considered in the present work.
The cohesive zone parameters for ductile-damage are obtained from plane strain unit cell analysis with rate dependent Gurson model as the material behavior. For the unit cell analysis, a crack tip triaxiality of 3 is assumed and the stress ratio = 11/ 22 is evaluated from
(16)
where H is the triaxiality. A strain rate of 0.001 /s has been used to simulate quasi-static behavior. The Gurson model parameters described in the previous section has been used. From the unit-cell analysis the
- response along the primary loading direction (22) for T=20oC (room temperature) and the corresponding fit is obtained as shown in Fig. 12. To use the non-dimensional traction separation law parameters in FEM simulations, a cell height h needs to be prescribed. Following, h=0.1 mm has been considered which is based on the microstructure. Plane strain FEM simulation is performed for the CT specimen shown in Fig. 1. Comparison of Load-CMOD with experiment is shown in Fig. 13. It is to be noted that the cell height used in unit cell simulations is independent of the mesh dimensions.
Fig. 12. - evolution along primary loading direction (22) obtained from unit cell analysis and
26
corresponding traction-separation law for T=20oC.
Fig. 13: Comparison of Load-CMOD between CZM based FE simulation and experiment for T=20oC.
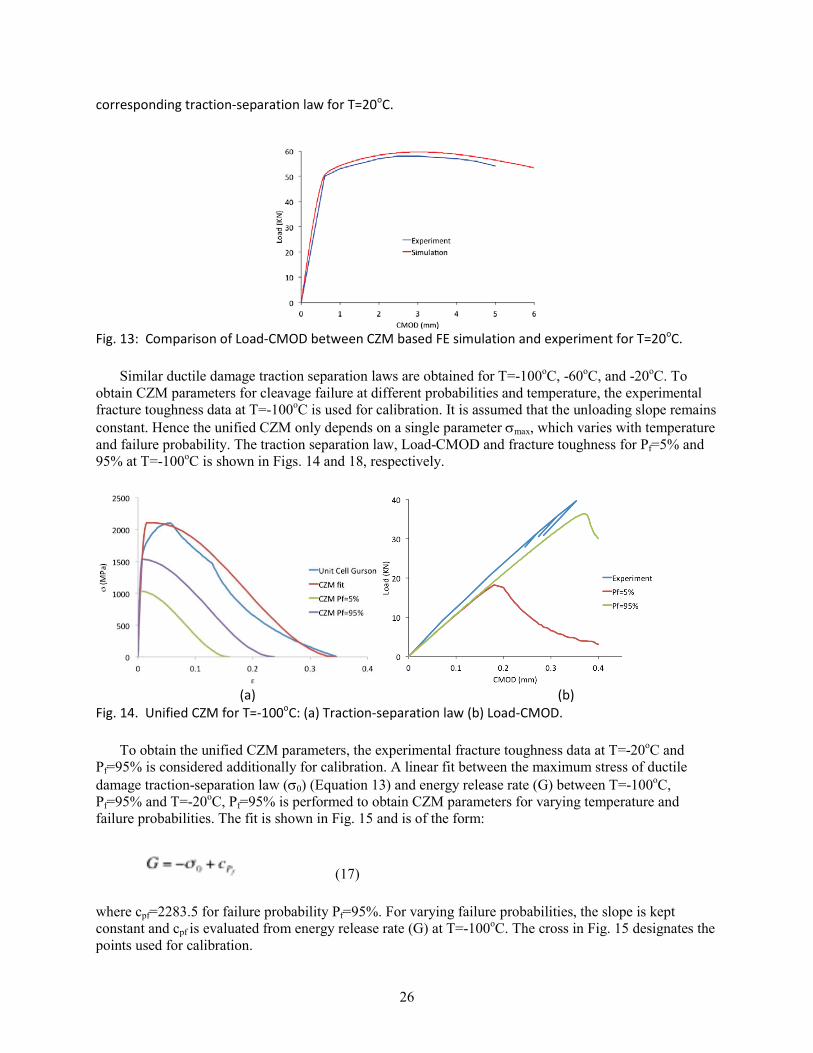
Similar ductile damage traction separation laws are obtained for T=-100oC, -60oC, and -20oC. To obtain CZM parameters for cleavage failure at different probabilities and temperature, the experimental fracture toughness data at T=-100oC is used for calibration. It is assumed that the unloading slope remains constant. Hence the unified CZM only depends on a single parameter max, which varies with temperature and failure probability. The traction separation law, Load-CMOD and fracture toughness for Pf=5% and 95% at T=-100oC is shown in Figs. 14 and 18, respectively.
(a) (b)
Fig. 14. Unified CZM for T=-100oC: (a) Traction-separation law (b) Load-CMOD.
To obtain the unified CZM parameters, the experimental fracture toughness data at T=-20oC and Pf=95% is considered additionally for calibration. A linear fit between the maximum stress of ductile damage traction-separation law ( 0) (Equation 13) and energy release rate (G) between T=-100oC, Pf=95% and T=-20oC, Pf=95% is performed to obtain CZM parameters for varying temperature and failure probabilities. The fit is shown in Fig. 15 and is of the form:
(17)
where cpf=2283.5 for failure probability Pf=95%. For varying failure probabilities, the slope is kept constant and cpf is evaluated from energy release rate (G) at T=-100oC. The cross in Fig. 15 designates the points used for calibration.
27
Fig. 15: Unified CZM parameters for varying temperature and failure probability. Cross denotes calibration points.
The traction-separation law for the unified CZM and Load-CMOD for T=-20oC and -60oC are shown in Figs. 16 and 17. The comparison of the results obtained from the fracture simulations with the experimentally determined Master curve is shown in Fig. 18.
(a) (b)
Fig.16: Unified CZM for T=-20oC: (a) Traction-separation law (b) Load-CMOD.
(a) (b)
28
Fig. 17. Unified CZM for T=-60oC: (a) Traction-separation law (b) Load-CMOD.
Fig. 18. Comparison of fracture toughness between unified CZM based FEA and Master Curve.
Comparison of stable crack growth with experiment is shown in Fig. 19. Close agreement can be seen for fracture toughness and stable crack growth predictions between the unified CZM and experiments.
Fig. 19: Comparison of stable crack growth between unified CZM based FEA and experiment.
2.3 ConclusionIn this report different approaches to predict DBT in RPV steels have been investigated. The first
approach captures stable crack growth due to ductile damage using Gurson model. The onset of unstable cleavage failure is predicted using the Beremin model. Reasonable agreement with experiments for 1T-CT specimen can be seen. The limitation of this approach to accommodate lower length scale phenomenon and its usability at engineering scale motivated the development of a unified CZM to predict DBT. To obtain CZM parameters for all temperatures and failure probabilities, a correlation has been
29
derived. The predictions from this approach show good agreement with experimental fracture toughnessand stable crack growth.
2.4 References[1] J. F. Knott, "Micromechanisms of fracture and the fracture toughness of engineering alloys," Fracture, vol. 1, pp. 61-91, 1977.
[2] C. J. Jr. McMahon and M. Cohen, "Initiation of cleavage in polycrystalline iron," Acta. Metal., vol. 13, pp. 591-604, 1965.
[3] E. Smith, "The nucleation and growth of cleavage microcracks in mild steel," in Proceedings of the Conference on the Physical Basis of Yield and Fracture, London, 36-46, p. 1966.
[4] R. O. Ritchie, J. F. Knott, and J. R. Rice, "On the relationship between critical tensile stress and fracture toughness in mild steel," J. Mech. Phys. Solids, vol. 21, pp. 395-410, 1973.
[5] D. A. Curry and J. F. Knott, "Effect of microstructure on cleavage fracture toughness in mild steel," Metal Science, vol. 13, pp. 341-345, 1979.
[6] F. M. Beremin, "A local criterion for cleavage fracture of a nuclear pressure vessel steel," Met. Trans. A, vol. 14A, pp. 2277-2287, 1983.
[7] W. Weibull, "A statistical distribution function of wide applicability," Jour. App. Mech., vol. 18, pp. 293-297, 1953.
[8] G. Rousselier, "Ductile fracture models and their potential in local approach of fracture," Nuc. Engg. Des., vol. 105, pp. 97-111, 1987.
[9] A. L. Gurson, "Continuum theory of ductile rupture by void nucleation and growth: Part I-yield criteria and flow rules for porous ductile media," Trans. ASME, Jour. Engg. Mat., vol. 99, pp. 2-15, 1977.
[10] B. Tanguy, J. Besson, R. Piques, and A. Pineau, "Ductile to brittle transition of an A508 steel characterized by Charpy impact test. Part I: experimental results," Engg, Frac. Mech., vol. 72, pp. 49-72,2005.
[11] B. Tanguy, J. Besson, R. Piques, and A. Pineau, "Ductile to brittle transition of an A508 steel characterized by Charpy impact test. Part II: modeling of the Charpy transition curve," Engg. Frac. Mech., vol. 72, pp. 413-434, 2005.
[12] M. K. Samal, M. Seidenfuss, E. Roos, B. K. Dutta, and H. S. Kushwaha, "Experimental and numerical investigation of ductile-to-brittle transition in a pressure vessel steel," Mat. Sc. Engg. A, vol. 496, pp. 25-35, 2008.
[13] M. K. Samal, M. Seidenfuss, E. Roos, B. K., Dutta, and H. S. Kushwaha, "Finite element formulation of a new nonlocal damage model," Finite Elem. Ana. Des., vol. 44, pp. 358-371, 2008.
[14] B. Z. Margolin, V. A. Shvetsova, A. G. Gulenko, and V. I. Kostylev, "Application of a new cleavage fracture criterion for fracture toughness prediction for RPV steels," Fatigue Fract. Engg. Mat. Struct., vol. 29, pp. 697-713, 2006.
[15] L. Vincent, M. Libert, B. Marini, and C. Rey, "Towards a modelling of RPV steel brittle fracture using crystal plasticity computations on polycrystalline aggregates," Jour. Nuc. Mat., vol. 406, pp. 91-96,2010.
[16] I. Scheider and W. Brocks, "Simulation of cup-cone fracture using the cohesive model," Engg. Frac. Mech., vol. 70, pp. 1943-61, 2003.
30
[17] T. L. Anderson, Fracture Mechanics, 2nd ed. New York, USA: CRC Press, 1994.
[18] M. Anvari, I. Scheider, and C. Thaulow, "Simulation of dynamic ductile crack growth using strain rate and triaxiality-dependent cohesive elements," Engg. Frac. Mech., vol. 73, pp. 2210-2228, 2006.
[19] Y. F. Gao and A. F. Bower, "A simple technique for avoiding convergence problems in finite element simulations of crack nucleation and growth on cohesive interfaces," Modelling Simul. Mat. Sci. Engg., vol. 12, pp. 453-463, 2004.[20] V. Tvergaard and A. Needleman, "Analysis of the cup-cone fracture in a round tensile bar," Acta. metall., vol. 32, no. 1, pp. 157-169, 1984.[21] V. Tvergaard and J. W. Hutchinson, "The relation between crack growth resitance and fracture process parameters in elastic-plastic solids," J. Mech. Phys. Solids, vol. 40, pp. 1377-1397, 1992.
CONCLUDING REMARKSDuring FY-2013 we have made progress in two areas as were detailed in two separate sections earlier
in this report.
In section-I, an Atomistic Kinetic Monte Carlo (AKMC) model has been developed for Fe-Cu-Mn-Ni-Si system, which was the primary objective for FY2013. Furthermore, the effect of neutron radiation was incorporated by considering the interaction between the alloying elements and radiation-induced lattice defects. Focusing on Cu, we used molecular dynamics, MD, simulations to elucidate their interactions with several lattice defects including point-defects, dislocations, voids and defect loops. It was found that the interaction can be classified into long-range interaction associated with the stress-fields from dislocations and loops, and short-range interaction with point defects and voids. The long-range interaction can be described well using linear-elastic theory. The results on the interaction energies are in good agreement with the precipitation morphology predicted by Metropolis Monte Carlo (MMC) simulations. Based on the MD results and literature data, an AKMC model was developed at INL with the short-range interactions represented by pair-wise bonds between nearest neighbors and the long-range interaction by linear-elastic theory. Some preliminary AKMC results showed that the introducing of alloying elements and lattice defect has important effects on the formation of Cu-rich-precipitates which has not been taken account previously in the available literature.
In section-II, two different approaches have been pursued to estimate ductile brittle fracture transition (DBT) and the resulting master curve. The first approach has been reported extensively in the literature. Although first approach has been successful to capture DBT; however, the effect of microstructure on crack growth cannot be incorporated using this method. Also, the usability of this method at engineering scale is somewhat restricted where the material properties and stress-states vary considerably. Moreover, it is computationally inefficient, requiring extensive post-processing after the simulations. To alleviate these issues, a cohesive zone based approach has been proposed in the present work. A unified constitutive model capturing both ductile and brittle modes of crack growth has been developed and the results obtained from the simulations were validated with the available data from the literature. The model enables the simulation of explicit crack growth at both stable and unstable regimes of fracture. Also it provides the ability to incorporate more physical lower scale models based on the underlyingmicrostructures. Such a multiscale approach will significantly improve the predictive capabilities of the current models, which are still largely empirical.
31
PUBLICATIONS AND PRESENTATIONS:Journal publication
1) Preferential segregation of Cu solute at lattice defects in bcc Fe: An atomistic study, to be submitted.
2) A unified cohesive zone model for ductile to brittle transition in reactor pressure vessel steels, to be submitted.
Conference presentation:
1) Effect of radiation-induced lattice defects on precipitate formation in dilute Fe-Cu-Ni alloy, TMS2014, San Diego, CA.
2) Modeling the Ductile Brittle Fracture Transition in Reactor Pressure Vessel Steels using a Cohesive Zone Model based approach, SMINS-3 workshop 2013, Idaho Falls, ID.